|
|
|
- Muriel Perry
- 6 years ago
- Views:
Transcription
1
2

3
4
5
6
7
8
9

10

11
12
13
14

15

16
17

18
19
20

21

22
23
24

25

26

27

28

29

30

31

32
33
34

35
36 B 0 0
, while more than one third (36.7%) were female.")
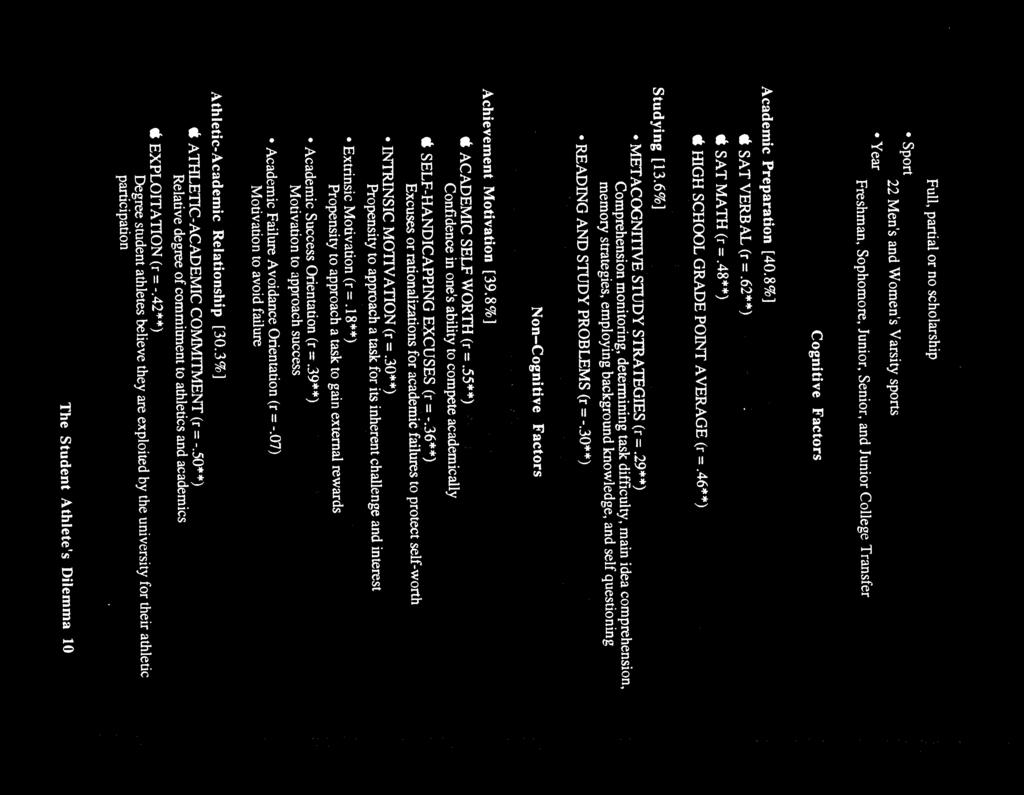
37 Method Subjects Subjects of this study were 361 out of the approximately 800 intercollegiate student athletes enrolled at the University of California, at Berkeley during the academic year. Almost two-thirds of those surveyed were male (63.3%), while more than one third (36.7%) were female. The male student athletes participated in eleven sports, inclusive of football, basketball, baseball, track and field, cross country, soccer, swimming, water poio, tennis, gymnastics, and golf. The female student athletes participated in eleven sports, inclusive of basketball, softball, track and field, volleyball, cross country, soccer, swimming, tennis, crew, gymnastics and field hockey. 20.8% of the student athletes participated in revenue sports. defined here as men s football and basketball, while 79.2% participated in non-revenue sports, defmed here as all other teams excluding men s football and basketball All of the revenue athletes were male. Of the nonrevenue athletes, 53.5% were male while 46.5% were female. 30.5% of the subjects were freshmen, 26.3% sophomores, 26.3% juniors, and 16.8% were seniors at the time of the study. 8.4% of the sample were junior college transfers. Procedures Two separate surveys were administered to each team. One survey focused on attitudes concerning academics, while the other focused on attitudes toward athletics. Individual coaches were contacted and a team meeting was scheduled for the administration of these two surveys by one of the first two authors of this study. It was emphasized that these meetings should not interfere with either the team s regular training or the individual team members academic schedules. In several cases, the student athletes surveyed completed both surveys in one sitting, while other teams completed the surveys in two separate sittings. This report will deal with the academic survey only. Student Athlete Academic Survey The Student Athlete Academic Survey (SAAS) consisted of 300 Likert scale items which measure background, as well as the cognitive and non-cognitive factors affecting the dual achievement domains of intercollegiate academics and athletics. Background factors included demographic and athletic status. The cognitive factors included academic preparation, study strategies and study problems. The non-cognitive factors included achievement motivation and the academic-athletic relationship. These factors, and the scales which comprise them are described below: the capitalized name in brackets is the label used in the tables. Subjects were asked to rate Appendix A Method 1
![the items on a five point Likert scale in which 1 indicated not very true of me and 5 corresponded to very true of me, Background Factors Demographic Status Student athlete gender [GENDER] Student](/docs-images/77/75296653/images/38-1.jpg "athlete ethnicity [ETHNICITY] Subjects designated their ethnic background from a set of the following choices: (a> African-Arnejican; (b) Mexican-American/Chicano; (c) Other Spanish-American/Latino;")
38 the items on a five point Likert scale in which 1 indicated not very true of me and 5 corresponded to very true of me, Background Factors Demographic Status Student athlete gender [GENDER] Student athlete ethnicity [ETHNICITY] Subjects designated their ethnic background from a set of the following choices: (a> African-Arnejican; (b) Mexican-American/Chicano; (c) Other Spanish-American/Latino; (d) American Indian/Alaskan Native/Pacific Islander; (e) Filipino-American; (I) Chinese-American; (g) Japanese-American; (h) Other Asian; (i) White/Caucasian; or (j) Other. The ethnic distribution of the student athletes in the survey was Caucasian (68.2%), African-American (14.3%) and Other (17.5%). In the Other minority group, Asian-Americans (5.4%) and Chicano/Latino (5.2%) were the two largest groups. The remainder of the other minorities was divided among four groups (Pacific Islanders; Native American/Alaska; Filipino; Pakistan/Indian). The ethnicity variable was recoded into the three categories of African-American (AF-AM), Caucasian, and Other. Most of the analyses used the dichotomous variable African-American and Non African-American (Caucasian plus Other). Social status [SOCIAL STATUS] Three indicators of social status were included in the survey: parents (mother s and father s) educational level and student s reported social class. For parents educational level, subjects were asked to report both their mother s and father s level of education from a set of five categories. These included the following options: (a) None/some high school; (b) High school diploma; (c) Some college; (d) College B.A. degree; or (e) Graduate degree (M.B.A. Ph.D., M.D.). Additionally, subjects were asked to identify their family s social class from a set of the following five categories: (a) poor; (b) working class; (c) middle class; (d) upper-middle class; and (e) upper class. Mother s education was employed as the measure of social status in this study (See results). Year [YEAR] Self reported year in school was designated by one of the following choices: (a) Freshman; (b)sophomore; (c) Junior; (d) Senior; or (e) Junior College transfer. Appendix A Method 2
39 Athletic Status Degree of Recruitment [RECRUIT] Sub ject.s were asked to indicate the degree to which they were recruited. This variable was assessed by a five point Likert scale ranging from (a) Not at all recruited to (e) Heavily recruited. Sport [SPORT] Respondents indicated the intercollegiate sport in which they participate. Fourteen choices were provided. These included: (a) Mens football; (h) Men s/women s basketball; (c) Men s/women s crew; (d) Men s/women s cross country; (e) Men s baseballfwomen s softball; (f) Men s/women s track and field; (g) Men s/women s gymnastics; (h) Men s/women s soccer; (i) Men s/women s swimming; (j) Men s/women s tennis; (k) Women s field hockey; (1) Men s golf; (m) Women s volleyball; and (n) Men s water polo. Scholarship [SCHOLARSHIP] Students were asked to report whether they were currently receiving a (a) full athletic scholarship; (b) partial athletic scholarship; or (c) no athletic scholarship. Revenue Sport Status [REVENUE] On the basis of their sport, subjects were assigned to a dichotomous revenue/non-revenue category. Revenue sports were defined in this study as men s football and basketball. These sports are traditionally assumed to produce a surplus in revenue. Students participating on these teams were coded as revenue student athletes. All others were considered non- revenue student athletes. Cognitive Factors Academic Preparation High School Grade Point Average [HSGPAJ Students self reported their high school grade point average. Scholastic Aptitude Test, Verbal [SATV] and Mathematical [SATM] Students Verbal and Mathematical Scholastic Aptitude Test scores were obtained from official admissions records. In this sample, SATV had a mean of and a standard deviation of Scores ranged from 28() to 780. The SATM had a mean of and a standard deviation of Scores ranged from 320 to 800. Appendix A Method 3
![Cumulative Grade Point Average at Berkeley [UCGPAJ Students cumulative grade point average[ucgpa] was obtained from official academic records at the end of the semester following (Spring 1994) the](/docs-images/77/75296653/images/40-1.jpg "administration of the survey. The sample had a mean UCGPA of 2.86 and a standard deviation of.50.")
40 Cumulative Grade Point Average at Berkeley [UCGPAJ Students cumulative grade point average[ucgpa] was obtained from official academic records at the end of the semester following (Spring 1994) the administration of the survey. The sample had a mean UCGPA of 2.86 and a standard deviation of.50. Scores ranged from 1.5 to 4.0. Study Metacognitive Study Strategies [ST STRAT] An eleven item Lilcert scale measured several- metacognitive study strategies, including comprehension monitoring, determining task difficulty, main idea comprehension, memory strategies, employing background knowledge, and self questioning. The scale included the following items: (a) I spend more time on the difficult course material when studying for a test; (b) I study differently for different types of exams (essay, multiple choice, etc.); (c) I make up questions to help focus my reading; (d) I try to predict the questions on my exams while I study; (e) When I read I look for the important ideas; (f) When I read I try to focus mainly on facts and defmitions; (g) After studying a topic, I ask myself whether I understood it before going on to something else; (h) I make a summary or outline after a reading assignment; (i) I often try to memorize what I am reading by going over and over it; (j) While studying, I try to relate new information to what I already know; and (k) While studying, I try to put things into my own words. Chronbach s Alpha for this scale was.58. Study Problems [ST PROB] This nine item Likert scale assessed reading and studying problems. The scale included the following items: (a) I often read a chapter and afterwards don t know what I have read; (b) I have trouble taking good class notes; (c) I read too slowly; (d) I find too many words I don t understand in my readings; (e) I read too fast and miss important points; (f) I fmd the reading in my courses too difficult; (g) I sometimes think I understood something, but find out I didn t when I take an exam; and (h) I have trouble identifying the most important ideas in my reading; (i) I do not manage my time wisely. Chronbach s Alpha for this scale was.61. Non Cognitive Factors Achievement Motivation Need Achievement [APPROACH & AVOID] The motivational theory of need achievement (Atkinson, 1957, 1964) assumes that individuals possess two learned drives the motive to approach success and the motive to avoid Appendix A Method 4
41 Achievement was measured by the ApproachlAvoidance Achievement Questionnaire (AAAQ) Cuvington & Ornelich. 1991). The AAAQ questionnaire consisted of two scales. The first scale. failure and attempt to avoid the resultant feelings of shame by withdrawing or not trying. Need Appendix A Method 5 (h I prefer course material that really challenges me so I can learn new things. (c) When I can. I individual s intrinsic goal orientation in the academic domain. These four MSLQ items were: (a) The most satisfying thing in a course is trying to understand the content as thoroughly as possible: the Motivated Strategies for Learning Questionnaire (Pintrich. 1991) were selected to measure an Intrinsic motivation is defined as an individuals propensity to approach a task for its involve increising existing abilities and developing new skills. Four Likert scale items taken from inherent challenge and interest. This orientation emphasizes mastery and learning goals which Intrinsic Motivation [INTRINSIC] competitive failure (Covington, 1992). Academic Self-worth was measured by a six-item scale Self-worth theory posits that achievement motivation is best understood in terms of attempts by individuals to maintain a positive self-image of competency, particularly when risking composed of three items from the Rosenberg Self Esteem measure (Rosenberg, 1965) and three academically here at UC Berkeley?; (e) Compared to the average UC Berkeley student, how would Berkeley? Chronbach s Alpha for this scale was.90 items specific to academic achievement at Berkeley. The three items from the Rosenberg scale you rate your overall academic ability?; and (f) Do you think you deserved to get into UC much to be proud of as a student; and (c) On the whole I am satisfied with myself as a student. The three items developed for this study were (d) Do you think you have the ability to succeed were: (a) All in all, I am inclined to feel that I am a failure in school; (b) I feel that I do not have Academic Self-Worth [ACAD SELF-WORTH] standards; (b) Fears about failure; (c) Doubts about one s ability; and (d) Disposition toward selfcriticism as opposed to self-reward. Chronbach s Alpha for this scale was.77. the academic domain [AVOID]. It is composed of four subscales: (a) Unrealistic achievement The second scale, composed of thirteen items, reflects a general tendency to avoid failure in confidence. Chronbach s Alpha for this scale was.73. [APPROACH] in the academic context. The approach scale consisted of five subscales: (a) Risktaking propensity; (h) Realistic goal setting: (c) lntnnsic engagement: (d) Persistence, and (e) Self composed of twenty one Liken scale items, reflects the tendency to approach success propels them to approach further successes. Conversely, individuals high in failure avoidance tiar failure. Individuals with a heightened drive to achieve success anticipate pnde. an emotion that

42 choose assignments that I can learn from even if they don t guarantee a good grade; and (d) I prefer course material that arouses my curiosity, even if it is difficult to learn. Chronbach s Alpha for this scale was.60. Extrinsic Motivation [EXTRINSIC] Extrinsic motivation is defined as an individual s propensity to approach a task to gain external rewards. Four Likert scale items taken from the Motivated Strategies for Learning Questionnaire (Pintrich, 1991) were selected to measure an individual s extrinsic goal orientation in the academic achievement setting.- The four MSLQ items were: (a) My main concern in my classes is getting good grades; (b) I want to get better grades in school than most other students get; (c) I want to do well in school because it is important to show my ability to others; and (d) Getting good grades is the most satisfying thing in school for me right now. Chronbach s Alpha for this scale was.64. Self-Handicapping Excuses [SELF-HAND EX] Self-handicapping excuses are maladaptive motivational responses to challenging achievement tasks, which serve to protect an individual s perceived low self-worth in a particular achievement domain. A six item Likert scale measured the tendency to report excuses for lowered levels of academic effort and performance. The six items were: (a) If I worked harder I would get better grades; (b) I don t have enough time to study because my sport takes up so much time; (c) I m so disorganized that I don t get all my work done; (d) My social life interferes with my studying; (e) If my courses were more interesting, I would get better grades; and (0 I would do much better on tests if I didn t get so nervous. Chronbach s Alpha for this scale was.60 Academic-Athletic Relationship Athletic-Academic Commitment [ATH-AC COM] A four item Likert scale measured the relative degree of commitment to athletics and academics. The items included: (a> I study only hard enough to stay eligible to play my sport; (b) I care more about sports than school; (c) I put more energy into sports now because I know I ve got the rest of my life to get a college degree; and (d) It is more important for me to succeed in sports than to do well in school. The higher the score on this variable, the stronger the commitment to athletics. Chronbach s Alpha for this scale was.79. Appendix A Method 6
43 Exploitation [EXPLOIT] A seven item Liken scale measured the degree to which student athletes believe they are exploited by the university for their athletic participation. The scale included the following items: (a) Sometimes I feel that I am being taken advantage of as an athlete; (b) I feel that the University cares more about me as an athlete than as a student; (c) Sometimes I feel that I am the property of the University; (d) I feel that I give more to the University than it gives back to me; (e) The University makes too much money out of its athletes; who see very little of it; (f I feel that I have been given a lot of false promises about my athletic career here at CAL; and (g) It seems that younger recruits /players receive more attention and support than do the older players. Chronbach s Alpha for this scale was.75. Appendix A Method 7
44 Appendix B Complete Description of Results

45 The major statistical technique employed in this study was regression analysis. It was Data Analysis Appendix B Results 1 Table 1 presents the correlations of all variables in the study with UCGPA. With the All Variables with UCGPA exception of AVOID, all variables had statistically significant correlations with UCGPA. The highest correlations (over.40) were found for the three academic preparation variables, two WORTH. athletic-academic relationship variables and for one achievement motivation variable. Three variables had correlations equal to or greater than.50: SATV, ATh-AC COM and ACAD SELF- for all subjects. The sample size for the statistical analyses varied from 178 to 361 subjects. The missing data was due to the inability to obtain the UC grade point averages and academic preparation data the prediction of UCGPA when background and academic preparation variables were controlled. separate regression analyses of each background factor [Demographic and Athletic Status] with supplemented by analysis of variance and t-tests where appropriate. The dependent variable was UCGPA were conducted to determine the overall predictive ability of the factor and the cumulative grade point average at Berkeley [UCGPAJ. The following procedure was used. First, contribution of each variable in the factor to that prediction. This process was repeated for each cognitive [Academic Preparation, Study] and non-cognitive [Achievement Motivation and Athletic- Academic Relations] factor. For each of these factors, a second regression analysis was conducted which included those background and academic preparation variables were significant predictors of UCGPA. This analysis showed which variables within a factor made independent contributions to When a variable makes an independent contribution to predicting the dependent variable, this means that when the other variables in the analysis are taken into account or controlled, this variable continues to add predictive power. Results
 rkuach AVOID EXIRIJNSIC 1P4 IKIINS& SELF-HAND EX ACAD")
46 Table 1 Correlations: All Variables with UCGPA Variables UCGPA DEMOGRAPHIC GENDER SOCIAL STATUS -. ETHNICITY 19** ATHLETIC STATUS KbLKUII SCHOLARSHIP REVENUE ACAD PREPARATION SAW SATM HSGFA STUDY STUDY STRAT STUDY PROB ACH MOTIVATION A) rkuach AVOID EXIRIJNSIC 1P4 IKIINS& SELF-HAND EX ACAD SELF-WORTH.3l**,24** -.2ô.62** 48.4ö.29** -.3O 39** ** 54 ATH-ACAD REL ATH-ACCOM EXPLOIT ps.o p.o1 Background Factors Demographic Status The demographic variables included GENDER, ETHNICITY, and SOCIAL STATUS. When UCGPA was regressed on the three demographic variables (see Table 2), GENDER, SOCIAL STATUS and ETHNICITY (African-American vs. Caucasian plus Other) were statistically significant predictors of UCGPA. GENDER and SOCIAL STATUS were positively related while ETHNICITY was negatively related. GENDER and SOCIAL STATUS were better predictors of UCGPA than ETHNICITY. Males, students of lower social status, and African Appendix B Results 2

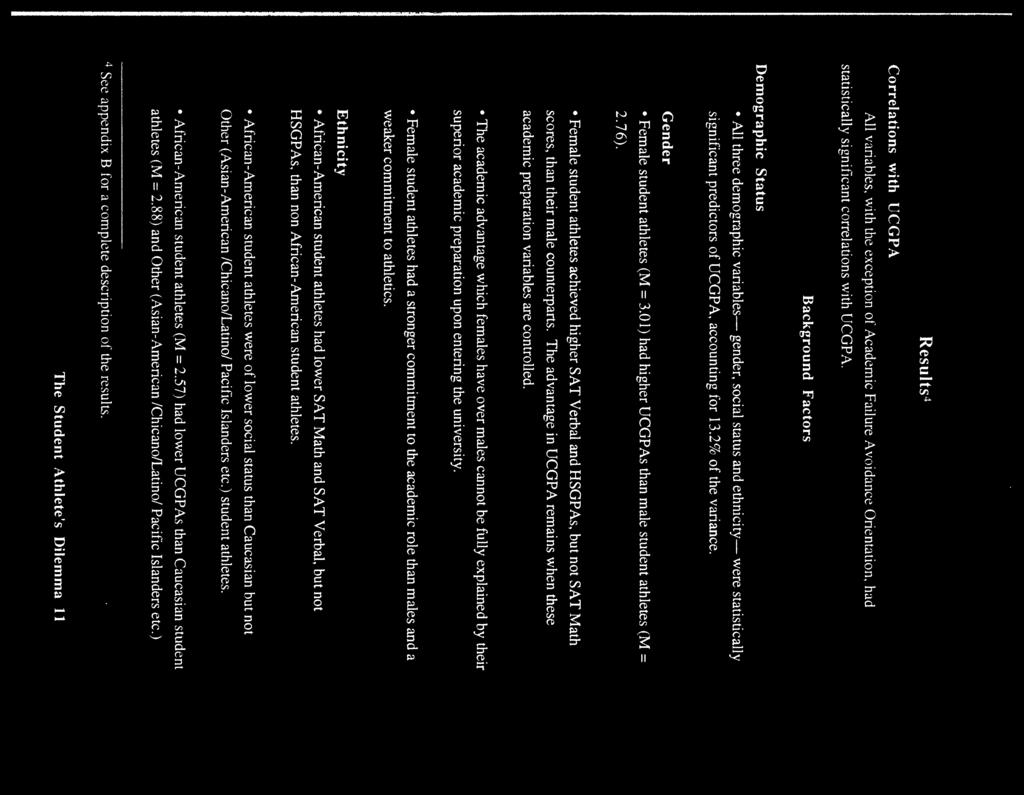
47 American student athletes had lower UCGPAs than females, students of higher social status, and non African-American student athletes. The combined demographic variables showed a multiple R of.363, which accounted for 13.2% of the vihance in UCGPA. Table 2 Regression Analysis: UCGPA on Demographic Variables Multiple R =.363 R2=.132 N = 289 Variables Coeff. r GENDER.22**.25** I SOCIAL STATUS.lO**.23** ETHNICITY -.25 * * -. l9*j 05 **p.o *p. 1 Gender As Table 3 illustrates, female student athletes had statistically significantly higher UCGPAs than males. Females also had statistically significantly higher SATV and HSGPA scores. There were no statistically significant differences in SATM scores. When subjects Verbal and Math SAT and HSGPA were controlled, females still showed statistically significantly higher UCGPAs (ANCOVA: F( 1,184) = 24.01, p.01). This suggests that the academic advantage which females have over males cannot be fully explained by their superior academic preparation upon entering the university. Table 3 T-Tests: Academic Preparation Variables by Gender Gender Variables Male Female M M df t UCGPA l** SATV ll.74** SATM HSGPA l** **p, *p. 01 When males and females were compared on the other variables in this study, t-tests showed some statistically significant differences by gender. Males were higher on ATH-AC COM [t(232) = -3.88, p.01], EXPLOIT [t(228) = -4.18, p.01], and SELF-HAND EX [t(35l) = , p.011. Male student athletes were more conunitted to the athletic role, felt more exploited, and were more prone to use excuses for their academic shortcomings. Females, on the other hand, Appendix B Results 3

48 their male counterparts. may help explain the superior academic performance demonstrated by female student athletes over Appendix B Results 4 When African-American student athletes were compared to non African-American student athletes (CAUCASIAN plus OTHER combined) on the other variables included in this study. there were few statistically significant differences. However, African-American student athletes do were no statistically significant differences in athletic role commitment [ATH-AC COM: t(23 1) =.10, p>.05), confident of their ability to become professional athletes [PRO: t(235) = 2.48, p.01]. There report greater belief they were being exploited [EXPLOIT: t(228) = 3.58, p.01]. They also report that they were more highly recruited [RECRUIT: t(355) = i.97,p.05] and feel more 05 **p.ol *p. CAUCASIAN - SOCIAL STATUS 3,77** ** UCGPA ** ** HSGPA Ethnicity OTHER SATV ** ** Variables M M M F SATM ** l0.02** AF-AM ANOVA: Achievement by Ethnicity Table 4 Table 4 shows that the mean UCGPA for Caucasians was 2.88, for Other 2.94, and for African-Americans African-American student athletes had statistically significant lower than the other two groups but the difference was not statistically significant (p=.o7). There was no statistically differences between the Caucasian and Other student athletes on UCGPA, SATM and SATV. There were statistically significant differences in social status between Caucasian and both the African-American and Other student athletes. Caucasians were of higher social status than the UCGPAs than the other two groups. African-Americans also had statistically significantly lower SATM and SATV scores. For HSGPA, African-Americans reported lower grade point averages African-American and Other student athletes. Ethnicity were less committed to the athletic role, expressed less feelings of exploitation, and were less prone to use excuses for academic shortcomings. These results suggest that non-cognitive factors
 = 1.65, p = nsj. Table 5 UCGPA: Revenue by Ethnicity AF-AM NON AF-AM REVENUE 2.51 2.56 NON REVENUE 2.63 2.93* *p. 05 **p.")
49 When ethnicity differences in UCGPA were examined by revenue status (see Table 5), the differences remained statistically significant for non-revenue athletes [t(244) = , p S.05] but disappeared for revenue student athletes [t(45) = 1.65, p = nsj. Table 5 UCGPA: Revenue by Ethnicity AF-AM NON AF-AM REVENUE NON REVENUE * *p. 05 **p.ol The powerful influence of revenue status is supported by similar findings on the variable EXPLOIT and the possibility of becoming a professional athlete (PRO). The finding that African- American student athletes reported stronger beliefs that they were being exploited and a stronger belief in the possibility of a professional career than non African-American student athletes becomes non significant when African-American student athletes were compared to non African- American student athletes within the revenue sports [EXPLOIT: t(36) =.243, p = ns] ; [PRO: t(40) = 1 34, p= ns} These findings suggest that the difference between African-American and non African-American student athletes is more a function of revenue status than ethnicity. Social Status All three indicators of social status were statistically significantly correlated with UCGPA (see Table 6). When UCGPA was regressed on the social status variables, they produced a multiple R of.253, which accounted for 6.4% of the variance. However, only mother s education had a statistically significant relationship to UCGPA. In the remainder of this report, therefore, mother s education will be used as the social status measure. Table 6 Regression Analysis: UCGPA on Social Status Variables Multiple R =.253 R2=.064 N = 289 IVanables Coeff r Mothers Education 09** 23** LFather s Education.04 ISES.02.12* * ** p =5.05 p =.01 Appendix B Results 5
, SATM (r =.")
50 Appendix B Results 6 Table 7 *p. HSGPA (r =.22). These findings suggest that the higher the student s social status, the greater - 06 Athletic Status Year STATUS and the academic preparation variables of SATV (r =.34**), SATM (r =.24**), and 05 **p,ol REVENUE 35** RECRUIT.l2** SCHOLARSHIP - Variables Coeff. r Multiple R =.386 R2=.149 N = 291 Regression Analysis: UCGPA on Athletic Status Variables The athletic status variables included degree of athletic recruitment to the university [RECRUIT], type of sport played [SPORT], whether the sport is revenue-producing [REVENUE], and whether the student-athlete received some form of athletic scholarship negatively correlated with UCGPA (See Table 7). The more the student athlete was recruited to the [SCHOLARSHIP]. The three variables, RECRUIT, REVENUE, and SCHOLARSHIP, were university, the lower his or her UCGPA. Revenue and scholarship student athletes bad lower UCGPAs than non-revenue and non scholarship student athletes. The regression analysis (Table statistically significant predictors of UCGPA, with REVENUE the strongest predictor. variables produced a multiple R of.386, which accounted for 14.9% of the variance in UCGPA. SCHOLARSHIP was not a statistically significant predictor. The combined athletic status 7) with these three variables as predictors of UCGPA showed RECRUIT and REVENUE were Consequently, year in school comparisons will not be part of the analysis of the data. The cross sectional rather than longitudinal nature of the data may explain these results. the variables studied. However, there appear to be few, if any, developmental trends in this data. It seems reasonable to assume that there would be developmental changes in a number of significant GENDER [t(352) = -.87, p -1.69, p = ns] differences in social status. the student athlete s academic preparation and academic performance. There were no statistically the higher the UCGPA. Significant but low correlations were also found with a number of the SOCIAL STATUS, as measured by mother s education, had a statistically significant, but relatively low, correlation with UCGPA(r.23**). The higher the student athlete s social status. other variables in the study. Significant positive correlations were found between SOCIAL 24** = ns] or ETHNICITY (AF-AM vs. NONAF-AM) [t(352) =

51 REVENUE remained a statistically significant predictor of UCGPA (See Table 8). Multiple R =. 656 R2=.431 N = 180 Table 8 Appendix B Results 7 Correlations between RECRUIT and other variables included in this study showed strong statistically significant positive correlations with EXPLOIT (r=.37**) and ATH-AC COM (r= suggest that the more heavily student athletes were recruited to the university, the lower their academic self confidence, the greater their use of self-handicapping excuses, and the morç they they reported being committed to an athletic role and the greater their feelings of exploitation. low correlations with SELF-HAND EX r =.17*) and STUDY PROB (r =.13*). These findings RECRUIT had a negative correlation with ACAD SELF-WORTH (r =.24**) and positive but.51 **). The more heavily that student athletes reported being recruited to the university, the more Variables Recruit *p, 05 **p. HSGPA 0l UCGPA SATV SATM r Correlations: Recruitment by Achievement Variables Table 9 measures of academic preparation and UCGPA. The more the student athletes reported they were recruited to the university, the lower their entering academic preparation and subsequent UCGPA. As Table 9 demonstrates, the degree of recruitment was negatively correlated with all Recruitment p.o5 p.01 SOCIAL STATUS.03.23** ETHNICITY ** REVENUE.20**.26** HSGPA.04*.46** RECRUIT -.00,.31** SATV.19**.62** Variables Coeff. r SATM.08**.48** When the two statistically significant athletic status variables were entered in a regression analysis with the academic preparation and demographic variables (except gender), only
, as revenue athletes tend to be the most highly recruited. Sport Table 10 presents the mean UCGPA by sport.")
52 experienced study problems. As such, being heavily recruited seems to be associated with a number of negative characteristics. As would be expected, heavy recruitment was highly correlated with revenue status (r =.67**), as revenue athletes tend to be the most highly recruited. Sport Table 10 presents the mean UCGPA by sport. UCGPAs collected for the present study were compared to data obtained from the Athletic Programs for Student-Athletes(formerly called Athletic Study Center) which had larger sample sizes for some sports. Individual sports were ranked from high to low based on the Athletic Study Center data. The revenue sports, men s football and basketball, show the lowest UCGPAs. Women s sports generally had higher UCGPAs than the men s sports. The only exception was women s softball and soccer, which were lower than the other women s sports. The traditionally middle class and upper middle class American sports (crew, field hockey, gymnastics, swimming, tennis) tended to have the highest grade point averages. Golf and soccer, however, were exceptions to this trend. Table 10 Mean UCGPA by Sport Sport UCGPA ASC M n M Cross Country (W) Field Hockey (W) Swimming(M) Swimming (W) Tennis(W) Cross Country (M) Volleyball (W) Gymnastics (W) Gymnastics (M) Crew(W) Basketball (W) Crew (M) 2.92 Track(W) Tennis(M) Track (M) Waterpolo (M) Baseball(M) Soccer(W) Softball (W) Soccer(M) Football (M) 2, Golf(M) Basketball (M) Appendix B Results 8
 were distributed in the sports of swimming, tennis, softball and volleyball.")
53 Scholarship Status In our sample of student athletes, 26.9% received full scholarships, 21.9% received partial scholarships, and the remaining 51.3% received no scholarship. Revenue producing sports comprised 60.4% of the full scholarship student athletes. The remaining full scholarships (39.5%) were distributed in the sports of swimming, tennis, softball and volleyball. Partial scholarships were distributed among all of the other sports except for crew, cross country, and field hockey. Table 11 presents the academic achievement data by scholarship status. On all four achievement variables, student athletes receiving no scholarship compensation were statistically significantly higher than students on partial or full scholarship. Student athletes on partial scholarship showed no statistically significant difference from those individuals receiving full scholarships. Table 11 ANOVA: Achievement by Scholarship Status Scholarship Status Variables Full Partial None (n=96) (n=78) (n=l83) M M M F UCGPA ,98** SAW ,50** 23.7 SATM ,04** 31.2 HSGPA ** *p. 05 **p.ol Revenue 20.8% of the student athletes sampled were revenue athletes, while the remaining 79.2% were non-revenue athletes. Of the revenue student athletes, 79% reported that they were on full scholarship and almost half (48.7%) were African-American. The revenue student athletes reported that they were more highly recruited than the non-revenue student athletes [RECRUIT: t(355)= 3.64, p.0 1]. They were also more confident of their prospects of becoming professional athletes [PRO: t(235)= p.01] and were of lower social status than the nonrevenue athletes [SOCIAL STATUS: t(352) = , p.051. Table 12 illustrates that revenue student athletes academic performance was lower than non-revenue student athletes on UCGPA, SATV, SATM, and HSGPA, When academic preparation (SAW, SATM, HSGPA), social status (SOCIAL STATUS), and ethnicity (AF-AM versus OTHER) were controlled, revenue status still accounts for statistically significant differences in UCGPA [ANCOVA: F(1,l74) = 5.25, p.05]. Revenue status makes an independent negative contribution to UCGPA, Appendix B Results 9
 showed substantial very strong predictors of successful")
54 UCGPA ** M M df t Variables Revenue Non Rev. Achievement by Revenue Appendix B Results 10 p.01 I1ISGPA 04** 46** I SATM.09* ISAW.21**.62** Variables Coeff. r Multiple R =.639 R2=.408 N = 184 Regression Analysis: UCGPA on Academic Preparation Variables Table 13 All three academic preparation variables (SAW, SATM, HSGPA) showed substantial very strong predictors of successful academic performance at Berkeley. zero order correlations with UCGPA. A regression analysis, as depicted in Table 13, shows a multiple R of.639, which accounted for 40.8% of the variance. Each academic preparation variable made a statistically significant contribution to predicting UCGPA. SATV showed the highest correlation with UCOPA. Student athletes academic performance and effort in high school, as reflected in high school grade point average and scholastic aptitude test scores, were Academic Preparation Cognitive Factors Comparisons between revenue and non-revenue student athletes on the other variables included in this study showed a number of differences. Revenue student athletes reported lower metacognitive study strategies [ST STRAT: t(347) = 3.27, p.01] and more study problems [STUDY PROB: t(346) = 1.96, p.05]. They were less intrinsically motivated [INTRINSIC: t(348)= - university [EXPLOIT: t(228) = , HAND EX: t(35 1) = 3 35, P.01]. These student athletes were more committed to the athletic 2.08, p.05], and reported more excuses for lowered academic performance [SELF- role [ATH-AC COM: t(231) = 3.00, p.011 and reported a greater feelings of exploitation by the p.0 1]. 05 **p.o *p. 1 HSGPA ** SATM ** SAW ** Table 12

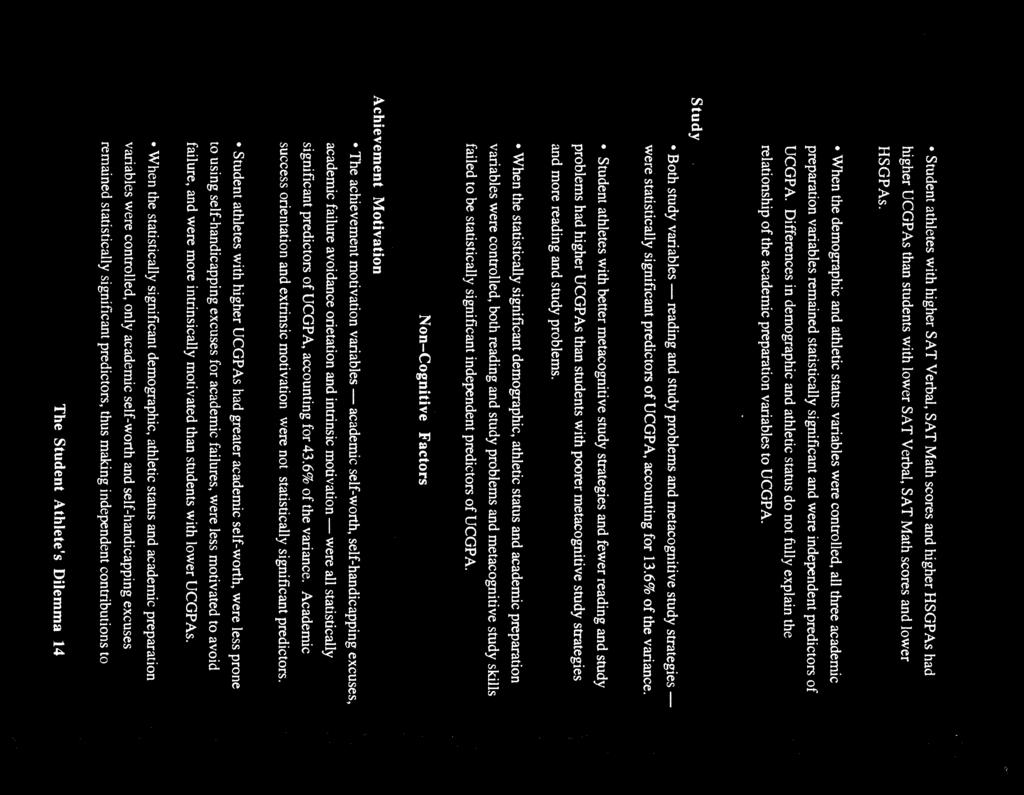
55 Appendix B Results 11 variables) and the academic preparation variables (see Table 14), only the academic preparation Table 14 Variables Coeff. r Table 15 in UCGPA. Study HSGPA.04*.46** SATV.18**.62** SATM.10**.48 variables were statistically significantly related to UCGPA. Thus, the academic preparation variables made independent contributions to UCGPA when background factors were controlled. Regression Analysis: UCGPA on Background and Academic Preparation Variables When UCGPA was regressed on the background factors (athletic and demographic status Multiple R. 665 R2=.442 N = 181 SOCIAL STATUS.03.23** GENDER.12#.25** analysis with academic preparation, demographic and athletic status variables. Both study variables drop below significance. Table 16 illustrates the results when the study variables were entered into a regression STUDY PROB.02** * p.05 ** p.01 STUDY STRAT.02**.29** Variables Coeff. r Multiple R =.369 R2=.136 N = 280 Regression Analysis: UCGPA on Study Problems and Metacognitive Study Strategies together, both variables produced a multiple R of.369, which accounted for 13.6% of the variance STUDY PROB was negatively related. Student athletes who were better academic performers reported better metacognitive study strategies and fewer reading and study problems. Taken significant predictors of UCGPA (See Table 15). STUDY STRAT was positively related, while A regression analysis showed STUDY PROB and STUDY STRAT were statistically ETHNICITY RECRUIT REVENUE ** * p.05 ** p.01 #p >.05. 0

56 Appendix B Results 12 Multiple R =.669 R2=.447 N = 176 HSGPA.04*.46** SATV.17** Status STUDY STRAT.01 Regression Analysis: UCGPA on Study, Academic Preparation, Athletic Status and Demographic STUDY PROB -.00 GENDER.12 SOCIAL STATUS.03.23** REVENUE Table ETHNICITY.07 RECRUIT.00 Table 16 *p. Non-Cognitive Factors Variables Coeff. r SATM.09* 05 **p. 0 I EXTRINSIC.01 APPROACH -.00 SELF-HAND EX.03**.36** ACAD SELF-WORTH 06** 55** INTRINSIC 04** 30** AVOID.01* -.07 Variables Coeff. r Multiple R =.661 R2 =..436 N = 184 Regression Analysis: UCGPA on Achievement Motivation less prone to use excuses for poor academic performance. The achievement motivation variables superior students were more confident of their academic ability and were more intrinsically motivated within the academic setting. They were less oriented toward avoiding failure and were produced a multiple R of.661, which accounted for 43.6% of the variance in UCGPA. and SELF-HAND EX were statistically significant predictors of UCGPA. The academically Table 17 presents the regression analysis of UCGPA on the achievement motivation variables. The regression analysis showed that ACAD SELF-WORTH, AVOID, INTRINSIC, Achievement Motivation * p.05 ** p.01.26** 19**

57 EXTRINSIC.01 SELF-HAND EX.02* INTRINSIC.01 AVOID ACAD SELF-WORTH 04** 55** APPROACH.00 39** GENDER.14* ETHNICITY -.03 HSGPA.00 RECRUIT.01 SOCIAL STATUS.02 Variables Coeff. r SATV SATM.07#.48** to academics. The When the statistically significant athletic status, demographic status, and academic preparation variables were added to the achievement motivation variables in a regression analysis performance. Regression Analysis: UCGPA on Achievement Motivation, Athletic Status, Demographic Status, lower student athletes academic self-worth, the more they were committed to athletics and the less Multiple R = 731 R2 = 534 N = 162 and Academic Preparation significant. These two variables made independent contributions to predicting academic Table 18 (See Table 18), only ACAD SELF-WORTH and SELF-HAND EX remained statistically Appendix B Results % of the variance. relationship variables showed statistically significant and high correlations with UCGPA. A predictors of UCGPA. Together, they produce a multiple R of.550, which accounted for a full regression analysis showed both ATH-AC COM and EXPLOIT to be statistically significant As Table 19 illustrates, the zero order correlations between the two academic-athletic Academic-Athletic Relationship ACAD SELF-WORTH was negatively correlated with ATH-AC COM (r = -.45). REVENUE -.03 **p.0l #p>.o5.1o

58 Appendix B Resuks 14 FVariables Coeff. r SATM.48.43; EXPLOIT, r =.401. SELF-WORTH, r = -.37; APPROACH: r = -.40, INTRINSIC, r = -.36; SELF-HAND EX, r = r = -.38; SATM, r = -30; HSGPA, r = -.37; STUDY PROB, r =.33; RECRUIT, r =.33; ACAD ATh-AC COM had moderate to high correlations with a number of other variables [SAW. *05 **01 #p>.o5.lo GENDER.l0# ETHNICITY.09 - REVENUE.06 SAW.14** ATh-ACCOM.03** 5()** Variables Coeff. r When the athletic and demographic status, as well as academic preparation variables were statistically significant predictors of UCGPA. As such, these variables made independent Regression Analysis: UCGPA on Academic-Athletic Relationship, Academic Preparation, Athletic EXPLOIT.02** SOCIAL STATUS.04 HSGPA.03# [EXPLOIT..02** IATH-ACCOM.05** Multiple R =.550 R2 =.303 N = 193 contributions to UCGPA. Multiple R =.723 R2 =.523 N = 171 RECRUIT.04 Regression Analysis :UCGPA on Academic-Athletic Relationship Table 20 Table 19 added to the regression analysis (see Table 20), both EXPLOIT and ATh-AC COM continue to be Status, and Demographic Status. 19.

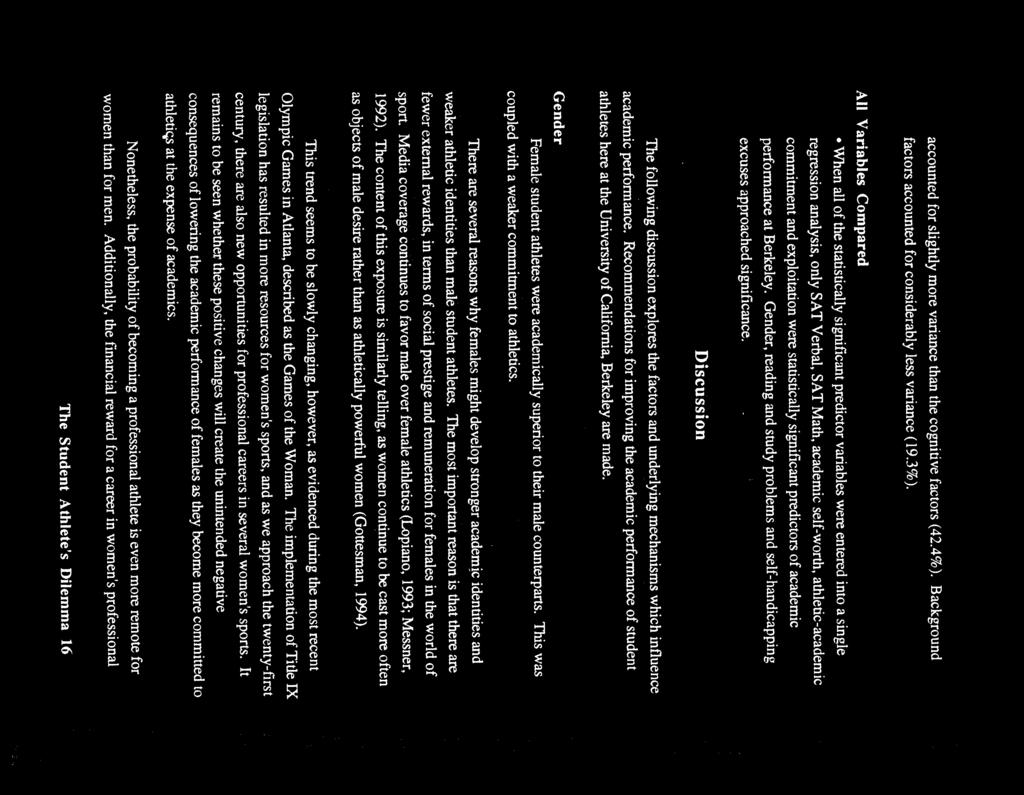
59 Relative Importance of Factors and Variables The relative importance of the factors and variables under study can be looked at in the following three ways: comparing variance accounted for by groups of factors, comparing groups of factors, and comparing individual variables. Table 21 illustrates the results when the three groups of factors-cognitive, non-cognitive. and backgrounds factors were taken separately. Non cognitive and cognitive factors each account for substantially more variance than the background factors. Table2l Percent of UCGPA Variance Accounted for by Each Group of Factors Factor % Var. NON-COGNITIVE 44.6 COGNITIVE 42.4 BACKGROUND 19.3 All Factors Compared Table 22 illustrates the percentage of variance accounted for when all six factors were analyzed separately as predictors of UCGPA. Three factors accounted for almost twice as much variance as the other three factors. They were achievement motivation, academic preparation, and academic-athletic relationships. Study, athletic status, and demographic status factors accounted for considerably less variance than these three factors. Table 22 Percent Variance of UCGPA Accounted for by Each Factor Separately Factor % Var, ACHIEVEMENT MOTIVATION 43.6 ACADEMIC PREPARATION 40.8 ACADEMIC - ATHLETIC RELATION ATHLETIC STATUS 14.9 STUDY DEMOGRAPHIC STATUS,13.2 Appendix B Results 15

60 Appendix B Results 16 Table 23 SATM SATV Table 23 illustrates the results when all the statistically significant independent predictor variables from each factor were included in a single regression analysis. Regression Analysis: UCGPA on All Variables All Variables Compared Multiple R =.752 R2 =.566 N = 163 ACAD SELF-WORTh, ATH-AC COM, EXPLOIT, SAW, and SATM were all SELF-HAND EX approached significance. statistically significant predictors of academic performance. GENDER, STUDY PROB, and ps.u p.u1 #p >.U5.10 STUDY STRAT.01 SOCIAL STATUS.03 SELF-HAND EX ETHNICITY.04 REVENUE -.04 RECRUIT.03 HSGPA.02 ATh-AC COM EXPLOIT -.01 * GENDER.l1# STUDY PROB ACAD SELF-WORTH Variable Coeff.
Family Expectations, Self-Esteem, and Academic Achievement among African American College Students
 Family Expectations, Self-Esteem, and Academic Achievement among African American College Students Mia Bonner Millersville University Abstract Previous research (Elion, Slaney, Wang and French, 2012) found
2004 MAKING ACHIEVEMENT POSSIBLE SURVEY SUMMARY REPORT
 2004 MAKING ACHIEVEMENT POSSIBLE SURVEY SUMMARY REPORT VISION Ball State University will be a national model for all who seek intellectual vitality in a learner-centered and socially responsible academic
Athletic Identity and Life Roles of Division I and Division III Collegiate Athletes
 ATHLETIC IDENTITY AND LIFE ROLES OF DIVISION I AND DIVISION III COLLEGIATE ATHLETES 225 Athletic Identity and Life Roles of Division I and Division III Collegiate Athletes Katie A. Griffith and Kristine
CHAPTER 10 Educational Psychology: Motivating Students to Learn
 BEFORE YOU READ... The material included in Chapter 10 focuses on motivation: the internal processes that activate, guide, and maintain behavior. Some of the theoretical concepts associated with motivation
Motivation CURRENT MOTIVATION CONSTRUCTS
 Motivation CURRENT MOTIVATION CONSTRUCTS INTEREST and ENJOYMENT TASK VALUE GOALS (Purposes for doing) INTRINSIC vs EXTRINSIC MOTIVATION EXPECTANCY BELIEFS SELF-EFFICACY SELF-CONCEPT (Self-Esteem) OUTCOME
Stereotype threat for the scholar-athlete in the classroom
 Stereotype threat for the scholar-athlete in the classroom Academic stereotypes about college-athletes Research indicates that academic faculty and traditional student peers perceive college-athletes to
Assessing Undergraduate Campus Climate Trends at UC Berkeley
 Assessing Undergraduate Campus Climate Trends at UC Berkeley Andrew Eppig, Ph.D. Equity & Inclusion Sereeta Alexander, Ph.D. Office of Planning & Analysis November 8, 2012 CAIR 2012 - Alexander and Eppig
Scientist-Practitioner Interest Changes and Course Outcomes in a Senior Research Psychology Course
 Scientist-Practitioner Interest Changes and Course Outcomes in a Senior Research Psychology Course Terry F. Pettijohn II Arsida Ndoni Coastal Carolina University Abstract Psychology students (N = 42) completed
Depression and Anxiety Following Injury Among Collegiate Athletes
 Depression and Anxiety Following Injury Among Collegiate Athletes Ryan F. Pittsinger, M.S., Gang Cheng, M.S., Erin O. Heiden, MPH, Ni Zhang, M.S., Tracey Covassin, Ph.D., Jingzhen Yang, Ph.D. Injury Prevention
The Youth Experience Survey 2.0: Instrument Revisions and Validity Testing* David M. Hansen 1 University of Illinois, Urbana-Champaign
 The Youth Experience Survey 2.0: Instrument Revisions and Validity Testing* David M. Hansen 1 University of Illinois, Urbana-Champaign Reed Larson 2 University of Illinois, Urbana-Champaign February 28,
8 QUALITIES OF A MENTALLY TOUGH ATHLETE. By. Dr. Alan Goldberg, Sports Psychologist
 8 QUALITIES OF A MENTALLY TOUGH ATHLETE By. Dr. Alan Goldberg, Sports Psychologist As a Sports Performance Consultant and internationally-known expert in peak sports performance, Dr. Goldberg works with
Sports Merit Badge Workbook
 Merit Badge Workbook This workbook can help you but you still need to read the merit badge pamphlet. This Workbook can help you organize your thoughts as you prepare to meet with your merit badge counselor.
Mindfulness and Sport Participation in College Students. A Senior Honors Thesis
 Belna 1 Mindfulness and Sport Participation in College Students A Senior Honors Thesis Presented in Fulfillment of the Requirements for Graduation with Distinction in the College of Education and Human
Kinesiology A.A.-T DEGREE: 60 units
 A.A.-T DEGREE: 60 units Upon completion of this degree, students will be prepared to transfer into the CSU system to pursue a BA/BS in. It is the desire of the and Athletics Department to contribute to
PSY 361 PERSONALITY RESEARCH PROJECT THIS IS NOT THE OFFICIAL SURVEY USE THIS DOCUMENT TO FORM YOUR HYPOTHESES
 PSY 361 PERSONALITY RESEARCH PROJECT THIS IS NOT THE OFFICIAL SURVEY USE THIS DOCUMENT TO FORM YOUR HYPOTHESES DO NOT USE THIS DOCUMENT AS THE SURVEY THAT YOU ADMINISTER (YOU LL GET THE OFFICIAL SURVEY
West Windsor-Plainsboro Regional School District Physical Education Grade 10
 West Windsor-Plainsboro Regional School District Physical Education Grade 10 Page 1 of 6 GRADE 10 PHYSICAL EDUCATION Content Area: Physical Education Course & Grade Level: Physical Education, Grade 10
Motivation Motivation
 This should be easy win What am I doing here! Motivation Motivation What Is Motivation? Motivation is the direction and intensity of effort. Direction of effort: Whether an individual seeks out, approaches,
Procrastination, Motivation, & Flow
 Andrews University Digital Commons @ Andrews University Honors Theses Undergraduate Research 3-28-2016 Procrastination, Motivation, & Flow Reginald Desrosiers Andrews University, rjd@andrews.edu This research
Measuring Self-Esteem of Adolescents Based on Academic Performance. Grambling State University
 Measuring Self-Esteem 1 Running head: MEASURING SELF-ESTEEM INADOLESCENTS Measuring Self-Esteem of Adolescents Based on Academic Performance Grambling State University Measuring Self-Esteem 2 Problem Studied
CHAPTER 7: Achievement motivation, attribution theory, self-efficacy and confidence. Practice questions - text book pages
 QUESTIONS AND ANSWERS CHAPTER 7: Achievement motivation, attribution theory, self-efficacy and confidence Practice questions - text book pages 111-112 1) Which one of the following best explains achievement
Performance Assessment Network
 Performance Assessment Network Winning Profile Athlete Inventory John C Doe Date: 10/18/00 2:20:18 PM Admin Id: A8941039 Tester Id: T1823327 Sport: Football Position: Quarterback Level: Professional Organization:
The Effect of Being a Student-Athlete on Academic Performance
 The Effect of Being a Student-Athlete on Academic Performance Thomas Kohs Department of Biological Sciences, College of Liberal Arts & Sciences and the Honors College University of Illinois at Chicago
CHAPTER 7: Attribution theory, confidence and self-efficacy. Practice questions at - text book pages 124 to 125 QUESTIONS AND ANSWERS.
 QUESTIONS AND ANSWERS CHAPTER 7: Attribution theory, confidence and self-efficacy Practice questions at - text book pages 124 to 125 1) Weiner s model of attribution refers to: a. stable factors, such
Cognitive Theories. of motivation. Please take 5 minutes to read over your Unit 5 Case Study. Then Nathan will present.
 Cognitive Theories of motivation Please take 5 minutes to read over your Unit 5 Case Study. Then Nathan will present. Goals for Today: 1. Identify and explain the 3 theories of motivation 2. Discuss strategies
Variable Measurement, Norms & Differences
 Variable Measurement, Norms & Differences 1 Expectations Begins with hypothesis (general concept) or question Create specific, testable prediction Prediction can specify relation or group differences Different
MBA 605 Business Analytics Don Conant, PhD. GETTING TO THE STANDARD NORMAL DISTRIBUTION
 MBA 605 Business Analytics Don Conant, PhD. GETTING TO THE STANDARD NORMAL DISTRIBUTION Variables In the social sciences data are the observed and/or measured characteristics of individuals and groups
The Relationship between Fraternity Recruitment Experiences, Perceptions of Fraternity Life, and Self-Esteem
 Butler University Digital Commons @ Butler University Undergraduate Honors Thesis Collection Undergraduate Scholarship 2016 The Relationship between Fraternity Recruitment Experiences, Perceptions of Fraternity
The Continued Development of the Athletic Self- Appraisal Scale
 Pacific University CommonKnowledge School of Graduate Psychology College of Health Professions 7-20-2010 The Continued Development of the Athletic Self- Appraisal Scale J. Alex Cramptom Pacific University
PSYCHOLOGY OF SPORT & EXERCISE
 PSYCHOLOGY OF SPORT & EXERCISE MOTIVATION IN SPORT What we already know?? Remember (NEW)? B F Skinner Operant conditioning Motivation comes through reinforcement Positive (adding nice rewards) Negative
Worksheet # 1 Why We Procrastinate
 Worksheet # 1 Why We Procrastinate Directions. Take your best guess and rank the following reasons for why we procrastinate from 1 to 5 starting with 1 being the biggest reason we procrastinate and 5 being
UD Campus Recreation.
 Eric Laudano DAT, MHS, ATC Senior Associate Director of Athletics for Health, Sports Performance, & Campus Recreation University of Delaware Wellness Hub for Campus Home to: Healthy Hens Behavioral Health
2008 Ohio State University. Campus Climate Study. Prepared by. Student Life Research and Assessment
 2008 Ohio State University Campus Climate Study Prepared by Student Life Research and Assessment January 22, 2009 Executive Summary The purpose of this report is to describe the experiences and perceptions
active lives adult survey understanding behaviour Published February 2019
 active lives adult survey understanding behaviour Published February 2019 welcome Welcome to an additional Active Lives report. This is not one of our sixmonthly overviews of sport and physical activity
The Relationship between YouTube Interaction, Depression, and Social Anxiety. By Meredith Johnson
 The Relationship between YouTube Interaction, Depression, and Social Anxiety By Meredith Johnson Introduction The media I would like to research is YouTube with the effects of social anxiety and depression.
BARRIERS to EXERCISE
 Name: BARRIERS to EXERCISE Date: Physical Activity - It s Time To Overcome The Barriers And Become Active A Case for Fitness, assignment #2, focused on barriers to exercise. Some of these barriers included
Choosing Life: empowerment, Action, Results! CLEAR Menu Sessions. Adherence 1: Understanding My Medications and Adherence
 Choosing Life: empowerment, Action, Results! CLEAR Menu Sessions Adherence 1: Understanding My Medications and Adherence This page intentionally left blank. Understanding My Medications and Adherence Session
Motivation: Internalized Motivation in the Classroom 155
 24 Motivation Internalized Motivation in the Classroom Kennon M. Sheldon The motivation that students bring to a classroom setting is critical in determining how much, and how well, they learn. This activity
Internalized Motivation in the Classroom
 Internalized Motivation in the Classroom Motivation Exercise 20-30 min. The motivation that students bring to a classroom setting is critical in determining how much, and how well, they learn. This activity
Global Perspective Inventory (GPI) Report
 Report") Global Perspective Inventory (GPI) 2012-2013 Report Executive Summary display higher levels of global competence than freshmen in all of the GPI scales except for the interpersonal social responsibility
Global Perspective Inventory (GPI) 2012-2013 Report Executive Summary display higher levels of global competence than freshmen in all of the GPI scales except for the interpersonal social responsibility
The Effects of Societal Versus Professor Stereotype Threats on Female Math Performance
 The Effects of Societal Versus Professor Stereotype Threats on Female Math Performance Lauren Byrne, Melannie Tate Faculty Sponsor: Bianca Basten, Department of Psychology ABSTRACT Psychological research
Wellness Assessment: Spiritual Wellness. Center for the Study of Student Life
 Wellness Assessment: Spiritual Wellness Center for the Study of Student Life July 2015 INTRODUCTION Student wellness is an essential component of academic success in higher education and subsequent opportunities
Mindset For Optimal Performance: Essential Mental Skills DR. RICK MCGUIRE DIRECTOR OF SPORT PSYCHOLOGY ANNE SHADLE M.ED.
 Mindset For Optimal Performance: Essential Mental Skills DR. RICK MCGUIRE DIRECTOR OF SPORT PSYCHOLOGY ANNE SHADLE M.ED. THINKING RIGHT IN SPORT It s all about FOCUS! Outline For Today: 1. Thinking Right
Girls on the Run & Girls on Track: Formative Evaluation Report. Spring 2007 Results
 Girls on the Run & Girls on Track: Formative Evaluation Report Spring 2007 Results RESPECTFULLY SUBMITTED BY: ASSOCIATE PROFESSOR DEPARTMENT OF COMMUNITY AND FAMILY HEALTH COLLEGE OF PUBLIC HEALTH UNIVERSITY
AlcoholEdu for College
 for College Executive Summary January 2006 California State University, Chico SUMMARY OF KEY FINDINGS Following is a summary of the key findings from California State University s 2005 implementation of
Wellness Assessment: Financial Wellness. Center for the Study of Student Life
 Wellness Assessment: Financial Wellness Center for the Study of Student Life July 2015 INTRODUCTION Student wellness is an essential component of academic success in higher education and subsequent opportunities
Self Motivation Inventory Find out whether you are naturally self-motivated and disciplined
 Self Motivation Inventory Find out whether you are naturally self-motivated and disciplined People often wonder what makes it hard for them to begin or complete activities and tasks. There are many factors
Follow this and additional works at: Part of the Exercise Science Commons
 The College at Brockport: State University of New York Digital Commons @Brockport Senior Honors Theses Master's Theses and Honors Projects 12-8-2016 Who Matters? The Perceived Motivational Climates Created
PHYSICAL EDUCATION (PE)
") Physical Education (PE) 1 PHYSICAL EDUCATION (PE) PE 1010 INTRODUCTION TO ATHLETIC TRAINING (1 credit) This course will provide an opportunity for candidates to investigate careers in athletic training.
Physical Education (PE) 1 PHYSICAL EDUCATION (PE) PE 1010 INTRODUCTION TO ATHLETIC TRAINING (1 credit) This course will provide an opportunity for candidates to investigate careers in athletic training.
AGES 16 / 18 AND UNDER Age Appropriate Strength and Conditioning LESSON WORKBOOK DARRYL NELSON
 AGES 16 / 18 AND UNDER Age Appropriate Strength and Conditioning LESSON WORKBOOK DARRYL NELSON 2 Coaches need to create an environment in which athletes can participate in functional strength training
Gill, D.L. (1986). Competitiveness among females and males in physical activity classes. Sex Roles, 15,
. Competitiveness among females and males in physical activity classes. Sex Roles, 15,") Competitiveness Among Females and Males in Physical Activity Classes By: Diane L. Gill Gill, D.L. (1986). Competitiveness among females and males in physical activity classes. Sex Roles, 15, 233-257. Made
Competitiveness Among Females and Males in Physical Activity Classes By: Diane L. Gill Gill, D.L. (1986). Competitiveness among females and males in physical activity classes. Sex Roles, 15, 233-257. Made
Consumer Perception Survey Report
 Imperial County Behavioral Health Services Consumer Perception Survey Report FY 21-216 Presented by: Gilda Adame FY 1-16 Prepared by: GA QIC: 6/8/17 IMPERIAL COUNTY BEHAVIORAL HEALTH SERVICES Consumer
An Examination of Goal Orientation between Genders An Exploratory Study
 Georgia Southern University Digital Commons@Georgia Southern University Honors Program Theses 2017 An Examination of Goal Orientation between Genders An Exploratory Study Amanda M. Boyd Georgia Southern
Psychological Factors and Issues in Return to Play After ACL Reconstruction JAKI HITZELBERGER, LMHC, MGCP
 Psychological Factors and Issues in Return to Play After ACL Reconstruction JAKI HITZELBERGER, LMHC, MGCP Athlete s Perception ACL INJURY continuum This is the worst thing that could ever happen to me
Barriers to concussion reporting. Qualitative Study of Barriers to Concussive Symptom Reporting in High School Athletics
 Barriers to concussion reporting Qualitative Study of Barriers to Concussive Symptom Reporting in High School Athletics Male soccer player: Well, like if you get a concussion. you bruised your brain and
Wellness Assessment: Intellectual Wellness. Center for the Study of Student Life
 Wellness Assessment: Intellectual Wellness Center for the Study of Student Life July 2015 INTRODUCTION Student wellness is an essential component of academic success in higher education and subsequent
THE CUSTOMER SERVICE ATTRIBUTE INDEX
 THE CUSTOMER SERVICE ATTRIBUTE INDEX Jane Doe Customer Service XYZ Corporation 7-22-2003 CRITICAL SUCCESS ATTRIBUTES ATTITUDE TOWARD OTHERS: To what extent does Jane tend to maintain a positive, open and
Female College Basketball Players Perception Regarding Gender of their Coach
 Female College Basketball Players Perception Regarding Gender of their Coach By Kasey Kleiner A Graduate Thesis for the partial fulfillment of the degree of Masters of Education in Educational Leadership
The Psychology Of Winning How to Develop a Winning Attitude In High Performance Sport. By: Wayne Goldsmith
 The Psychology Of Winning How to Develop a Winning Attitude In High Performance Sport. World Cup Final Day. The team gathers in the locker room. By: Wayne Goldsmith This is an intense, high-pressure environment
Posttraumatic Stress and Attributions in College Students after a Tornado. Introduction. Introduction. Sarah Scott & Lisa Beck
 Posttraumatic Stress and Attributions in College Students after a Tornado Sarah Scott & Lisa Beck Department of Behavioral Sciences Faculty Mentor: Caleb W. Lack, Ph.D. Most adults will be exposed to a
NCAA National Study on Substance Use Habits of College Student-Athletes. June 2018
 NCAA National Study on Substance Use Habits of College Student-Athletes June 2018 Table of Contents Summary of Findings 7 Historical Use Trends: Social Drug Use 31 Historical Use Trends: Illicit Drug Use
Consumer Perception Survey (Formerly Known as POQI)
") Department of Behavioral Health Consumer Perception Survey (Formerly Known as POQI) CPS Comparison May 2017 On a semi-annual basis the County of Fresno, Department of Behavioral Health (DBH) conducts its
Department of Behavioral Health Consumer Perception Survey (Formerly Known as POQI) CPS Comparison May 2017 On a semi-annual basis the County of Fresno, Department of Behavioral Health (DBH) conducts its
3 Need a requirement of some material (such as food or water) that is essential for survival of the organism.
 that is essential for survival of the organism.") Human Behavior Ch. 11 Motivation and Emotion Notes 1 Motivation the process by which activities are started, directed, and continued so that physical or psychological needs or wants are met. Extrinsic
Human Behavior Ch. 11 Motivation and Emotion Notes 1 Motivation the process by which activities are started, directed, and continued so that physical or psychological needs or wants are met. Extrinsic
Trait motivational correlates of athleticism
 Personality and Individual Differences 30 (2001) 1139±1145 www.elsevier.com/locate/paid Trait motivational correlates of athleticism Steven Reiss *, James Wiltz, Michael Sherman Ohio State University,
c) Redraw the model and place on it relevant attributions for each of the four boxes.
 Redraw the model and place on it relevant attributions for each of the four boxes.") CHAPTER 6: Attribution theory, self-efficacy and confidence, and leadership Practice questions - text book pages 107-108 1) a) Figure 6.21 partly illustrates Weiner s model of attribution. Explain the
CHAPTER 6: Attribution theory, self-efficacy and confidence, and leadership Practice questions - text book pages 107-108 1) a) Figure 6.21 partly illustrates Weiner s model of attribution. Explain the
Wellness Assessment: Creative Wellness. Center for the Study of Student Life
 Wellness Assessment: Creative Wellness Center for the Study of Student Life July 2015 INTRODUCTION Student wellness is an essential component of academic success in higher education and subsequent opportunities
HEALTH AND PHYSICAL EDUCATION DEPARTMENT
 HEALTH AND PHYSICAL EDUCATION DEPARTMENT TEAM SPORTS: A/B Grade Level: 9-10-11-12 773800 (Offered both Semesters) This semester-long course includes instruction in two or three activity units per quarter.
Athlete Identity, Does it Matter? Nick Pazdziorko. College of Student Affairs 504. The Pennsylvania State University
 Athlete Identity 1 Running Heading: Athlete Identity Athlete Identity, Does it Matter? Nick Pazdziorko College of Student Affairs 504 The Pennsylvania State University Athlete Identity 2 Athlete Identity,
3 CONCEPTUAL FOUNDATIONS OF STATISTICS
 3 CONCEPTUAL FOUNDATIONS OF STATISTICS In this chapter, we examine the conceptual foundations of statistics. The goal is to give you an appreciation and conceptual understanding of some basic statistical
SPORT PSYCHOLOGY PAST PAPER QUESTIONS
 SPORT PSYCHOLOGY PAST PAPER QUESTIONS 3.2.3 Sport Psychology Aspects of personality Understanding of the nature vs nurture debate in the development of personality 1. Explain, in terms of personality,
Initial Patient Self Assessment Demographics:
 Initial Patient Self Assessment Demographics: Name: Address: E mail: Phone Number: Date of Birth: Gender: Male Female Other Primary Language: English Spanish Other Occupation: Education: Clerical Skilled
Introduction to Mental Skills Training for Successful Athletes John Kontonis Assoc MAPS
 Introduction to Mental Skills Training for Successful Athletes John Kontonis Assoc MAPS "You can always become better." - Tiger Woods Successful Athletes 1. Choose and maintain a positive attitude. 2.
UA PERFORMANCE MOUTHWEAR POWERED BY ARMOURBITE TM TECHNOLOGY
 UA PERFORMANCE MOUTHWEAR POWERED BY ARMOURBITE TM TECHNOLOGY UA PERFORMANCE MOUTHWEAR YOUR JAW IS THE KEY TO UNLOCK THE POWER YOU NEVER KNEW WAS THERE. No one ever told you that your jaw could help you
AMERICAN JOURNAL OF PSYCHOLOGICAL RESEARCH
 AMERICAN JOURNAL OF PSYCHOLOGICAL RESEARCH Volume 4, Number 1 Submitted: August 20, 2008 Revisions: October 16, 2008 Accepted: October 17, 2008 Publication Date: October 20, 2008 Start Today or the Very
C2 Qu2 DP1 How can psychology affect performance?
 C2 Qu2 DP1 How can psychology affect performance? Hi Guys Let s move onto the second critical question in Core 2 How can psychology affect performance? In this video, we will be explore motivation from
About Social Cognitive Theory
 SOME CURRENT MOTIVATION CONSTRUCTS INTEREST and ENJOYMENT TASK VALUE GOALS (Purposes for doing) INTRINSIC vs EXTRINSIC MOTIVATION EXPECTANCY BELIEFS SELF-EFFICACY SELF-CONCEPT (Self-Esteem) OUTCOME EXPECTATIONS
Psychology Department Assessment
 Psychology Department Assessment 2008 2009 The 2008-2009 Psychology assessment included an evaluation of graduating psychology seniors regarding their experience in the program, an analysis of introductory
Global Perspective Inventory (GPI) - Pilot Report
 - Pilot Report") Global Perspective Inventory (GPI) - Pilot 2010-11 Report Introduction The Global Perspectives Inventory is a nationally recognized instrument designed to measure a student s global perspective. The GPI
Global Perspective Inventory (GPI) - Pilot 2010-11 Report Introduction The Global Perspectives Inventory is a nationally recognized instrument designed to measure a student s global perspective. The GPI
Kinesiology (KIN) kin 311 SeLeCted topics (1-4) Selected upper-division courses that are taught on a one-time basis. May be repeated for credit.
 kin 311 SeLeCted topics (1-4) Selected upper-division courses that are taught on a one-time basis. May be repeated for credit.") Kinesiology (KIN) kin 101 physical education ACtiVitieS (1-2) Activities classes. Classes are conducted in the following activities: aquatics (e.g., swimming, physical conditioning swimming, water polo,
Kinesiology (KIN) kin 101 physical education ACtiVitieS (1-2) Activities classes. Classes are conducted in the following activities: aquatics (e.g., swimming, physical conditioning swimming, water polo,
THE WELL-BEING OF WILLIAM & MARY STUDENTS March 2013 Report by the Student Affairs Assessment Committee
 THE WELL-BEING OF WILLIAM & MARY STUDENTS March 2013 Report by the Student Affairs Assessment Committee In the fall of 2012, the Division of Student Affairs administered a survey to William & Mary undergraduate
UA PERFORMANCE MOUTHWEAR POWERED BY ARMOURBITE TM TECHNOLOGY
 UA PERFORMANCE MOUTHWEAR POWERED BY ARMOURBITE TM TECHNOLOGY UA PERFORMANCE MOUTHWEAR YOUR JAW IS THE KEY TO UNLOCK THE POWER YOU NEVER KNEW WAS THERE. No one ever told you that your jaw could help you
A Longitudinal Study of Recreational Sport Participation and Constraints
 Recreational Sports Journal, 2013, 37, 14-28 2013 Nirsa Foundation Official Journal of the NIRSA Foundation www.rsj-journal.com ORIGINAL RESEARCH A Longitudinal Study of Recreational Sport Participation
Critical Thinking Assessment at MCC. How are we doing?
 Critical Thinking Assessment at MCC How are we doing? Prepared by Maura McCool, M.S. Office of Research, Evaluation and Assessment Metropolitan Community Colleges Fall 2003 1 General Education Assessment
B451. PHYSICAL EDUCATION An Introduction to Physical Education GENERAL CERTIFICATE OF SECONDARY EDUCATION. Tuesday 24 May 2011 Afternoon
 GENERAL CERTIFICATE OF SECONDARY EDUCATION PHYSICAL EDUCATION An Introduction to Physical Education B451 *OCE/26744* Candidates answer on the question paper. OCR supplied materials: None Other materials
LifeStyles Personal Training Attitudinal Assessment (Adapted from the NSCA-CPT attitudinal assessment)
") LifeStyles Personal Training Attitudinal Assessment (Adapted from the NSCA-CPT attitudinal assessment) 1. What would you consider your present attitude toward exercise? 1. Can t stand the thought of it.
LifeStyles Personal Training Attitudinal Assessment (Adapted from the NSCA-CPT attitudinal assessment) 1. What would you consider your present attitude toward exercise? 1. Can t stand the thought of it.
Stress of Workplace. Reading Practice
 Reading Practice Stress of Workplace How busy is too busy? For some it means having to miss the occasional long lunch; for others it means missing lunch altogether. For a few, it is not being able to take
Running head: ACADEMIC REGRETS, MOTIVATION, AND EMOTIONS. A mixed method investigation of academic regrets, motivation, and emotions
 Running head: ACADEMIC REGRETS, MOTIVATION, AND EMOTIONS A mixed method investigation of academic regrets, motivation, and emotions Problem Regrets are a negative emotion initiated by a counterfactual
College Students and the! Misuse, Abuse and Diversion of! ADHD Prescription Stimulant Medications. Research conducted by Harris Poll, 2014
 College Students and the! Misuse, Abuse and Diversion of! ADHD Prescription Stimulant Medications Research conducted by Harris Poll, 2014 Table of Contents! Research Objectives and Method 3! Key Takeaways
Core Alcohol and Drug Survey - Long Form. Consortium Number = Institution Number = Number of Surveys =
 Page 1 of 8 CORE ALCOHOL AND DRUG SURVEY LONG FORM - FORM 194 EXECUTIVE SUMMARY The Core Alcohol and Drug Survey was developed to measure alcohol and other drug usage, attitudes, and perceptions among
CHAPTER II CONCEPTUAL FRAMEWORK
 CHAPTER II CONCEPTUAL FRAMEWORK 2.0.0 INTRODUCTION The details about introduction, rationale of the present study, statement of the problem objectives of the study, hypotheses of the study, delimitation
National Data
 Page 1 of 8 2009-2011 National Data CORE ALCOHOL AND DRUG SURVEY LONG FORM - FORM 194 EXECUTIVE SUMMARY The Core Alcohol and Drug Survey was developed to measure alcohol and other drug usage, attitudes,
Perceived Stress Factors and Academic Performance of the Sophomore IT Students of QSU Cabarroguis Campus
 Perceived Stress Factors and Academic Performance of the Sophomore IT Students of QSU Cabarroguis Campus Lauro S. Aspiras, and Emma D. Aspiras Abstract----This paper deals with the perceived stress factors
by Eugene Bodden Spring 2014 Independent Study 495G PSU Kinesiology Department Instructor Paul Hefty
 by Eugene Bodden Spring 2014 Independent Study 495G PSU Kinesiology Department Instructor Paul Hefty Not all strength philosophies are the same Divided into 3 parts Physical, Psychological, and Social
The Role of Modeling and Feedback in. Task Performance and the Development of Self-Efficacy. Skidmore College
 Self-Efficacy 1 Running Head: THE DEVELOPMENT OF SELF-EFFICACY The Role of Modeling and Feedback in Task Performance and the Development of Self-Efficacy Skidmore College Self-Efficacy 2 Abstract Participants
Illinois State University (Online)
") Page 1 of 8 Illinois State University (Online) CORE ALCOHOL AND DRUG SURVEY LONG FORM - FORM 194 EXECUTIVE SUMMARY The Core Alcohol and Drug Survey was developed to measure alcohol and other drug usage,
Page 1 of 8 Illinois State University (Online) CORE ALCOHOL AND DRUG SURVEY LONG FORM - FORM 194 EXECUTIVE SUMMARY The Core Alcohol and Drug Survey was developed to measure alcohol and other drug usage,
Cultural Intelligence: A Predictor of Ethnic Minority College Students Psychological Wellbeing
 From the SelectedWorks of Teresa A. Smith March 29, 2012 Cultural Intelligence: A Predictor of Ethnic Minority College Students Psychological Wellbeing Teresa A. Smith Available at: https://works.bepress.com/teresa_a_smith/2/
Core Alcohol and Drug Survey - Long Form. Consortium Number = Institution Number = Number of Surveys = 6905
 Page 1 of 8 Multiple Selection CORE ALCOHOL AND DRUG SURVEY LONG FORM - FORM 194 EXECUTIVE SUMMARY The Core Alcohol and Drug Survey was developed to measure alcohol and other drug usage, attitudes, and
Core Alcohol and Drug Survey - Long Form. Consortium Number = Institution Number = Number of Surveys = 56937
 Page 1 of 8 CORE ALCOHOL AND DRUG SURVEY LONG FORM - FORM 194 EXECUTIVE SUMMARY The Core Alcohol and Drug Survey was developed to measure alcohol and other drug usage, attitudes, and perceptions among
The Influence of Injured Athletes Perceptions of Social Support From ATCs on Their Beliefs About Rehabilitation
 J Sport Rehabil. 2006, 15, 156-167 2006 Human Kinetics, Inc. The Influence of Injured Athletes Perceptions of Social Support From ATCs on Their Beliefs About Rehabilitation Jennifer Bricker Bone and Mary
Table 1 Hypothesized Relations between Motivation and Self-Regulation
 Tables 143 144 Table 1 Hypothesized Relations between Motivation and Self-Regulation Metacognition Self-Control Attention Regulation Reappraisal Suppression Rumination Content Time Environment 1. Mastery
National Data
 Page 1 of 8 2006-2008 National Data CORE ALCOHOL AND DRUG SURVEY LONG FORM - FORM 194 EXECUTIVE SUMMARY The Core Alcohol and Drug Survey was developed to measure alcohol and other drug usage, attitudes,