Using Analytical and Psychometric Tools in Medium- and High-Stakes Environments
|
|
|
- Lionel Lamb
- 5 years ago
- Views:
Transcription


1 Using Analytical and Psychometric Tools in Medium- and High-Stakes Environments Greg Pope, Analytics and Psychometrics Manager 2008 Users Conference San Antonio
2 Introduction and purpose of this session This session will present some of the theory behind assessment analysis to put the numbers into context The discussion will be as non-technical as possible with a more applied approach Questionmark tools that can help evaluate the performance of assessments and assessment items will be presented with applied examples If you have questions please do ask during the session Slide 2
3 Agenda A brief review of the theory Putting theory into practice, some Questionmark tools Score List Report, Coaching Report, Transcript Report Item analysis report Test analysis report Results Management System (RMS) Summary Question and answer period Slide 3
4 CTT and IRT, what's the diff? CTT (Classical Test Theory) is what we all know and love: P-values Discrimination statistics (point-biserial correlations, high minus low performance, etc.) Been around a long time (most of the 20 th century) Works very well for most applications and by far the most widely used form of item/test analysis Ability to work with smaller sample sizes (e.g., or less) Relatively simple to compute (not fitting data to a model) Has a different set of assumptions from IRT Slide 4
5 CTT and IRT, what's the diff? IRT (Item Response Theory) is an alternative that some of us may have heard of or use: a-parameter: Item discrimination b-parameter: Item difficulty c-parameter: Item pseudo-guessing information Been around since the 1960s (Lord) Makes things like computer adaptive testing (CAT) and advanced test development techniques possible More complex to compute (fitting data to a model) Requires larger sample sizes depending on the number of parameters, more parameters more participant responses needed (e.g., 700+ for 3-PL) More information: Slide 5
")
6 CTT and IRT CTT item analysis IRT item analysis: Item characteristic curve (ICC) Slide 6
7 CTT and IRT What is better CTT or IRT? Each are used for their own purposes and have pros and cons Questionmark currently uses CTT in our products Flexible in terms of sample sizes Fast to compute with few or no computational gotchas People are familiar with these statistics and so do not require learning a new measurement model CTT meets the needs of 99% or more of customers CTT statistics are related to IRT statistics to some degree P-values are highly correlated with b-values Point-biserial correlations are highly correlated with a-values We will be discussing CTT today Slide 7
8 Reliability Reliability is used in every day language: My car runs reliably means it starts very time We are going to be talking about test score reliability Essentially: How consistently the test scores measure a construct We can t go into all the detail here today, for a good primer into the theory see: Traub, R.E. (1994). Reliability for the Social Sciences: Theory & Applications. Thousand Oaks: Sage. Slide 8
9 Reliability (briefly, the theory) An assessment is a measurement instrument comprised of many individual measurements (questions/items) What is being measured is the ability, trait, construct, latent variable of interest (a massage therapy certification exam may measure massage knowledge/skills, an investment banking test may measure the construct knowledge of investment banking ) All measurement instruments have error in their estimates, so the traditional view of test score reliability says that a person s: observed score = theoretical True score + error Slide 9
10 Measurements and error 78.2 Measurements made by a thermometer of temperature are imperfect (atmospheric variables, sunlight, etc.) To mitigate this take lots of measurements using different, high quality thermometers Slide 10
11 Measurements and error Q1 Measurements made by a test question of a construct are imperfect (participant fatigue, psychological variables, etc.) To mitigate this take lots of measurements using different, high quality questions Q2 Q3 Q4 Q5 Q6 Q7 Q8 Q9 Slide 11
12 Reliability Four approaches for measuring reliability: 1. Internal consistency: Correlations of items comprising the test (how well do they hang together ) 2. Split-half (split-forms): Correlation of two forms (splits) of the test (first 25 items versus last 25) 3. Test-retest: Correlation between multiple administrations of the same test 4. Inter-rater reliability: Correlation between two or more raters (markers) who rate the same thing (e.g., provide essay scores) Slide 12
13 Reliability: Internal consistency Q1 Q2 Q3 Q4 Q5 Q6 Q7 Q8 Q9 Slide 13
14 Reliability: Internal consistency Kuder-Richardson Formula 20 (KR-20) First published in 1937 Designed for dichotomous (1/0, right/wrong) items Values range from 0 to 1 (closer to 1 = higher reliability) Cronbach s Alpha Cronbach published in 1951 Designed for dichotomous and non-dichotomous (continuous, 1 to 5) items Generally values range from 0 to +1 (closer to +1 = higher reliability) Questionmark uses the Cronbach s Alpha on the Test Analysis Report and Results Management system Greater than 0.90 (high - acceptable for high stakes), 0.70 to 0.89 (moderate - acceptable for medium stakes), below 0.7 (low) Slide 14
15 Reliability practicalities What factors / test characteristics generally influence reliability coefficient values? Item difficulty: Items that are extremely hard or extremely easy affect discrimination and therefore reliability. If a large number of participants do not have time to finish the test this affects item difficulty Item discrimination: Items that have higher discrimination values will contribute more to the measurement efficacy of the assessment (more discriminating questions = higher reliability) Construct being measured: If all questions are measuring the same construct (e.g., from the same topic) reliability will be increased How many participants took the test: With very small numbers of participants the reliability value will be less stable How many questions are administered: Generally the more questions administered the higher the reliability Slide 15
16 Reliability and validity Validity (test scores) refers to: Whether the test is measuring what it should be measuring The processes followed to create the test and test questions That experts have had a chance to review and rubber stamp the processes That the test results predict the intended outcomes That the scores are use appropriately So validity is not a number it has to do with following best practices, conducting studies and research, using results fairly, etc. In order for an assessment to be valid it must be reliable Slide 16
17 Bringing the theory home Reliability and validity refer to the quality of tests and test items which translates into test scores Conducting analyses (analytics) on the test and test items will determine how well the questions are performing and how well the participants understood the material Understanding how to use the analytic tools at your disposal will help ensure high quality tests Lets get into some specifics Slide 17
18 Providing meaningful scores to participants One of the most important aspects of the assessment process has to do with providing meaningful scores to participants Depending on the stakes/purpose of your assessment program appropriate feedback to stakeholders (one of which is generally the participant) is crucial Many here are likely familiar with the Score List Report, Coaching Report, and Transcript Report so we won t spend time on this here today Slide 18

19 Score list report Slide 19

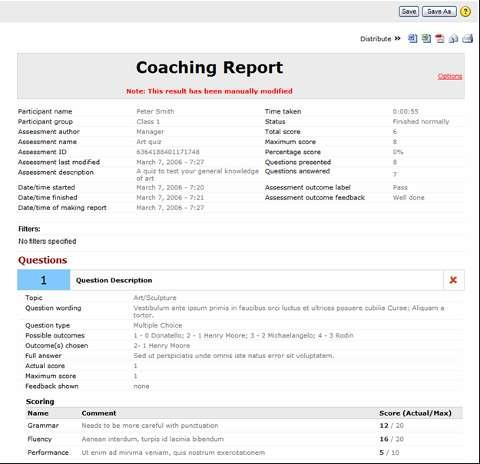
20 Coaching Report Slide 20

21 Transcript report Slide 21
22 Assessment and item quality The scores that are reported to participants and other stakeholders must be derived from high quality questions In order for the participant to obtain meaning and achieve learning from assessment results the assessments must measure what they are supposed to measure reliably Two core aspects of question quality has to do with the analysis of difficulty and discrimination Slide 22
23 Item difficulty and discrimination Item difficulty: P-value: Proportion of participants selecting the correct response or raw score converted to a percentage For a true/false (scored 1/0) question (true is the right answer) % of participants selected True For a 0-5 question if the mean on the question is 3.75/5 then the p- value is (3.75/5=0.750). The average score on the question is 75% Item discrimination: Point-biserial correlation (item total correlation): The correlation between the question scores and overall assessment scores for all participants Outcome discrimination: The Upper group minus the Lower group Slide 23
24 Item difficulty How a participant responds to a question says something about what they know and can do Question difficulty has to do both with the question and the participant This question is easy because lots of participants selected the correct answer This participant got this question right and so they have demonstrated knowledge/skills at this level Question difficulty is on a scale that is related to participant ability (knowledge/skills) Slide 24
25 Item discrimination Discrimination refers to how well an item discriminates/differentiates between participants of different knowledge/skill levels Experts in an area should get higher scores on the question and higher scores on the overall assessment Novices in the same area should get lower scores on the question and lower scores on the overall assessment Slide 25
 histogram Question by question detailed analysis Summary information Information section provides details regarding when the report was created,")
26 Using the Item Analysis Report Composed of several sections: Information section Item difficulty (p-value) histogram and Item discrimination (outcome discrimination) histogram Question by question detailed analysis Summary information Information section provides details regarding when the report was created, etc. Slide 26

27 Using the Item Analysis Report Summary information (at the bottom of the report) Provides a summary of the average p-value, discrimination and item total correlation Slide 27

28 Using the Item Analysis Report Item difficulty (p-value) histogram and Item discrimination (outcome discrimination) histogram Provides a summary of the # of item by difficulty and discrimination Some harder Most items in the average difficulty range Some easier Some worse Most items have good discrim Some better Slide 28

29 Using the Item Analysis Report the better too hard? The Question Item by question detailed analysis more difficulty, Point- Provides a detailed analysis of each question biserial correlation Slide 29 Ran out of time? Not enough high, too many low? A lot of people thought these were the correct answers, is this being taught properly or are there item wording problems?

30 Using the Item Analysis Report reflects Hard question Correlation the high/low split Lower # Lots of high, no low (great!) Alternatives are pulling more of the low than the high, all are pulling some people Slide 30

31 Using the Test Analysis Report Composed of several sections: Information section Table of test statistics Topic level statistical breakdown Frequency distribution Histogram Information section provides details regarding when the report was created, etc. Slide 31 Remember, reducing sample size reduces measurement precision
32 Using the Test Analysis Report Table of test statistics and Topic level statistical breakdown Provides the statistical details for the overall assessment as well as at the topic levels Slide 32
33 Skew A measure of the symmetry of the distribution of scores (i.e., whether scores are pushed or skewed to one side or the other). Ranges from about -2 to +2 Negative skew Normal distribution (no skew) Positive skew # o f p a r t i c i p a n t s # o f p a r t i c i p a n t s # o f p a r t i c i p a n t s % 10% 20% 30% 40% 50% 60% 70% 80% 90% 100% Participant scores 0 0% 20% 40% 60% 80% 100% Participant scores 0 0% 10% 20% 30% 40% 50% 60% 70% 80% 90% 100% Participant scores Slide 33
34 Negative Skew # o f p a r t i c i p a n t s Negative skew 0% 10% 20% 30% 40% 50% 60% 70% 80% 90% 100% Participant score s Slide 34
35 No Skew # o f p a r t i c i p a n t s Normal distribution (no skew) 0% 20% 40% 60% 80% 100% Participant score s Slide 35
36 Positive Skew # o f p a r t i c i p a n t s Positive skew 0% 10% 20% 30% 40% 50% 60% 70% 80% 90% 100% Participant score s Slide 36
37 Kurtosis ( n n( n 1)( n 1) 2)( n this to impress your friends A measure of the symmetry and family of a distribution of scores (i.e., how peaked/pointed versus flat are the distribution of scores what is happening at the tails). Normal range from about -3 to +3 3) It is important to memorize z 4 3( n 1) ( n 2)( n 2 3) Negative kurtosis (flat: platykurtic) Normal distribution (zero kurtosis: mesokurtic) Positive kurtosis (pointed: leptokurtic) # o f p a r t i c i p a n t s # o f p a r t i c i p a n t s # o f p a r t i c i p a n t s % 10% 20% 30% 40% 50% 60% 70% 80% 90% 100% Participant scores 0 0% 10% 20% 30% 40% 50% 60% 70% 80% 90% 100% Participant scores 0 0% 10% 20% 30% 40% 50% 60% 70% 80% 90% 100% Participant scores Slide 37
38 Positive (pointed) Kurtosis Positive kurtosis (pointed: leptokurtic) # o f p a r t i c i p a n t s % 10% 20% 30% 40% 50% 60% 70% 80% 90% 100% Participant score s Slide 38
39 Negative (nearly flat) Kurtosis Negative kurtosis (flat: platykurtic) # o f p a r t i c i p a n t s % 10% 20% 30% 40% 50% 60% 70% 80% 90% 100% Participant score s Slide 39
40 Zero (normal) Kurtosis Normal distribution (zero kurtosis: mesokurtic) # o f p a r t i c i p a n t s % 10% 20% 30% 40% 50% 60% 70% 80% 90% 100% Participant score s Slide 40
 Range of values depends on scores Slide")
41 Mean (arithmetic) The most commonly used measure of central tendency (refers to the middle of a distribution of scores) Range of values depends on scores Slide 41

42 Median Another measure of central tendency, less sensitive than the mean to outliers Range of values depends on scores Where 50% of participants obtained higher scores and 50% of participants obtained lower scores Slide 42
43 Mode A third measure of central tendency, used a great deal in survey analysis The most common score in a distribution of scores Range of values depends on scores 34% 43% 56% 56% 56% 63% 67% 76% 88% Mode = 56% Slide 43

 or clustered toge")
 Range of values depends on scores Rick")
44 Standard deviation Participant s scores minus the mean gives a sense of the spread/variation The spread or variation of scores between participants of test scores Are the scores spread out (e.g., 0 to 100%) or clustered together (e.g., all scores between 55 and 62%) Range of values depends on scores Rick s test score = 75% Sally s test score = 83% Mark s test score = 53% Ella s test score = 91% Standard deviation = 16.36% Slide 44
45 Variance Another measure of variation The first step in calculating a standard deviation: The standard deviation is the square root of the variance Range of values depends on scores Used in some advanced calculations (e.g., Analysis of variance: ANOVA, Multiple analysis of variance: MANOVA) Slide 45
46 Standard Error of measurement The "spread" or standard deviation of test scores for a participant if that participant had been theoretically test is inversely assessed repeatedly using the same test related to Refers to the inherent error found surrounding reliability any test score observed test score = theoretical true score + error Related to test reliability (the more reliable the test the lower the standard error) Range is dependent on size of standard deviation (which is dependent on scores) and test reliability coefficient magnitude Slide 46 Typical range: 1 to 20 Hey what s this? It s reliability! The amount of error on a
47 Standard Error of measurement Product knowledge test Rick s observed score = 66.1% Theoretical test score = 65.2% Theoretical test score = 66.4% Theoretical test score = 63.7% Theoretical test score = 67.1% Theoretical test score = 65.8% Theoretical test score = 67.5% Theoretical test score = 65.9% Theoretical standard deviation = 1.26% 1.26% of error surrounding Rick s observed score Slide 47
48 Standard Error of the Mean Hey what s this? It s the number of Conceptually very similar to the standard participants who took the error of measurement but rather than test! The referring to error in an individual participant s more participants score, this refers to how much error there is the closer we in determining the true population mean get to a population The larger the sample size (i.e., number of participants) the smaller the standard error of the mean The more participants in a sample the greater likelihood that it approximates the population representation Slide 48
49 Standard Error of the Mean Sample (153 participants) Population (87,000 participants) # o f p a r t i c i p a n t s # o f p a r t i c i p a n t s % 10% 20% 30% 40% 50% 60% 70% 80% 90% 100% Participant scores 0 0% 10% 20% 30% 40% 50% 60% 70% 80% 90% 100% Participant scores Sample mean = 56.78% Sample standard deviation = 15.21% Standard error of mean = 1.23% within plus or minus 1 standard error of the mean value, 68 times out of 100, the true population mean will reside Slide 49 Typically the population information is not known, but if you could see the information Population true mean = %

50 Using the Test Analysis Report Table of test statistics and Topic level statistical breakdown Provides the statistical details for the overall assessment as well as at The the more topic the levels better Why? Because it is about internal consistency The lower the better (except skew, closer to 0 better) The higher the better The higher the better Slide 50
51 Using the Test Analysis Report Frequency distribution and Histogram Displays the assessment results in tabular form and graphically Middle line median, most scores are between percentiles Some higher scores some lower scores Slide 51 Data displayed graphically
52 The Results Management System (RMS) The Item Analysis Report and Test Analysis Report produce a snapshot of information in a static form What if you need/want to drop questions, change question scoring and see dynamically what the effects of making changes to your assessment results would be? Welcome to the RMS Slide 52
53 The Results Management System (RMS) New product, add-on to Questionmark Perception Review items in a test and drop, credit or alter scoring Review test results and define a pass or cut score Get a real-time preview of how proposed changes will impact overall item statistics and test reliability Publish results into a flat file database for access by reporting tools Maintain changes within an audit trail to aid assessment defensibility Slide 53


54 Results Management System Working Storage RMS Reporting Published Results 3 rd Party Reporting Tools Portfolios Data Warehouse Imports Results Results Management Published RMS Reports HR Database Questionmark Perception Reports Assessment Results Other Database Assessment Management System Slide 54

55 Drop or Credit Questions Review Item Difficulty Edit Angoff Estimate Borderline Item Discrimination Flagged Low Item Discrimination Flagged Real-time summary Slide 55 Distribute, Calculate, Save

56 Results Management System Demonstration (Why talk when we can show) Slide 56
57 Resources that can help Test Analysis Report guide: als/er/report_types/test_analysis.htm RMS user guide: x RMS and other white papers: x Training sessions: Creating Assessments That Get Results ( Slide 57
58 Summary Understanding some of the theory can help determine why questions are performing well or are not performing well Questionmark tools, such as the Item Analysis Report, Test Analysis Report, and Results Management System, provide the mechanisms to put theory into practice and get the most out of your assessments Applying (as much as possible) medium/high stakes standards to low stakes assessments will improve the information gleaned from Slide 58 assessments for all stakeholders
59 Closing Thank you very much for your time and interest Any questions? Slide 59
Measurement and Descriptive Statistics. Katie Rommel-Esham Education 604
 Measurement and Descriptive Statistics Katie Rommel-Esham Education 604 Frequency Distributions Frequency table # grad courses taken f 3 or fewer 5 4-6 3 7-9 2 10 or more 4 Pictorial Representations Frequency
Empowered by Psychometrics The Fundamentals of Psychometrics. Jim Wollack University of Wisconsin Madison
 Empowered by Psychometrics The Fundamentals of Psychometrics Jim Wollack University of Wisconsin Madison Psycho-what? Psychometrics is the field of study concerned with the measurement of mental and psychological
Interpreting the Item Analysis Score Report Statistical Information
 Interpreting the Item Analysis Score Report Statistical Information This guide will provide information that will help you interpret the statistical information relating to the Item Analysis Report generated
Describe what is meant by a placebo Contrast the double-blind procedure with the single-blind procedure Review the structure for organizing a memo
 Please note the page numbers listed for the Lind book may vary by a page or two depending on which version of the textbook you have. Readings: Lind 1 11 (with emphasis on chapters 10, 11) Please note chapter
Still important ideas
 Readings: OpenStax - Chapters 1 11 + 13 & Appendix D & E (online) Plous - Chapters 2, 3, and 4 Chapter 2: Cognitive Dissonance, Chapter 3: Memory and Hindsight Bias, Chapter 4: Context Dependence Still
VIEW: An Assessment of Problem Solving Style
 VIEW: An Assessment of Problem Solving Style 2009 Technical Update Donald J. Treffinger Center for Creative Learning This update reports the results of additional data collection and analyses for the VIEW
VARIABLES AND MEASUREMENT
 ARTHUR SYC 204 (EXERIMENTAL SYCHOLOGY) 16A LECTURE NOTES [01/29/16] VARIABLES AND MEASUREMENT AGE 1 Topic #3 VARIABLES AND MEASUREMENT VARIABLES Some definitions of variables include the following: 1.
Business Statistics Probability
 Business Statistics The following was provided by Dr. Suzanne Delaney, and is a comprehensive review of Business Statistics. The workshop instructor will provide relevant examples during the Skills Assessment
By Hui Bian Office for Faculty Excellence
 By Hui Bian Office for Faculty Excellence 1 Email: bianh@ecu.edu Phone: 328-5428 Location: 1001 Joyner Library, room 1006 Office hours: 8:00am-5:00pm, Monday-Friday 2 Educational tests and regular surveys
On the purpose of testing:
 Why Evaluation & Assessment is Important Feedback to students Feedback to teachers Information to parents Information for selection and certification Information for accountability Incentives to increase
Describe what is meant by a placebo Contrast the double-blind procedure with the single-blind procedure Review the structure for organizing a memo
 Business Statistics The following was provided by Dr. Suzanne Delaney, and is a comprehensive review of Business Statistics. The workshop instructor will provide relevant examples during the Skills Assessment
Contents. What is item analysis in general? Psy 427 Cal State Northridge Andrew Ainsworth, PhD
 Psy 427 Cal State Northridge Andrew Ainsworth, PhD Contents Item Analysis in General Classical Test Theory Item Response Theory Basics Item Response Functions Item Information Functions Invariance IRT
Introduction to Reliability
 Reliability Thought Questions: How does/will reliability affect what you do/will do in your future job? Which method of reliability analysis do you find most confusing? Introduction to Reliability What
Describe what is meant by a placebo Contrast the double-blind procedure with the single-blind procedure Review the structure for organizing a memo
 Please note the page numbers listed for the Lind book may vary by a page or two depending on which version of the textbook you have. Readings: Lind 1 11 (with emphasis on chapters 5, 6, 7, 8, 9 10 & 11)
Readings: Textbook readings: OpenStax - Chapters 1 11 Online readings: Appendix D, E & F Plous Chapters 10, 11, 12 and 14
 Readings: Textbook readings: OpenStax - Chapters 1 11 Online readings: Appendix D, E & F Plous Chapters 10, 11, 12 and 14 Still important ideas Contrast the measurement of observable actions (and/or characteristics)
Students will understand the definition of mean, median, mode and standard deviation and be able to calculate these functions with given set of
 Students will understand the definition of mean, median, mode and standard deviation and be able to calculate these functions with given set of numbers. Also, students will understand why some measures
Standard Scores. Richard S. Balkin, Ph.D., LPC-S, NCC
 Standard Scores Richard S. Balkin, Ph.D., LPC-S, NCC 1 Normal Distributions While Best and Kahn (2003) indicated that the normal curve does not actually exist, measures of populations tend to demonstrate
Still important ideas
 Readings: OpenStax - Chapters 1 13 & Appendix D & E (online) Plous Chapters 17 & 18 - Chapter 17: Social Influences - Chapter 18: Group Judgments and Decisions Still important ideas Contrast the measurement
Introduction to statistics Dr Alvin Vista, ACER Bangkok, 14-18, Sept. 2015
 Analysing and Understanding Learning Assessment for Evidence-based Policy Making Introduction to statistics Dr Alvin Vista, ACER Bangkok, 14-18, Sept. 2015 Australian Council for Educational Research Structure
Influences of IRT Item Attributes on Angoff Rater Judgments
 Influences of IRT Item Attributes on Angoff Rater Judgments Christian Jones, M.A. CPS Human Resource Services Greg Hurt!, Ph.D. CSUS, Sacramento Angoff Method Assemble a panel of subject matter experts
PRINCIPLES OF STATISTICS
 PRINCIPLES OF STATISTICS STA-201-TE This TECEP is an introduction to descriptive and inferential statistics. Topics include: measures of central tendency, variability, correlation, regression, hypothesis
3 CONCEPTUAL FOUNDATIONS OF STATISTICS
 3 CONCEPTUAL FOUNDATIONS OF STATISTICS In this chapter, we examine the conceptual foundations of statistics. The goal is to give you an appreciation and conceptual understanding of some basic statistical
Appendix B Statistical Methods
 Appendix B Statistical Methods Figure B. Graphing data. (a) The raw data are tallied into a frequency distribution. (b) The same data are portrayed in a bar graph called a histogram. (c) A frequency polygon
Construct Reliability and Validity Update Report
 Assessments 24x7 LLC DISC Assessment 2013 2014 Construct Reliability and Validity Update Report Executive Summary We provide this document as a tool for end-users of the Assessments 24x7 LLC (A24x7) Online
Results & Statistics: Description and Correlation. I. Scales of Measurement A Review
 Results & Statistics: Description and Correlation The description and presentation of results involves a number of topics. These include scales of measurement, descriptive statistics used to summarize
C-1: Variables which are measured on a continuous scale are described in terms of three key characteristics central tendency, variability, and shape.
 MODULE 02: DESCRIBING DT SECTION C: KEY POINTS C-1: Variables which are measured on a continuous scale are described in terms of three key characteristics central tendency, variability, and shape. C-2:
Measuring the User Experience
 Measuring the User Experience Collecting, Analyzing, and Presenting Usability Metrics Chapter 2 Background Tom Tullis and Bill Albert Morgan Kaufmann, 2008 ISBN 978-0123735584 Introduction Purpose Provide
Lesson 9 Presentation and Display of Quantitative Data
 Lesson 9 Presentation and Display of Quantitative Data Learning Objectives All students will identify and present data using appropriate graphs, charts and tables. All students should be able to justify
Readings: Textbook readings: OpenStax - Chapters 1 13 (emphasis on Chapter 12) Online readings: Appendix D, E & F
 Online readings: Appendix D, E & F") Readings: Textbook readings: OpenStax - Chapters 1 13 (emphasis on Chapter 12) Online readings: Appendix D, E & F Plous Chapters 17 & 18 Chapter 17: Social Influences Chapter 18: Group Judgments and Decisions
Readings: Textbook readings: OpenStax - Chapters 1 13 (emphasis on Chapter 12) Online readings: Appendix D, E & F Plous Chapters 17 & 18 Chapter 17: Social Influences Chapter 18: Group Judgments and Decisions
Statistics is the science of collecting, organizing, presenting, analyzing, and interpreting data to assist in making effective decisions
 Readings: OpenStax Textbook - Chapters 1 5 (online) Appendix D & E (online) Plous - Chapters 1, 5, 6, 13 (online) Introductory comments Describe how familiarity with statistical methods can - be associated
CHAPTER ONE CORRELATION
 CHAPTER ONE CORRELATION 1.0 Introduction The first chapter focuses on the nature of statistical data of correlation. The aim of the series of exercises is to ensure the students are able to use SPSS to
Comparability Study of Online and Paper and Pencil Tests Using Modified Internally and Externally Matched Criteria
 Comparability Study of Online and Paper and Pencil Tests Using Modified Internally and Externally Matched Criteria Thakur Karkee Measurement Incorporated Dong-In Kim CTB/McGraw-Hill Kevin Fatica CTB/McGraw-Hill
Analysis and Interpretation of Data Part 1
 Analysis and Interpretation of Data Part 1 DATA ANALYSIS: PRELIMINARY STEPS 1. Editing Field Edit Completeness Legibility Comprehensibility Consistency Uniformity Central Office Edit 2. Coding Specifying
Standard Deviation and Standard Error Tutorial. This is significantly important. Get your AP Equations and Formulas sheet
 Standard Deviation and Standard Error Tutorial This is significantly important. Get your AP Equations and Formulas sheet The Basics Let s start with a review of the basics of statistics. Mean: What most
Psychology 205, Revelle, Fall 2014 Research Methods in Psychology Mid-Term. Name:
 Name: 1. (2 points) What is the primary advantage of using the median instead of the mean as a measure of central tendency? It is less affected by outliers. 2. (2 points) Why is counterbalancing important
Chapter 2 Norms and Basic Statistics for Testing MULTIPLE CHOICE
 Chapter 2 Norms and Basic Statistics for Testing MULTIPLE CHOICE 1. When you assert that it is improbable that the mean intelligence test score of a particular group is 100, you are using. a. descriptive
 Page 1 of 11 Glossary of Terms Terms Clinical Cut-off Score: A test score that is used to classify test-takers who are likely to possess the attribute being measured to a clinically significant degree
Statistics: Interpreting Data and Making Predictions. Interpreting Data 1/50
 Statistics: Interpreting Data and Making Predictions Interpreting Data 1/50 Last Time Last time we discussed central tendency; that is, notions of the middle of data. More specifically we discussed the
Reliability and Validity checks S-005
 Reliability and Validity checks S-005 Checking on reliability of the data we collect Compare over time (test-retest) Item analysis Internal consistency Inter-rater agreement Compare over time Test-Retest
Chapter 7: Descriptive Statistics
 Chapter Overview Chapter 7 provides an introduction to basic strategies for describing groups statistically. Statistical concepts around normal distributions are discussed. The statistical procedures of
Statistics is the science of collecting, organizing, presenting, analyzing, and interpreting data to assist in making effective decisions
 Readings: OpenStax Textbook - Chapters 1 5 (online) Appendix D & E (online) Plous - Chapters 1, 5, 6, 13 (online) Introductory comments Describe how familiarity with statistical methods can - be associated
An Introduction to Research Statistics
 An Introduction to Research Statistics An Introduction to Research Statistics Cris Burgess Statistics are like a lamppost to a drunken man - more for leaning on than illumination David Brent (alias Ricky
15.301/310, Managerial Psychology Prof. Dan Ariely Recitation 8: T test and ANOVA
 15.301/310, Managerial Psychology Prof. Dan Ariely Recitation 8: T test and ANOVA Statistics does all kinds of stuff to describe data Talk about baseball, other useful stuff We can calculate the probability.
Ecological Statistics
 A Primer of Ecological Statistics Second Edition Nicholas J. Gotelli University of Vermont Aaron M. Ellison Harvard Forest Sinauer Associates, Inc. Publishers Sunderland, Massachusetts U.S.A. Brief Contents
SLEEP DISTURBANCE ABOUT SLEEP DISTURBANCE INTRODUCTION TO ASSESSMENT OPTIONS. 6/27/2018 PROMIS Sleep Disturbance Page 1
 SLEEP DISTURBANCE A brief guide to the PROMIS Sleep Disturbance instruments: ADULT PROMIS Item Bank v1.0 Sleep Disturbance PROMIS Short Form v1.0 Sleep Disturbance 4a PROMIS Short Form v1.0 Sleep Disturbance
Welcome to OSA Training Statistics Part II
 Welcome to OSA Training Statistics Part II Course Summary Using data about a population to draw graphs Frequency distribution and variability within populations Bell Curves: What are they and where do
CHAPTER 2. MEASURING AND DESCRIBING VARIABLES
 4 Chapter 2 CHAPTER 2. MEASURING AND DESCRIBING VARIABLES 1. A. Age: name/interval; military dictatorship: value/nominal; strongly oppose: value/ ordinal; election year: name/interval; 62 percent: value/interval;
Applied Statistical Analysis EDUC 6050 Week 4
 Applied Statistical Analysis EDUC 6050 Week 4 Finding clarity using data Today 1. Hypothesis Testing with Z Scores (continued) 2. Chapters 6 and 7 in Book 2 Review! = $ & '! = $ & ' * ) 1. Which formula
ABOUT PHYSICAL ACTIVITY
 PHYSICAL ACTIVITY A brief guide to the PROMIS Physical Activity instruments: PEDIATRIC PROMIS Pediatric Item Bank v1.0 Physical Activity PROMIS Pediatric Short Form v1.0 Physical Activity 4a PROMIS Pediatric
LANGUAGE TEST RELIABILITY On defining reliability Sources of unreliability Methods of estimating reliability Standard error of measurement Factors
 LANGUAGE TEST RELIABILITY On defining reliability Sources of unreliability Methods of estimating reliability Standard error of measurement Factors affecting reliability ON DEFINING RELIABILITY Non-technical
Quizzes (and relevant lab exercises): 20% Midterm exams (2): 25% each Final exam: 30%
: 20% Midterm exams (2): 25% each Final exam: 30%") 1 Intro to statistics Continued 2 Grading policy Quizzes (and relevant lab exercises): 20% Midterm exams (2): 25% each Final exam: 30% Cutoffs based on final avgs (A, B, C): 91-100, 82-90, 73-81 3 Numerical
1 Intro to statistics Continued 2 Grading policy Quizzes (and relevant lab exercises): 20% Midterm exams (2): 25% each Final exam: 30% Cutoffs based on final avgs (A, B, C): 91-100, 82-90, 73-81 3 Numerical
Item Analysis: Classical and Beyond
 Item Analysis: Classical and Beyond SCROLLA Symposium Measurement Theory and Item Analysis Modified for EPE/EDP 711 by Kelly Bradley on January 8, 2013 Why is item analysis relevant? Item analysis provides
Inferential Statistics
 Inferential Statistics and t - tests ScWk 242 Session 9 Slides Inferential Statistics Ø Inferential statistics are used to test hypotheses about the relationship between the independent and the dependent
Biostatistics. Donna Kritz-Silverstein, Ph.D. Professor Department of Family & Preventive Medicine University of California, San Diego
 Biostatistics Donna Kritz-Silverstein, Ph.D. Professor Department of Family & Preventive Medicine University of California, San Diego (858) 534-1818 dsilverstein@ucsd.edu Introduction Overview of statistical
Empirical Knowledge: based on observations. Answer questions why, whom, how, and when.
 INTRO TO RESEARCH METHODS: Empirical Knowledge: based on observations. Answer questions why, whom, how, and when. Experimental research: treatments are given for the purpose of research. Experimental group
MEANING AND PURPOSE. ADULT PEDIATRIC PARENT PROXY PROMIS Item Bank v1.0 Meaning and Purpose PROMIS Short Form v1.0 Meaning and Purpose 4a
 MEANING AND PURPOSE A brief guide to the PROMIS Meaning and Purpose instruments: ADULT PEDIATRIC PARENT PROXY PROMIS Item Bank v1.0 Meaning and Purpose PROMIS Short Form v1.0 Meaning and Purpose 4a PROMIS
Validity and reliability of measurements
 Validity and reliability of measurements 2 3 Request: Intention to treat Intention to treat and per protocol dealing with cross-overs (ref Hulley 2013) For example: Patients who did not take/get the medication
Development, Standardization and Application of
 American Journal of Educational Research, 2018, Vol. 6, No. 3, 238-257 Available online at http://pubs.sciepub.com/education/6/3/11 Science and Education Publishing DOI:10.12691/education-6-3-11 Development,
Using the Rasch Modeling for psychometrics examination of food security and acculturation surveys
 Using the Rasch Modeling for psychometrics examination of food security and acculturation surveys Jill F. Kilanowski, PhD, APRN,CPNP Associate Professor Alpha Zeta & Mu Chi Acknowledgements Dr. Li Lin,
PSYCHOLOGICAL STRESS EXPERIENCES
 PSYCHOLOGICAL STRESS EXPERIENCES A brief guide to the PROMIS Pediatric and Parent Proxy Report Psychological Stress Experiences instruments: PEDIATRIC PROMIS Pediatric Item Bank v1.0 Psychological Stress
Georgina Salas. Topics EDCI Intro to Research Dr. A.J. Herrera
 Homework assignment topics 51-63 Georgina Salas Topics 51-63 EDCI Intro to Research 6300.62 Dr. A.J. Herrera Topic 51 1. Which average is usually reported when the standard deviation is reported? The mean
Chapter 20: Test Administration and Interpretation
 Chapter 20: Test Administration and Interpretation Thought Questions Why should a needs analysis consider both the individual and the demands of the sport? Should test scores be shared with a team, or
The Psychometric Development Process of Recovery Measures and Markers: Classical Test Theory and Item Response Theory
 The Psychometric Development Process of Recovery Measures and Markers: Classical Test Theory and Item Response Theory Kate DeRoche, M.A. Mental Health Center of Denver Antonio Olmos, Ph.D. Mental Health
Smoking Social Motivations
 Smoking Social Motivations A brief guide to the PROMIS Smoking Social Motivations instruments: ADULT PROMIS Item Bank v1.0 Smoking Social Motivations for All Smokers PROMIS Item Bank v1.0 Smoking Social
Psychometrics for Beginners. Lawrence J. Fabrey, PhD Applied Measurement Professionals
 Psychometrics for Beginners Lawrence J. Fabrey, PhD Applied Measurement Professionals Learning Objectives Identify key NCCA Accreditation requirements Identify two underlying models of measurement Describe
Investigating the Invariance of Person Parameter Estimates Based on Classical Test and Item Response Theories
 Kamla-Raj 010 Int J Edu Sci, (): 107-113 (010) Investigating the Invariance of Person Parameter Estimates Based on Classical Test and Item Response Theories O.O. Adedoyin Department of Educational Foundations,
Introduction to Multilevel Models for Longitudinal and Repeated Measures Data
 Introduction to Multilevel Models for Longitudinal and Repeated Measures Data Today s Class: Features of longitudinal data Features of longitudinal models What can MLM do for you? What to expect in this
PÄIVI KARHU THE THEORY OF MEASUREMENT
 PÄIVI KARHU THE THEORY OF MEASUREMENT AGENDA 1. Quality of Measurement a) Validity Definition and Types of validity Assessment of validity Threats of Validity b) Reliability True Score Theory Definition
ANXIETY A brief guide to the PROMIS Anxiety instruments:
 ANXIETY A brief guide to the PROMIS Anxiety instruments: ADULT PEDIATRIC PARENT PROXY PROMIS Pediatric Bank v1.0 Anxiety PROMIS Pediatric Short Form v1.0 - Anxiety 8a PROMIS Item Bank v1.0 Anxiety PROMIS
Basic Statistics 01. Describing Data. Special Program: Pre-training 1
 Basic Statistics 01 Describing Data Special Program: Pre-training 1 Describing Data 1. Numerical Measures Measures of Location Measures of Dispersion Correlation Analysis 2. Frequency Distributions (Relative)
CHAPTER 3 DATA ANALYSIS: DESCRIBING DATA
 Data Analysis: Describing Data CHAPTER 3 DATA ANALYSIS: DESCRIBING DATA In the analysis process, the researcher tries to evaluate the data collected both from written documents and from other sources such
Item Analysis for Beginners
 Questionmark Conference 2018 Savannah A s s e s s f o r S u c c e s s Item Analysis for Beginners John Kleeman Questionmark Executive Director and Founder All rights reserved. Questionmark is a registered
PHYSICAL STRESS EXPERIENCES
 PHYSICAL STRESS EXPERIENCES A brief guide to the PROMIS Physical Stress Experiences instruments: PEDIATRIC PROMIS Pediatric Bank v1.0 - Physical Stress Experiences PROMIS Pediatric Short Form v1.0 - Physical
Unit 1 Exploring and Understanding Data
 Unit 1 Exploring and Understanding Data Area Principle Bar Chart Boxplot Conditional Distribution Dotplot Empirical Rule Five Number Summary Frequency Distribution Frequency Polygon Histogram Interquartile
FATIGUE. A brief guide to the PROMIS Fatigue instruments:
 FATIGUE A brief guide to the PROMIS Fatigue instruments: ADULT ADULT CANCER PEDIATRIC PARENT PROXY PROMIS Ca Bank v1.0 Fatigue PROMIS Pediatric Bank v2.0 Fatigue PROMIS Pediatric Bank v1.0 Fatigue* PROMIS
Readings: Textbook readings: OpenStax - Chapters 1 4 Online readings: Appendix D, E & F Online readings: Plous - Chapters 1, 5, 6, 13
 Readings: Textbook readings: OpenStax - Chapters 1 4 Online readings: Appendix D, E & F Online readings: Plous - Chapters 1, 5, 6, 13 Introductory comments Describe how familiarity with statistical methods
Theory. = an explanation using an integrated set of principles that organizes observations and predicts behaviors or events.
 Definition Slides Hindsight Bias = the tendency to believe, after learning an outcome, that one would have foreseen it. Also known as the I knew it all along phenomenon. Critical Thinking = thinking that
Statistical Significance, Effect Size, and Practical Significance Eva Lawrence Guilford College October, 2017
 Statistical Significance, Effect Size, and Practical Significance Eva Lawrence Guilford College October, 2017 Definitions Descriptive statistics: Statistical analyses used to describe characteristics of
COGNITIVE FUNCTION. PROMIS Pediatric Item Bank v1.0 Cognitive Function PROMIS Pediatric Short Form v1.0 Cognitive Function 7a
 COGNITIVE FUNCTION A brief guide to the PROMIS Cognitive Function instruments: ADULT PEDIATRIC PARENT PROXY PROMIS Item Bank v1.0 Applied Cognition - Abilities* PROMIS Item Bank v1.0 Applied Cognition
Examining the Psychometric Properties of The McQuaig Occupational Test
 Examining the Psychometric Properties of The McQuaig Occupational Test Prepared for: The McQuaig Institute of Executive Development Ltd., Toronto, Canada Prepared by: Henryk Krajewski, Ph.D., Senior Consultant,
How Lertap and Iteman Flag Items
 How Lertap and Iteman Flag Items Last updated on 24 June 2012 Larry Nelson, Curtin University This little paper has to do with two widely-used programs for classical item analysis, Iteman and Lertap. I
Practice-Based Research for the Psychotherapist: Research Instruments & Strategies Robert Elliott University of Strathclyde
 Practice-Based Research for the Psychotherapist: Research Instruments & Strategies Robert Elliott University of Strathclyde Part 1: Outcome Monitoring: CORE Outcome Measure 1 A Psychological Ruler Example
Never P alone: The value of estimates and confidence intervals
 Never P alone: The value of estimates and confidence Tom Lang Tom Lang Communications and Training International, Kirkland, WA, USA Correspondence to: Tom Lang 10003 NE 115th Lane Kirkland, WA 98933 USA
ABOUT SMOKING NEGATIVE PSYCHOSOCIAL EXPECTANCIES
 Smoking Negative Psychosocial Expectancies A brief guide to the PROMIS Smoking Negative Psychosocial Expectancies instruments: ADULT PROMIS Item Bank v1.0 Smoking Negative Psychosocial Expectancies for
Designing Psychology Experiments: Data Analysis and Presentation
 Data Analysis and Presentation Review of Chapter 4: Designing Experiments Develop Hypothesis (or Hypotheses) from Theory Independent Variable(s) and Dependent Variable(s) Operational Definitions of each
Observer OPTION 5 Manual
 Observer OPTION 5 Manual Measuring shared decision making by assessing recordings or transcripts of encounters from clinical settings. Glyn Elwyn, Stuart W Grande, Paul Barr The Dartmouth Institute for
Stats 95. Statistical analysis without compelling presentation is annoying at best and catastrophic at worst. From raw numbers to meaningful pictures
 Stats 95 Statistical analysis without compelling presentation is annoying at best and catastrophic at worst. From raw numbers to meaningful pictures Stats 95 Why Stats? 200 countries over 200 years http://www.youtube.com/watch?v=jbksrlysojo
INTRODUCTION TO ASSESSMENT OPTIONS
 ASTHMA IMPACT A brief guide to the PROMIS Asthma Impact instruments: PEDIATRIC PROMIS Pediatric Item Bank v2.0 Asthma Impact PROMIS Pediatric Item Bank v1.0 Asthma Impact* PROMIS Pediatric Short Form v2.0
Chapter 2--Norms and Basic Statistics for Testing
 Chapter 2--Norms and Basic Statistics for Testing Student: 1. Statistical procedures that summarize and describe a series of observations are called A. inferential statistics. B. descriptive statistics.
EVALUATING AND IMPROVING MULTIPLE CHOICE QUESTIONS
 DePaul University INTRODUCTION TO ITEM ANALYSIS: EVALUATING AND IMPROVING MULTIPLE CHOICE QUESTIONS Ivan Hernandez, PhD OVERVIEW What is Item Analysis? Overview Benefits of Item Analysis Applications Main
Collecting & Making Sense of
 Collecting & Making Sense of Quantitative Data Deborah Eldredge, PhD, RN Director, Quality, Research & Magnet Recognition i Oregon Health & Science University Margo A. Halm, RN, PhD, ACNS-BC, FAHA Director,
Analysis of the Reliability and Validity of an Edgenuity Algebra I Quiz
 Analysis of the Reliability and Validity of an Edgenuity Algebra I Quiz This study presents the steps Edgenuity uses to evaluate the reliability and validity of its quizzes, topic tests, and cumulative
Item Response Theory. Steven P. Reise University of California, U.S.A. Unidimensional IRT Models for Dichotomous Item Responses
 Item Response Theory Steven P. Reise University of California, U.S.A. Item response theory (IRT), or modern measurement theory, provides alternatives to classical test theory (CTT) methods for the construction,
Do not write your name on this examination all 40 best
 Student #: Do not write your name on this examination Research in Psychology I; Final Exam Fall 200 Instructor: Jeff Aspelmeier NOTE: THIS EXAMINATION MAY NOT BE RETAINED BY STUDENTS This exam is worth
HS Exam 1 -- March 9, 2006
 Please write your name on the back. Don t forget! Part A: Short answer, multiple choice, and true or false questions. No use of calculators, notes, lab workbooks, cell phones, neighbors, brain implants,
Techniques for Explaining Item Response Theory to Stakeholder
 Techniques for Explaining Item Response Theory to Stakeholder Kate DeRoche Antonio Olmos C.J. Mckinney Mental Health Center of Denver Presented on March 23, 2007 at the Eastern Evaluation Research Society
A Comparison of Several Goodness-of-Fit Statistics
 A Comparison of Several Goodness-of-Fit Statistics Robert L. McKinley The University of Toledo Craig N. Mills Educational Testing Service A study was conducted to evaluate four goodnessof-fit procedures
Introduction to Multilevel Models for Longitudinal and Repeated Measures Data
 Introduction to Multilevel Models for Longitudinal and Repeated Measures Data Today s Class: Features of longitudinal data Features of longitudinal models What can MLM do for you? What to expect in this
ISC- GRADE XI HUMANITIES ( ) PSYCHOLOGY. Chapter 2- Methods of Psychology
 PSYCHOLOGY. Chapter 2- Methods of Psychology") ISC- GRADE XI HUMANITIES (2018-19) PSYCHOLOGY Chapter 2- Methods of Psychology OUTLINE OF THE CHAPTER (i) Scientific Methods in Psychology -observation, case study, surveys, psychological tests, experimentation
ISC- GRADE XI HUMANITIES (2018-19) PSYCHOLOGY Chapter 2- Methods of Psychology OUTLINE OF THE CHAPTER (i) Scientific Methods in Psychology -observation, case study, surveys, psychological tests, experimentation