Welcome to OSA Training Statistics Part II
|
|
|
- Willis Bond
- 5 years ago
- Views:
Transcription

1 Welcome to OSA Training Statistics Part II
2 Course Summary Using data about a population to draw graphs Frequency distribution and variability within populations Bell Curves: What are they and where do we see them? Normal distribution Skewness in Curves Interpreting bell curves by their mean, variance, and standard deviation Inter-Quartile range Understanding and calculating Z scores Proportion: Calculating the area under the curve Correlation: What is the relationship between two variables? 2
3 Using data to draw graphs about a population A statistic is a way to represent or organize information in a way that helps you understand it better than simply looking at a series of numbers. You can use a set of data to draw a picture that will help you to understand and interpret that data. 3
4 Using Data to Draw Graphs: In-Class Exercise of Height Frequency Distribution Instructions: Fill in the graph according to the results in class. Frequency Distribution of Women s Height # of people (frequency) under 4'10" 4'10" 4'11" 5'0" 5'1" 5'2" 5'3" 5'4" 5'5" 5'6" 5'7" 5'8" 5'9" 5'10" height (the variable) over 5'10" 4
5 Using Data to Draw Graphs: In-Class Exercise of Height Frequency Distribution Instructions: Fill in the graph according to the results in class. Frequency Distribution of Men s Height # of people (frequency) under 5'3" 5'3" 5'4" 5'5" 5'6" 5'7" 5'8" 5'9" 5'10" 5'11" 6'0" 6'1" 6'2" 6'3" height (the variable) over 6'3" 5
6 Example: Height distribution among a group of 55 women The X axis (horizontal) refers to the variable, or the observation value that you are looking at in a population. The Y axis (vertical) reflects the frequency, or the number of times a particular value of X appears in a population. Example of the Frequency Distribution of Women s Height 10 # of people (frequency) under 4'10" 4'10" 4'11" 5'0" 5'1" 5'2" 5'3" 5'4" 5'5" 5'6" 5'7" 5'8" 5'9" 5'10" over 5'10" height (the variable) 6
7 Properties of Populations Population A population is any group whose characteristics you look at. A population is different from a sample, which is a small portion of the population used to generalize about the whole population. Central Tendency Large populations often tend to cluster towards their middle, or average, which is also known as the mean. Variability In large populations, there is often a lot of diversity. For example, people come in a variety of heights and weights. 7


8 Example: The Hungry Softball Team Situation A softball team has just won a game. All 20 players on the team the population have gone to eat pizza. Graph A simple graph shows how many slices each of the 20 team members ate. For example, four people ate 5 slices of pizza, while only one person ate 8 slices. 8
9 Example: The Hungry Softball Team Graph A line shows how you could draw a simple graph using the tops of the heads of each group of players. 9
10 Example: The Hungry Softball Team Graph This graph is a simplification of how you could graph pizza slices eaten into a bell curve. 10
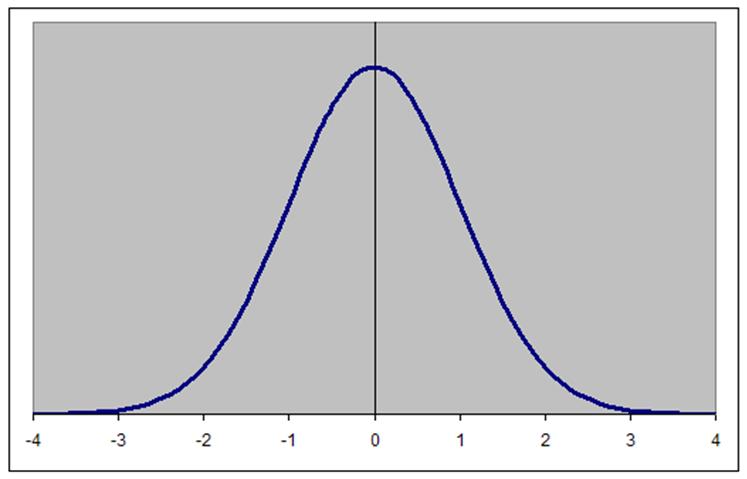
11 Bell Curves: What are they? Basic Properties The Bell Curve A bell curve is a very special kind of curve with unique properties. It is shaped like a bell. Also called a normal curve or normal distribution, it shows how frequently different values recur in a population. It is symmetric and has a single peak at its mean. Its unique properties make it very useful in making statistical calculations. 11
12 Bell Curves: Where do we see them? Normal distributions occur often, especially when a large group of data is concerned. Examples: Height Weight SAT scores IQ 12

13 Bell Curves: Where do we see them? Example: fish size This diagram illustrates how MOST fish in a given species fall pretty close to the average Very small or large fish called outliers because of their uncommon size are much more rare and show up on one end of the bell curve. 13
14 Bell Curves: Mean Mean The mean shows the average of all the values in a population. Mean = Addition of all the observations together # of observations 14

15 The Mean 15
16 The Mean Continued The arithmetic mean is a simple type of average. Suppose you want to know what your numerical average is in your math class. Let's say your grades so far are 80, 90, 92, and 78 on the four quizzes you have had. 16
17 The Mean Continued = 340 Then divide that answer by the number of grades that you started with, four: 340 / 4 = 85 So, your quiz average is 85! Whenever you want to find a mean, just add up all the numbers and divide by however many numbers you started with. 17
18 On Average.. The Mode a measure of the most frequently seen observation Q: What is the mode gender of the class? 2, 4, 6, 0, 4, 1, 4, 18
19 On Average. Median reflects the middle ranked value when observations are ordered least to greatest or vice versa 2, 2, 6, 7, 8 1, 3, 3, 8, 8, 9 median median 3+8/2=5.5 19
20 The skew of a distribution refers to how the curve leans. When a curve has extreme scores on the right hand side of the distribution, it is said to be positively skewed. In other words, when high numbers are added to an otherwise normal distribution, the curve gets pulled in an upward or positive direction. When the curve is pulled downward by extreme low scores, it is said to be negatively skewed. The more skewed a distribution is, the more difficult it is to interpret. 1 1 Text from: 20
21 Bell Curves: Variance Variance A measure of the variability of the population described by a bell curve. Calculated by adding together the square of the difference between EACH observation and the mean 21
22 When you measure variability you are measuring the amount of difference among observations in a distribution such as differences in height among men. When you are looking at Standard Deviations you are asking how different is this observation from the mean. If the average height of women is 5 4 and Helen is 5 0 how far does she deviate from the mean? 22

23 Bell Curves Variance 23
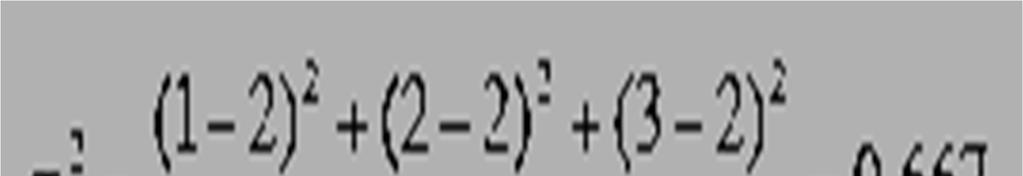
24 Variance cont d.. The variance is computed as the average squared deviation of each number from its mean. For example, for the numbers 1, 2, and 3, the mean is 2 (Population M=2) and the variance is: 24
25 Variance Calculation 25
 It s a way of")

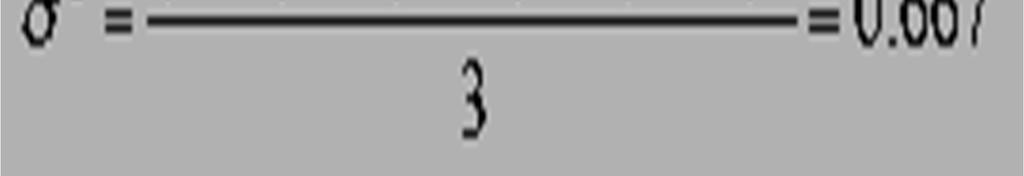
26 Bell Curves: Standard Deviation Standard Deviation A rough measure of the average amount by which observations deviate on either side of their means (Witte & Witte, 2001) It s a way of measuring how far any observation is from the mean. In precise terms, it s the square root of the variance. One standard deviation from the mean; Z = -1 Two standard deviations from the mean; Z = 2 26
27 Standard Deviation cont d The square root of the variance is the standard deviation. 27


28 Standard Deviation Formula 28
29 Checking for Understanding Two corporations hired 10 graduates. The starting salaries for each are shown in thousands of dollars. Find the deviation for the starting salaries of each corporation. Corp A Salary Corp B Salary
30 Inter-Quartile Range The inter-quartile range (IQR), measures the spread of the inner 50% of a data set. Steps to find the IQR: Find Q 2 -the median Find Q 1 -the median of the lower half Find Q 3 -the median of the upper half IQR = Q 3 Q 1 30
31 Checking for Understanding Find the inter-quartile range for each corporation below. Which corporation seems to have fairer starting salaries? Explain Corp A Salary Corp B Salary
32 Bell Curves: What are they? Advanced Properties They extend approximately 3 standard deviations above and below the mean. They have a total area under the curve of 1.00 (100%). The mean, median, and mode of a normal distribution are identical and fall exactly in the center of the curve. Do IQ s 32

33 Z Scores: What are they? Z-scores are a way to convert real data in the world into a form that fits on a bell curve. This only works if you have a normal distribution to begin with. IQ is a very standard example of a normal distribution that can be easily converted to Z scores. 33
34 Z-Scores: What are they? Mean and Standard Deviation The mean always has a z-score of 0. Other scores are converted to z-scores by their distance from the mean how many standard deviations they are from the mean. The standard deviation is always equal to 1. Example 1: z-score of -2 means that the value of an observation is two standard deviations from the mean (left). Example 2: If a person s height is one standard deviation above the mean, the z-score for his or her height is equal to one (right). 34
35 Z-Scores: How to Calculate Them This bell curve reflects IQ (intelligence quotient). For IQ, the mean equals 100 and the standard deviation equals 15. Z-score = Observation Value Mean Standard Deviation 35
36 Z-Scores Find the z-score corresponding to a raw score of 130 from a normal distribution with mean 100 and standard deviation 15. Z-score = Observation Value Mean Standard Deviation 36
37 Z-Scores /15 = 2 37
38 Z-Scores With an IQ score of 80 and a mean of 100, with a standard deviation of 15 what is the z-score? 38
39 Z-Scores =
40 Real Data Compared with Z-Scores: Example The diagram below illustrates how you convert real numbers or raw values into z-scores. This example has a mean of 110 and standard deviation of 25. Again, when you have a normal ( bell ) curve, you can always convert the numbers so that the mean is 0 and a standard deviation is equal to 1. 40
41 Proportion The area under a bell curve tells you what percentage of ALL observations fall within that area. The total area under a bell curve is always equal to 1, or 100%. 41


42 Proportion Example: The Hungry Softball Team Redux Definition of Proportion Think of proportion as counting the number of observations that would fit under a certain part of the curve. Height of Curve 42
43 Proportion: Properties of All Normal Distributions 68% of observations fall within 1 standard deviation of the mean (34% on either side) 95% of observations fall within 2 standard deviations of the mean (47.5% on either side) 99% of observations fall within 3 standard deviations of the means (49.5% on either side) 43
44 Proportion: Example 0.45 Height of Curve % of observations fall to the right of the Z score of % fall to the left of it Standardized Score (Z-score) 44
45 Proportion Except at the mean, percentages are not pretty numbers (an even multiple of 10) when you have a whole number z-score Similarly, the z-score is usually not a pretty whole number when you have a pretty percentage. 45
46 Correlation: What is the relationship between two variables? Overview Up to this point, the discussion has been focused on bell curves. Bell curves only really measure the distribution of one variable within a population. Correlation, by contrast, refers to the relationship between TWO variables within a population. 46
47 Correlation: What is the relationship between two variables? Direction Positive correlation: When you see an increase in one variable, you also tend to see an increase in the other variable. Example: Income and SAT scores. As income rises, so, too, do SAT scores tend to rise for students. Negative correlation: When you see an increase in one variable, you tend to see a decrease in the other variable. Example: alcohol consumption and manual dexterity. As the number of drinks someone has rises, his or her score on a manual dexterity test will tend to fall. No relationship: The two variables do not affect each other at all. Example: Ice cream consumption and shark attacks. Intensity ( r ) How strong is the relationship between two variables? Values of r = 1 or r = -1 are the strongest, while r= 0 is the weakest. 47
48 Types of Correlation positive correlation no relationship negative correlation 48
49 Correlation vs. Causation: Being Cautious with Conclusions One common mistake is made by people interpreting a correlation as meaning that one thing causes another thing. When we see that depression and self-esteem are negatively correlated, we often surmise that depression must therefore cause the decrease in self-esteem. When contemplating this, consider the following correlations that have been found in research: Positive correlation between ice cream consumption and drownings Positive correlation between ice cream consumption and murder Positive correlation between ice cream consumption and boating accidents Positive correlation between ice cream consumption and shark attacks 49
50 Correlation If we were to assume that every correlation represents a causal relationship then ice cream would most certainly be banned due to the devastating effects it has on society. Does ice-cream consumption cause people to drown? Does ice cream lead to murder? The truth is that often two variables are related only because of a third variable that is not accounted for within the statistic. In this case, the weather is this third variable because as the weather gets warmer, people tend to consume more ice cream. Warmer weather also results in an increase in swimming and boating and therefore increased drownings, boating accidents, and shark attacks. 50
51 Correlation vs. Causation: Conclusions So looking back at the positive correlation between depression and self-esteem, it could be that depression causes self-esteem to go down, or that low self-esteem results in depression, or that a third variable causes the change in both. When looking at a correlation, be sure to recognize that the variables may be related but that it in no way implies that the change in one causes the change in the other. 2 2 Correlation notes taken from from the following web site: 51
52 Notes 52
53 Practice Questions Take out your handouts Even numbers will be done in class. Odd numbers are left for you the students to practice with at home. Feel free to get addresses from your instructor before you leave if you would like confirmation on your homework answers. 53
54 Practice Question 1 1.A doctor wants to test the effectiveness of a new drug on her patients. She separates her sample of patients into two groups and administers the drug to only one of these groups. She then compares the results. Which type of study best describes this situation? A) census B) survey C) observation D) controlled experiment 54
55 Practice Question 2 Decide on a method of data collection you would use for each study. Explain A) A study on the effect of low dietary intake of vitamin C and iron on lead levels in adults. 2) The age of people living within 500 miles of your home. 55
56 Practice Question 3 Frequency Distributions and Statistical Graphs The following set of data is a sample of scores on a civil service exam: 58, 79, 81, 99, 68, 92, 76, 84, 53, 57, 81, 91, 77, 50, 65, 57, 51, 72, 84, 89 56
57 Practice Question 4 (a) Complete the frequency distribution below for the data. Classes/Intervals Frequencies Cumulative Frequencies
58 Practice Question 5 Inter-Quartile Range The test scores for 15 employees enrolled in a CPR training course are listed. 13, 9, 18, 15, 14, 21, 7, 10, 11, 20, 5, 18, 37, 16, 17 Find the first, second, and third quartiles of the test scores. 58
59 Practice Question 6 Two corporations hired 10 graduates. The starting salaries for each are shown in thousands of dollars. Find the deviation for the starting salaries of each corporation. Corp A Salary Corp B Salary A )Find the inter quartile range for the starting salaries of the two corporations above. B) Based on your answer to parts (a) & (b), which corporation seems fairer with regards to starting salaries? Explain 59
60 Practice Question 7 A study shows that 80% of the selling prices for houses in an area are within two standard deviations of the mean. Is this a normal distribution? Explain. 60
61 Practice Question 8 The mean price of houses in Canarsie BK is $482,156, with a standard deviation of $30,000. The data set has a bell shaped distribution. Between what two prices do 95% of the houses fall? 61
62 Practice Question 9 On a standardized test, Cathy had a score of 74, which was exactly 1 standard deviation below the mean. If the standard deviation for the test is 6, what is the mean score for the test? A) 68 B) 71 C) 77 D) 80 62

63 Practice Question 10 In the accompanying diagram, about 68% of the scores fall within the shaded area, which is symmetric about the mean,. The distribution is normal and the scores in the shaded area range from 50 to 80. What is the standard deviation of the scores in this distribution? 63
64 Practice Question 11 64
65 Practice Question 12 On a standardized test with normal distribution, the mean is 75 and the standard deviation is 6. If 1200 students took the test, approximately how many students would be expected to score between 69 and 81? A) 408 B) 600 C) 816 D)
66 Practice Question 13 Lester, a statistician, measured the mean speed of vehicles on the Belt highway at 7:30am and got 56mph with a standard deviation of 4mph. Amanda, a highway patrol clocks three cars with speeds of 62mph, 42mph and 56mph at the same time. (a) Find the z-scores for each speed (b) Which speed should be issued a ticket? Explain 66
67 Practice Question 14 On Kyana s statistics test, the mean score was 79 with a standard dev of 7. On her ELA test the mean was 43 with a standard dev 3. Determine which test Kyana performed better on comparatively with respect to her peers: 67
68 Practice Question 15 Jim's score on a national math assessment exceeded the scores of 95,000 of the 125,000 students who took the assessment. What was Jim s percentile rank? 68
69 Practice Question 16 In a New York City high school, a survey revealed the mean amount of cola consumed each week was 12 bottles and the standard deviation was 2.8 bottles. Assuming the survey represents a normal distribution, how many bottles of cola per week will approximately 68.2% of the students drink? A) 6.4 to 12 B) 6.4 to 17.6 C) 9.2 to 14.8 D) 12 to
70 Practice Question 17 The number of minutes students took to complete a quiz is summarized in the table below. If the mean number of minutes was 17, which equation could be used to calculate the value of x? 1) 3) 2) 4) 70
71 Practice Question 18 The air conditioner priced at $480 is discontinued at a local department store. What is the median price of the remaining air conditioners? $500, $840, $470, $480, $420, $440, $440 71
72 Sources/Additional Resources Basic explanation of bell curves: tions.html Understanding Proportions: 7.html Basic explanation and proportions: 40/normalcurves.htm 72
Chapter 2--Norms and Basic Statistics for Testing
 Chapter 2--Norms and Basic Statistics for Testing Student: 1. Statistical procedures that summarize and describe a series of observations are called A. inferential statistics. B. descriptive statistics.
Results & Statistics: Description and Correlation. I. Scales of Measurement A Review
 Results & Statistics: Description and Correlation The description and presentation of results involves a number of topics. These include scales of measurement, descriptive statistics used to summarize
Chapter 2 Norms and Basic Statistics for Testing MULTIPLE CHOICE
 Chapter 2 Norms and Basic Statistics for Testing MULTIPLE CHOICE 1. When you assert that it is improbable that the mean intelligence test score of a particular group is 100, you are using. a. descriptive
Students will understand the definition of mean, median, mode and standard deviation and be able to calculate these functions with given set of
 Students will understand the definition of mean, median, mode and standard deviation and be able to calculate these functions with given set of numbers. Also, students will understand why some measures
Further Mathematics 2018 CORE: Data analysis Chapter 3 Investigating associations between two variables
 Chapter 3: Investigating associations between two variables Further Mathematics 2018 CORE: Data analysis Chapter 3 Investigating associations between two variables Extract from Study Design Key knowledge
M 140 Test 1 A Name SHOW YOUR WORK FOR FULL CREDIT! Problem Max. Points Your Points Total 60
 M 140 Test 1 A Name SHOW YOUR WORK FOR FULL CREDIT! Problem Max. Points Your Points 1-10 10 11 3 12 4 13 3 14 10 15 14 16 10 17 7 18 4 19 4 Total 60 Multiple choice questions (1 point each) For questions
STT315 Chapter 2: Methods for Describing Sets of Data - Part 2
 Chapter 2.5 Interpreting Standard Deviation Chebyshev Theorem Empirical Rule Chebyshev Theorem says that for ANY shape of data distribution at least 3/4 of all data fall no farther from the mean than 2
Descriptive Statistics Lecture
 Definitions: Lecture Psychology 280 Orange Coast College 2/1/2006 Statistics have been defined as a collection of methods for planning experiments, obtaining data, and then analyzing, interpreting and
(a) 50% of the shows have a rating greater than: impossible to tell
 50% of the shows have a rating greater than: impossible to tell") q 1. Here is a histogram of the Distribution of grades on a quiz. How many students took the quiz? What percentage of students scored below a 60 on the quiz? (Assume left-hand endpoints are included in
q 1. Here is a histogram of the Distribution of grades on a quiz. How many students took the quiz? What percentage of students scored below a 60 on the quiz? (Assume left-hand endpoints are included in
Biostatistics. Donna Kritz-Silverstein, Ph.D. Professor Department of Family & Preventive Medicine University of California, San Diego
 Biostatistics Donna Kritz-Silverstein, Ph.D. Professor Department of Family & Preventive Medicine University of California, San Diego (858) 534-1818 dsilverstein@ucsd.edu Introduction Overview of statistical
4.3 Measures of Variation
 4.3 Measures of Variation! How much variation is there in the data?! Look for the spread of the distribution.! What do we mean by spread? 1 Example Data set:! Weight of contents of regular cola (grams).
Empirical Rule ( rule) applies ONLY to Normal Distribution (modeled by so called bell curve)
 applies ONLY to Normal Distribution (modeled by so called bell curve)") Chapter 2.5 Interpreting Standard Deviation Chebyshev Theorem Empirical Rule Chebyshev Theorem says that for ANY shape of data distribution at least 3/4 of all data fall no farther from the mean than 2
Chapter 2.5 Interpreting Standard Deviation Chebyshev Theorem Empirical Rule Chebyshev Theorem says that for ANY shape of data distribution at least 3/4 of all data fall no farther from the mean than 2
(a) 50% of the shows have a rating greater than: impossible to tell
 50% of the shows have a rating greater than: impossible to tell") KEY 1. Here is a histogram of the Distribution of grades on a quiz. How many students took the quiz? 15 What percentage of students scored below a 60 on the quiz? (Assume left-hand endpoints are included
KEY 1. Here is a histogram of the Distribution of grades on a quiz. How many students took the quiz? 15 What percentage of students scored below a 60 on the quiz? (Assume left-hand endpoints are included
Standard Deviation and Standard Error Tutorial. This is significantly important. Get your AP Equations and Formulas sheet
 Standard Deviation and Standard Error Tutorial This is significantly important. Get your AP Equations and Formulas sheet The Basics Let s start with a review of the basics of statistics. Mean: What most
Lesson 9 Presentation and Display of Quantitative Data
 Lesson 9 Presentation and Display of Quantitative Data Learning Objectives All students will identify and present data using appropriate graphs, charts and tables. All students should be able to justify
Averages and Variation
 Chapter 3 Averages and Variation Name Section 3.1 Measures of Central Tendency: Mode, Median, and Mean Objective: In this lesson you learned how to compute, interpret, and explain mean, median, and mode.
3 CONCEPTUAL FOUNDATIONS OF STATISTICS
 3 CONCEPTUAL FOUNDATIONS OF STATISTICS In this chapter, we examine the conceptual foundations of statistics. The goal is to give you an appreciation and conceptual understanding of some basic statistical
CHAPTER 3 DATA ANALYSIS: DESCRIBING DATA
 Data Analysis: Describing Data CHAPTER 3 DATA ANALYSIS: DESCRIBING DATA In the analysis process, the researcher tries to evaluate the data collected both from written documents and from other sources such
Statistics: Making Sense of the Numbers
 Statistics: Making Sense of the Numbers Chapter 9 This multimedia product and its contents are protected under copyright law. The following are prohibited by law: any public performance or display, including
Stats 95. Statistical analysis without compelling presentation is annoying at best and catastrophic at worst. From raw numbers to meaningful pictures
 Stats 95 Statistical analysis without compelling presentation is annoying at best and catastrophic at worst. From raw numbers to meaningful pictures Stats 95 Why Stats? 200 countries over 200 years http://www.youtube.com/watch?v=jbksrlysojo
Outline. Practice. Confounding Variables. Discuss. Observational Studies vs Experiments. Observational Studies vs Experiments
 1 2 Outline Finish sampling slides from Tuesday. Study design what do you do with the subjects/units once you select them? (OI Sections 1.4-1.5) Observational studies vs. experiments Descriptive statistics
CHAPTER 3 Describing Relationships
 CHAPTER 3 Describing Relationships 3.1 Scatterplots and Correlation The Practice of Statistics, 5th Edition Starnes, Tabor, Yates, Moore Bedford Freeman Worth Publishers Reading Quiz 3.1 True/False 1.
Analysis and Interpretation of Data Part 1
 Analysis and Interpretation of Data Part 1 DATA ANALYSIS: PRELIMINARY STEPS 1. Editing Field Edit Completeness Legibility Comprehensibility Consistency Uniformity Central Office Edit 2. Coding Specifying
CHAPTER 2. MEASURING AND DESCRIBING VARIABLES
 4 Chapter 2 CHAPTER 2. MEASURING AND DESCRIBING VARIABLES 1. A. Age: name/interval; military dictatorship: value/nominal; strongly oppose: value/ ordinal; election year: name/interval; 62 percent: value/interval;
Chapter 7: Descriptive Statistics
 Chapter Overview Chapter 7 provides an introduction to basic strategies for describing groups statistically. Statistical concepts around normal distributions are discussed. The statistical procedures of
Department of Statistics TEXAS A&M UNIVERSITY STAT 211. Instructor: Keith Hatfield
 Department of Statistics TEXAS A&M UNIVERSITY STAT 211 Instructor: Keith Hatfield 1 Topic 1: Data collection and summarization Populations and samples Frequency distributions Histograms Mean, median, variance
c. Construct a boxplot for the data. Write a one sentence interpretation of your graph.
 STAT 280 Sample Test Problems Page 1 of 1 1. An English survey of 3000 medical records showed that smokers are more inclined to get depressed than non-smokers. Does this imply that smoking causes depression?
Business Statistics Probability
 Business Statistics The following was provided by Dr. Suzanne Delaney, and is a comprehensive review of Business Statistics. The workshop instructor will provide relevant examples during the Skills Assessment
Describe what is meant by a placebo Contrast the double-blind procedure with the single-blind procedure Review the structure for organizing a memo
 Please note the page numbers listed for the Lind book may vary by a page or two depending on which version of the textbook you have. Readings: Lind 1 11 (with emphasis on chapters 10, 11) Please note chapter
Math 214 REVIEW SHEET EXAM #1 Exam: Wednesday March, 2007
 Math 214 REVIEW SHEET EXAM #1 Exam: Wednesday March, 2007 THOUGHT QUESTIONS: 1. Suppose you are interested in determining if women are safer drivers than men in New York. Can you go to the Dept. of Motor
Still important ideas
 Readings: OpenStax - Chapters 1 11 + 13 & Appendix D & E (online) Plous - Chapters 2, 3, and 4 Chapter 2: Cognitive Dissonance, Chapter 3: Memory and Hindsight Bias, Chapter 4: Context Dependence Still
SAMPLE ASSESSMENT TASKS MATHEMATICS ESSENTIAL GENERAL YEAR 11
 SAMPLE ASSESSMENT TASKS MATHEMATICS ESSENTIAL GENERAL YEAR 11 Copyright School Curriculum and Standards Authority, 2014 This document apart from any third party copyright material contained in it may be
LOTS of NEW stuff right away 2. The book has calculator commands 3. About 90% of technology by week 5
 1.1 1. LOTS of NEW stuff right away 2. The book has calculator commands 3. About 90% of technology by week 5 1 Three adventurers are in a hot air balloon. Soon, they find themselves lost in a canyon in
C-1: Variables which are measured on a continuous scale are described in terms of three key characteristics central tendency, variability, and shape.
 MODULE 02: DESCRIBING DT SECTION C: KEY POINTS C-1: Variables which are measured on a continuous scale are described in terms of three key characteristics central tendency, variability, and shape. C-2:
V. Gathering and Exploring Data
 V. Gathering and Exploring Data With the language of probability in our vocabulary, we re now ready to talk about sampling and analyzing data. Data Analysis We can divide statistical methods into roughly
Medical Statistics 1. Basic Concepts Farhad Pishgar. Defining the data. Alive after 6 months?
 Medical Statistics 1 Basic Concepts Farhad Pishgar Defining the data Population and samples Except when a full census is taken, we collect data on a sample from a much larger group called the population.
Section 3.2 Least-Squares Regression
 Section 3.2 Least-Squares Regression Linear relationships between two quantitative variables are pretty common and easy to understand. Correlation measures the direction and strength of these relationships.
Statistical Methods Exam I Review
 Statistical Methods Exam I Review Professor: Dr. Kathleen Suchora SI Leader: Camila M. DISCLAIMER: I have created this review sheet to supplement your studies for your first exam. I am a student here at
9 research designs likely for PSYC 2100
 9 research designs likely for PSYC 2100 1) 1 factor, 2 levels, 1 group (one group gets both treatment levels) related samples t-test (compare means of 2 levels only) 2) 1 factor, 2 levels, 2 groups (one
AP Statistics Practice Test Unit Seven Sampling Distributions. Name Period Date
 AP Statistics Practice Test Unit Seven Sampling Distributions Name Period Date Vocabulary: 1. Define and provide an example of a statistic.. Define Sampling Distribution. 3. Define the variability of a
Statistics is the science of collecting, organizing, presenting, analyzing, and interpreting data to assist in making effective decisions
 Readings: OpenStax Textbook - Chapters 1 5 (online) Appendix D & E (online) Plous - Chapters 1, 5, 6, 13 (online) Introductory comments Describe how familiarity with statistical methods can - be associated
STATISTICS INFORMED DECISIONS USING DATA
 STATISTICS INFORMED DECISIONS USING DATA Fifth Edition Chapter 4 Describing the Relation between Two Variables 4.1 Scatter Diagrams and Correlation Learning Objectives 1. Draw and interpret scatter diagrams
Instructions and Checklist
 BIOSTATS 540 Fall 2015 Exam 1 Corrected 9-28-2015 Page 1 of 11 BIOSTATS 540 - Introductory Biostatistics Fall 2015 Examination 1 Due: Monday October 5, 2015 Last Date for Submission with Credit: Monday
Measurement and Descriptive Statistics. Katie Rommel-Esham Education 604
 Measurement and Descriptive Statistics Katie Rommel-Esham Education 604 Frequency Distributions Frequency table # grad courses taken f 3 or fewer 5 4-6 3 7-9 2 10 or more 4 Pictorial Representations Frequency
Probability and Statistics. Chapter 1
 Probability and Statistics Chapter 1 Individuals and Variables Individuals and Variables Individuals are objects described by data. Individuals and Variables Individuals are objects described by data.
UNIVERSITY OF TORONTO SCARBOROUGH Department of Computer and Mathematical Sciences Midterm Test February 2016
 UNIVERSITY OF TORONTO SCARBOROUGH Department of Computer and Mathematical Sciences Midterm Test February 2016 STAB22H3 Statistics I, LEC 01 and LEC 02 Duration: 1 hour and 45 minutes Last Name: First Name:
STA Module 9 Confidence Intervals for One Population Mean
 STA 2023 Module 9 Confidence Intervals for One Population Mean Learning Objectives Upon completing this module, you should be able to: 1. Obtain a point estimate for a population mean. 2. Find and interpret
Statistical Techniques. Masoud Mansoury and Anas Abulfaraj
 Statistical Techniques Masoud Mansoury and Anas Abulfaraj What is Statistics? https://www.youtube.com/watch?v=lmmzj7599pw The definition of Statistics The practice or science of collecting and analyzing
How Faithful is the Old Faithful? The Practice of Statistics, 5 th Edition 1
 How Faithful is the Old Faithful? The Practice of Statistics, 5 th Edition 1 Who Has Been Eating My Cookies????????? Someone has been steeling the cookie I bought for your class A teacher from the highschool
Still important ideas
 Readings: OpenStax - Chapters 1 13 & Appendix D & E (online) Plous Chapters 17 & 18 - Chapter 17: Social Influences - Chapter 18: Group Judgments and Decisions Still important ideas Contrast the measurement
Standard Scores. Richard S. Balkin, Ph.D., LPC-S, NCC
 Standard Scores Richard S. Balkin, Ph.D., LPC-S, NCC 1 Normal Distributions While Best and Kahn (2003) indicated that the normal curve does not actually exist, measures of populations tend to demonstrate
Chapter 3: Examining Relationships
 Name Date Per Key Vocabulary: response variable explanatory variable independent variable dependent variable scatterplot positive association negative association linear correlation r-value regression
Chapter 1: Exploring Data
 Chapter 1: Exploring Data Key Vocabulary:! individual! variable! frequency table! relative frequency table! distribution! pie chart! bar graph! two-way table! marginal distributions! conditional distributions!
Statistics is the science of collecting, organizing, presenting, analyzing, and interpreting data to assist in making effective decisions
 Readings: OpenStax Textbook - Chapters 1 5 (online) Appendix D & E (online) Plous - Chapters 1, 5, 6, 13 (online) Introductory comments Describe how familiarity with statistical methods can - be associated
CHAPTER ONE CORRELATION
 CHAPTER ONE CORRELATION 1.0 Introduction The first chapter focuses on the nature of statistical data of correlation. The aim of the series of exercises is to ensure the students are able to use SPSS to
MULTIPLE CHOICE. Choose the one alternative that best completes the statement or answers the question.
 Statistics Final Review Semeter I Name MULTIPLE CHOICE. Choose the one alternative that best completes the statement or answers the question. Provide an appropriate response. 1) The Centers for Disease
Describe what is meant by a placebo Contrast the double-blind procedure with the single-blind procedure Review the structure for organizing a memo
 Business Statistics The following was provided by Dr. Suzanne Delaney, and is a comprehensive review of Business Statistics. The workshop instructor will provide relevant examples during the Skills Assessment
10/4/2007 MATH 171 Name: Dr. Lunsford Test Points Possible
 Pledge: 10/4/2007 MATH 171 Name: Dr. Lunsford Test 1 100 Points Possible I. Short Answer and Multiple Choice. (36 points total) 1. Circle all of the items below that are measures of center of a distribution:
Summarizing Data. (Ch 1.1, 1.3, , 2.4.3, 2.5)
") 1 Summarizing Data (Ch 1.1, 1.3, 1.10-1.13, 2.4.3, 2.5) Populations and Samples An investigation of some characteristic of a population of interest. Example: You want to study the average GPA of juniors
1 Summarizing Data (Ch 1.1, 1.3, 1.10-1.13, 2.4.3, 2.5) Populations and Samples An investigation of some characteristic of a population of interest. Example: You want to study the average GPA of juniors
Chapter 1 Where Do Data Come From?
 Chapter 1 Where Do Data Come From? Understanding Data: The purpose of this class; to be able to read the newspaper and know what the heck they re talking about! To be able to go to the casino and know
Part III Taking Chances for Fun and Profit
 Part III Taking Chances for Fun and Profit Chapter 8 Are Your Curves Normal? Probability and Why it Counts What You Will Learn in Chapter 8 How probability relates to statistics Characteristics of the
3.4 What are some cautions in analyzing association?
 3.4 What are some cautions in analyzing association? Objectives Extrapolation Outliers and Influential Observations Correlation does not imply causation Lurking variables and confounding Simpson s Paradox
STATISTICS AND RESEARCH DESIGN
 Statistics 1 STATISTICS AND RESEARCH DESIGN These are subjects that are frequently confused. Both subjects often evoke student anxiety and avoidance. To further complicate matters, both areas appear have
Regression CHAPTER SIXTEEN NOTE TO INSTRUCTORS OUTLINE OF RESOURCES
 CHAPTER SIXTEEN Regression NOTE TO INSTRUCTORS This chapter includes a number of complex concepts that may seem intimidating to students. Encourage students to focus on the big picture through some of
Readings: Textbook readings: OpenStax - Chapters 1 13 (emphasis on Chapter 12) Online readings: Appendix D, E & F
 Online readings: Appendix D, E & F") Readings: Textbook readings: OpenStax - Chapters 1 13 (emphasis on Chapter 12) Online readings: Appendix D, E & F Plous Chapters 17 & 18 Chapter 17: Social Influences Chapter 18: Group Judgments and Decisions
Readings: Textbook readings: OpenStax - Chapters 1 13 (emphasis on Chapter 12) Online readings: Appendix D, E & F Plous Chapters 17 & 18 Chapter 17: Social Influences Chapter 18: Group Judgments and Decisions
Lesson 1: Distributions and Their Shapes
 Lesson 1 Name Date Lesson 1: Distributions and Their Shapes 1. Sam said that a typical flight delay for the sixty BigAir flights was approximately one hour. Do you agree? Why or why not? 2. Sam said that
Chapter 20: Test Administration and Interpretation
 Chapter 20: Test Administration and Interpretation Thought Questions Why should a needs analysis consider both the individual and the demands of the sport? Should test scores be shared with a team, or
Test 1C AP Statistics Name:
 Test 1C AP Statistics Name: Part 1: Multiple Choice. Circle the letter corresponding to the best answer. 1. At the beginning of the school year, a high-school teacher asks every student in her classes
Reading Nutrition Labels
 Reading Nutrition Labels Objectives 1. Students will understand how to locate the serving size, servings per container and nutrients on a nutrition label. 2. Students will understand how to avoid eating
Psychology Research Process
 Psychology Research Process Logical Processes Induction Observation/Association/Using Correlation Trying to assess, through observation of a large group/sample, what is associated with what? Examples:
WDHS Curriculum Map Probability and Statistics. What is Statistics and how does it relate to you?
 WDHS Curriculum Map Probability and Statistics Time Interval/ Unit 1: Introduction to Statistics 1.1-1.3 2 weeks S-IC-1: Understand statistics as a process for making inferences about population parameters
APPENDIX N. Summary Statistics: The "Big 5" Statistical Tools for School Counselors
 APPENDIX N Summary Statistics: The "Big 5" Statistical Tools for School Counselors This appendix describes five basic statistical tools school counselors may use in conducting results based evaluation.
Module 28 - Estimating a Population Mean (1 of 3)
") Module 28 - Estimating a Population Mean (1 of 3) In "Estimating a Population Mean," we focus on how to use a sample mean to estimate a population mean. This is the type of thinking we did in Modules 7
Module 28 - Estimating a Population Mean (1 of 3) In "Estimating a Population Mean," we focus on how to use a sample mean to estimate a population mean. This is the type of thinking we did in Modules 7
Readings: Textbook readings: OpenStax - Chapters 1 11 Online readings: Appendix D, E & F Plous Chapters 10, 11, 12 and 14
 Readings: Textbook readings: OpenStax - Chapters 1 11 Online readings: Appendix D, E & F Plous Chapters 10, 11, 12 and 14 Still important ideas Contrast the measurement of observable actions (and/or characteristics)
Describe what is meant by a placebo Contrast the double-blind procedure with the single-blind procedure Review the structure for organizing a memo
 Please note the page numbers listed for the Lind book may vary by a page or two depending on which version of the textbook you have. Readings: Lind 1 11 (with emphasis on chapters 5, 6, 7, 8, 9 10 & 11)
Section 1.2 Displaying Quantitative Data with Graphs. Dotplots
 Section 1.2 Displaying Quantitative Data with Graphs Dotplots One of the simplest graphs to construct and interpret is a dotplot. Each data value is shown as a dot above its location on a number line.
Undertaking statistical analysis of
 Descriptive statistics: Simply telling a story Laura Delaney introduces the principles of descriptive statistical analysis and presents an overview of the various ways in which data can be presented by
PRINCIPLES OF STATISTICS
 PRINCIPLES OF STATISTICS STA-201-TE This TECEP is an introduction to descriptive and inferential statistics. Topics include: measures of central tendency, variability, correlation, regression, hypothesis
Research Methods. It is actually way more exciting than it sounds!!!!
 Research Methods It is actually way more exciting than it sounds!!!! Why do we have to learn this stuff? Psychology is first and foremost a science. Thus it is based in research. Before we delve into how
Eating and Sleeping Habits of Different Countries
 9.2 Analyzing Scatter Plots Now that we know how to draw scatter plots, we need to know how to interpret them. A scatter plot graph can give us lots of important information about how data sets are related
Part 1. For each of the following questions fill-in the blanks. Each question is worth 2 points.
 Part 1. For each of the following questions fill-in the blanks. Each question is worth 2 points. 1. The bell-shaped frequency curve is so common that if a population has this shape, the measurements are
Statistics for Psychology
 Statistics for Psychology SIXTH EDITION CHAPTER 3 Some Key Ingredients for Inferential Statistics Some Key Ingredients for Inferential Statistics Psychologists conduct research to test a theoretical principle
Appendix B Statistical Methods
 Appendix B Statistical Methods Figure B. Graphing data. (a) The raw data are tallied into a frequency distribution. (b) The same data are portrayed in a bar graph called a histogram. (c) A frequency polygon
3.2 Least- Squares Regression
 3.2 Least- Squares Regression Linear (straight- line) relationships between two quantitative variables are pretty common and easy to understand. Correlation measures the direction and strength of these
Never P alone: The value of estimates and confidence intervals
 Never P alone: The value of estimates and confidence Tom Lang Tom Lang Communications and Training International, Kirkland, WA, USA Correspondence to: Tom Lang 10003 NE 115th Lane Kirkland, WA 98933 USA
This means that the explanatory variable accounts for or predicts changes in the response variable.
 Lecture Notes & Examples 3.1 Section 3.1 Scatterplots and Correlation (pp. 143-163) Most statistical studies examine data on more than one variable. We will continue to use tools we have already learned
Population. Sample. AP Statistics Notes for Chapter 1 Section 1.0 Making Sense of Data. Statistics: Data Analysis:
 Section 1.0 Making Sense of Data Statistics: Data Analysis: Individuals objects described by a set of data Variable any characteristic of an individual Categorical Variable places an individual into one
People have used random sampling for a long time
 Sampling People have used random sampling for a long time Sampling by lots is mentioned in the Bible. People recognised that it is a way to select fairly if every individual has an equal chance of being
BIVARIATE DATA ANALYSIS
 BIVARIATE DATA ANALYSIS Sometimes, statistical studies are done where data is collected on two variables instead of one in order to establish whether there is a relationship between the two variables.
Data, frequencies, and distributions. Martin Bland. Types of data. Types of data. Clinical Biostatistics
 Clinical Biostatistics Data, frequencies, and distributions Martin Bland Professor of Health Statistics University of York http://martinbland.co.uk/ Types of data Qualitative data arise when individuals
On the purpose of testing:
 Why Evaluation & Assessment is Important Feedback to students Feedback to teachers Information to parents Information for selection and certification Information for accountability Incentives to increase
Statistics: Interpreting Data and Making Predictions. Interpreting Data 1/50
 Statistics: Interpreting Data and Making Predictions Interpreting Data 1/50 Last Time Last time we discussed central tendency; that is, notions of the middle of data. More specifically we discussed the
Observational studies; descriptive statistics
 Observational studies; descriptive statistics Patrick Breheny August 30 Patrick Breheny University of Iowa Biostatistical Methods I (BIOS 5710) 1 / 38 Observational studies Association versus causation
Quizzes (and relevant lab exercises): 20% Midterm exams (2): 25% each Final exam: 30%
: 20% Midterm exams (2): 25% each Final exam: 30%") 1 Intro to statistics Continued 2 Grading policy Quizzes (and relevant lab exercises): 20% Midterm exams (2): 25% each Final exam: 30% Cutoffs based on final avgs (A, B, C): 91-100, 82-90, 73-81 3 Numerical
1 Intro to statistics Continued 2 Grading policy Quizzes (and relevant lab exercises): 20% Midterm exams (2): 25% each Final exam: 30% Cutoffs based on final avgs (A, B, C): 91-100, 82-90, 73-81 3 Numerical
Statistical Methods and Reasoning for the Clinical Sciences
 Statistical Methods and Reasoning for the Clinical Sciences Evidence-Based Practice Eiki B. Satake, PhD Contents Preface Introduction to Evidence-Based Statistics: Philosophical Foundation and Preliminaries
DO NOT OPEN THIS BOOKLET UNTIL YOU ARE TOLD TO DO SO
 NATS 1500 Mid-term test A1 Page 1 of 8 Name (PRINT) Student Number Signature Instructions: York University DIVISION OF NATURAL SCIENCE NATS 1500 3.0 Statistics and Reasoning in Modern Society Mid-Term
MBA 605 Business Analytics Don Conant, PhD. GETTING TO THE STANDARD NORMAL DISTRIBUTION
 MBA 605 Business Analytics Don Conant, PhD. GETTING TO THE STANDARD NORMAL DISTRIBUTION Variables In the social sciences data are the observed and/or measured characteristics of individuals and groups
2.4.1 STA-O Assessment 2
 2.4.1 STA-O Assessment 2 Work all the problems and determine the correct answers. When you have completed the assessment, open the Assessment 2 activity and input your responses into the online grading
Psychology Research Process
 Psychology Research Process Logical Processes Induction Observation/Association/Using Correlation Trying to assess, through observation of a large group/sample, what is associated with what? Examples:
AP Statistics TOPIC A - Unit 2 MULTIPLE CHOICE
 AP Statistics TOPIC A - Unit 2 MULTIPLE CHOICE Name Date 1) True or False: In a normal distribution, the mean, median and mode all have the same value and the graph of the distribution is symmetric. 2)