I. INTRODUCTION VISUAL saliency, which is a term for the pop-out
|
|
|
- Sylvia Sims
- 5 years ago
- Views:
Transcription
1 IEEE TRANSACTIONS ON NEURAL NETWORKS AND LEARNING SYSTEMS, VOL. 27, NO. 6, JUNE Spatiochromatic Context Modeling for Color Saliency Analysis Jun Zhang, Meng Wang, Member, IEEE, Shengping Zhang, Member, IEEE, Xuelong Li, Fellow, IEEE, and Xindong Wu, Fellow, IEEE Abstract Visual saliency is one of the most noteworthy perceptual abilities of human vision. Recent progress in cognitive psychology suggests that: 1) visual saliency analysis is mainly completed by the bottom-up mechanism consisting of feedforward low-level processing in primary visual cortex (area V1) and 2) color interacts with spatial cues and is influenced by the neighborhood context, and thus it plays an important role in a visual saliency analysis. From a computational perspective, the most existing saliency modeling approaches exploit multiple independent visual cues, irrespective of their interactions (or are not computed explicitly), and ignore contextual influences induced by neighboring colors. In addition, the use of color is often underestimated in the visual saliency analysis. In this paper, we propose a simple yet effective color saliency model that considers color as the only visual cue and mimics the color processing in V1. Our approach uses region-/boundary-defined color features with spatiochromatic filtering by considering local color-orientation interactions, therefore captures homogeneous color elements, subtle textures within the object and the overall salient object from the color image. To account for color contextual influences, we present a divisive normalization method for chromatic stimuli through the pooling of contrary/complementary color units. We further define a color perceptual metric over the entire scene to produce saliency maps for color regions and color boundaries individually. These maps are finally globally integrated into a one single saliency map. The final saliency map is produced by Gaussian blurring for robustness. We evaluate the proposed method on both synthetic stimuli and several benchmark saliency Manuscript received September 9, 2014; revised July 25, 2015; accepted July 30, Date of publication August 25, 2015; date of current version May 16, This work was supported in part by the Natural Science Foundation of China under Grant , Grant , Grant , Grant , and Grant , in part by the National 973 Program of China under Grant 2013CB and Grant 2014CB347600, in part by the Program for Changjiang Scholars and Innovative Research Team in University through the Ministry of Education, China, under Grant IRT13059, in part by the Program for New Century Excellent Talents in University under Grant NCET , in part by the Key Research Program of the Chinese Academy of Sciences under Grant KGZD-EW-T03, in part by the China Post-Doctoral Science Foundation under Grant 2014M and Grant 2014M550192, and in part by the Fundamental Research Funds for the Central Universities under Grant 2013HGBH0045. J. Zhang and M. Wang are with the School of Computer Science and Information Engineering, Hefei University of Technology, Hefei , China ( zhangjun@hfut.edu.cn; eric.mengwang@gmail.com). S. Zhang is with the School of Computer Science and Technology, Harbin Institute of Technology, Weihai , China ( s.zhang@hit.edu.cn). X. Li is with the State Key Laboratory of Transient Optics and Photonics, Center for Optical Imagery Analysis and Learning, Xi an Institute of Optics and Precision Mechanics, Chinese Academy of Sciences, Xi an , China ( xuelong_li@opt.ac.cn). X. Wu is with the School of Computer Science and Information Engineering, Hefei University of Technology, Hefei , China, and also with the Department of Computer Science, University of Vermont, Burlington, VT USA ( xwu@hfut.edu.cn). Color versions of one or more of the figures in this paper are available online at Digital Object Identifier /TNNLS data sets from the visual saliency analysis to salient object detection. The experimental results demonstrate that the use of color as a unique visual cue achieves competitive results on par with or better than 12 state-of-the-art approaches. Index Terms Color, context, region and boundary, spatiochromatic filtering, visual saliency. I. INTRODUCTION VISUAL saliency, which is a term for the pop-out of certain visual features within the human visual system (HVS), makes certain regions and objects of a scene stand out from their neighbors and catch immediate attention when the primate visual system observes the scene over several seconds [1]. These regions and objects on which attention is focused are termed salient regions and objects. Saliency has been a fundamental issue in physiology, psychophysics, and vision perception for a long time, and plays an important preprocessing role in many vision tasks, such as image and video retrieval [2], [3], segmentation [4], [5], and object recognition [6] [9]. A visual saliency has been well explored in the computer vision community. Recently, many research efforts have been made to design various salient features by incorporating local cues [10] [19] or global cues [5], [20] [29]. A large body of work has concentrated on exploiting local cues, including information maximization [10], [11], [13], centersurround feature discrepancy [14], [15], [18], color image derivatives [17], and region covariances [19]. Although these methods used different color spaces and intensity features to form several composite features, they ignored interactions between cues by treating different features as independent channels. Hence, those methods are sensitive to each feature dimension, which leads to redundancy in the measurement of saliency and makes it difficult to extract salient regions/objects from complex scenes. As more features or more complex scenes are explored, it is obvious that we need to figure out the most effective features for the saliency analysis, rather than just trying to adapt the model to be sensitive to all possible feature dimensions and compute them at each pixel. In addition, some local methods highlight the boundaries of salient objects in local neighborhoods rather than in their entire regions. Since natural images contain more local discontinuities in texture (i.e., texture boundaries), using images with textured backgrounds may cause the algorithm to mistake these backgrounds for salient regions. Global contrast-based methods aim to capture a holistic representation from an image. These approaches model saliency by exploiting the global statistical properties of the image, including frequency spectrum analysis [20], [21], [30], X 2015 IEEE. Personal use is permitted, but republication/redistribution requires IEEE permission. See for more information.
2 1178 IEEE TRANSACTIONS ON NEURAL NETWORKS AND LEARNING SYSTEMS, VOL. 27, NO. 6, JUNE 2016 color-spatial distribution modeling [5], [22], high-dimensional Gaussian filtering [23], modeling natural statistics in a Bayesian framework [26], context-aware saliency [31], statistical textural distinctiveness [27], and global optimization associated with background detection [28]. However, although these methods explore the distinction between salient objects and regions over the whole image, they rely on heuristics or unduly complicated models. In recent years, the learning-based saliency detection has opened up a new research area with the development of machine learning techniques [32] [35]. These approaches are either based on image features learnt from hiereachical architectures, such as sparse coding representation [36] [39], stacked denoising autoencoder [40], two-layer deep Boltzmann machine [41], AdaBoost algorithm for feature selection [42], or on objects, such as measuring reconstruction residuals of deep auto encoders to separate objects from backgrounds [43], unsupervised extraction of attentive objects in Markov random field (MRF) [44], and detection of a salient object by learning conditional random field [45] [47]. However, these methods are sensitive to parameters and large data sets are required to learn effective models. Within the aforementioned approaches, there are some models that aim to explore the role of color in a visual saliency analysis. Some works use color as one of visual cues, in which only a simple color space transformation is used and color is treated as an independent feature channel [5], [17], [22]. Some works consider spatial correlations among image regions as geometrical dependence on them [48], [49], which inevitably ignore the strong spatial properties derived from the color cues and the contextual influence of the surrounding areas on salient cues. In fact, if the color in the surrounding background is different from the figure color, the effect of surround colors on color appearance leads to color shifts, which are known to provide color context and are helpful in producing color constancy in humans. Recently, sophisticated color features have been shown to achieve excellent performance for object recognition and scene categorization [50] [52]. Zhang et al. [53] proposed the joint processing of color and form to encode uniform color regions and color boundaries. They showed the proposed color features outperformed standard grayscale/shape-based descriptors as well as alternative color processing schemes, and were successfully applied to object recognition, scene categorization, and contour detection on several data sets. However, until now, color has not been fully investigated for the visual saliency modeling. To address the aforementioned problems, instead of modeling a visual saliency using the conventional local contrast features or complicated statistical models in a purely computational way, we propose a novel color saliency model inspired by the mechanisms of visual attention studied in neurophysiology and cognitive psychology [54] [61], including the following. 1) It has become clear that V1 is the main cortical area contributing to predicting the bottom-up saliency [54] [58]. It is well known that each V1 cell can be tuned to one or more feature dimensions, such as orientation, scale, color, motion, and depth [54]. Thus, a salience is generated by feature contrast in a wide variety of stimulus feature dimensions. 2) The salience is increased by the abundance of cells simultaneously tuned to both orientation and color in V1, rather than the simple summed response of oriented cells and color cells [59]. 3) Two types of color neurons exist in a visual cortex. One is the color opponent neuron [illustrated by single opponent (SO)], and the other shows both spatial and color opponency and is often called the doubleopponent (DO) color neuron. The former cell signals homogenous color regions while the latter mainly responds to color boundaries [61]. 4) The cross-orientation suppression, a biologically plausible mechanism for neural circuits, is found to be especially effective when a stimulus orthogonal to a neuron s preferred orientation suppresses the response to a simultaneously presented stimulus at the neuron s preferred orientation. It may play a role in the refinement of selectivity and contextual influence [60]. From the above observations, exploiting color information alone in the visual saliency is a challenge because of the characteristics of color processing in biological vision. The systematic nature of these pieces of evidence makes it an excellent basis for computational saliency modeling research, and motivates us to account for spatial relationships and interactions among colors by considering the joint feature tuning advantage and contextual influences that are highlighted in V1, which should lead to better quantitative matching between the visual saliency model and the human vision. In this paper, we propose a novel visual saliency analysis method to extend the existing hierarchical color descriptors [53] with the aim of explicitly taking better advantage of inherent spatial characteristics and color contextual influences from the color image in an efficient manner to quantify the saliency within the image. In particular, to derive a color boundary (i.e., joint color-orientation) feature, the color unit needs to be simultaneously tuned to both color and orientation. We first capture perceptually salient homogeneous color elements and color boundary cues. Instead of comparing all orientation and color responses, we further propose a new divisive normalization by suppressing the contrary orientation and complementary color at each position within the same feature. Furthermore, we define the color saliency metric in a global way, i.e., computing the distance of the spatial locations and the dissimilarity of color features between pixel pairs over the whole scene. The saliency of each pixel is then assigned by the spatiochromatic energy integration of region-/boundarydefined color saliency maps followed by Gaussian blurring refinement and normalization. In summary, this paper makes the following contributions. 1) To the best of our knowledge, we are the first to investigate color as the only cue in a visual saliency analysis by considering spatiochromatic interactive information and color contextual influences. 2) Motivated by biological considerations, we describe the novel low-level color salient cues incorporated with
3 ZHANG et al.: SPATIOCHROMATIC CONTEXT MODELING FOR COLOR SALIENCY ANALYSIS 1179 cross-feature suppression induced by contrary and complementary visual cues within a divisive normalization framework. 3) We evaluate the proposed approach to saliency detection and extend to salient object detection. The experimental performance on two synthetic stimuli often used in psychophysical studies and four large publicly available saliency detection data sets shows that our approach performs on par with or better than the state-of-theart saliency detection methods, without the need for additional top-down saliency priors or learning-based features. The remainder of this paper is organized as follows. After a review of related work in Section II, Section III covers the details of our approach to visual saliency modeling. We present results from synthetic stimuli to real data in Section IV. Finally, the conclusions are drawn in Section V. II. RELATED WORK In this section, we describe related work along three lines to study saliency detection, as well as salient object detection. A. Local Methods Local methods mainly differ from each other in the different visual local cues extracted from the images. As long ago as 1980, Treisman and Gelade [62] proposed a feature integration theory that aggregated several feature types. Later, Koch and Ullman [55] proposed a feedforward model for integration, along with the concept of a saliency map. This idea was first implemented and verified by Itti et al. [14], who proposed one of the first complete models of human attention in images. Since then, much progress in local bottom-up saliency has been made in computer vision. Bruce and Tsotsos [11] defined saliency based on the self-information of image content in a local neighborhood. Gao et al. [15] treated saliency detection as a discriminative classification problem in the center-surround difference framework. They showed that a discriminant center-surround saliency can be easily generalized to various visual cues (color, orientation, motion, and so on). Moreover, they presented better background subtraction compared with the Gaussian mixture model (GMM). Tavakoli et al. [18] estimated the saliency of local features using a Bayesian framework. Sparse sampling and kernel density are used to determine the distribution. Hou and Zhang [13] proposed a dynamic visual attention model. In their approach, the incremental coding length is introduced to measure the entropy of the sampled visual features. The model could achieve attention selectivity in both static and dynamic scenes. Zhu et al. [28] treated saliency detection as a binary object/background segmentation, and formulated low-level multicue contrast with robust background weights in a global optimization framework. They achieved excellent results in salient object detection. As pointed out in Section I, not much work has been done on color cues in terms of capturing spatial interactions, despite some recent work addressed color information in saliency detection [5], [19], [23]. Cheng et al. [5] presented a saliency modeling technique that uses a color co-occurrence histogram to capture certain spatial information. Perazzi et al. [23] formulated saliency in a single highdimensional Gaussian filter framework, which provides a clear link between the element-based color contrast and assigns saliency values to all image pixels. Another example is from Erdem and Erdem [19], who presented a saliency model that uses region covariance descriptors to explore how different feature dimensions, such as color and orientation, contribute to overall visual saliency. However, it does not mean that these models account for spatial relationships and interactions among colors for visual saliency. Our model contrasts with the previous models by narrowing the focus to only include color cues, and modeling the characteristic of color cells highlighted in V1 in a more explicit and much simpler way. Our approach is also unique in its normalization strategy. In contrast to the existing normalization algorithms that perform division by summing over all the neighboring units, see [53], [63], our approach normalizes the feature maps by only their contrary channels to suppress nonsalient areas and enhance salient regions and objects. Most of the aforementioned models do not reflect the above aspects. B. Global Methods Unlike models based on properties like local contrast, another family of saliency models is based on features in a global scope. To better preserve the structure of salient regions, Hou and Zhang [20] proposed a spectral residual model based on analyzing the log spectrum of an image in spectral domain and using the residuals to construct saliency maps in the spatial domain. They showed the fast and robust saliency detection. Zhang et al. [26] presented a measure of saliency using natural image statistics in a Bayesian framework to account for many human search asymmetries that cannot be explained by the statistics of test images alone. Supported by psychological studies, Goferman et al. [31] proposed contextaware saliency, the idea of which is that even unique parts of the background could be salient locations. Thus, global cues suppress frequently occurring features while maintaining features that deviate from the norm. There are two other methods highlighting boundaries of salient regions [21], [27]. One work [21] estimated the center-surround contrast using color and luminance cues by analyzing the spatial frequency of the image contents. The salient regions were detected using well-defined salient object boundaries. The other work [27] detected the salient regions by incorporating sparse texture modeling within a statistical textual distinctiveness framework. However, these methods do not uniformly detect salient objects or suppress the background in a scene. C. Learning-Based Methods Recently, several studies have developed learning methods in saliency analysis [32], [36] [45], [64]. For example, Judd et al. [64] formulated saliency detection as a binary classification problem. They used the standard Support Vector Machine (SVM) classifier to combine low-, middle-, and
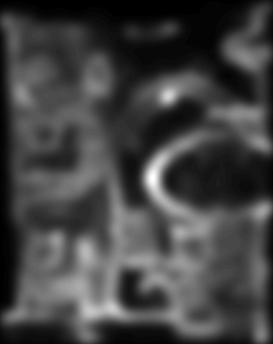
 Luminance unit with center +/surround. (c) DO unit with L+/M center/m+/l surround. Fig. 1. Flowchart of our model for visual saliency analysis.")
 Color contextual features are computed on SO/DO maps via modified divisive normalization. (c) SO/DO saliency maps are computed by the defined saliency metric over the whole scene.")
 Final saliency map is produced by the spatiochromatic energy integration of the SO and DO saliency maps. (f) Gaussian blurring and normalization are applied for robust.")


![In addition, recent advances on deep learning provide people to learn saliency from multilayer networks [32], [39] [42].](/docs-images/82/85877719/images/4-6.jpg "Such approaches learn hierarchies of representations in which each layer corresponds to edges, junctions, and even object parts.")


 reflect the chromatic orientations that tune to a specific color and orientation in space. The region and boundary salient locations are generated separately for every pixel.")
4 1180 IEEE TRANSACTIONS ON NEURAL NETWORKS AND LEARNING SYSTEMS, VOL. 27, NO. 6, JUNE 2016 Fig. 2. Spatial organizations of color units. (a) SO unit with L+ center/ M surround. (b) Luminance unit with center +/surround. (c) DO unit with L+/M center/m+/l surround. Fig. 1. Flowchart of our model for visual saliency analysis. (a) SO color region (top two maps) and DO color boundary (bottom two maps) features are computed from the input color image. (b) Color contextual features are computed on SO/DO maps via modified divisive normalization. (c) SO/DO saliency maps are computed by the defined saliency metric over the whole scene. (d) Final SO/DO saliency maps are computed by global pooling over spatial feature dimensions. (e) Final saliency map is produced by the spatiochromatic energy integration of the SO and DO saliency maps. (f) Gaussian blurring and normalization are applied for robust. (We simply visualize DO maps by taking the maximum response across all orientation channels on a single scale.) high-level features from human fixation data. Li et al. [38] computed saliency based on dense and sparse reconstruction errors and integrated them via the Bayes formula. Their approach has shown to be more effective in highlighting salient objects uniformly and robust to background noise. Han et al. [36] also proposed a saliency detection framework using sparse coding representations as features and integrating objectness likelihood and appearance rarity. In addition, recent advances on deep learning provide people to learn saliency from multilayer networks [32], [39] [42]. Such approaches learn hierarchies of representations in which each layer corresponds to edges, junctions, and even object parts. However, these approaches suffer from parameter sensitivity and normally require large-scale manually annotated data to train effective models. III. SPATIOCHROMATIC CONTEXT MODEL The proposed method falls into the bottom-up saliency detection category, in which only color cues are used from color images. We jointly process spatial information using color cues to find the salient color edges and boundary features in a pyramid manner. As well, we favor the more salient regions/boundaries and suppress the surrounding responses in a modified divisive normalization framework. Then, we integrate the color saliency by taking the global spatiochromatic energy response of the color region and the color boundary salience, rather than a linear (weighted) summation, multiplication or complex global optimization framework. Finally, postprocessing is applied to the saliency map to output a smoothed, normalized result. Fig. 1 shows the flowchart of our model. A detailed description of each stage is provided in Sections IIIA IIIE. A. Hierarchical Model of Color Processing via Spatiochromatic Filtering It is clear that human observers use many dimensions in their evaluations of image content, including high-frequency luminance information and low-frequency color information. In this paper, we first compute two types of biologically plausible color representations that mimic the color processing in the primary visual cortex. To account for the spatial properties in the color image, we adopt the 3-D inseparable spatiochromatic filtering approach of [53] to extract the opponent color cues associated with different color regions/boundaries. Region candidates (SO) indicate the locations that capture attention due to local region color contrast or uniqueness, irrespective of space. Boundary candidates (DO) reflect the chromatic orientations that tune to a specific color and orientation in space. The region and boundary salient locations are generated separately for every pixel. In this way, components sharing spatial and color support are further grouped together to provide a more compact and meaningful color image representation. Fig. 2 shows an example of spatial organizations of color units in which oval illustrates spatial receptive fields (RFs) profiles of subunits, color indicates the subunit s color preference, ON and OFF (indicated as + and ) subunits illustrate the excitatory and inhibitory components, L and M are cones in the human eye responding to long and middle wavelengths and are often approximated as R and G (red and green) in computer vision and image processing. [We omit short wavelength (blue) in this example.] 1) SO Feature: In Fig. 2(a), an SO color map is computed from this color image by centering a 3-D spatiochromatic opponent filter f opp (x, y) that is built by separating the Gabor-like filter into positive and negative subunits f (x, y), which are followed by convoluting with R, G, and B components over a full range of orientations and opponent color channels at each possible position and scale. Let f K (x, y), K R, G, B denotes the spatial sensitivity distributions for each individual color component. Then f opp (x, y) = K (λ) f K (x, y) (1) K where K (λ) is the spectral response function of the R, G, and B components from color images. Thus, the SO response s(x, y) could be expressed as a weighted sum over local space of the stimulus colors s(x, y) = I (x, y) f opp (x, y). (2) Here, is the convolution operator. Each unit represents the activation of a particular opponent color filter centered at that position which actually reflects the first-order property for the chromatic stimulus. This stage exhibits little or weak

, the DO feature shows both color and spatial opponency, which means that there is a doublefeature advantage over SO that is thought to influence the perception of form, such as capturing an")


![Then, the weighting function at this stage can be modeled as a Gabor filter f (x, y) with positive center and negative surround [Fig. 2(b)], like the one used in the SO stage.](/docs-images/82/85877719/images/5-5.jpg "Thus, we define the DO response d(x, y) as d(x, y) = s(x, y) f (x, y). (3) The bottom two maps in Fig.")
5 ZHANG et al.: SPATIOCHROMATIC CONTEXT MODELING FOR COLOR SALIENCY ANALYSIS 1181 orientation selectivity but strong selectivity to color regions owing to its strong color opponency, as shown in the top two feature maps of Fig. 1(a). 2) DO Feature: The next step is to introduce orientation information into color to generate a joint color-orientation map. As shown in Fig. 2(c), the DO feature shows both color and spatial opponency, which means that there is a doublefeature advantage over SO that is thought to influence the perception of form, such as capturing an inner-texture object and the salient object itself. Therefore, we might expect the luminance signals in DO units to reflect the borders between the center and the surround so that DO mainly signals color boundaries. In addition, it has been suggested that SO cortical cells could be an intermediate cortical stage for wiring to DO cells for which the RF center and surround are constructed by sampling different pools of SO neurons [65]. For simplicity, the most direct way is to extract a DO response map entirely from SO units. Then, the weighting function at this stage can be modeled as a Gabor filter f (x, y) with positive center and negative surround [Fig. 2(b)], like the one used in the SO stage. Thus, we define the DO response d(x, y) as d(x, y) = s(x, y) f (x, y). (3) The bottom two maps in Fig. 1(a) show DO features, which encode the color boundaries of the corresponding opponent color channels. B. Color Context With Cross-Feature Suppression The response of a neuron in V1 to an optimally oriented stimulus is suppressed by a superimposed orthogonal stimulus, which is a neural basis of context. Recently, some studies have shown normalization model can explain the cross-orientation suppression [60], [63], [66]. For context-dependent achromatic stimuli in attention, this is often fully characterized by divisive normalization in which the normalization pool with simple units is divided by a neural measure of stimulus energy measured across all the simple units [67], [68]. Inspired by the above evidence, to account for color contextual influences in visual saliency, we propose a feature suppression strategy using the opponent color and orthogonal orientation for SO and DO, respectively, to capture more comprehensive contextual information in a variation of the divisive normalization framework, thereby suppressing background regions with homogeneous appearances, and favoring the salience of target regions with different appearances. The chromatic signature of the normalizing signal is determined by means of contrary information of the SO response for each property, a semisaturation constant σ 1 and a scaling factor k. The SO contextual feature of the nonlinear detector at the preferred unit is defined by su (x, y) = k s u (x, y) 2 σ1 2 + s u (x, (4) y) 2 where u indicates the opponent color c for the SO unit and the orthogonal orientation o for the DO unit, and s =max(s, 0) ensures a positive neuron firing rate. Fig. 3. Generation of the contextual SO color map and the contextual DO color-orientation map. (a) Spatiochromatic units. (b) Rectification. (c) Division. Fig. 4. Comparison of saliency detection obtained by comparing contextual features between our method and [53]. (a) Input image. (b) Saliency map computed in [53]. (c) Saliency map computed by our color contextual features. (d) GT. Then, the DO contextual feature is updated as d (x, y) = s (x, y) f (x, y). (5) The involved functional non-linear operations are illustrated graphically in Fig. 3. This figure describes the procedure to obtain color contextual response for the color map (SO) and color-orientation map (DO), individually. For the SO color map, two color units have the same spatial orientations (e.g., vertical) but complementary color cues (e.g., R+/G and G+/R ), while the DO color-orientation map is derived from the color units having the same opponent color channel (e.g., R+/G ) but orthogonal orientations (e.g., 0 and 90 ). It can be seen from Fig. 1(b) that the proposed normalization favors salient contiguous regions for SO and salient object contours for DO. We should also note that this result is different from that of Zhang et al. [53], who have reported that normalization is induced by all the neighboring neurons. We compare saliency maps in Fig. 4. We can see that [53] [Fig. 4(b)] detected all the regions which have different appearances from the surrounding areas, while our method [Fig. 4(c)] highlights the most salient regions and suppresses the less salient regions owing to the division by opponent/complementary channels rather than all the neighboring units. C. Multiscale Pyramid Sampling It is a fact that multiscale features can benefit object recognition [69], [70]. Saliency computation requires interactions
 Salient points detected by SO-log. (c) Salient points detected by DO-log. between different scales.")
6 1182 IEEE TRANSACTIONS ON NEURAL NETWORKS AND LEARNING SYSTEMS, VOL. 27, NO. 6, JUNE 2016 Fig. 5. Salient points detected by SO-/DO-log detectors. (a) Input image. (b) Salient points detected by SO-log. (c) Salient points detected by DO-log. between different scales. Therefore, we compute saliency not only in feature space but also in scale space by detecting features that exist over a narrow range of particular scales. To show that scale provides important information for the visual saliency analysis, we illustrate the most salient interesting points and their scales extracted by log detectors encoded by SO/DO color contextual features in Fig. 5. A global threshold is used to constrain the numbers of salient points. We can see that the most salient regions [Fig. 5(b)] and boundaries [Fig. 5(c)] located at different scales are described as yellow circles with different sizes, which suggests that scale is an implicit part of the saliency problem and that multiscale sampling enables us to analyze the salient regions and objects. In summary, our method works as follows: we use a 3-D pyramid of pixels to describe multiscale space over four layers with a scaling factor, and the feature space contains a 5-D structure (x, y, c, o, l) having the same 3-D pyramid shape with orientation o, opponent color c, and scale l at each position (x, y). D. Color Perceptual Saliency Metric Having established the multiscale color contextual feature maps, the next step is to design a metric to assign a saliency score to a pixel. The motivation is that as follows. 1) We expect that color salience between pixels defined on the feature layer should precisely reflect visual distances on the image layer, i.e., if a pixel point p(x, y) looks very salient, it has very dissimilar neighbors with a large color perceptual difference and visual distance. 2) The global properties of a scene also affect the salience of a target stimulus. For example, a target item on a nonuniform background is much less salient than a target on a uniform one. Hence, based on the above two observations, we will perform a color saliency computation through addressing the perceptual color dissimilarity D opp (p) and considering the spatial distance D loc (p) between pixel p(x, y) and every other pixel in the whole scene. We define our color perceptual saliency metric D(p) as the product of D opp (p) and D loc (p) D(p) = D opp (p) D loc (p). (6) Below, we detail these two components (D opp and D loc ), which differ in how they compute the distance between pixel pairs, as shown in Fig. 6. 1) Perceptual Color Dissimilarity: We capture the perceptual properties by comparing the difference between Fig. 6. Color perceptual saliency metric. (a) Spatial location difference (D loc ). (b) Perceptual color region dissimilarity (D reg ). (c) Perceptual color boundary dissimilarity (D bdry ). two pixels in a color region or on a color boundary. For a given color feature map, we measure the perceptual color dissimilarity D opp (p) as the L1-norm of features of all pairs of neighbors q N (x, y) on the SO [Fig. 6(b)] or DO [Fig. 6(c)] feature layers due to its simplicity and familiarity D opp (p) = r(p) r(q) 1 (7) q N (x,y) where N (x, y) denotes neighbors of pixel p(x, y) in the image space and r denotes the color contextual region (s (x, y)) or boundary (d (x, y)) feature. D opp (p) encodes the region-/ boundary-based saliency value at that pixel p(x, y). Note that for color region dissimilarity (denoted by D reg ), we measure the difference of SO features over the opponent color space C and the difference of DO features over the orientation space O for color boundary dissimilarity D bdry. 2) Spatial Location Difference: The second metric D loc (p) measures the difference of spatial locations, which is modeled as a Gaussian kernel of L2-norm of two pixels by D loc (p) = ( ) 1 p q 2 exp 2 (8) σ 2 2π q N (x,y) 2σ 2 2 where σ 2 is the weight of the distance of neighboring pixels q(x, y) around each pixel p(x, y) of the image. This metric captures the distance of spatial locations between the pixels, as shown in Fig. 6(a) for example. This is derived from the human visual perception showing a Gaussian distribution along the increasing spatial distance. At this point, according to (6) we have obtained two saliency maps 1 Ds = Dreg Dloc (9) D d = D bdry D loc (10) where D s and D d correspond to the color region and the color boundary saliency maps encoded by SO and DO descriptors. E. Spatiochromatic Saliency Integration Our saliency integration method is inspired by the spatiotemporal motion energy model [71], which has suggested that the energy response is sensitive to the direction of motion but insensitive to the sign of the stimulus contrast benefit for motion detection. For the chromatic signal, we start by taking max-/sum-pooling over scales and orientations for 1 The saliency value in each map is normalized to [0, 1].
7 ZHANG et al.: SPATIOCHROMATIC CONTEXT MODELING FOR COLOR SALIENCY ANALYSIS 1183 SO and DO saliency maps (leading to saliency maps with only color channels). In order to detect the salient regions and boundaries having the same color appearance and insensitive to the figure-ground contrast, similar to the spatiotemporal motion energy, we assign each pixel a saliency value via the energy integration of region-/boundary-defined color salient maps at the same opponent color channel so that we can get the saliency map consisting of the whole object and its inner textures and homogeneous color regions, defined as E = Es (c) 2 + E d (c) 2 (11) C where E s (c) = O max L D s (c, o, l) and E d (c) = L O D d(c, o, l) are obtained via max-/sum-pooling supported by physiological experiments [72]. Finally, we employ a low-pass Gaussian filter to blur the saliency map (E) to enhance salient regions, remove noise, and high-frequency details, and also make the salient objects located in the contiguous regions. This is a much simpler and effective technique for robust purpose and has been widely used in saliency detection, such as in [21], [23], and [70] [72]. IV. EXPERIMENTS In this section, all the experiments are run on a PC with an Intel quad-core 3.10-GHz CPU, 8-GB RAM and MATLAB R2013b on the Windows system. We evaluated our approach on both synthetic stimuli and four publicly available natural data sets: the Toronto data set [11], the MIT data set [64], the MSRA-1000 data set [21], and the Kootstra data set [76]. These four data sets are the most widely used for evaluation and reflect most of the challenges in real-world saliency detection applications. To examine the overall performance of our approach, we compared our model with 12 state-of-the-art saliency models that are well stated in the literature, including the graphbased visual saliency model (GBVS) [77], Itti et al. (IT) [14], the information maximization model (AIM) [11], spectral residual (SR) [20], saliency using natural (SUN) statistics [26], the context-aware (CA) method [31], the frequencytuned (FT) model [21], fast and efficient saliency (FES) [18], saliency filters (SF) [23], textural distinctiveness (TD) [27], region covariance (CovSal) [19], and saliency optimization (wctr*) [28]. A. Experimental Setup This section presents the experimental setup, including parameter setting, data sets, and model evaluation. 1) Parameter Setting: Our base filtering parameters follow [53] and use four spatial orientations o {0,π/4, π/2, 3π/4} and four pairs of opponent color channels c {Red-Green, Red-Cyan, Yellow-Blue, White-Black}. Each pair of channels contains two complementary colors. We create an image pyramid subband in four scales, each a factor of 0.6 smaller than the last (using bicubic interpolation), and the spatial frequency of each Gabor filter is fixed to of size, in a total of 128 filters. This set of filter parameters is chosen for simplicity and fixed throughout all the experiments. The semisaturation constant σ 1 in (4) is set to be 0.225, and the standard deviation σ 2 of the spatial Gaussian kernel in (8) is 2.5 times the longer size of the input image. 2) Data Set: We tested our approach on several different data sets, ranging from synthetic stimuli used in attention experiments for qualitative evaluation, to four challenging natural benchmarking data sets for both qualitative and quantitative comparisons. All images are in color. a) Synthetic stimuli: Early attention studies and models used simple synthetic patterns to find out important feature channels in directing attention and how they are combined, such as searching for a target or detecting an odd item among distractor items. We first adopted two common psychophysical images [78] to simulate our experiments, as shown in Fig. 10(a). Top: color pop-out search arrays one red target (rectangular bar at 45 orientation) among blue distractors (also rectangular bars) with the same orientation, and one blue target with orthogonal orientation. Bottom: orientation pop-out search arrays one blue target among red/green/blue distractors with the orthogonal orientation. Fig. 10(j) shows the ground-truth (GT) saliency map in which the dot color indicates the preferred color of the cell signaling the saliency. A black dot describes an orientation tuned cell, and the radius indicates the response level. b) Natural stimuli: We show that our framework is more effective in analyzing the visual saliency in natural scenes by comparing our approach with other state-of-the-art methods. Toronto: This data set [11] contains 120 color images with a resolution of from indoor and outdoor scenes along with the experimental fixations observed by 20 different subjects. However, a large portion of images does not contain particular regions of interest, as also stated by [64] and [79]. MIT: This popular data set [64] contains 1003 images collected from Flickr and LabelMe, and eye tracking data were collected from 15 subjects under free view. All images were rescaled to be pixels in this data set. Compared with the Toronto data set, this data set not only has low-level (e.g., color and orientation) and mid-level (e.g., texture) cues, but also high-level semantic concepts (e.g., face, human, and so on). Kootstra: The images from this data set were selected from the McGill calibrated color image data set [80] so as to investigate the role of symmetry in saliency detection, and are displayed with a resolution of to obtain eye fixation GT with a downscaled size of pixels for 80 color images. The images are quite different from other data sets for saliency study, because they were selected explicitly to contain symmetrical natural objects. MSRA-1000: This data set [21], a subset of MSRA-5000 that was first proposed in [45], contains 1000 images with one single object per image and more accurate salient object binary masks. As far as we know, MSRA-1000 is currently the largest data set, including large variations in complex natural scenes and human-level salient object labels, and objects of interest covers different sizes (small, medium, and large) to avoid a size-based bias in the saliency models. 3) Model Evaluation: From a computational perspective, the main goal of the saliency model evaluation is to predict
8 1184 IEEE TRANSACTIONS ON NEURAL NETWORKS AND LEARNING SYSTEMS, VOL. 27, NO. 6, JUNE 2016 Fig. 7. Evaluation of our approach on four natural data sets. (a) MIT. (b) Toronto. (c) Kootstra. (d) MSRA Fig. 8. ROC curves with AUC values of various methods on four natural data sets. (a) MIT. (b) Toronto. (c) Kootstra. (d) MSRA scene locations on which a human observer may fixate, or separate salient foreground objects from the background. We compare 12 state-of-the-art models on the above synthetic stimuli and four benchmark data sets for evaluation. There are several different performance metrics used to quantitatively evaluate the performance of the models. The interested reader can refer to the extensive reviews for more details [81]. In this paper, we use five evaluation metrics provided by the MIT saliency benchmark [82] for comparison. These are Receiver Operating Characteristic (ROC) curve with area under the curve (AUC), normalized scanpath saliency (NSS), Kullback Leibler (KL), correlation coefficient (CC), and similarity. ROC is the most popular metric used for saliency measurement by treating a saliency map as a binary classifier through thresholding the saliency map for each pixel in the image. Then, the AUC describes the global performance of how well the saliency map predicts actual human eye fixations. Here, we use Judd et al. s [83] implementation (AUC-Judd) in the benchmark. The similarity score, KL-divergence, and CC measure the spatial deviation of the predicted saliency map from the actual fixation map. Overall, a good saliency model would have a high AUC value under the ROC score, a high similarity score, a large CC and NSS values, and a low KL-divergence. These six measures are complementary and provide a more objective evaluation of the various saliency models. B. Quantitative Comparison We evaluate our approach by comparing ROC curves (AUC) of SO saliency (SO), DO saliency (DO), and the integrated saliency (Ours) in Fig. 7. We can see that the integrated saliency significantly improves the performance of saliency detection over SO/DO saliency alone on most data sets. In addition, DO saliency performs better than SO saliency on MIT, Toronto, and Kootstra data sets, while SO saliency is comparable with the integrated saliency on MSRA-1000 data set. This is because SO and DO detect complementary salient cues. Fig. 8 summarizes the ROC curves with AUC values for our method and several state-of-the-art methods. It could be observed that our method achieves the highest AUC on ROC curves over all baselines on the MIT, Toronto, and Kootstra data sets. Our method and the GBVS [77] are comparable on the MIT and MSRA data sets, but there are some very important differences between the two methods. GBVS treats color and intensity as independent features tuning to several spatial cues (e.g., orientation, scales, and so on) separately, while our model makes limited use of feature types by only exploiting the color cues in saliency detection and achieves comparable performance. In addition, our color contextual salient cues perform much better than GBVS [77] on the Toronto and Kootstra data sets since a significant problem is that the Toronto data do not contain particular regions of interest and the Kootstra data contain symmetrical natural objects, which are full of textures and other self-similar texture-like areas, such as trees in the background of outdoor scenes. Our saliency values are obtained based on color contextual features to capture both the inner-texture object and the object itself and suppress the nonsalient surrounding homogeneous color elements. However, recent work on SF [23] and saliency optimization (wctr*) [28] perform better on the MSRA-1000 data set than our work. They measure the uniqueness and spatial distribution of elements, as well as the background associated with the image boundary, to find the exact salient objects. The overall good performance of our approach is the result of two strong context influences applied to saliency computation, while other methods make limited use of prior (location) only. We also present the evaluation results of the proposed method compared with various saliency methods using KL-divergence, similarity, CC, and NSS on the four public
9 ZHANG et al.: SPATIOCHROMATIC CONTEXT MODELING FOR COLOR SALIENCY ANALYSIS 1185 TABLE I RANKINGS OF THE TOP THREE MODELS ON FOUR DATA SETS FOR EACH METRIC TABLE II COMPARISONS OF RUNNING TIME OF DIFFERENT MODELS Fig. 9. Quantitative measurements of various methods on four natural data sets. (a) KL-divergence. (b) Similarity. (c) CC. (d) NSS. databases in Fig. 9. The rankings of the top three models are summarized in Table I. Our approach performs on par with or better than other methods on MIT and Toronto data sets, and compete others on Kootstra data set. Specifically, when measuring the KL-divergence and similarity, the performance on the Kootstra data set for most methods is better than that on the other data sets. When measuring the CC and NSS, the overall performance on the MSRA-1000 data set for each method is better than that of the other data sets, while performance is worse when measuring the KL-divergence. A possible reason for the similar measurements of KL-divergence and similarity could be that they are distribution-based evaluations, while NSS is a salience-value-based evaluation. Similarly, we note that wctr* [28] shows better performance on the MSRA-1000 data set since the optimization with background detection is very useful for salient object detection. SF [23] and TD [27] also perform better than ours on MSRA-1000 data set when measure using these four metric. One of the reasons may be that we simply use the adaptive threshold method [84] to obtain the binary segmentation of salient objects. In summary, the above results show that our approach achieves the best overall performance for saliency detection in natural scenes although in some cases it performs worse than other comparing methods, because different data sets have their own characteristics and measurements, and different metrics evaluate saliency from different aspects, which provide a more complementary evaluation of saliency models. In addition, Table II summaries the running time required to compute the saliency map of a random image for all the models. It can be seen that our approach is not as fast as most other algorithms. The reason could be that our method involves several convolution and normalization operations over multiple scales, orientations, and opponent channels in SO and DO feature computations. It should be noted that SR [20] is the fastest algorithm because it computes saliency in the frequency domain and uses only five lines of MATLAB code. FES [18] uses sparse sampling to reduce the number of operations that achieves the second best with respective to the computational time. IT [14] is also faster than most methods owing to its C implementation, while the other models are implemented in MATLAB. C. Visual Comparison We also visually compare the methods. For illustrative purposes, we also show the saliency maps on the synthetic data. The results are shown in Figs. 10 and 11 from which we observe the outstanding performance of our method as well. In particular, the response of our model to the blue bar at 135 in the top row of Fig. 10(a) is significantly enhanced by cross-oriented bars in the surrounding. Also, the red bar at 45 is salient because of the suppression induced by the surrounding blue bars. Another example shows that the suppression is reduced when the orientations or colors of the surrounding bars are random, as shown in the bottom row of Fig. 10(a). The blue bar is a pop-out due to its unique orientation cue and random red bars are detected as a salient icon because red color is the dominant color in the HVS [85]. The difference between human fixations when viewing a natural image versus a saliency map is exemplified in Fig. 11 (image examples are chosen from four natural data sets). As can be seen, while these state-of-the-art methods give good results on public benchmarks, each of them has advantages and disadvantages. Some methods work well for some images (or some parts of the image), but none of them can handle all the images. More interestingly, different saliency methods can often complement each other. Our method has advantages in handling objects with small structures and colors. This is possibly because our color contextual boundary features explicitly model one single foreground, and our color contextual region features favor a connected foreground. Our method also works well on salient object detection compared with other saliency models in Fig. 12. To obtain


10 1186 IEEE TRANSACTIONS ON NEURAL NETWORKS AND LEARNING SYSTEMS, VOL. 27, NO. 6, JUNE 2016 Fig. 10. Comparison of saliency maps between various methods on the synthetic examples. (a) Original stimuli. (b) IT. (c) GBVS. (d) SR. (e) SUN. (f) CA. (g) AIM. (h) FT. (i) CovSal. (j) TD. (k) FES. (l) SF. (m) wctr*. (n) Ours. (o) GT. Fig. 11. Comparisons of saliency maps of various methods for natural images. (a) Input image. (b) IT. (c) GBVS. (d) SR. (e) SUN. (f) CA. (g) AIM. (h) FT. (i) CovSal. (j) TD. (k) FES. (l) SF. (m) wctr*. (n) Ours. (o) GT. Fig. 12. Comparisons of salient objects detected by various methods for natural images. (a) Input image. (b) IT. (c) GBVS. (d) SR. (e) SUN. (f) CA. (g) AIM. (h) FT. (i) CovSal. (j) TD. (k) FES. (l) SF. (m) wctr*. (n) Our saliency map. (o) Our object mask. (p) GT. the binary segmentation of salient objects, we use the same adaptive threshold method [84] to show the effectiveness of our method compared with the others. We focus on algorithms that are able to handle general object appearances without category-specific information. From Fig. 12, we observe that the proposed approach achieves visually consistent segmentation results with the GT. D. Failure Cases Our color saliency model performs favorably against the existing algorithms with on par or higher accuracy. However, there are still a number of challenges that need be addressed to obtain a more reliable approach based on color salient cues. Fig. 13 shows some failure examples from our approach. The current version does not perform well for transparent objects such as glass in the first example. As the region and boundary features are both based on the color information, our method does not work well if the scene lacks color, as shown in the second example. CA [31] is based on the assumption that people tend to describe the scene other than the dominant objects and thus performs well on these two examples. In the third and fifth examples, we can see that our approach cannot detect faces. In such cases, the saliency map keeps the object boundary as the salient cue, but does not completely remove the texture pixels. Besides, all the methods cannot deal with these two images because high-level semantic information is ignored in these approaches. We failed to detect salient regions in the last example since color is the only cue considered in our approach.


 Input image. (b) IT. (c) GBVS.")
 FT. (i) CovSal. (j) TD.")
 Our saliency map. (o) GT. V.")


11 ZHANG et al.: SPATIOCHROMATIC CONTEXT MODELING FOR COLOR SALIENCY ANALYSIS 1187 Fig. 13. Failure cases of saliency maps. (a) Input image. (b) IT. (c) GBVS. (d) SR. (e) SUN. (f) CA. (g) AIM. (h) FT. (i) CovSal. (j) TD. (k) FES. (l) SF. (m) wctr*. (n) Our saliency map. (o) GT. V. C ONCLUSION In this paper, we proposed a computational framework for visual saliency analysis, based on low-level color region and color boundary processing together with local contextual interactions. Our saliency method currently focuses on color cues and uses the local color descriptors to find color salience. Color saliency was then increased by the color contextual influences that were introduced by the cross-feature suppression in a divisive normalization framework. We assigned the color saliency values to each pixel on color region and boundary feature maps by defining the perceptual color metric as color dissimilarity and the spatial difference between pixel pairs over the whole scene. Finally, we integrated the color region and the boundary saliency maps using the spatiochromatic color energy term. The experimental results showed that the chosen local color descriptors and proposed contextual influences with a global color saliency metric performed on par with or better compared with 12 state-of-the-art models on various data sets. As the future work, the learning-based techniques may provide mid-/high-level information from region and boundary priors that could be incorporated into the proposed algorithms, and an interesting extension would be to use the light field information for saliency detection beyond 2-D approaches [86], [87]. In addition, our results are not restricted to saliency detection. We are planning to extend our model to the temporal dimension to explore motion saliency in the video sequence with applications to target tracking and video segmentation. ACKNOWLEDGMENT The authors would like to thank the anonymous referees and the associate editor for their valuable comments and suggestions. R EFERENCES [1] E. C. Potter, B. Wyble, C. E. Hagmann, and E. S. McCourt, Detecting meaning in RSVP at 13 ms per picture, Attention, Perception, Psychophys., vol. 76, no. 2, pp , Feb [2] W. Wang, Y. Song, and A. Zhang, Semantics-based image retrieval by region saliency, in Proc. Int. Conf. Content-Based Image Video Retr., London, U.K., Jul. 2002, pp [3] Y. Yang, Y. Yang, and H. T. Shen, Effective transfer tagging from image to video, ACM Trans. Multimedia Comput., Commun., Appl., vol. 9, no. 2, p. 14, May [4] F. Yu, J. Cheng, Z. Li, and H. Lu, Saliency cuts: An automatic approach to object segmentation, in Proc. 19th Int. Conf. Pattern Recognit., Tampa, FL, USA, Dec. 2008, pp [5] M.-M. Cheng, G.-X. Zhang, N. J. Mitra, X. Huang, and S.-M. Hu, Global contrast based salient region detection, in Proc. 24th IEEE Conf. Comput. Vis. Pattern Recognit., Colorado Springs, CO, USA, Jun. 2011, pp [6] H. Zheng, G. Lefebvre, and C. Laurent, Fast-learning adaptive-subspace self-organizing map: An application to saliency-based invariant image feature construction, IEEE Trans. Neural Netw., vol. 19, no. 5, pp , May [7] G. Sharma, F. Jurie, and C. Schmid, Discriminative spatial saliency for image classification, in Proc. 24th IEEE Conf. Comput. Vis. Pattern Recognit., Providence, RI, USA, Jun. 2012, pp [8] T.-H. Tsai, W.-H. Cheng, C.-W. You, M.-C. Hu, A. W. Tsui, and H.-Y. Chi, Learning and recognition of on-premise signs from weakly labeled street view images, IEEE Trans. Image Process., vol. 23, no. 3, pp , Mar [9] S. Han and N. Vasconcelos, Object recognition with hierarchical discriminant saliency networks, Frontiers Comput. Neurosci., vol. 8, p. 109, Sep [10] D. Gao and N. Vasconcelos, Bottom-up saliency is a discriminant process, in Proc. 11th IEEE Int. Conf. Comput. Vis., Rio de Janeiro, Brazil, Oct. 2007, pp [11] N. D. B. Bruce and J. K. Tsotsos, Saliency based on information maximization, in Proc. 19th Annu. Conf. Neural Inf. Process. Syst., Montreal, QC, Canada, Dec. 2005, pp [12] W.-H. Cheng, W.-T. Chu, and J.-L. Wu, A visual attention based region-of-interest determination framework for video sequences, IEICE Trans. Inf. Syst., vol. E88-D, no. 7, pp , [13] X. Hou and L. Zhang, Dynamic visual attention: Searching for coding length increments, in Proc. 22nd Annu. Conf. Neural Inf. Process. Syst., Vancouver, BC, Canada, Dec. 2008, pp [14] L. Itti, C. Koch, and E. Niebur, A model of saliency-based visual attention for rapid scene analysis, IEEE Trans. Pattern Anal. Mach. Intell., vol. 20, no. 11, pp , Nov [15] D. Gao, V. Mahadevan, and N. Vasconcelos, The discriminant centersurround hypothesis for bottom-up saliency, in Proc. 22nd Annu. Conf. Neural Inf. Process. Syst., Vancouver, BC, Canada, Dec. 2008, pp [16] W.-H. Cheng, C.-W. Wang, and J.-L. Wu, Video adaptation for small display based on content recomposition, IEEE Trans. Circuits Syst. Video Technol., vol. 17, no. 1, pp , Jan [17] E. Vazquez, T. Gevers, M. Lucassen, J. van de Weijer, and R. Baldrich, Saliency of color image derivatives: A comparison between computational models and human perception, J. Opt. Soc. Amer. A, vol. 27, no. 3, pp , 2010.
12 1188 IEEE TRANSACTIONS ON NEURAL NETWORKS AND LEARNING SYSTEMS, VOL. 27, NO. 6, JUNE 2016 [18] H. R. Tavakoli, E. Rahtu, and J. Heikkilä, Fast and efficient saliency detection using sparse sampling and kernel density estimation, in Proc. 17th Scandin. Conf. Image Anal., Ystad, Sweden, May 2011, pp [19] E. Erdem and A. Erdem, Visual saliency estimation by nonlinearly integrating features using region covariances, J. Vis., vol. 13, no. 4, pp. 1 20, Mar [20] X. Hou and L. Zhang, Saliency detection: A spectral residual approach, in Proc. 20th IEEE Conf. Comput. Vis. Pattern Recognit., Minneapolis, MN, USA, Jun. 2007, pp [21] R. Achanta, S. Hemami, F. Estrada, and S. Susstrunk, Frequency-tuned salient region detection, in Proc. 22nd IEEE Conf. Comput. Vis. Pattern Recognit., Miami, FL, USA, Jun. 2009, pp [22] S. Lu, C. Tan, and J.-H. Lim, Robust and efficient saliency modeling from image co-occurrence histograms, IEEE Trans. Pattern Anal. Mach. Intell., vol. 36, no. 1, pp , Jan [23] F. Perazzi, P. Krähenbühl, Y. Pritch, and A. Hornung, Saliency filters: Contrast based filtering for salient region detection, in Proc. 25th IEEE Conf. Comput. Vis. Pattern Recognit., Providence, RI, USA, Jun. 2012, pp [24] X. Shen and Y. Wu, A unified approach to salient object detection via low rank matrix recovery, in Proc. 25th IEEE Conf. Comput. Vis. Pattern Recognit., Providence, RI, USA, Jun. 2012, pp [25] Y. Wei, F. Wen, W. Zhu, and J. Sun, Geodesic saliency using background priors, in Proc. 12th Eur. Conf. Comput. Vis., Florence, Italy, Oct. 2012, pp [26] L. Zhang, M. H. Tong, T. K. Marks, H. Shan, and G. W. Cottrell, SUN: A Bayesian framework for saliency using natural statistics, J. Vis., vol. 8, no. 7, p. 32, Dec [27] C. Scharfenberger, A. Wong, K. Fergani, D. A. Clausi, and J. S. Zelek, Statistical textural distinctiveness for salient region detection in natural images, in Proc. 26th IEEE Conf. Comput. Vis. Pattern Recognit., Portland, OR, USA, Jun. 2013, pp [28] W. Zhu, S. Liang, Y. Wei, and J. Sun, Saliency optimization from robust background detection, in Proc. 27th IEEE Conf. Comput. Vis. Pattern Recognit., Columbus, OH, USA, Jun. 2014, pp [29] Y. Liu, X. Li, L. Wang, and Y. Niu, Interpolation-tuned salient region detection, Sci. China Inf. Sci., vol. 57, no. 1, pp , [30] D. Chen and H. Chu, Scale-invariant amplitude spectrum modulation for visual saliency detection, IEEE Trans. Neural Netw. Learn. Syst., vol. 23, no. 8, pp , Aug [31] S. Goferman, L. Zelnik-Manor, and A. Tal, Context-aware saliency detection, IEEE Trans. Pattern Anal. Mach. Intell., vol. 34, no. 10, pp , Oct [32] Q. Zhao and C. Koch, Learning saliency-based visual attention: A review, Signal Process., vol. 93, no. 6, pp , Jun [33] Q. Wang, Y. Yuan, P. Yan, and X. Li, Saliency detection by multipleinstance learning, IEEE Trans. Cybern., vol. 43, no. 2, pp , Apr [34] L. Zhang, Y. Xia, R. Ji, and X. Li, Spatial-aware object-level saliency prediction by learning graphlet hierarchies, IEEE Trans. Ind. Electron, vol. 62, no. 2, pp , Feb [35] F. Zhu and L. Shao, Weakly-supervised cross-domain dictionary learning for visual recognition, Int. J. Comput. Vis., vol. 109, nos. 1 2, pp , Aug [36] J. Han, S. He, X. Qian, D. Wang, L. Guo, and T. Liu, An objectoriented visual saliency detection framework based on sparse coding representations, IEEE Trans. Circuits Syst. Video Technol., vol. 23, no. 12, pp , Dec [37] J. Han et al., Efficient, simultaneous detection of multi-class geospatial targets based on visual saliency modeling and discriminative learning of sparse coding, ISPRS J. Photogramm. Remote Sens., vol. 89, pp , Mar [38] X. Li, H. Lu, L. Zhang, X. Ruan, and M.-H. Yang, Saliency detection via dense and sparse reconstruction, in Proc. 14th IEEE Int. Conf. Comput. Vis., Sydney, NSW, Australia, Dec. 2013, pp [39] C. Shen and Q. Zhao, Learning to predict eye fixations for semantic contents using multi-layer sparse network, Neurocomputing, vol. 138, pp , Aug [40] J. Han, D. Zhang, S. Wen, L. Guo, T. Liu, and X. Li, Two-stage learning to predict human eye fixations via sdaes, IEEE Trans. Syst., Man, Cybern., vol. PP, no. 99, Feb. 2015, doi: /TCYB [41] S. Wen, J. Han, D. Zhang, and L. Guo, Saliency detection based on feature learning using deep Boltzmann machines, in Proc. IEEE Int. Conf. Multimedia Expo, Chengdu, China, Jul. 2014, pp [42] Q. Zhao and C. Koch, Learning visual saliency by combining feature maps in a nonlinear manner using AdaBoost, J. Vis., vol. 12, no. 6, p. 22, Jun [43] J. Han, D. Zhang, X. Hu, L. Guo, J. Ren, and F. Wu, Background prior-based salient object detection via deep reconstruction residual, IEEE Trans. Circuits Syst. Video Technol., vol. 25, no. 8, pp , Aug [44] J. Han, K. N. Ngan, M. Li, and H.-J. Zhang, Unsupervised extraction of visual attention objects in color images, IEEE Trans. Circuits Syst. Video Technol., vol. 16, no. 1, pp , Jan [45] T. Liu et al., Learning to detect a salient object, IEEE Trans. Pattern Anal. Mach. Intell., vol. 33, no. 2, pp , Feb [46] L. Yang and Y. Zhou, Exploring feature sets for two-phase biomedical named entity recognition using semi-crfs, Knowl. Inf. Syst., vol. 40, no. 2, pp , [47] P. Balamurugan, S. Shevade, and T. R. Babu, Scalable sequential alternating proximal methods for sparse structural SVMs and CRFs, Knowl. Inf. Syst., vol. 38, no. 3, pp , Mar [48] Y. Yang, Y. Yang, Z. Huang, H. T. Shen, and F. Nie, Tag localization with spatial correlations and joint group sparsity, in Proc. 25th IEEE Conf. Comput. Vis. Pattern Recognit., Providence, RI, USA, Jun. 2011, pp [49] H. Zhao, J. Chen, Y. Han, and X. Cao, Image aesthetics enhancement using composition-based saliency detection, Multimedia Syst., vol. 21, no. 2, pp , Mar [50] K. E. A. van de Sande, T. Gevers, and C. G. M. Snoek, Evaluating color descriptors for object and scene recognition, IEEE Trans. Pattern Anal. Mach. Intell., vol. 32, no. 9, pp , Sep [51] S.-J. Wang, J. Yang, M.-F. Sun, X.-J. Peng, M.-M. Sun, and C.-G. Zhou, Sparse tensor discriminant color space for face verification, IEEE Trans. Neural Netw. Learn. Syst., vol. 23, no. 6, pp , Jun [52] X. Cao, Y. Zhang, X. Guo, Y.-M. Cheung, Video color conceptualization using optimization, Sci. China Inf. Sci., vol. 57, no. 7, pp , [53] J. Zhang, Y. Barhomi, and T. Serre, A new biologically inspired color image descriptor, in Proc. 12th Eur. Conf. Comput. Vis., Florence, Italy, Oct. 2012, pp [54] M. S. Livingstone and D. H. Hubel, Anatomy and physiology of a color system in the primate visual cortex, J. Neurosci., vol. 4, no. 1, pp , [55] C. Koch and S. Ullman, Shifts in selective visual attention: Towards the underlying neural circuitry, Human Neurobiol., vol. 4, no. 4, pp , [56] L. Itti and C. Koch, Computational modelling of visual attention, Nature Rev. Neurosci., vol. 2, no. 3, pp , [57] Z. Li, A saliency map in primary visual cortex, Trends Cognit. Sci., vol. 6, no. 1, pp. 9 16, Jan [58] L. Zhaoping and L. Zhe, Properties of V1 neurons tuned to conjunctions of visual features: Application of the V1 saliency hypothesis to visual search behavior, PLoS ONE, vol. 7, no. 6, p. e36223, [59] A. R. Koene and L. Zhaoping, Feature-specific interactions in salience from combined feature contrasts: Evidence for a bottom up saliency map in V1, J. Vis., vol. 7, no. 7, pp. 1 14, May [60] B. Li, J. K. Thompson, T. Duong, M. R. Peterson, and R. D. Freeman, Origins of cross-orientation suppression in the visual cortex, J. Neurophysiol., vol. 96, no. 4, pp , [61] R. Shapley and M. J. Hawken, Color in the cortex: Single- and doubleopponent cells, Vis. Res., vol. 51, no. 7, pp , Apr [62] A. M. Treisman and G. Gelade, A feature-integration theory of attention, Cognit. Psychol., vol. 12, no. 1, pp , Jan [63] D. J. Heeger, Normalization of cell responses in cat striate cortex, J. Neurosci., vol. 9, no. 2, pp , [64] T. Judd, K. Ehinger, F. Durand, and A. Torralba, Learning to predict where humans look, in Proc. 12th IEEE Int. Conf. Comput. Vis., Kyoto, Japan, Sep./Oct. 2009, pp [65] B. R. Conway and M. S. Livingstone, Spatial and temporal properties of cone signals in alert macaque primary visual cortex, J. Neurosci., vol. 26, no. 42, pp , [66] G. J. Brouwer and D. J. Heeger, Cross-orientation suppression in human visual cortex, J. Neurophysiol., vol. 106, no. 5, pp , [67] J. H. Reynolds and D. J. Heeger, The normalization model of attention, Neuron, vol. 61, no. 2, pp , Jan [68] M. Carandini and D. J. Heeger, Normalization as a canonical neural computation, Nature Rev. Neurosci., vol. 13, pp , Jan [69] D. G. Lowe, Distinctive image features from scale-invariant keypoints, Int. J. Comput. Vis., vol. 60, no. 2, pp , Nov
![ZHANG et al.: SPATIOCHROMATIC CONTEXT MODELING FOR COLOR SALIENCY ANALYSIS 1189 [70] O. Chomat, V. C. de Verdière, D. Hall, and J. L.](/docs-images/82/85877719/images/13-0.jpg "Crowley, Local scale selection for Gaussian based description techniques, in Proc. 6th Eur. Conf. Comput. Vis., Dublin, Ireland, Jun. 2000, pp. 117 134. [71] E. H. Adelson and J. R.")
![Bergen, Spatiotemporal energy models for the perception of motion, J. Opt. Soc. Amer. A, vol. 2, no. 2, pp. 284 299, 1985. [72] M. Carandini and D. J. Heeger, Summation and division by neurons in primate visual cortex, Science, vol.](/docs-images/82/85877719/images/13-1.jpg "264, no. 5163, pp. 1333 1336, 1994. [73] X. Hou, J. Harel, and C. Koch, Image signature: Highlighting sparse salient regions, IEEE Trans. Pattern Anal. Mach. Intell., vol. 34, no. 1, pp. 194 201, Jan.")
![2012. [74] S. Kopf, B. Guthier, P. Schaber, T. Dittrich, and W. Effelsberg, Analysis of disparity maps for detecting saliency in stereoscopic video, Dept. Comput. Sci., Univ.](/docs-images/82/85877719/images/13-2.jpg "Mannheim, Mannheim, Germany, Tech. Rep. TR-2013-003, 2013. [75] J. Zhang and S. Sclaroff, Saliency detection: A Boolean map approach, in Proc. 14th IEEE Int. Conf. Comput. Vis.")
![, Sydney, NSW, Australia, Dec. 2013, pp. 153 160. [76] G. Kootstra, B. de Boer, and L. R. B. Schomaker, Predicting eye fixations on complex visual stimuli using local symmetry, Cognit. Comput., vol.](/docs-images/82/85877719/images/13-3.jpg "3, no. 1, pp. 223 240, Mar. 2011. [77] J. Harel, C. Koch, and P. Perona, Graph-based visual saliency, in Proc. 21th Annu. Conf. Neural Inf. Process. Syst., Vancouver, BC, Canada, Dec. 2007, pp.")
13 ZHANG et al.: SPATIOCHROMATIC CONTEXT MODELING FOR COLOR SALIENCY ANALYSIS 1189 [70] O. Chomat, V. C. de Verdière, D. Hall, and J. L. Crowley, Local scale selection for Gaussian based description techniques, in Proc. 6th Eur. Conf. Comput. Vis., Dublin, Ireland, Jun. 2000, pp [71] E. H. Adelson and J. R. Bergen, Spatiotemporal energy models for the perception of motion, J. Opt. Soc. Amer. A, vol. 2, no. 2, pp , [72] M. Carandini and D. J. Heeger, Summation and division by neurons in primate visual cortex, Science, vol. 264, no. 5163, pp , [73] X. Hou, J. Harel, and C. Koch, Image signature: Highlighting sparse salient regions, IEEE Trans. Pattern Anal. Mach. Intell., vol. 34, no. 1, pp , Jan [74] S. Kopf, B. Guthier, P. Schaber, T. Dittrich, and W. Effelsberg, Analysis of disparity maps for detecting saliency in stereoscopic video, Dept. Comput. Sci., Univ. Mannheim, Mannheim, Germany, Tech. Rep. TR , [75] J. Zhang and S. Sclaroff, Saliency detection: A Boolean map approach, in Proc. 14th IEEE Int. Conf. Comput. Vis., Sydney, NSW, Australia, Dec. 2013, pp [76] G. Kootstra, B. de Boer, and L. R. B. Schomaker, Predicting eye fixations on complex visual stimuli using local symmetry, Cognit. Comput., vol. 3, no. 1, pp , Mar [77] J. Harel, C. Koch, and P. Perona, Graph-based visual saliency, in Proc. 21th Annu. Conf. Neural Inf. Process. Syst., Vancouver, BC, Canada, Dec. 2007, pp [78] L. Zhaoping and R. J. Snowden, A theory of a saliency map in primary visual cortex (V1) tested by psychophysics of colour orientation interference in texture segmentation, Vis. Cognit., vol. 14, nos. 4 8, pp , [79] Q. Zhao and C. Koch, Learning a saliency map using fixated locations in natural scenes, J. Vis., vol. 11, no. 3, pp. 1 15, [80] A. Olmos and F. A. Kingdom, A biologically inspired algorithm for the recovery of shading and reflectance images, Perception, vol. 33, no. 12, pp , [81] A. Borji, H. R. Tavakoli, D. N. Sihite, and L. Itti, Analysis of scores, datasets, and models in visual saliency prediction, in Proc. 14th IEEE Int. Conf. Comput. Vis., Sydney, NSW, Australia, Dec. 2013, pp [82] Z. Bylinskii, T. Judd, A. Borji, L. Itti, F. Durand, A. Oliva, and A. Torralba. (Jan. 2012). MIT Saliency Benchmark. [Online]. Available: [83] T. Judd, F. Durand, and A. Torralba, A benchmark of computational models of saliency to predict human fixations, Dept. Comput. Graph., Massachusetts Inst. Technol., Cambridge, MA, USA, Tech. Rep. MIT-CSAIL-TR , [84] X. Li, Y. Li, C. Shen, A. Dick, and A. van den Hengel, Contextual hypergraph modeling for salient object detection, in Proc. 14th IEEE Int. Conf. Comput. Vis., Sydney, NSW, Australia, Dec. 2013, pp [85] C. M. Stoughton and B. R. Conway, Neural basis for unique hues, Current Biol., vol. 18, no. 6, pp. R698 R699, Aug [86] X. Zhang, Y. Wang, J. Zhang, L. Hu, and M. Wang, Light field saliency vs. 2D saliency: A comparative study, Neurocomputing, vol. 166, pp , Oct [87] J. Zhang, M. Wang, J. Gao, Y. Wang, X. Zhang, and X. Wu, Saliency detection with a deeper investigation of light field, in Proc. 24th Int. Joint Conf. Artif. Intell., Buenos Aires, Argentina, Jul. 2015, pp Jun Zhang received the B.S., M.S., and Ph.D. degrees from the School of Computer Science and Information Engineering, Hefei University of Technology (HFUT), Hefei, China, in 2007, 2009, and 2013, respectively. She was with the Department of Cognitive, Linguistic and Psychological Sciences, Brown University, Providence, RI, USA, as a Visiting Research Fellow, from 2010 to 2012 and in Since 2013, she has been a Post-Doctoral Fellow in computer science, and also acts as a Lecturer with the School of Computer Science and Information Engineering, HFUT. Her current research interests include computer vision, vision perception, and machine learning. Meng Wang (M 09) received the B.E. degree from the Special Class for the Gifted Young, and the Ph.D. degree from the Department of Electronic Engineering and Information Science, University of Science and Technology of China, Hefei, China. He is currently a Professor with the Hefei University of Technology, Hefei. His current research interests include multimedia content analysis, search, mining, recommendation, and large-scale computing. Mr. Wang received the best paper awards successively from the 17th and 18th ACM International Conference on Multimedia, the best paper award from the 16th International Multimedia Modeling Conference and the 4th International Conference on Internet Multimedia Computing and Service, and the Best Demo Award from the 20th ACM International Conference on Multimedia. Shengping Zhang (M 13) received the Ph.D. degree in computer science from the Harbin Institute of Technology, Harbin, China, in He was a Post-Doctoral Research Associate with Brown University, Providence, RI, USA, a Post-Doctoral Research Fellow with Hong Kong Baptist University, Hong Kong, and a Visiting Student Researcher with the University of California at Berkeley, Berkeley, CA, USA. He is currently an Associate Professor with the School of Computer Science and Technology, Harbin Institute of Technology, Weihai, China. He has authored or co-authored over 30 research publications in refereed journals and conferences. His current research interests include sparse coding and its applications in computer vision. Dr. Zhang is also an Associate Editor of Signal Image and Video Processing. Xuelong Li (M 02 SM 07 F 12) is currently a Full Professor with the State Key Laboratory of Transient Optics and Photonics, Center for Optical Imagery Analysis and Learning, Xi an Institute of Optics and Precision Mechanics, Chinese Academy of Sciences, Xi an, China. Xindong Wu (F 11) received the bachelor s and master s degrees in computer science from the Hefei University of Technology, Hefei, China, and the Ph.D. degree in artificial intelligence from the University of Edinburgh, Edinburgh, U.K. He is currently a Yangtze River Scholar with the School of Computer Science and Information Engineering, Hefei University of Technology, and a Professor of Computer Science with the University of Vermont, Burlington, VT, USA. His current research interests include data mining, knowledgebased systems, and Web information exploration. Prof. Wu is a fellow of the American Association for the Advancement of Science. He is the Steering Committee Chair of the IEEE International Conference on Data Mining (ICDM), and the Editor-in-Chief of Knowledge and Information Systems (Springer) and Springer Book Series on Advanced Information and Knowledge Processing. He was the Editor-in-Chief of the IEEE TRANSACTIONS ON KNOWLEDGE AND DATA ENGINEERING of the IEEE Computer Society from 2005 to He served as a Program Committee Chair/Co-Chair of ICDM 03, the 13th ACM SIGKDD International Conference on Knowledge Discovery and Data Mining, and the 19th ACM Conference on Information and Knowledge Management in 2010.
VIDEO SALIENCY INCORPORATING SPATIOTEMPORAL CUES AND UNCERTAINTY WEIGHTING
 VIDEO SALIENCY INCORPORATING SPATIOTEMPORAL CUES AND UNCERTAINTY WEIGHTING Yuming Fang, Zhou Wang 2, Weisi Lin School of Computer Engineering, Nanyang Technological University, Singapore 2 Department of
VISUAL search is necessary for rapid scene analysis
 IEEE TRANSACTIONS ON IMAGE PROCESSING, VOL. 25, NO. 8, AUGUST 2016 3475 A Unified Framework for Salient Structure Detection by Contour-Guided Visual Search Kai-Fu Yang, Hui Li, Chao-Yi Li, and Yong-Jie
Recurrent Refinement for Visual Saliency Estimation in Surveillance Scenarios
 2012 Ninth Conference on Computer and Robot Vision Recurrent Refinement for Visual Saliency Estimation in Surveillance Scenarios Neil D. B. Bruce*, Xun Shi*, and John K. Tsotsos Department of Computer
Computational Cognitive Science
 Computational Cognitive Science Lecture 15: Visual Attention Chris Lucas (Slides adapted from Frank Keller s) School of Informatics University of Edinburgh clucas2@inf.ed.ac.uk 14 November 2017 1 / 28
Computational Cognitive Science
 Computational Cognitive Science Lecture 19: Contextual Guidance of Attention Chris Lucas (Slides adapted from Frank Keller s) School of Informatics University of Edinburgh clucas2@inf.ed.ac.uk 20 November
A Visual Saliency Map Based on Random Sub-Window Means
 A Visual Saliency Map Based on Random Sub-Window Means Tadmeri Narayan Vikram 1,2, Marko Tscherepanow 1 and Britta Wrede 1,2 1 Applied Informatics Group 2 Research Institute for Cognition and Robotics
Computational Cognitive Science. The Visual Processing Pipeline. The Visual Processing Pipeline. Lecture 15: Visual Attention.
 Lecture 15: Visual Attention School of Informatics University of Edinburgh keller@inf.ed.ac.uk November 11, 2016 1 2 3 Reading: Itti et al. (1998). 1 2 When we view an image, we actually see this: The
NMF-Density: NMF-Based Breast Density Classifier
 NMF-Density: NMF-Based Breast Density Classifier Lahouari Ghouti and Abdullah H. Owaidh King Fahd University of Petroleum and Minerals - Department of Information and Computer Science. KFUPM Box 1128.
Models of Attention. Models of Attention
 Models of Models of predictive: can we predict eye movements (bottom up attention)? [L. Itti and coll] pop out and saliency? [Z. Li] Readings: Maunsell & Cook, the role of attention in visual processing,
Subjective randomness and natural scene statistics
 Psychonomic Bulletin & Review 2010, 17 (5), 624-629 doi:10.3758/pbr.17.5.624 Brief Reports Subjective randomness and natural scene statistics Anne S. Hsu University College London, London, England Thomas
The 29th Fuzzy System Symposium (Osaka, September 9-, 3) Color Feature Maps (BY, RG) Color Saliency Map Input Image (I) Linear Filtering and Gaussian
 Color Feature Maps (BY, RG) Color Saliency Map Input Image (I) Linear Filtering and Gaussian") The 29th Fuzzy System Symposium (Osaka, September 9-, 3) A Fuzzy Inference Method Based on Saliency Map for Prediction Mao Wang, Yoichiro Maeda 2, Yasutake Takahashi Graduate School of Engineering, University
The 29th Fuzzy System Symposium (Osaka, September 9-, 3) A Fuzzy Inference Method Based on Saliency Map for Prediction Mao Wang, Yoichiro Maeda 2, Yasutake Takahashi Graduate School of Engineering, University
Finding Saliency in Noisy Images
 Finding Saliency in Noisy Images Chelhwon Kim and Peyman Milanfar Electrical Engineering Department, University of California, Santa Cruz, CA, USA ABSTRACT Recently, many computational saliency models
On the implementation of Visual Attention Architectures
 On the implementation of Visual Attention Architectures KONSTANTINOS RAPANTZIKOS AND NICOLAS TSAPATSOULIS DEPARTMENT OF ELECTRICAL AND COMPUTER ENGINEERING NATIONAL TECHNICAL UNIVERSITY OF ATHENS 9, IROON
OPTO 5320 VISION SCIENCE I
 OPTO 5320 VISION SCIENCE I Monocular Sensory Processes of Vision: Color Vision Mechanisms of Color Processing . Neural Mechanisms of Color Processing A. Parallel processing - M- & P- pathways B. Second
Reading Assignments: Lecture 18: Visual Pre-Processing. Chapters TMB Brain Theory and Artificial Intelligence
 Brain Theory and Artificial Intelligence Lecture 18: Visual Pre-Processing. Reading Assignments: Chapters TMB2 3.3. 1 Low-Level Processing Remember: Vision as a change in representation. At the low-level,
Salient Object Detection in Videos Based on SPATIO-Temporal Saliency Maps and Colour Features
 Salient Object Detection in Videos Based on SPATIO-Temporal Saliency Maps and Colour Features U.Swamy Kumar PG Scholar Department of ECE, K.S.R.M College of Engineering (Autonomous), Kadapa. ABSTRACT Salient
HUMAN VISUAL PERCEPTION CONCEPTS AS MECHANISMS FOR SALIENCY DETECTION
 HUMAN VISUAL PERCEPTION CONCEPTS AS MECHANISMS FOR SALIENCY DETECTION Oana Loredana BUZATU Gheorghe Asachi Technical University of Iasi, 11, Carol I Boulevard, 700506 Iasi, Romania lbuzatu@etti.tuiasi.ro
MEMORABILITY OF NATURAL SCENES: THE ROLE OF ATTENTION
 MEMORABILITY OF NATURAL SCENES: THE ROLE OF ATTENTION Matei Mancas University of Mons - UMONS, Belgium NumediArt Institute, 31, Bd. Dolez, Mons matei.mancas@umons.ac.be Olivier Le Meur University of Rennes
196 IEEE TRANSACTIONS ON AUTONOMOUS MENTAL DEVELOPMENT, VOL. 2, NO. 3, SEPTEMBER 2010
 196 IEEE TRANSACTIONS ON AUTONOMOUS MENTAL DEVELOPMENT, VOL. 2, NO. 3, SEPTEMBER 2010 Top Down Gaze Movement Control in Target Search Using Population Cell Coding of Visual Context Jun Miao, Member, IEEE,
An Information Theoretic Model of Saliency and Visual Search
 An Information Theoretic Model of Saliency and Visual Search Neil D.B. Bruce and John K. Tsotsos Department of Computer Science and Engineering and Centre for Vision Research York University, Toronto,
An Attentional Framework for 3D Object Discovery
 An Attentional Framework for 3D Object Discovery Germán Martín García and Simone Frintrop Cognitive Vision Group Institute of Computer Science III University of Bonn, Germany Saliency Computation Saliency
Computational Models of Visual Attention: Bottom-Up and Top-Down. By: Soheil Borhani
 Computational Models of Visual Attention: Bottom-Up and Top-Down By: Soheil Borhani Neural Mechanisms for Visual Attention 1. Visual information enter the primary visual cortex via lateral geniculate nucleus
Fusing Generic Objectness and Visual Saliency for Salient Object Detection
 Fusing Generic Objectness and Visual Saliency for Salient Object Detection Yasin KAVAK 06/12/2012 Citation 1: Salient Object Detection: A Benchmark Fusing for Salient Object Detection INDEX (Related Work)
The discriminant center-surround hypothesis for bottom-up saliency
 Appears in the Neural Information Processing Systems (NIPS) Conference, 27. The discriminant center-surround hypothesis for bottom-up saliency Dashan Gao Vijay Mahadevan Nuno Vasconcelos Department of
USING AUDITORY SALIENCY TO UNDERSTAND COMPLEX AUDITORY SCENES
 USING AUDITORY SALIENCY TO UNDERSTAND COMPLEX AUDITORY SCENES Varinthira Duangudom and David V Anderson School of Electrical and Computer Engineering, Georgia Institute of Technology Atlanta, GA 30332
Object recognition and hierarchical computation
 Object recognition and hierarchical computation Challenges in object recognition. Fukushima s Neocognitron View-based representations of objects Poggio s HMAX Forward and Feedback in visual hierarchy Hierarchical
Modeling the Deployment of Spatial Attention
 17 Chapter 3 Modeling the Deployment of Spatial Attention 3.1 Introduction When looking at a complex scene, our visual system is confronted with a large amount of visual information that needs to be broken
Keywords- Saliency Visual Computational Model, Saliency Detection, Computer Vision, Saliency Map. Attention Bottle Neck
 Volume 3, Issue 9, September 2013 ISSN: 2277 128X International Journal of Advanced Research in Computer Science and Software Engineering Research Paper Available online at: www.ijarcsse.com Visual Attention
Local Image Structures and Optic Flow Estimation
 Local Image Structures and Optic Flow Estimation Sinan KALKAN 1, Dirk Calow 2, Florentin Wörgötter 1, Markus Lappe 2 and Norbert Krüger 3 1 Computational Neuroscience, Uni. of Stirling, Scotland; {sinan,worgott}@cn.stir.ac.uk
Biologically Motivated Local Contextual Modulation Improves Low-Level Visual Feature Representations
 Biologically Motivated Local Contextual Modulation Improves Low-Level Visual Feature Representations Xun Shi,NeilD.B.Bruce, and John K. Tsotsos Department of Computer Science & Engineering, and Centre
Visual Saliency with Statistical Priors
 Int J Comput Vis (2014) 107:239 253 DOI 10.1007/s11263-013-0678-0 Visual Saliency with Statistical Priors Jia Li Yonghong Tian Tiejun Huang Received: 21 December 2012 / Accepted: 21 November 2013 / Published
EECS 433 Statistical Pattern Recognition
 EECS 433 Statistical Pattern Recognition Ying Wu Electrical Engineering and Computer Science Northwestern University Evanston, IL 60208 http://www.eecs.northwestern.edu/~yingwu 1 / 19 Outline What is Pattern
Natural Scene Statistics and Perception. W.S. Geisler
 Natural Scene Statistics and Perception W.S. Geisler Some Important Visual Tasks Identification of objects and materials Navigation through the environment Estimation of motion trajectories and speeds
lateral organization: maps
 lateral organization Lateral organization & computation cont d Why the organization? The level of abstraction? Keep similar features together for feedforward integration. Lateral computations to group
Can Saliency Map Models Predict Human Egocentric Visual Attention?
 Can Saliency Map Models Predict Human Egocentric Visual Attention? Kentaro Yamada 1, Yusuke Sugano 1, Takahiro Okabe 1 Yoichi Sato 1, Akihiro Sugimoto 2, and Kazuo Hiraki 3 1 The University of Tokyo, Tokyo,
Extraction of Blood Vessels and Recognition of Bifurcation Points in Retinal Fundus Image
 International Journal of Research Studies in Science, Engineering and Technology Volume 1, Issue 5, August 2014, PP 1-7 ISSN 2349-4751 (Print) & ISSN 2349-476X (Online) Extraction of Blood Vessels and
Dynamic Visual Attention: Searching for coding length increments
 Dynamic Visual Attention: Searching for coding length increments Xiaodi Hou 1,2 and Liqing Zhang 1 1 Department of Computer Science and Engineering, Shanghai Jiao Tong University No. 8 Dongchuan Road,
Morton-Style Factorial Coding of Color in Primary Visual Cortex
 Morton-Style Factorial Coding of Color in Primary Visual Cortex Javier R. Movellan Institute for Neural Computation University of California San Diego La Jolla, CA 92093-0515 movellan@inc.ucsd.edu Thomas
Pre-Attentive Visual Selection
 Pre-Attentive Visual Selection Li Zhaoping a, Peter Dayan b a University College London, Dept. of Psychology, UK b University College London, Gatsby Computational Neuroscience Unit, UK Correspondence to
Visual Saliency Based on Multiscale Deep Features Supplementary Material
 Visual Saliency Based on Multiscale Deep Features Supplementary Material Guanbin Li Yizhou Yu Department of Computer Science, The University of Hong Kong https://sites.google.com/site/ligb86/mdfsaliency/
Hierarchical Bayesian Modeling of Individual Differences in Texture Discrimination
 Hierarchical Bayesian Modeling of Individual Differences in Texture Discrimination Timothy N. Rubin (trubin@uci.edu) Michael D. Lee (mdlee@uci.edu) Charles F. Chubb (cchubb@uci.edu) Department of Cognitive
SUN: A Model of Visual Salience Using Natural Statistics. Gary Cottrell Lingyun Zhang Matthew Tong Tim Marks Honghao Shan Nick Butko Javier Movellan
 SUN: A Model of Visual Salience Using Natural Statistics Gary Cottrell Lingyun Zhang Matthew Tong Tim Marks Honghao Shan Nick Butko Javier Movellan 1 Collaborators QuickTime and a TIFF (LZW) decompressor
SUN: A Bayesian Framework for Saliency Using Natural Statistics
 SUN: A Bayesian Framework for Saliency Using Natural Statistics Lingyun Zhang Tim K. Marks Matthew H. Tong Honghao Shan Garrison W. Cottrell Dept. of Computer Science and Engineering University of California,
An Evaluation of Motion in Artificial Selective Attention
 An Evaluation of Motion in Artificial Selective Attention Trent J. Williams Bruce A. Draper Colorado State University Computer Science Department Fort Collins, CO, U.S.A, 80523 E-mail: {trent, draper}@cs.colostate.edu
Hierarchical Convolutional Features for Visual Tracking
 Hierarchical Convolutional Features for Visual Tracking Chao Ma Jia-Bin Huang Xiaokang Yang Ming-Husan Yang SJTU UIUC SJTU UC Merced ICCV 2015 Background Given the initial state (position and scale), estimate
Object-Level Saliency Detection Combining the Contrast and Spatial Compactness Hypothesis
 Object-Level Saliency Detection Combining the Contrast and Spatial Compactness Hypothesis Chi Zhang 1, Weiqiang Wang 1, 2, and Xiaoqian Liu 1 1 School of Computer and Control Engineering, University of
Computational modeling of visual attention and saliency in the Smart Playroom
 Computational modeling of visual attention and saliency in the Smart Playroom Andrew Jones Department of Computer Science, Brown University Abstract The two canonical modes of human visual attention bottomup
Recognizing Scenes by Simulating Implied Social Interaction Networks
 Recognizing Scenes by Simulating Implied Social Interaction Networks MaryAnne Fields and Craig Lennon Army Research Laboratory, Aberdeen, MD, USA Christian Lebiere and Michael Martin Carnegie Mellon University,
Properties of V1 neurons tuned to conjunctions of visual features: application of the V1 saliency hypothesis to visual search behavior
 Properties of 1 neurons tuned to conjunctions of visual features: application of the 1 saliency hypothesis to visual search behavior Li Zhaoping 1,2, Li Zhe 2 Published 2012 in PLoS ONE 7(6): e36223. doi:10.1371/journal.pone.0036223
Detection of Glaucoma and Diabetic Retinopathy from Fundus Images by Bloodvessel Segmentation
 International Journal of Engineering and Advanced Technology (IJEAT) ISSN: 2249 8958, Volume-5, Issue-5, June 2016 Detection of Glaucoma and Diabetic Retinopathy from Fundus Images by Bloodvessel Segmentation
Evaluating Visual Saliency Algorithms: Past, Present and Future
 Journal of Imaging Science and Technology R 59(5): 050501-1 050501-17, 2015. c Society for Imaging Science and Technology 2015 Evaluating Visual Saliency Algorithms: Past, Present and Future Puneet Sharma
Measuring the attentional effect of the bottom-up saliency map of natural images
 Measuring the attentional effect of the bottom-up saliency map of natural images Cheng Chen 1,3, Xilin Zhang 2,3, Yizhou Wang 1,3, and Fang Fang 2,3,4,5 1 National Engineering Lab for Video Technology
Video Saliency Detection via Dynamic Consistent Spatio- Temporal Attention Modelling
 AAAI -13 July 16, 2013 Video Saliency Detection via Dynamic Consistent Spatio- Temporal Attention Modelling Sheng-hua ZHONG 1, Yan LIU 1, Feifei REN 1,2, Jinghuan ZHANG 2, Tongwei REN 3 1 Department of
On the role of context in probabilistic models of visual saliency
 1 On the role of context in probabilistic models of visual saliency Date Neil Bruce, Pierre Kornprobst NeuroMathComp Project Team, INRIA Sophia Antipolis, ENS Paris, UNSA, LJAD 2 Overview What is saliency?
Adding Shape to Saliency: A Computational Model of Shape Contrast
 Adding Shape to Saliency: A Computational Model of Shape Contrast Yupei Chen 1, Chen-Ping Yu 2, Gregory Zelinsky 1,2 Department of Psychology 1, Department of Computer Science 2 Stony Brook University
Psychophysical tests of the hypothesis of a bottom-up saliency map in primary visual cortex
 Psychophysical tests of the hypothesis of a bottom-up saliency map in primary visual cortex In press for Public Library of Science, Computational Biology, (2007). Citation: Zhaoping L. May KA (2007) Psychophysical
Validating the Visual Saliency Model
 Validating the Visual Saliency Model Ali Alsam and Puneet Sharma Department of Informatics & e-learning (AITeL), Sør-Trøndelag University College (HiST), Trondheim, Norway er.puneetsharma@gmail.com Abstract.
Ch.20 Dynamic Cue Combination in Distributional Population Code Networks. Ka Yeon Kim Biopsychology
 Ch.20 Dynamic Cue Combination in Distributional Population Code Networks Ka Yeon Kim Biopsychology Applying the coding scheme to dynamic cue combination (Experiment, Kording&Wolpert,2004) Dynamic sensorymotor
Saliency aggregation: Does unity make strength?
 Saliency aggregation: Does unity make strength? Olivier Le Meur a and Zhi Liu a,b a IRISA, University of Rennes 1, FRANCE b School of Communication and Information Engineering, Shanghai University, CHINA
EARLY STAGE DIAGNOSIS OF LUNG CANCER USING CT-SCAN IMAGES BASED ON CELLULAR LEARNING AUTOMATE
 EARLY STAGE DIAGNOSIS OF LUNG CANCER USING CT-SCAN IMAGES BASED ON CELLULAR LEARNING AUTOMATE SAKTHI NEELA.P.K Department of M.E (Medical electronics) Sengunthar College of engineering Namakkal, Tamilnadu,
Just One View: Invariances in Inferotemporal Cell Tuning
 Just One View: Invariances in Inferotemporal Cell Tuning Maximilian Riesenhuber Tomaso Poggio Center for Biological and Computational Learning and Department of Brain and Cognitive Sciences Massachusetts
VENUS: A System for Novelty Detection in Video Streams with Learning
 VENUS: A System for Novelty Detection in Video Streams with Learning Roger S. Gaborski, Vishal S. Vaingankar, Vineet S. Chaoji, Ankur M. Teredesai Laboratory for Applied Computing, Rochester Institute
CN530, Spring 2004 Final Report Independent Component Analysis and Receptive Fields. Madhusudana Shashanka
 CN530, Spring 2004 Final Report Independent Component Analysis and Receptive Fields Madhusudana Shashanka shashanka@cns.bu.edu 1 Abstract This report surveys the literature that uses Independent Component
using deep learning models to understand visual cortex
 using deep learning models to understand visual cortex 11-785 Introduction to Deep Learning Fall 2017 Michael Tarr Department of Psychology Center for the Neural Basis of Cognition this lecture A bit out
Control of Selective Visual Attention: Modeling the "Where" Pathway
 Control of Selective Visual Attention: Modeling the "Where" Pathway Ernst Niebur Computation and Neural Systems 139-74 California Institute of Technology Christof Koch Computation and Neural Systems 139-74
Methods for comparing scanpaths and saliency maps: strengths and weaknesses
 Methods for comparing scanpaths and saliency maps: strengths and weaknesses O. Le Meur olemeur@irisa.fr T. Baccino thierry.baccino@univ-paris8.fr Univ. of Rennes 1 http://www.irisa.fr/temics/staff/lemeur/
TWO HANDED SIGN LANGUAGE RECOGNITION SYSTEM USING IMAGE PROCESSING
 134 TWO HANDED SIGN LANGUAGE RECOGNITION SYSTEM USING IMAGE PROCESSING H.F.S.M.Fonseka 1, J.T.Jonathan 2, P.Sabeshan 3 and M.B.Dissanayaka 4 1 Department of Electrical And Electronic Engineering, Faculty
IN this paper we examine the role of shape prototypes in
 On the Role of Shape Prototypes in Hierarchical Models of Vision Michael D. Thomure, Melanie Mitchell, and Garrett T. Kenyon To appear in Proceedings of the International Joint Conference on Neural Networks
SUPPLEMENTARY INFORMATION. Table 1 Patient characteristics Preoperative. language testing
 Categorical Speech Representation in the Human Superior Temporal Gyrus Edward F. Chang, Jochem W. Rieger, Keith D. Johnson, Mitchel S. Berger, Nicholas M. Barbaro, Robert T. Knight SUPPLEMENTARY INFORMATION
AUTOMATIC DIABETIC RETINOPATHY DETECTION USING GABOR FILTER WITH LOCAL ENTROPY THRESHOLDING
 AUTOMATIC DIABETIC RETINOPATHY DETECTION USING GABOR FILTER WITH LOCAL ENTROPY THRESHOLDING MAHABOOB.SHAIK, Research scholar, Dept of ECE, JJT University, Jhunjhunu, Rajasthan, India Abstract: The major
Information Processing During Transient Responses in the Crayfish Visual System
 Information Processing During Transient Responses in the Crayfish Visual System Christopher J. Rozell, Don. H. Johnson and Raymon M. Glantz Department of Electrical & Computer Engineering Department of
Spontaneous Cortical Activity Reveals Hallmarks of an Optimal Internal Model of the Environment. Berkes, Orban, Lengyel, Fiser.
 Statistically optimal perception and learning: from behavior to neural representations. Fiser, Berkes, Orban & Lengyel Trends in Cognitive Sciences (2010) Spontaneous Cortical Activity Reveals Hallmarks
Performance and Saliency Analysis of Data from the Anomaly Detection Task Study
 Performance and Saliency Analysis of Data from the Anomaly Detection Task Study Adrienne Raglin 1 and Andre Harrison 2 1 U.S. Army Research Laboratory, Adelphi, MD. 20783, USA {adrienne.j.raglin.civ, andre.v.harrison2.civ}@mail.mil
Announcements. Perceptual Grouping. Quiz: Fourier Transform. What you should know for quiz. What you should know for quiz
 Announcements Quiz on Tuesday, March 10. Material covered (Union not Intersection) All lectures before today (March 3). Forsyth and Ponce Readings: Chapters 1.1, 4, 5.1, 5.2, 5.3, 7,8, 9.1, 9.2, 9.3, 6.5.2,
Reading Assignments: Lecture 5: Introduction to Vision. None. Brain Theory and Artificial Intelligence
 Brain Theory and Artificial Intelligence Lecture 5:. Reading Assignments: None 1 Projection 2 Projection 3 Convention: Visual Angle Rather than reporting two numbers (size of object and distance to observer),
Outlier Analysis. Lijun Zhang
 Outlier Analysis Lijun Zhang zlj@nju.edu.cn http://cs.nju.edu.cn/zlj Outline Introduction Extreme Value Analysis Probabilistic Models Clustering for Outlier Detection Distance-Based Outlier Detection Density-Based
Neuromorphic convolutional recurrent neural network for road safety or safety near the road
 Neuromorphic convolutional recurrent neural network for road safety or safety near the road WOO-SUP HAN 1, IL SONG HAN 2 1 ODIGA, London, U.K. 2 Korea Advanced Institute of Science and Technology, Daejeon,
Intelligent Edge Detector Based on Multiple Edge Maps. M. Qasim, W.L. Woon, Z. Aung. Technical Report DNA # May 2012
 Intelligent Edge Detector Based on Multiple Edge Maps M. Qasim, W.L. Woon, Z. Aung Technical Report DNA #2012-10 May 2012 Data & Network Analytics Research Group (DNA) Computing and Information Science
Object Detectors Emerge in Deep Scene CNNs
 Object Detectors Emerge in Deep Scene CNNs Bolei Zhou, Aditya Khosla, Agata Lapedriza, Aude Oliva, Antonio Torralba Presented By: Collin McCarthy Goal: Understand how objects are represented in CNNs Are
Webpage Saliency. National University of Singapore
 Webpage Saliency Chengyao Shen 1,2 and Qi Zhao 2 1 Graduate School for Integrated Science and Engineering, 2 Department of Electrical and Computer Engineering, National University of Singapore Abstract.
Mammogram Analysis: Tumor Classification
 Mammogram Analysis: Tumor Classification Term Project Report Geethapriya Raghavan geeragh@mail.utexas.edu EE 381K - Multidimensional Digital Signal Processing Spring 2005 Abstract Breast cancer is the
Flexible, High Performance Convolutional Neural Networks for Image Classification
 Flexible, High Performance Convolutional Neural Networks for Image Classification Dan C. Cireşan, Ueli Meier, Jonathan Masci, Luca M. Gambardella, Jürgen Schmidhuber IDSIA, USI and SUPSI Manno-Lugano,
Theta sequences are essential for internally generated hippocampal firing fields.
 Theta sequences are essential for internally generated hippocampal firing fields. Yingxue Wang, Sandro Romani, Brian Lustig, Anthony Leonardo, Eva Pastalkova Supplementary Materials Supplementary Modeling
A deep learning model integrating FCNNs and CRFs for brain tumor segmentation
 A deep learning model integrating FCNNs and CRFs for brain tumor segmentation Xiaomei Zhao 1,2, Yihong Wu 1, Guidong Song 3, Zhenye Li 4, Yazhuo Zhang,3,4,5,6, and Yong Fan 7 1 National Laboratory of Pattern
Experiences on Attention Direction through Manipulation of Salient Features
 Experiences on Attention Direction through Manipulation of Salient Features Erick Mendez Graz University of Technology Dieter Schmalstieg Graz University of Technology Steven Feiner Columbia University
Automated Detection of Vascular Abnormalities in Diabetic Retinopathy using Morphological Entropic Thresholding with Preprocessing Median Fitter
 IJSTE - International Journal of Science Technology & Engineering Volume 1 Issue 3 September 2014 ISSN(online) : 2349-784X Automated Detection of Vascular Abnormalities in Diabetic Retinopathy using Morphological
A Vision-based Affective Computing System. Jieyu Zhao Ningbo University, China
 A Vision-based Affective Computing System Jieyu Zhao Ningbo University, China Outline Affective Computing A Dynamic 3D Morphable Model Facial Expression Recognition Probabilistic Graphical Models Some
GESTALT SALIENCY: SALIENT REGION DETECTION BASED ON GESTALT PRINCIPLES
 GESTALT SALIENCY: SALIENT REGION DETECTION BASED ON GESTALT PRINCIPLES Jie Wu and Liqing Zhang MOE-Microsoft Laboratory for Intelligent Computing and Intelligent Systems Dept. of CSE, Shanghai Jiao Tong
Rolls,E.T. (2016) Cerebral Cortex: Principles of Operation. Oxford University Press.
 Cerebral Cortex: Principles of Operation. Oxford University Press.") Digital Signal Processing and the Brain Is the brain a digital signal processor? Digital vs continuous signals Digital signals involve streams of binary encoded numbers The brain uses digital, all or none,
Digital Signal Processing and the Brain Is the brain a digital signal processor? Digital vs continuous signals Digital signals involve streams of binary encoded numbers The brain uses digital, all or none,
COMP9444 Neural Networks and Deep Learning 5. Convolutional Networks
 COMP9444 Neural Networks and Deep Learning 5. Convolutional Networks Textbook, Sections 6.2.2, 6.3, 7.9, 7.11-7.13, 9.1-9.5 COMP9444 17s2 Convolutional Networks 1 Outline Geometry of Hidden Unit Activations
The Attraction of Visual Attention to Texts in Real-World Scenes
 The Attraction of Visual Attention to Texts in Real-World Scenes Hsueh-Cheng Wang (hchengwang@gmail.com) Marc Pomplun (marc@cs.umb.edu) Department of Computer Science, University of Massachusetts at Boston,
Object-based Saliency as a Predictor of Attention in Visual Tasks
 Object-based Saliency as a Predictor of Attention in Visual Tasks Michal Dziemianko (m.dziemianko@sms.ed.ac.uk) Alasdair Clarke (a.clarke@ed.ac.uk) Frank Keller (keller@inf.ed.ac.uk) Institute for Language,
The Role of Top-down and Bottom-up Processes in Guiding Eye Movements during Visual Search
 The Role of Top-down and Bottom-up Processes in Guiding Eye Movements during Visual Search Gregory J. Zelinsky, Wei Zhang, Bing Yu, Xin Chen, Dimitris Samaras Dept. of Psychology, Dept. of Computer Science
THE data used in this project is provided. SEIZURE forecasting systems hold promise. Seizure Prediction from Intracranial EEG Recordings
 1 Seizure Prediction from Intracranial EEG Recordings Alex Fu, Spencer Gibbs, and Yuqi Liu 1 INTRODUCTION SEIZURE forecasting systems hold promise for improving the quality of life for patients with epilepsy.
Real-time computational attention model for dynamic scenes analysis
 Computer Science Image and Interaction Laboratory Real-time computational attention model for dynamic scenes analysis Matthieu Perreira Da Silva Vincent Courboulay 19/04/2012 Photonics Europe 2012 Symposium,
Error Detection based on neural signals
 Error Detection based on neural signals Nir Even- Chen and Igor Berman, Electrical Engineering, Stanford Introduction Brain computer interface (BCI) is a direct communication pathway between the brain
Performance evaluation of the various edge detectors and filters for the noisy IR images
 Performance evaluation of the various edge detectors and filters for the noisy IR images * G.Padmavathi ** P.Subashini ***P.K.Lavanya Professor and Head, Lecturer (SG), Research Assistant, ganapathi.padmavathi@gmail.com
2/3/17. Visual System I. I. Eye, color space, adaptation II. Receptive fields and lateral inhibition III. Thalamus and primary visual cortex
 1 Visual System I I. Eye, color space, adaptation II. Receptive fields and lateral inhibition III. Thalamus and primary visual cortex 2 1 2/3/17 Window of the Soul 3 Information Flow: From Photoreceptors
ANALYSIS AND DETECTION OF BRAIN TUMOUR USING IMAGE PROCESSING TECHNIQUES
 ANALYSIS AND DETECTION OF BRAIN TUMOUR USING IMAGE PROCESSING TECHNIQUES P.V.Rohini 1, Dr.M.Pushparani 2 1 M.Phil Scholar, Department of Computer Science, Mother Teresa women s university, (India) 2 Professor
Actions in the Eye: Dynamic Gaze Datasets and Learnt Saliency Models for Visual Recognition
 Actions in the Eye: Dynamic Gaze Datasets and Learnt Saliency Models for Visual Recognition Stefan Mathe, Cristian Sminchisescu Presented by Mit Shah Motivation Current Computer Vision Annotations subjectively