September Abstract
|
|
|
- James Hawkins
- 5 years ago
- Views:
Transcription
1 Self-Control Awareness and Intertemporal Choice Behavior: Evidence from a Randomized Experiment Silvia Helena Barcellos (RAND) and Leandro Carvalho (RAND) 1 September 2012 Abstract This paper investigates how awareness about self-control problems (i.e., sophistication) affects intertemporal choice behavior. In a randomized experiment, the treatment group was provided information about self-control problems. In an incentivized task, study participants intertemporally divided $500 into two payments (the amount allocated to the later payment was paid with interest). The results show the treatment was more willing to delay gratification, choosing a later reward 8% to 16% larger than the control. We provide evidence that the results are due to greater self-control awareness. Keywords: Self-Control, Naïveté, Sophistication, Present Bias, Intertemporal Choice, Randomized Experiment I. Introduction Recent work has argued that awareness about self-control problems (i.e., sophistication) is a central issue to the welfare implications of self-control. Sophisticated time-inconsistent individuals may be able to improve their welfare by voluntarily taking up commitment devices (Laibson 1997; Ashraf, Karlan and Yin 2006; Beshears, Choi, Laibson and Madrian 2011). Moreover, firms may take advantage of consumers naïveté (i.e., their over-optimism about their future self-control) by designing exploitative 1 silvia@rand.org; carvalho@rand.org. We are grateful to seminar participants at the RAND Behavioral Finance Workshop and the NYU Economic Science Association meeting for their suggestions and especially to Maria Casanova, Tom Chang, Adriana Lleras-Muney, Ashley Miller, Francisco Perez-Arce, Heather Royer, Daniel Silverman, James P. Smith, Justin Sydnor, and Diego Ubfal for their comments. We would also like to thank the American Life Panel staff (Bas Weerman, Tania Gutsche, Tim Colvin, Julie Newell, Bart Oriens and Arie Kapteyn) for their help in programming the survey. This work was generously supported by a grant from the National Institute of Aging (Grant P30AG ) through RAND s Roybal Center for Economic Decisionmaking.
2 contracts that redistribute surplus from naïve consumers to firms (e.g., DellaVigna and Malmendier 2004; Eliaz and Spiegler 2006; Heidhues and Koszegi 2010). 2 Despite the importance of the topic, there is very little empirical evidence of how naïveté affects behavior. One exception is Wong (2008), who finds mixed evidence of the effects of naiveté on educational outcomes. 3 This paper reports the results of a randomized experiment in which the treatment group was provided information about self-control problems (the control group was not provided any information). The experiment was conducted with 3,400 participants of an Internet-based longitudinal study, the RAND American Life Panel. All participants completed an incentivized intertemporal choice task in which they had to divide $500 into two checks; the amount allocated to the second check was paid with interest and was mailed one month after the first check. A fraction of participants were randomly selected to be paid according to their choices; they were sent two checks in the amounts chosen by them in the intertemporal choice task (the total amount of the two checks was greater or equal to $500). Our outcome of interest is the later reward, the amount in dollars of the second check. The treatment information was based on the results of a study conducted by Daniel Read and Barbara van Leeuwen (1998). Their study (henceforth, the Snacks Study) showed that when faced with a choice between a healthy and an unhealthy snack that would be delivered a week later participants were equally likely to choose either of them. However, the same participants had approximately an 80% chance of choosing an unhealthy snack if they could eat their choice right away. 2 The literature on self-control originally focused on two extreme cases: Sophisticated people are fully aware of their self-control problems and correctly predict how their future selves will behave (Laibson 1997), and naïve people are fully unaware of their self-control problems and incorrectly believe their future selves will behave exactly how they would like them to behave (O Donoghue and Rabin 1999a, 1999b). O Donoghue and Rabin (2001a) introduced the idea that individuals may be partly naïve they are aware of their self-control problems but they underestimate the magnitude of these problems. 3 The author elicits university students ideal study plan to a midterm examination and asks them to predict how much they will delay in initiating their plan predicted delay is interpreted as a measure of sophistication and unpredicted delay as a measure of naïveté. The results show that both measures have negative effects on several measures of class performance. 2
3 In our study, participants assigned to treatment were asked to make similar hypothetical choices (for a week later and for right away) between a healthy, an apple, and an unhealthy snack, a bag of Doritos. After making their choices, they were told about the results of the original study, which were presented as an illustration of selfcontrol failure. The results show that the treatment increased the willingness to delay gratification. When faced with an experimental monthly interest rate of 0.5%, participants assigned to the treatment group choose a delayed reward $27-$50 larger than participants assigned to the control group, an 8%-16% increase relative to the control mean. We present evidence that the results are due to an increase in self-control awareness by documenting that the treatment effect is larger for participants who more likely understood the experiment information. To address concerns that the results could be due to experimenter demand effects (i.e., changes in behavior due to cues to what constitutes appropriate behavior), a second treatment arm was not shown the last information screen, which would potentially have the largest experimenter demand effects. 4 The results show that participants who saw the last information screen were more willing to delay gratification than those who saw all the information screens but the last one; however this difference was not statistically significant. To the best of our knowledge, the current study represents the first attempt to manipulate self-control awareness using information. Under the assumption that the treatment increased awareness, the results indicate that at least some fraction of the population is naïve or partly naïve and that, therefore, there are limits to the effectiveness of commitment contracts in helping individuals overcome their self-control problems. One possible take-away of the results is that it may be possible to stimulate the demand for commitment by providing information about self-control. The choices made in the experiment task were made under commitment; participants would have no 4 The text in the last screen included: Present bias is often seen as undesirable because what people end up doing (saving less than planned) is not what they think is best for their future (saving for retirement). See section II.1. 3
4 opportunity to change their allocations later on. Thus, they may have used the experimental allocation as a commitment device to set money aside for the future. We lay out a framework that formalizes this interpretation of the results. The organization of the paper is as follows. Section 2 explains the experimental design and the intertemporal choice task and describes the data. The empirical results are presented in section 3. Section 4 lays out a model that provides an interpretation for the empirical results. Section 5 concludes. II. Experimental Design and Data We collected data for this study using the RAND American Life Panel (ALP), an ongoing Internet panel with respondents ages 18 and over living in the U.S. Respondents with no Internet access at the time of recruitment are provided laptops, including an Internet access subscription. Because Internet access is not a prerequisite for joining the panel, the sample does not suffer from selection due to a lack of Internet access. About twice a month, respondents receive an with a request to visit the ALP site and complete questionnaires. Post-stratification weights are provided for estimating nationally representative results. 5 Approximately 3,400 panel respondents (corresponding to a response rate of 80%) participated in ALP module number 212, which was particularly designed for the current project. 6 Participants were randomly selected into one control and two treatment groups, with probabilities 40% (control), 40% (first treatment arm) and 20% (second treatment arm). The second treatment arm was designed to study experimenter demand effects, as we explain below. The core questionnaire, which was administered to all participants, started with an incentivized intertemporal choice task. The treatment groups received information about self-control immediately before such task. At the very end of the survey, the treatment groups were asked open-ended questions about the information they had received. 5 The weights are constructed to make the distributions of age, sex, ethnicity, education and income estimated using the ALP sample approximate the distributions in the Current Population Survey. 6 The data of the module are publicly available at The survey can be accessed at 4
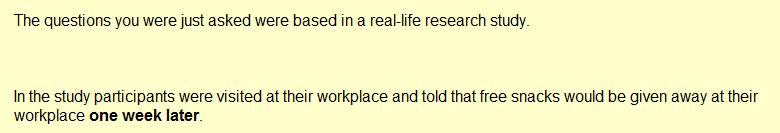
5 II.1. Experiment The treatment groups were provided information about self-control problems (the control group was not provided such information) illustrated by the results of a study conducted by Read and van Leeuwen (1998). Participants saw a total of 6 or 7 information screens. In the first screen, they were asked to make a hypothetical choice between an apple and a bag of Doritos that they would receive one week later. In the second screen, they were asked what their choice would be if instead they could have their choice right away. The third screen informed that the questions that had been asked were based in a real-life research study and more details were given: In the study participants were visited at their workplace and told that free snacks would be given away at their workplace one week later. They were asked to choose between healthy (an apple) and unhealthy snacks (Doritos), and informed that their choice would be delivered one week later. 5 out of 10 people chose a healthy snack one week later. [end of screen #3] One week later after the first visit the same participants were revisited at their workplace. Snacks were being given away, and the study participants were asked to choose between healthy (an apple) and unhealthy snacks (Doritos), which they could have right away. Only 2 out of 10 people chose a healthy snack immediately. [end of screen #4] Respondents were then prompted to think about the results of the study: Why did some people change their minds? What was the study trying to show? When people make plans for the future, they often end up not doing what they had originally planned. When asked to choose which snack they would like next week, half of the people chose the healthy snack (the apple) because they care about their health. When asked what they would prefer right now, 8 out of 10 people chose the unhealthy snack because they could not resist the temptation of having the unhealthy snack (the Doritos). [end of screen #5] 5
6 In screen #6, participants were reminded that self-control issues do not apply only to eating: This behavior is not limited to eating. It also applies to other behaviors such as exercising, quitting smoking and saving. In the case of savings, someone may recognize the importance of saving for retirement, and plan on stepping up her savings starting with the next paycheck. But when the next paycheck arrives and it is time to start saving more, the person faces a dilemma: she wants to save more, but saving more requires spending less. She cannot resist the temptation to consume and ends up saving less than originally planned. [end of screen #6] Finally, the first treatment arm was shown an additional screen, which was not seen by the second treatment arm, presenting present bias as undesirable: When thinking about how much they want to be saving in the months to come, people are foresighted and plan to save more. But when they have to decide how much to save this month, they are shortsighted and save less than planned. This type of behavior is often referred to as present biased. The term refers to the phenomenon that people tend to choose whatever gives them immediate satisfaction (to spend), even though this is not what they think it is good for their future (to save more). Present bias is often seen as undesirable because people end up doing (saving less than planned) is not what they think is best for their future (saving for retirement). [end of screen #7] The Appendix shows screen shots of the information screens seen by individuals in the treatment group. They included not only the text above but also pictures to ease comprehension and retain attention. Individuals selected into the no-information/control group did not see any of the information treatment screens presented above. II.2. Intertemporal Choice Task 6
7 Participants completed an incentivized intertemporal choice task designed using the methods of Andreoni and Sprenger (forthcoming). Intertemporal choice tasks are commonly used to measure willingness to delay gratification (Frederick, Loewenstein and O Donoghue 2002). 7 Individuals were asked to intertemporally allocate an experimental budget of $500 between two payments one month apart. The amount saved for the second check was paid with interest. Participants were asked to make six of these choices, in which we varied the monthly interest rate (r = 0.5%, 1% and 2.5%) and the mailing date of the first payment (today or in 1 year). 8 Whenever participants were prompted to make a choice, two checks identical to the checks ALP participants receive every quarter for participating in the survey were displayed, showing the dates and the amounts of each one of the two checks, and the name of the survey participant (see screen shot in the Appendix). 9 The amount of the second check included the interest paid on the amount saved for the second check, such that the participant did not have to calculate the interest herself. 10 Approximately 0.1% of participants were selected at random to be paid one of their choices (the choice for which the participant was paid was randomly selected among the six choices the participant had made). 11 These participants were sent (one or) two checks (at the dates specified in the task) in the amounts chosen by them in the task; the total amount of the two checks was greater or equal to $ We use the term willingness to delay broadly to include not only time preferences but any reasons one may care less for future consequences for example, uncertainty about whether the delayed reward will be paid. 8 The order of the time frames was randomized. Given a time frame, the interest rate increased monotonically. 9 To mitigate the concern that subjects may choose to receive money sooner because they are uncertain about whether the later payment will be delivered a common criticism to choice tasks used to elicit time discounting (Frederick, Loewenstein and O Donoghue 2002), we used images of the ALP checks respondents receive every quarter with the intent of taking advantage of the built trust between the respondents and the survey staff. 10 Participants were asked to choose how much they wanted to save for the second check by either clicking on a ruler or by entering the amount in a box below the ruler (see screen shot in the Appendix). As the individual entered her choice, the amounts of the first and the second checks were automatically updated. As the participant moved the cursor left and right, she could try out different allocations along the experimental budget constraint, getting a feel for the trade-off between receiving the money sooner and waiting to receive more money. The practice round that preceded the actual choices instructed participants to move the cursor around to see how the amounts of the first and second checks varied according to their choices of how much to save for the second check. 11 Participants were told that Ten survey participants will be selected at random to earn real money. They were not given information about how many survey participants were completing the survey. 7
8 III. Results III.1. Summary Statistics and Balance Check Table 1 shows summary statistics of baseline characteristics, separately for the three experimental groups. 12 The results suggest the groups are balanced along most background characteristics. The table displays means and standard deviations (SD) for each group, as well as p-values of two-way tests of the difference in means across the groups. We can only reject the null hypothesis of equality in 8 out of the 84 tests (or 9.5% percent of the times). For most of the analysis, we will restrict our attention to comparisons between the control group and the first treatment arm, who saw all 7 treatment screens. In Section III.4, we will look at experimenter demand effects by comparing the choices of the first and second treatment arms. III.2. Main Results [Table 1 here] Figure 1 shows the cumulative distribution of the later reward i.e., the amount in dollars of the second check separately for treatment and control. 13 The mass of the distribution of treatment is shifted to the right relative to the distribution of the control group: the treatment group chooses on average a larger delayed reward. [Figure 1 here] Table 2 presents ordinary least squares (OLS) estimates of the treatment effect on the later reward, separately by interest rate and time frame. Panel A reports results for the today x in 1 month time frame (i.e., the mailing dates of the 1st and 2nd checks were "Today" and "In 1 month"). Panel B reports results for the "In 1 year x In 1 year and 1 month time frame. The experimental (monthly) interest rate varies across columns. The 12 The baseline characteristics come from the household information survey of the ALP that collects demographic and socioeconomic data on all ALP participants. We dropped 28 observations for whom at least one of the control variables was missing. The reported statistics are unweighted. See Appendix Table 1 for weighted estimates. 13 The ruler allowed respondents to delay to the second check any amount multiple of $5. If the respondent used the box instead, she could choose any amount multiple of $1. The stepwise form of the cumulative distribution is due to respondents preferences for choices that were multiples of $50. 8
9 results suggest that the allocations tend to adhere to the law of demand: the higher the interest rate, the larger the delayed reward. The results in Table 2 show that the treatment increased the later reward. Participants who received the information chose on average a later reward from $5 to $30 larger than the average later reward of participants who received no information (1% to 10% of the control average). We look next at how the treatment effects vary across the different time frames and interest rates. The treatment may in principle have two effects: it may change one s expectations about how present biased she will be in the future and it may also affect one s (current) present bias. As we explain in Section IV, the second effect is of second order when one is deciding how to allocate $500 that will be paid 12 months later. 14 In fact, the results are similar across the different time frames and indeed one cannot reject the hypothesis that they are the same. 15 In terms of differences across interest rates, a central issue is censoring. In the intertemporal choice task participants could not borrow nor lend at the experimental interest rate. Consequently, the choice of later reward is left censored at $0 for participants who would have liked to borrow (i.e., a sooner reward greater than $500). Similarly, the choice of later reward is right censored at $500 times the gross interest rate for participants would have liked to lend (i.e., a sooner reward smaller than $0). According to the law of demand, right (left) censoring should be an increasing (decreasing) function of the experimental interest rate. Because right censoring is more common in our data than left censoring (at the 2.5% interest rate more than 40% of control group chose to delay the maximum amount of $500 while only 4% chose a later reward of $0), the treatment effects are smaller for the higher interest rates. [Table 2 here] 14 In our framework the effect of a change in the present bias is a priori ambiguous under the today x in 1 month time frame. 15 One possible interpretation is that there was no present bias when respondents allocated $500 between two checks to be mailed today and in 1 month, because they would not receive the money immediately. 9
10 For the remainder of the paper, we will focus on the choices made in the In 1 year x In 1 year and 1 month time frame under a 0.5% monthly interest. Even though the results are not much different across the time frames, focusing on the In 1 year x In 1 year and 1 month time frame allows us to as rule out that the results are due to an effect of the information on the present bias itself (rather than on the expectations about one s present bias in the future), as discussed above. We choose the 0.5% interest rate because there is less censoring at this rate. Table 3 takes a closer look at the issue of censoring. 16 The OLS results are reproduced in the first column. The second and third columns show the effects on the probabilities of delaying $0 and $500 in the experiment. The last two columns show results from models that take into account the censoring at 0 and 500. These models estimate the effect on the latent later reward, i.e., the later reward that would have been observed had participants been allowed to borrow or lend in the intertemporal choice task at the experimental interest rate. We use a trimming procedure proposed by David Lee (2009) to produce the last column estimate (see Appendix for derivation of this estimator). 17 The treatment and control distributions of later reward are trimmed such that the distribution of unobservables is the same across treatment and control. The advantage of this procedure over the Tobit estimator is that it requires no assumptions about the distribution of the unobservable. As a robustness check, Panel B presents results in which we add controls. 18 Consistent with the treatment leading to an increase in the willingness to delay gratification, there is a decrease in the probability of delaying $0 and an increase in the 16 Estimates in Table 2 and Table 3 are unweighted. See Appendix Tables 2 and 3 for weighted estimates. 17 David Lee (2009) uses the trimming procedure to estimate bounds on treatment effects of Job Corps on wages when the treatment affects the probability that one s wage will be observed. In our case, we can take advantage that we have more information about the latent dependent variable that is, we know that the latent later reward is smaller than 0 if the observed later reward is left censored at 0 and that the latent later reward is greater than (502.5 = 500 x 1.005) if the observed later reward is right censored at and use the trimming procedure to estimate point estimates rather than bounds. 18 Controls include all the variables on Table 1, namely: gender; age; date of birth; born in US; US region of birth; race; marital status; education; employment status; disability; US region of residence; household size and income. 10
11 probability of delaying $500. The estimators that take into account the censoring produce estimates that are much larger than the OLS. They indicate that the treatment increased the later reward in $50, which correspond to roughly 16% of the control mean. Overall, the results show that the information provision increased participants willingness to delay gratification. [Table 3 here] III.3. Treatment Effects and Understanding of the Snacks Study In what follows, we provide evidence that the experimental results are (at least partly) explained by an increase in individuals awareness of self-control problems. We show that the treatment effect is larger for participants who seem to have had a better understanding of the experiment information. We assess participants understanding from their answers to the following open-ended question that was asked at the very end of the survey (to treatment participants only): Did you learn something from the Apples or Doritos real-life study? Could you explain in your own words what you learned? In total 856 respondents (approximately 65% of the participants randomly selected into the first treatment arm) answered the question. 19 The answers were reviewed to identify themes and terms that showed up frequently and corresponding categories were created. The categories were not exclusive, such that one answer could be classified into multiple categories. 20 Table 4 presents the percentage of answers that were coded into each category. For example, 17.9% of the respondents used the term instant gratification or similar variants, such as immediate satisfaction or immediate pleasure. Approximately 12% made reference to the idea that individuals tend to have good intentions, but do not act as they intended. 7.7% pointed that [t]he decisions people make for the future are not the same ones they make for today. Roughly 10% explained why they had chosen an apple 19 Appendix Table 4 shows which personal characteristics are associated with not answering the open ended questions. 20 To test for coding reliability, the answers were coded by two independent researchers. 11
12 or a bag of Doritos; 6.4% mentioned that people should eat healthier; and 4.6% stated that people prefer junk food. [Table 4 here] We interpret that respondents whose answers were coded into any of the following categories had a better understanding that participants in Read and van Leeuwen (1998) s Snacks Study switched to an (immediate) unhealthy snack because of self-control problems: instant gratification; people have good intentions but don t act as intended; different decisions for now and later; temptation; impulsivity; self-control; present bias; procrastination; people prefer now than later; people overestimate their self-control; and willpower. 21 With this choice of categories, we were hoping to identify respondents who tapped into at any of the following five ideas associated with self-control failure: i) individuals have a preference for immediate gratification; ii) it takes selfcontrol/willpower to resist temptations; iii) individuals will make different decisions for now and for later; iv) individuals make plans for the future, but end up not following them; and v) individuals procrastinate costly actions. Henceforth, we will use the term understanding to refer to responses that have been categorized into at least one of these categories. 38.5% of participants who answered the question (25% of participants assigned to the first treatment arm) were classified as having understood the experiment information. 22 Panel B of Table 5 shows which baseline characteristics are associated with having a better understanding among the treatment group. Being more educated and having a higher income are positively associated with understanding. Understanding is also 21 Notice that we cannot rule out that participants whose answers were not coded into these categories (including those who did not answer the question) may have understood the experiment information. We intentionally did not interpret as having understood the experiment information categories that that could be alternatively interpreted as time consistent preferences, such as patience; people cannot delay gratification; people prefer sooner than later; and people live in the moment. The results are very similar if we include those. We opted for remaining agnostic about ambiguous answers such as people change their minds and people should stick to their plans. 22 The correlation between the coding of two independent researchers for understanding was
13 positively associated with financial literacy (last two columns). 23 The table reports results from a multinomial logit regression with three possible outcomes: understanding, not answering the question and all other answers. The table displays the estimated coefficients for understanding (see Appendix for estimated coefficients of not answering). These estimated coefficients can then be used to estimate the predicted probability that control (and treatment) participants would have understood the experiment information had they received it. 24 Using these estimated probabilities, we can investigate whether the treatment effect is larger among those with a higher predicted probability of understanding. Panel A shows results from a regression of the later reward on the predicted probability, the treatment dummy, and the interaction of the predicted probability with treatment status. We estimate bootstrapped standard errors to take into account that the predicted probability is estimated. The results in Panel A of Table 5 suggest that the information had the largest effect for those with a higher probability of understanding. For example, the estimate in the first column indicates that a 1 percentage point increase in the probability of understanding corresponds to an increase in the treatment effect of $1.35. Interestingly, it is not possible to reject the hypothesis that there is no treatment effect for those with a zero probability of understanding. 23 The three questions about financial literacy had been asked in a previous round of the ALP (ms189): Suppose you had $100 in a savings account and the interest rate is 20% per year and you never withdraw money or interest payments. After 5 years, how much would you have in this account in total? More than $200, exactly $200 or less than $200? ; Imagine that the interest rate on your savings account was 1% per year and inflation was 2% per year. After 1 year, how much would you be able to buy with the money in this account? More than today, exactly the same or less than today? ; and When an investor spreads his money among different assets, does the risk of losing money increase, decrease or stay the same? We lose about 270 observations because some respondents who participated in ALP ms212 did not participate in ALP ms We can compare within the treatment group the observed outcome (understood, did not answer, or other answers) to the respective predicted probabilities to assess how well the model performs in identifying respondents who understood the experiment information. 40% (model 1) and 48.9% (model 2) of respondents classified into the understanding group had a predicted probability of understanding higher than 1/ % (model 1) and 79.1% (model 2) of those who did not answer the question had a predicted probability of not answering higher than 1/3. Finally, 65.3% (model 1) and 63.4% (model 2) of respondents who answered the question but were not classified into the understanding group had a predicted probability of other answers higher than 1/3. 13
14 [Table 5 here] Figure 2 presents similar evidence in a graphical form. It shows the conditional expectation of the later reward as a function of the predicted probability, separately for the control and treatment groups. The conditional expectations are calculated using a locally weighted regression smoother (Fan 1992), which allows the data to determine the shape of the function, rather than imposing some functional form. The straights lines show OLS estimates. Immediately apparent from Figure 2 is that the curve for the treatment group is positively sloped: Treatment participants that are more likely to have understood the information chose on average a larger later reward. The curve for the control group suggests that the positive relationship within treatment is not due to any baseline differences between those with lower and higher probabilities of understanding; the relationship is slightly negative within the control group. The gap between the two curves provides an estimate of the treatment effect conditional on the probability of understanding. The figure shows that the gap between the two curves widens as the probability of understanding increases, which again suggests that the treatment effect is larger for those with a higher probability of understanding. 25 [Figure 2 here] III.4. Experimenter Demand Effects One potential concern about the results presented is that they could be due to experimenter demand effects i.e., changes in behavior due to cues to what constitutes appropriate behavior. To address this concern, a second treatment arm was intentionally not shown the last information screen, which would potentially have the largest experimenter demand effects: Present bias is often seen as undesirable because what 25 The predicted probability in Figure 2 ranges from 0.15 to 0.4 because approximately 70% of respondents have predicted probabilities in this range. 14
15 people end up doing (saving less than planned) is not what they think is best for their future (saving for retirement). 26 Table 6 shows estimates of the experimenter demand effects. We restricted the sample to treatment participants and compared the intertemporal choices of those who saw the 6 core screens and those who saw the 6 core screens plus the additional seventh screen. 27 The table reports results from regressions of some later reward measure on a constant and an indicator variable identifying respondents who were randomly selected to see the additional seventh screen. The coefficient of the constant (in Panel A) shows the average later reward for the comparison group who saw the 6 core screens only. The coefficient of the indicator variable estimates the effect of the seventh screen. The results in Table 6 show that there is a $8-$14 increase in the later reward associated to the seventh screen. However, the effects are imprecisely estimated and they are not statistically different from zero. Moreover, the effect of the seventh screen is much smaller than the effect of seeing all 7 screens (the estimated treatment effect in Table 3 obtained by comparing those who saw 7 screens to those who did not see any of the information screens). Indeed, we can reject the hypothesis that the effects in Tables 3 and 6 are the same. Finally, it is worth noting that experimenter demand effects tend to be less of a concern in Internet-based surveys, which are anonymous, self-reported, and in which the subject/respondent does not interact with an experimenter/interviewer (Zizzo 2010). IV. Model 26 The entire text in the last screen read: When thinking about how much they want to be saving in the months to come, people are foresighted and plan to save more. But when they have to decide how much to save this month, they are shortsighted and save less than planned. This type of behavior is often referred to as present biased. The term refers to the phenomenon that people tend to choose whatever gives them immediate satisfaction, even though this is not what they think is good for their future. Present bias is often seen as undesirable because what people end up doing (saving less than planned) is not what they think is best for their future (saving for retirement). 27 For the control group and the first treatment arm, it was randomized which time frame they received first: Today x 1 month or 1 year x 1 year and 1 month. Because of sample size concerns, all participants assigned to the second treatment arm received the Today x 1 month time frame first. To avoid confounding the time frame effect with the information provision effect, the analysis only includes participants from the first treatment arm who received the Today x 1 month time frame first. 15
16 A prediction of most self-control models is that sophisticated agents will resort to external commitment devices to help them fulfill their plans for the future. Our results are consistent with greater sophistication having increased the demand for commitment. The choices made in the experiment task were made under commitment; participants would have no opportunity to change their allocations later on. 28 Thus, they may have used their experimental allocation as a commitment device to set money aside for the future. In the words of one of the study participants: I like to get more money later because it is like I "already have it saved" in my mind. I can spend the first check but the rest I have to put into savings. In this section, we lay out a framework that formalizes this interpretation of the results. The model considers the decision participants faced of intertemporally allocating an experimental budget of $500 prize between two periods. The (experiment) budget constraint the agent faces is: 500 and 500 0, (1) where (sooner reward) is the dollar amount of the first check, is the experimental interest rate, and (later reward) is the dollar amount of the second check. For simplicity the market interest rate, the experimental interest rate and the discount rate are assumed to be all equal to zero. Following Andersen et al (2008) and Andreoni and Sprenger (forthcoming), the model assumes that the experimental rewards are integrated with background consumption; the sooner reward is integrated with the 12 months background 28 The results of Giné et al (2012) suggest that our study participants would have reallocated money to the first check if they were given the option a year later to revise their allocations. Using a similar intertemporal choice task, they show that individuals who exhibited preference reversals i.e., they chose to save more for the later payment when both payments were moved further into the future (while the time delay between the two payment was held constant) tend to reallocate more money toward sooner when given an opportunity to revise their choices. 16
17 consumption while the later reward is integrated with the 13 months background consumption : 29 max, s.t. (1), (2) where is the present bias, and has diminishing marginal utility. Andersen et al (2008) define background consumption as the optimized consumption stream based on wealth and income that is [perfectly] anticipated before allowing for the effects of the money offered in the experimental tasks. 30 In the context of the current model, individuals may however not correctly anticipate what their (background) consumption will be 12 months and 13 months later if they are naïve or partly naïve and have incorrect beliefs about how present biased they will be in the future. It is anticipated background consumption and not actual background consumption that matters for the choice the individual makes about how to intertemporally allocate her experimental budget. Henceforth, we will use the term background consumption to refer to the background consumption the individual anticipates she will have 12 and 13 months later, and, when she will receive the experimental rewards. The solution to the problem is given by the following first order condition: 31. (3) The individual equalizes the marginal utilities of the sooner and the later rewards. The hypothesis of diminishing marginal utility implies that the individual will choose to 29 Here we focus on the 12 th months versus 13 th months time frame because it corresponds to the in 1 year x 1 year and 1 month time frame of most of our empirical results. In footnote 31 we discuss the intertemporal allocation problem for the case when the participant has to allocate the $500 between two checks to be mailed today and in 1 month. 30 Notice there is an assumption, which is the standard in the literature, that the agent chooses the optimal background consumption without taking the experimental rewards into account, such that the agent does not re-optimize if there is any reallocation of the experimental rewards. 31 In the case of the today x 1 month time frame, we would have:, (3 ) = 1 1. (6 ) The effect of sophistication on the later reward may be positive or negative depending on the degree of risk aversion. See Tobcman (2007) for derivation of (6 ). 17
18 equalize overall consumption i.e., the sum of background consumption plus the experimental reward across periods:. (4) Thus, the later reward is a function of the profile of background consumption: 250 /2. (5) If the profile of background consumption is negative sloped (i.e., background consumption decreases over time), the individual will delay more than $250 in order to equalize the overall consumption across the two periods. The steeper the (negative) profile is, the more the individual will choose to delay for the second check to be mailed in 13 months. The profile of background consumption in turn depends on one s beliefs about how present biased she will be in the future. Agents choose their background consumption by optimally allocating their real-life resources wealth and income before allowing for the effects of the money offered in the experimental tasks. We refer the reader to the Appendix for a formal derivation of the background allocation problem. Here we discuss the implications of its solution for the choice of how to intertemporally allocate the $500 experimental budget. The individual anticipates that the profile will be steeper (with a larger reduction in consumption between 12 and 13 months) the more present biased she expects to be in the future (Harris and Laibson 2001): 32 = 1 1. (6) 32 We assume that the individual expects that in the future she will be sophisticated about her present bias. If instead the individual expects her future selves will be completely naïve about the present bias, then =. 18
19 where is one s beliefs about her future self-control problems (i.e., her beliefs about what her present bias will be in the future). The parameter governs naïveté; a reduction in corresponds to a reduction in naïveté. A naïve person believes she will not have selfcontrol problems in the future: 1. A sophisticated person knows exactly her future self-control problems i.e.,, where is the true present bias. A partially naïve person has beliefs, 1. The term is the marginal propensity of consumption (out of cash-on-hand ) at 13 months. The combination of equations (5) and (6) imply that for reasonable levels of the later reward increases with sophistication. From today s perspective the individual values consumption in 12 and 13 months equally and would prefer a flat consumption profile. However, she anticipates that at 12 months her future self will discount 13 months consumption at and thus choose a negative profile of background consumption. The current self commits to having a flatter profile of overall consumption by choosing to delay more than $250 to 13 months. A reduction in naïveté leads the individual to realize that the profile of background consumption will be even steeper than she initially anticipated and consequently she will choose to increase the later reward and commit even more resources to the 13 th month. The model predicts that the optimal later reward is very sensitive to one s naïveté but is almost invariant to the true present bias. As the appendix shows, the true present bias only affects the choice of current consumption; the (incorrect) predictions of the current self about how much she will consume in the future depends on how present biased she expects to be in the future,. Even though the choice of current consumption in theory affects how much cash-on-hand will be available in future periods, the effect is negligible 12 months later. Thus, the effect of awareness on demand for commitment, such as commitment savings, is large relative to the effect of having self-control problems. This result contrasts with predictions of consumption models without a 19
20 commitment device, in which the effect of awareness is small relative to the effect of being present biased (O Donoghue and Rabin 2001b). V. Conclusion This paper investigated how awareness about self-control problems (i.e., sophistication) affects intertemporal choice behavior. In a randomized experiment, the treatment group was provided information about self-control problems; the control group was not provided any information. All participants completed a choice task in which they had to intertemporally allocate an experimental budget. The results show that the treatment increased the willingness to delay gratification. We present evidence that the results are due to an increase in self-control awareness and that they cannot be explained by experimenter demand effects. To the best of our knowledge, this is the first study to attempt to manipulate selfcontrol awareness using information. Its results contradict the idea that self-control awareness may be an immutable trait. It is also one of the few studies to provide evidence suggesting that self-control awareness affects economic behavior. One possible interpretation of the results is that increased sophistication stimulated the demand for commitment. Because the choices made in the experiment task were made under commitment (participants would have no opportunity to change their allocations later on), they may have used the experimental allocation as a commitment device to set money aside for the future, as formalized in our model. Further testing this hypothesis is an important topic for future research. Future research should also study the dynamics of the effects of information provision. Our results imply important immediate effects, but it remains unclear how lasting these effects are. 20
21 References Acland, Daniel, and Matthew Levy. Habit Formation and Naïveté in Gym Attendance: Evidence from a Field Experiment. American Economic Review, forthcoming. Andersen, Steffen, Glenn W. Harrison, Morten I. Lau, and E. Elisabet Rutstrom "Eliciting Risk and Time Preferences." Econometrica 76(3): Andreoni, J., and C. Sprenger "Estimating Time Preferences from Convex Budgets." American Economic Review, forthcoming. Ashraf, N., D. Karlan and W. Yin "Tying Odysseus to the Mast: Evidence from a Commitment Savings Product in the Philippines." Quarterly Journal of Economics 121(2): Barsky, Robert B., F. Thomas Juster, Miles S. Kimball and Matthew D. Shapiro "Preference Parameters and Behavioral Heterogeneity: An Experimental Approach in the Health and Retirement Study." Quarterly Journal Of Economics 112(2): Beshears, John, James Choi, David Laibson, Brigitte Madrian, and Jung Sakon "Self-Control and Liquidity: How to Design a Commitment Contract." RAND Corporation Working Papers: 895. Bickel, W.K.; Odum A.L., and G.J. Madden Impulsivity and Cigarette Smoking: Delay Discounting in Current, Never, and Ex-Smokers. Psychopharmacology, 146: Chabris, C.F., Laibson, D., Morris, C. L., Schuldt, J. P., and Dmitry Taubinsky "Individual Laboratory-Measured Discount Rates Predict Field Behavior," NBER Working Papers DellaVigna, Stefano "Psychology and Economics: Evidence from the Field." Journal Of Economic Literature 47(2): DellaVigna, Stefano, and Ulrike Malmendier "Contract Design and Self-Control: Theory and Evidence." Quarterly Journal Of Economics 119(2): DellaVigna, Stefano, and Ulrike Malmendier Paying Not to Go to the Gym. American Economic Review 96(3): Eliaz, Kfir, and Ran Spiegler "Contracting with Diversely Naive Agents." Review Of Economic Studies 73(3): Frederick, S., G. Loewenstein, and T. O'Donoghue "Time Discounting and Time Preference: A Critical Review." Journal of Economic Literature 40(2): Gine, X., J. Goldberg, D. Silverman and D. Yang Revising Commitments: Field Evidence on the Adjustment of Prior Choices, Unpublished Manuscript. 21
22 Giné, X., Karlan, D., and J. Zinman "Put Your Money Where Your Butt Is: A Commitment Contract for Smoking Cessation." American Economic Journal: Applied Economics, 2(4): Harris, Christopher, and David Laibson "Dynamic Choices of Hyperbolic Consumers." Econometrica 69(4): Heidhues, Paul, and Botond Koszegi "Exploiting Naivete about Self-Control in the Credit Market." American Economic Review 100(5): Kirby, K.N.; Petry, N.M., and W.K. Bickel Heroin Addicts Have Higher Discount Rates for Delayed Rewards Than Non-Drug-Using Controls. Journal of Experimental Psychology: General 128(1): Laibson, David. Golden Eggs and Hyperbolic Discounting. Quarterly Journal of Economics 62 (2): Laibson, D.I.; Repetto, A., and J. Tobacman Self-Control and Saving for Retirement. Brookings Papers on Economic Activity 29(1): Loewenstein, G., and D. Prelec Anomalies in Intertemporal Choice: Evidence and an Interpretation. Quarterly Journal of Economics 107: O Donoghue, Ted and Matthew Rabin. 1999a. Doing It Now or Later. American Economic Review 89 (1): O Donoghue, Ted and Matthew Rabin. 1999b. Incentives for Procrastinators. Quarterly Journal of Economics 114 (3): O'Donoghue, Ted, and Matthew Rabin "Choice and Procrastination." Quarterly Journal Of Economics 116(1): O'Donoghue, Ted, and Matthew Rabin "Self-Awareness and Self-Control." In Time and decision: Economic and psychological perspectives on intertemporal choice, New York: Read, D., and B. van Leeuwen Predicting Hunger: The Effects of Appetite and Delay on Choice. Organizational Behavior and Human Decision Processes 76(2): Royer, H., Stehr, M., and J. Sydnor Incentives, Commitments and Habit Formation in Exercise: Evidence from a Field Experiment with Workers at a Fortune 500 Company, Mimeo, UC Santa Barbara. Wong, Wei-Kang "How Much Time-Inconsistency Is There and Does It Matter? Evidence on Self-Awareness, Size, and Effects." Journal Of Economic Behavior And Organization 68(3-4):
23 Figure 1: Cumulative Distribution of Later Reward Later Reward Control Treatment Note: The figure shows the cumulative distribution of the later reward (i.e., the dollar amount of the 2nd check) by treatment status
24 Figure 2: Later Reward and Understanding of the Snacks Study Predicted Probability of Understanding Treatment Control Note: The curves show the expectation of the later reward conditional on the predicted probability of understanding the experiment information, estimated using a locally weighted regression smoother. The lines show the ordinary least squares estimates Later Reward
25 Table 1: Summary Statistics and Balance Check Control Treatment Arm #1 Treatment Arm #2 (1) (2) (3) (4) (5) (6) Test (1) = (3) Test (1) = (5) Test (3) = (5) Means SD Means SD Means SD P-value P-value P-value Individual Characteristics Male 41.4% 49.3% 41.8% 49.3% 38.6% 48.7% Age Year of Birth Month of Birth Birth Day Born in US 92.7% 26.1% 91.5% 27.9% 92.8% 25.8% Born in the Midwest 26.9% 44.4% 27.0% 44.4% 28.0% 44.9% Born in the South 26.0% 43.9% 27.6% 44.7% 26.1% 44.0% Born in the West 20.7% 40.5% 19.4% 39.5% 17.4% 38.0% * 0.28 White 81.4% 38.9% 78.8% 40.9% 82.3% 38.2% 0.09* * Black 8.9% 28.5% 11.2% 31.5% 9.1% 28.8% 0.05* Married 61.3% 48.7% 59.6% 49.1% 62.5% 48.5% Divorced or Separated 17.4% 37.9% 17.5% 38.0% 15.0% 35.8% Never Married 16.9% 37.5% 18.2% 38.6% 18.1% 38.5% College Graduate 51.9% 50.0% 52.2% 50.0% 51.7% 50.0% Some College 25.6% 43.7% 25.5% 43.6% 27.5% 44.7% High School 19.0% 39.3% 16.9% 37.5% 17.0% 37.6% Working 61.9% 48.6% 56.7% 49.6% 62.6% 48.4% 0.01*** *** Unemployed 10.8% 31.1% 11.3% 31.7% 9.8% 29.8% Disabled 6.5% 24.7% 8.0% 27.1% 7.0% 25.6% Characteristics of the Household Resides in the Midwest 21.6% 41.2% 23.4% 42.3% 22.9% 42.0% Resides in the South 34.5% 47.6% 32.0% 46.7% 34.4% 47.5% Resides in the West 28.4% 45.1% 28.9% 45.3% 26.4% 44.1% Lives Alone 44.8% 49.7% 47.5% 50.0% 46.1% 49.9% Household Size $30,000 <= Income Last 12 Months < $50, % 41.5% 23.2% 42.2% 26.5% 44.2% ** 0.09* $50,000 <= Income Last 12 Months < $75, % 40.5% 21.0% 40.7% 20.8% 40.6% Income Last 12 Months >= $75, % 44.8% 26.7% 44.2% 28.2% 45.0% # Observations 1,340 1, Note : Column (1), (3) and (5) report separate means for the control and treatment groups. Columns (2), (4) and (6) report the standard deviations. The last three columns report the p-value of twoways tests of the equality of the means across the groups.
26 Table 2. Treatment Effect by Interest Rate and Time Frame (1) (2) (3) Test Differences Monthly Interest Rates Across Interest Rates Dependent Variable: Later Reward 0.5% 1% 2.5% Test P-value Panel A: Today x In 1 Month Treatment (1) = (2) [6.63]*** [5.92]*** [5.12]* (1) = (3) Constant (2) = (3) [4.85]*** [4.36]*** [3.74]*** Observations 2,655 2,654 2,654 Panel B: In 1 Year x In 1 Year and 1 Month Treatment (1) = (2) [6.78]*** [6.28]** [5.49] (1) = (3) Constant (2) = (3) [4.90]*** [4.55]*** [3.91]*** Observations 2,652 2,652 2,652 P-value Test Differences Across Time Frames Note : Robust standard errors in brackets. The table reports OLS estimates of the treatment effect on the later reward for different monthly interest rates and time frames. The later reward (LR) is the amount in dollars of the second check. Respondents were asked to make six intertemporal choices, in which we varied the monthly interest rate (0.5%, 1% and 2.5%) and the time frame. Panel A shows results for the intertemporal choices made when the check mailing dates were "today" and "in 1 month". Panel B reports results for choices made when the mailing dates were "in 1 year" and "in 1 year and 1 month." The monthly interest varies across columns. The order of the time frames was randomized. Given a time frame, the interest rate increased monotonically.
27 Table 3. Treatment Effects OLS LR LR = 0 LR = LR (Tobit) LR (Trimmed) Panel A: No Controls Treatment [6.78]*** [0.01]*** [0.02]*** [10.93]*** (10.78)*** Constant [4.90]*** [0.01]*** [0.01]*** [7.72]*** (7.57)*** Observations 2,652 2,652 2,652 2,652 1,459 Panel B: With Controls Treatment [6.79]*** [0.01]*** [0.02]*** [10.90]*** Constant [26.97]*** [0.04] [0.07]*** [42.07]*** Observations 2,652 2,652 2,652 2,652 - Note : Robust standard errors in brackets. Bootstrapped standard errors in parentheses. The first column reports ordinary least least square results. The dependent variable is the later reward (LR), the amount in dollars of the second check. The mailing dates of the 1st and 2nd checks were 1 year and 1 year and 1 month, respectively. The monthly interest rate was 0.5%. The dependent variables in the second and third columns are indicators for whether the later reward was $0 or $502.5, respectively. The last two columns report results from models that take into account that the later reward is censored at $0 and $ Panel A report results without controls. Panel B reports results with controls (all variables presented in Table 1).
28 Table 4. Understanding of the Snacks Study Category % Example instant gratification* 17.9% "People like instant gratrification." people have good intentions but don't act as intended* 12.0% "Many people have good intentions about the future, but make different (or not as wise) decisions." I chose apples/doritos because. 9.6% "I chose Doritos because they cost more than an apple." people make bad choices for now 9.2% " When asked to make a choice that will affect them in the present they often pick the one that is the least beneficial" people make good choices for the future 8.2% "when people are asked to make a choice that will affect them in the future they usually pick the "best" choice." different decisions for now and for later* 7.7% The decisions people make for the future are not the same ones they make for today. people should eat healthier 6.4% "Eat healthy!" temptation* 5.1% "most people can not resist temptation" people prefer junk food 4.6% "People fundamentally like junk food" I will delay if the interest is high enough 4.1% as long as the money offered can be delayed with better than average returns - I'm very happy to delay it people change their minds 3.6% "that people do change their minds." apples are healthier than doritos 3.2% "an apple a day keeps the doctor away" save 2.8% the more you save the more you have when its retirement. people should plan for the future 2.6% "Think about the future!" people decide without thinking 2.3% "People make bad choices without thinking about it." impulsivity* 2.3% "People act on impulse" I can wait 2.2% I learned that I do Have Patience To wait for extra cash people should delay gratification 2.2% "it is better to delay gratification" people cannot delay gratification 2.1% "Most people cannot delay gratification." people should save 1.9% "Save your money for a rainy day." people should stick to their plans 1.8% "It is important to stick with plans in life" choices are circumstancial 1.6% Then too, it depends on your mood at the time. self-control* 1.5% "People have no self control." choices depend on whether one needs cash 1.4% "What is saved or earned depends on each persons financial situation at the time." present bias* 1.1% people suffer of present bias procrastination* 0.9% "people tend to put off what should be done now, not tomorrow." patience 0.8% I learned that I do Have Patience To wait for extra cash and some people do not. people prefer now than later* 0.5% people want more now rather than later people overestimate their self-control* 0.5% "People like to imagine themselves as more self disciplined than they are" people prefer sooner than later 0.4% "Most people like to receive things sooner than later." willpower* 0.4% "people have lofty ambitions but low willpower" people live in the moment 0.2% "People tend to live in the present" Non-missing Observations 856 Note: The table shows the distribution of responses to the following open-ended question: "Did you learn something from the Apples or Doritos real-life study? Could you explain in your own words what you learned? The answers to these questions were first reviewed to determine categories that could characterize the answers and then coded into the created categories. The categories are not exclusive, such that a response from one respondent may be coded into more than one category. The third colum shows verbatim examples of typical answers. The categories marked with * denote the categories that are associated with having understood the experiment information.
29 Table 5. Later Reward and Understanding of the Snacks Study Panel A: Treatment Effect and the Predicted Probability of Understanding Dependent Variable: Later Reward Model 1 Model 2 OLS Tobit OLS Tobit Predicted Probability * Treatment [60.88]** [100.27]*** [57.46]** [99.55]** Treatment [15.55] [24.31] [15.45] [25.21] Predicted Probability of Understanding [43.77] [70.57] [40.66] [69.17] Constant [11.03]*** [17.13]*** [10.86]*** [17.53]*** Observations 2,652 2,652 2,117 2,117 Panel B: Modeling the Probability of Understanding Among the Treatment Dependent Variable: Understands the Experiment Information (Multinomial Logit) Model 1 Model 2 Coefficient Standard Error Coefficient Standard Error Financial Literacy Compound Interest 0.38 [0.21]* Risk Diversification 0.76 [0.24]*** Inflation 0.37 [0.25] Controls from Table 1 Male 0.04 [0.15] [0.17] Age 0.22 [0.23] 0.25 [0.27] Year of Birth 0.25 [0.23] 0.29 [0.28] Month of Birth 0.05 [0.03] 0.06 [0.04] Birth Day 0.00 [0.01] 0.00 [0.01] Born in US [0.35] [0.40] Born in the Midwest 0.31 [0.31] 0.31 [0.33] Born in the South [0.30] 0.04 [0.33] Born in the West 0.28 [0.33] 0.26 [0.36] White 0.77 [0.31]** 0.39 [0.37] Black 0.28 [0.39] [0.47] Married [0.37] [0.42]* Divorced or Separated [0.40] [0.45]* Never Married [0.42] [0.48] College Graduate 0.97 [0.48]** 0.03 [0.57] Some College 0.64 [0.49] [0.57] High School 0.56 [0.50] 0.10 [0.59] Working [0.19]* [0.22] Unemployed [0.30]** [0.35] Disabled [0.36] [0.43] Resides in the Midwest 0.07 [0.33] 0.10 [0.36] Resides in the South 0.27 [0.30] 0.27 [0.33] Resides in the West 0.11 [0.31] 0.23 [0.34] Lives Alone [0.24]** [0.28]* Household Size [0.09] [0.10] $30,000 <= Income Last 12 Months < $50, [0.23]*** 0.97 [0.27]*** $50,000 <= Income Last 12 Months < $75, [0.24] 0.48 [0.28]* Income Last 12 Months >= $75, [0.25]*** 1.20 [0.30]*** Observations 1,314 1,044 Note : Robust standard errors in brackets. The table shows how the treatment effect depends on the predicted probability of understanding the Snacks Study. Panel B reports the results from a multinomial logit regression of understanding the experiment information on baseline characteristics (the third outcome is not having answered). In model 1 the probability is predicted using the control variables from Table 1. Model 2 uses these variables plus answers to three financial literacy questions asked in a previous survey module of the ALP: "Suppose you had $100 in a savings account and the interest rate is 20% per year and you never withdraw money or interest payments. After 5 years. how much would you have in this account in total?"; "Imagine that there interest rate on your savings account was 1% per year and inflation was 2% per year. After 1 year, how much would be able to buy with the money in this account? " and "When a investor spreads his money among different assets, does the risk of losing money increase, decrease or stay the same? ". These estimated coefficients were then used to estimate the predicted probability of understanding. Panel A report results from OLS and Tobit regressions of the later reward on the predicted probability, an interaction of the predicted probability with treatment status, and the treatment status indicator.
30 Table 6. Experimenter Demand Effects LR (OLS) LR = 0 (OLS) LR = (OLS) LR (Tobit) LR (Trimmed) Panel A: No Controls Effect of Screen # [9.65] [0.02] [0.02] [15.86] (12.58) Constant (6 Screens) [6.67]*** [0.01]*** [0.02]*** [11.04]*** (8.80)*** Observations 1,383 1,383 1,383 1, Panel B: With Controls Effect of Screen # [9.71] [0.02] [0.02] [15.89] Constant (6 Screens) [37.96]*** [0.06] [0.10]** [61.20]*** Observations 1,383 1,383 1,383 1,383 - P-value Test Difference Between Effect of Screen #7 and Benchmark Treatment Effect Estimates (Table 3) Panel A Panel B Note : Robust standard errors in brackets. Bootstrapped standard errors in parentheses. The table estimates the effect of seeing screen #7 on the later reward. The sample is restricted to participants who were randomly selected into treatment and to receive first the "today frame" (the mailing date of first check), all of whom saw at least 6 screens. Approximately half of this sample was randomly selected to see a 7th screen, which would potentially induce experimenter demand effects. The estimated results are from regressions of some measure of the later reward on a constant (corresponding to the mean for the group who saw 6 screens only) and an indicator variable identifying respondents who saw the 7th screen. See footnote of Table 3 for an explanation of the difference across columns. Panel A report results without controls. Panel B reports results with controls (all variables presented in Table 1).
31 The Appendix is not intended for publication.
32 Information Screens Seen by Treatment Group (the control group did not see any of these screens)


33

34


35


36


37


38
39 Information Screen #7 This screen was seen by the first treatment arm only (the second treatment arm did not see it).


40
41 Intertemporal Choice Task This is the screen in which respondents entered their intertemporal choices.


42
Temptation and Self Control Evidence. Hauser et al. [2010] Evidence on Temptation and Self Control. Temptation and commitment in the laboratory
![Temptation and Self Control Evidence. Hauser et al. [2010] Evidence on Temptation and Self Control. Temptation and commitment in the laboratory](/thumbs/94/118047768.jpg "Temptation and Self Control Evidence. Hauser et al. [2010] Evidence on Temptation and Self Control. Temptation and commitment in the laboratory") Evidence on Temptation and Self Control Temptation and Self Control Evidence Mark Dean Behavioral Economics ECON 1820 Discuss some empirical evidence on Demand for Commitment Present Bias Sophistication
Evidence on Temptation and Self Control Temptation and Self Control Evidence Mark Dean Behavioral Economics ECON 1820 Discuss some empirical evidence on Demand for Commitment Present Bias Sophistication
TIME DISCOUNTING FOR PRIMARY AND MONETARY REWARDS *
 TIME DISCOUNTING FOR PRIMARY AND MONETARY REWARDS * ERNESTO REUBEN Columbia University and IZA PAOLA SAPIENZA Northwestern University, NBER, and CEPR LUIGI ZINGALES University of Chicago, NBER, and CEPR
Alcohol and Self-Control
 Alcohol and Self-Control A Field Experiment in India Frank Schilbach MIT October 16, 2015 1 / 35 Alcohol consumption among the poor Heavy drinking is common among low-income males in developing countries.
Introduction to Behavioral Economics Like the subject matter of behavioral economics, this course is divided into two parts:
 Economics 142: Behavioral Economics Spring 2008 Vincent Crawford (with very large debts to Colin Camerer of Caltech, David Laibson of Harvard, and especially Botond Koszegi and Matthew Rabin of UC Berkeley)
The Impact of Relative Standards on the Propensity to Disclose. Alessandro Acquisti, Leslie K. John, George Loewenstein WEB APPENDIX
 The Impact of Relative Standards on the Propensity to Disclose Alessandro Acquisti, Leslie K. John, George Loewenstein WEB APPENDIX 2 Web Appendix A: Panel data estimation approach As noted in the main
Instant Gratification and Self-Control in an Experiment with Children and Teenagers
 Instant Gratification and Self-Control in an Experiment with Children and Teenagers Tabea Bucher-Koenen University of Mannheim and MEA Carsten Schmidt University of Mannheim December 10, 2009 Abstract
Economics 101A (Lecture 13) Stefano DellaVigna
 Stefano DellaVigna") Economics 101A (Lecture 13) Stefano DellaVigna March 2, 2017 Outline 1. Time Consistency 2. Time Inconsistency 3. Health Club Attendance 4. Production: Introduction 5. Production Function 1 Time consistency
Economics 101A (Lecture 13) Stefano DellaVigna March 2, 2017 Outline 1. Time Consistency 2. Time Inconsistency 3. Health Club Attendance 4. Production: Introduction 5. Production Function 1 Time consistency
Online Appendix A. A1 Ability
 Online Appendix A A1 Ability To exclude the possibility of a gender difference in ability in our sample, we conducted a betweenparticipants test in which we measured ability by asking participants to engage
Goal-setting for a healthier self: evidence from a weight loss challenge
 Goal-setting for a healthier self: evidence from a weight loss challenge Séverine Toussaert (NYU) November 12, 2015 Goals as self-disciplining devices (1) 1. Goals are a key instrument of self-regulation.
Incentives, Commitments and Habit Formation in Exercise: Evidence from a Field Experiment with Workers at a Fortune 500 Company
 Incentives, Commitments and Habit Formation in Exercise: Evidence from a Field Experiment with Workers at a Fortune 500 Company Heather Royer, UC Santa Barbara & NBER royer@econ.ucsb.edu Mark Stehr, Drexel
Problems Seem to Be Ubiquitous 3/2/2017. (1) Temptation and Self Control. Behavioral Economics Spring 2017 Columbia University Mark Dean
 Temptation and Self Control. Behavioral Economics Spring 2017 Columbia University Mark Dean") Temptation and Self Control Temptation and Self Control Behavioral Economics Spring 2017 Columbia University Mark Dean One of the most successful and influential areas in behavioral economics Lots of work:
Temptation and Self Control Temptation and Self Control Behavioral Economics Spring 2017 Columbia University Mark Dean One of the most successful and influential areas in behavioral economics Lots of work:
Problems Seem to Be Ubiquitous 10/27/2018. (1) Temptation and Self Control. Behavioral Economics Fall 2018 G6943: Columbia University Mark Dean
 Temptation and Self Control. Behavioral Economics Fall 2018 G6943: Columbia University Mark Dean") Behavioral Economics Fall 2018 G6943: Columbia University Mark Dean One of the most successful and influential areas in behavioral economics Lots of work: Theoretical: Gul, F. and W. Pesendorfer (2001)
Behavioral Economics Fall 2018 G6943: Columbia University Mark Dean One of the most successful and influential areas in behavioral economics Lots of work: Theoretical: Gul, F. and W. Pesendorfer (2001)
Time Discounting: Delay Effect and Procrastinating Behavior
 Time Discounting: Delay Effect and Procrastinating Behavior Shunichiro Sasaki 1 (Nagoya University of Commerce and Business) Shiyu Xie 2 (Fudan University) Shinsuke Ikeda 3 (Oasaka University) Jie Qin
An Experiment on Time Preference and Misprediction in Unpleasant Tasks
 An Experiment on Time Preference and Misprediction in Unpleasant Tasks Ned Augenblick and Matthew Rabin June 12, 2017 Abstract We experimentally investigate the time-inconsistent taste for immediate gratification
Experimental Testing of Intrinsic Preferences for NonInstrumental Information
 Experimental Testing of Intrinsic Preferences for NonInstrumental Information By Kfir Eliaz and Andrew Schotter* The classical model of decision making under uncertainty assumes that decision makers care
Procrastination and Impatience
 Procrastination and Impatience Ernesto Reuben Northwestern University Paola Sapienza Northwestern University, NBER, and CEPR Luigi Zingales University of Chicago, NBER, and CEPR First Draft: January 10,
Econ 219B Psychology and Economics: Applications (Lecture 4)
") Econ 219B Psychology and Economics: Applications (Lecture 4) Stefano DellaVigna February 13, 2008 Outline 1. Leisure Goods: Commitments and Savings 2. Five More Applications of Present Bias 3. Present
Econ 219B Psychology and Economics: Applications (Lecture 4) Stefano DellaVigna February 13, 2008 Outline 1. Leisure Goods: Commitments and Savings 2. Five More Applications of Present Bias 3. Present
The Discounted Utility Model
 AREC 815: Experimental and Behavioral Economics Time Preferences & Present Bias Professor: Pamela Jakiela Department of Agricultural and Resource Economics University of Maryland, College Park The Discounted
Abhijit Banerjee Esther Duflo 14.73
 Abhijit Banerjee Esther Duflo 14.73 1 Experiment in Busia, Keny Experiments on pilot plots on farmers plot. Not taking into account labor costs: Over 3.4 months: 27% Annualized: 106% Taking into account
WORKING P A P E R. The Effect of Education on Time Preferences FRANCISCO PEREZ-ARCE WR-844. March 2011
 WORKING P A P E R The Effect of Education on Time Preferences FRANCISCO PEREZ-ARCE WR-844 March 2011 This paper series made possible by the NIA funded RAND Center for the Study of Aging (P30AG012815) and
Discounting of Monetary and Directly Consumable Rewards Sara J. Estle, Leonard Green, Joel Myerson, and Daniel D. Holt
 PSYCHOLOGICAL SCIENCE Research Article Discounting of Monetary and Directly Consumable Rewards Sara J. Estle, Leonard Green, Joel Myerson, and Daniel D. Holt Washington University ABSTRACT We compared
Memory and Discounting: Theory and Evidence 1
 Memory and Discounting: Theory and Evidence 1 Te Bao, Assistant Professor of Economics, Division of Economics, School of Humanities and Social Sciences, Nanyang Technological University, 14 Nanyang Dr,
WRITTEN PRELIMINARY Ph.D. EXAMINATION. Department of Applied Economics. January 17, Consumer Behavior and Household Economics.
 WRITTEN PRELIMINARY Ph.D. EXAMINATION Department of Applied Economics January 17, 2012 Consumer Behavior and Household Economics Instructions Identify yourself by your code letter, not your name, on each
The Economics of tobacco and other addictive goods Hurley, pp
 s of The s of tobacco and other Hurley, pp150 153. Chris Auld s 318 March 27, 2013 s of reduction in 1994. An interesting observation from Tables 1 and 3 is that the provinces of Newfoundland and British
TIME PREFERENCE AND ADDICTIVE CONSUMPTION: EXPERIMENTAL AND THEORETICAL APPROACHES. A Dissertation YUE ZHANG
 TIME PREFERENCE AND ADDICTIVE CONSUMPTION: EXPERIMENTAL AND THEORETICAL APPROACHES A Dissertation by YUE ZHANG Submitted to the Office of Graduate and Professional Studies of Texas A&M University in partial
Put Your Money Where Your Butt Is: A Commitment Savings Account for Smoking Cessation * Xavier Giné World Bank
 Put Your Money Where Your Butt Is: A Commitment Savings Account for Smoking Cessation * Xavier Giné World Bank xgine@worldbank.org Dean Karlan Innovations for Poverty Action dkarlan@poverty-action.org
Working Over Time: Dynamic Inconsistency in Real E ort Tasks
 Working Over Time: Dynamic Inconsistency in Real E ort Tasks Ned Augenblick UC Berkeley, Haas School of Business Charles Sprenger Stanford University First Draft: July 15, 2012 This Version: January 15,
Folland et al Chapter 4
 Folland et al Chapter 4 Chris Auld Economics 317 January 11, 2011 Chapter 2. We won t discuss, but you should already know: PPF. Supply and demand. Theory of the consumer (indifference curves etc) Theory
The Economics of Obesity
 The Economics of Obesity John Cawley Cornell University Usefulness of Economics in Studying Obesity Offers widely-accepted theoretical framework for human behavior (constrained maximization) We ask different
Procrastination and Impatience
 Procrastination and Impatience Ernesto Reuben, Paola Sapienza, and Luigi Zingales First version: December 2007 This version: July 2008 Abstract We use a combination of lab and field evidence to study whether
Patience, Self-Control and the Demand for Commitment: Evidence from a Large-Scale Field Experiment. Sule Alan 1. Department of Economics
 Patience, Self-Control and the Demand for Commitment: Evidence from a Large-Scale Field Experiment Sule Alan 1 Department of Economics University of Essex Seda Ertac College of Administrative Sciences
Hana Ross, PhD American Cancer Society and the International Tobacco Evidence Network (ITEN)
") The Costs of Smoking Hana Ross, PhD American Cancer Society and the International Tobacco Evidence Network (ITEN) Why Do We Study the Cost of Smoking? To assess the economic impact of smoking behavior
The Costs of Smoking Hana Ross, PhD American Cancer Society and the International Tobacco Evidence Network (ITEN) Why Do We Study the Cost of Smoking? To assess the economic impact of smoking behavior
Naiveté, Projection Bias, and Habit Formation in Gym Attendance
 Naiveté, Projection Bias, and Habit Formation in Gym Attendance Dan Acland and Matthew Levy 10 March, 2013 Abstract We develop a model capturing habit formation, projection bias, and present bias in an
Time discounting for primary and monetary rewards
 MPRA Munich Personal RePEc Archive Time discounting for primary and monetary rewards Ernesto Reuben and Paola Sapienza and Luigi Zingales Northwestern University, University of Chicago July 2008 Online
Volume 36, Issue 3. David M McEvoy Appalachian State University
 Volume 36, Issue 3 Loss Aversion and Student Achievement David M McEvoy Appalachian State University Abstract We conduct a field experiment to test if loss aversion behavior can be exploited to improve
Smoking, Wealth Accumulation and the Propensity to Plan
 Smoking, Wealth Accumulation and the Propensity to Plan Ahmed Khwaja, Fuqua School of Business, Duke University Dan Silverman, Department of Economics, University of Michigan, Institute of Advanced Study,
Separation of Intertemporal Substitution and Time Preference Rate from Risk Aversion: Experimental Analysis
 . International Conference Experiments in Economic Sciences 3. Oct. 2004 Separation of Intertemporal Substitution and Time Preference Rate from Risk Aversion: Experimental Analysis Ryoko Wada Assistant
Appendix: Instructions for Treatment Index B (Human Opponents, With Recommendations)
") Appendix: Instructions for Treatment Index B (Human Opponents, With Recommendations) This is an experiment in the economics of strategic decision making. Various agencies have provided funds for this research.
Appendix: Instructions for Treatment Index B (Human Opponents, With Recommendations) This is an experiment in the economics of strategic decision making. Various agencies have provided funds for this research.
Here s a list of the Behavioral Economics Principles included in this card deck
 Here s a list of the Behavioral Economics Principles included in this card deck Anchoring Action Goals Availability Bias Decision Paralysis Default Bias Disposition Effect Ego Depletion Endowment Effect
Present Bias and Everyday Self-Control Failures
 Present Bias and Everyday Self-Control Failures Liam Delaney Leonhard K. Lades This version: July 28, 2015 Abstract Present bias is the economist s favorite explanation for self-control problems. However,
Do Women Shy Away from Competition? Do Men Compete too Much?
 This work is distributed as a Discussion Paper by the STANFORD INSTITUTE FOR ECONOMIC POLICY RESEARCH SIEPR Discussion Paper No. 04-30 Do Women Shy Away from Competition? Do Men Compete too Much? By Muriel
Can Interventions Affect Commitment Demand? A Field Experiment on Food Choice
 Can Interventions Affect Commitment Demand? A Field Experiment on Food Choice Sally Sadoff University of California, San Diego Anya Samek University of Southern California September, 2018 Abstract Despite
Econ 219B Psychology and Economics: Applications (Lecture 1)
") Econ 219B Psychology and Economics: Applications (Lecture 1) Stefano DellaVigna January 21, 2009 Outline 1. Introduction / Prerequisites 2. Getting started! Psychology and Economics: The Topics 3. Psychology
Econ 219B Psychology and Economics: Applications (Lecture 1) Stefano DellaVigna January 21, 2009 Outline 1. Introduction / Prerequisites 2. Getting started! Psychology and Economics: The Topics 3. Psychology
Glossary From Running Randomized Evaluations: A Practical Guide, by Rachel Glennerster and Kudzai Takavarasha
 Glossary From Running Randomized Evaluations: A Practical Guide, by Rachel Glennerster and Kudzai Takavarasha attrition: When data are missing because we are unable to measure the outcomes of some of the
Money over Matter: Can Cash Incentives Keep People Healthy?
 Permanent Address: http://www.scientificamerican.com/article/can-cash-incentives-keep-people-healthy/ Money over Matter: Can Cash Incentives Keep People Healthy? Losing weight or quitting smoking might
Reading and maths skills at age 10 and earnings in later life: a brief analysis using the British Cohort Study
 Reading and maths skills at age 10 and earnings in later life: a brief analysis using the British Cohort Study CAYT Impact Study: REP03 Claire Crawford Jonathan Cribb The Centre for Analysis of Youth Transitions
Procrastination and Impatience. Ernesto Reuben Paola Sapienza Luigi Zingales
 Procrastination and Impatience Ernesto Reuben Paola Sapienza Luigi Zingales Procrastination and Impatience Ernesto Reuben Columbia University and IZA, e-mail: ereuben@columbia.edu Paola Sapienza Northwestern
Sawtooth Software. The Number of Levels Effect in Conjoint: Where Does It Come From and Can It Be Eliminated? RESEARCH PAPER SERIES
 Sawtooth Software RESEARCH PAPER SERIES The Number of Levels Effect in Conjoint: Where Does It Come From and Can It Be Eliminated? Dick Wittink, Yale University Joel Huber, Duke University Peter Zandan,
Explaining Bargaining Impasse: The Role of Self-Serving Biases
 Explaining Bargaining Impasse: The Role of Self-Serving Biases Linda Babcock and George Loewenstein Journal of Economic Perspectives, 1997 報告人 : 高培儒 20091028 1 1. Introduction Economists, and more specifically
Revisiting Kindness and Confusion in Public Goods Experiments
 Revisiting Kindness and Confusion in Public Goods Experiments By DANIEL HOUSER AND ROBERT KURZBAN* There has been substantial recent interest in determining why there is cooperation in public goods experiments
Time Preferences, Health Behaviors, and Energy Consumption
 1 Time Preferences, Health Behaviors, and Energy Consumption Abstract We conduct a survey eliciting time preferences from a representative sample of US residents, allowing for quasi-hyperbolic discounting.
Version No. 7 Date: July Please send comments or suggestions on this glossary to
 Impact Evaluation Glossary Version No. 7 Date: July 2012 Please send comments or suggestions on this glossary to 3ie@3ieimpact.org. Recommended citation: 3ie (2012) 3ie impact evaluation glossary. International
Lecture II: Difference in Difference. Causality is difficult to Show from cross
 Review Lecture II: Regression Discontinuity and Difference in Difference From Lecture I Causality is difficult to Show from cross sectional observational studies What caused what? X caused Y, Y caused
Design and Use of Psychometric Tools : Measurement and Modeling in In Search of The B-Factor
 Design and Use of Psychometric Tools : Measurement and Modeling in In Search of The B-Factor Joanne Yoong USC Center for Economic and Social Research Saw Swee Hock School of Public Health, NUS and NUHS
Correlation Neglect in Belief Formation
 Correlation Neglect in Belief Formation Benjamin Enke Florian Zimmermann Bonn Graduate School of Economics University of Zurich NYU Bounded Rationality in Choice Conference May 31, 2015 Benjamin Enke (Bonn)
Addiction in the Quasi-Hyperbolic Model
 AREC 815: Experimental and Behavioral Economics Applications of Dynamic Inconsistency: Addiction Professor: Pamela Jakiela Department of Agricultural and Resource Economics University of Maryland, College
GROUP DECISION MAKING IN RISKY ENVIRONMENT ANALYSIS OF GENDER BIAS
 GROUP DECISION MAKING IN RISKY ENVIRONMENT ANALYSIS OF GENDER BIAS Andrea Vasiľková, Matúš Kubák, Vladimír Gazda, Marek Gróf Abstract Article presents an experimental study of gender bias in group decisions.
Placebo and Belief Effects: Optimal Design for Randomized Trials
 Placebo and Belief Effects: Optimal Design for Randomized Trials Scott Ogawa & Ken Onishi 2 Department of Economics Northwestern University Abstract The mere possibility of receiving a placebo during a
The role of training in experimental auctions
 AUA Working Paper Series No. 2010-2 February 2010 The role of training in experimental auctions Andreas Drichoutis Department of Economics University of Ioannina, Greece adrihout@cc.uoi.gr Rodolfo M. Nayga,
MEA DISCUSSION PAPERS
 Inference Problems under a Special Form of Heteroskedasticity Helmut Farbmacher, Heinrich Kögel 03-2015 MEA DISCUSSION PAPERS mea Amalienstr. 33_D-80799 Munich_Phone+49 89 38602-355_Fax +49 89 38602-390_www.mea.mpisoc.mpg.de
A Note On the Design of Experiments Involving Public Goods
 University of Colorado From the SelectedWorks of PHILIP E GRAVES 2009 A Note On the Design of Experiments Involving Public Goods PHILIP E GRAVES, University of Colorado at Boulder Available at: https://works.bepress.com/philip_graves/40/
What Behaviors Do Behavior Programs Change
 What Behaviors Do Behavior Programs Change Yingjuan (Molly) Du, Dave Hanna, Jean Shelton and Amy Buege, Itron, Inc. ABSTRACT Utilities behavioral programs, such as audits and web-based tools, are designed
Instrumental Variables I (cont.)
") Review Instrumental Variables Observational Studies Cross Sectional Regressions Omitted Variables, Reverse causation Randomized Control Trials Difference in Difference Time invariant omitted variables
Review Instrumental Variables Observational Studies Cross Sectional Regressions Omitted Variables, Reverse causation Randomized Control Trials Difference in Difference Time invariant omitted variables
Laurens Verhoef. The Effects of Labeling on Consumption Behavior. MSc Thesis
 Laurens Verhoef The Effects of Labeling on Consumption Behavior MSc Thesis 2010-041 MASTER THESIS ECONOMICS The effects of labeling on consumption behavior By Laurens Verhoef (527223) MSc Economics Supervisor:
Unit 1 Exploring and Understanding Data
 Unit 1 Exploring and Understanding Data Area Principle Bar Chart Boxplot Conditional Distribution Dotplot Empirical Rule Five Number Summary Frequency Distribution Frequency Polygon Histogram Interquartile
Gender specific attitudes towards risk and ambiguity an experimental investigation
 Research Collection Working Paper Gender specific attitudes towards risk and ambiguity an experimental investigation Author(s): Schubert, Renate; Gysler, Matthias; Brown, Martin; Brachinger, Hans Wolfgang
DMA will take your dental practice to the next level
 DMA will take your dental practice to the next level A membership payment plan created by dentists for dentists and patients Traditionally dentists have only been able to grow their practices by a mix
Multiple Switching Behavior in Multiple Price Lists
 Multiple Switching Behavior in Multiple Price Lists David M. Bruner This version: September 2007 Abstract A common mechanism to elicit risk preferences requires a respondent to make a series of dichotomous
(Im)patience by Proxy: Making Intertemporal Decisions for Others
patience by Proxy: Making Intertemporal Decisions for Others") (Im)patience by Proxy: Making Intertemporal Decisions for Others Angela C.M. de Oliveira and Sarah Jacobson * University of Massachusetts Amherst Williams College December 2016 Abstract: Decisions with
(Im)patience by Proxy: Making Intertemporal Decisions for Others Angela C.M. de Oliveira and Sarah Jacobson * University of Massachusetts Amherst Williams College December 2016 Abstract: Decisions with
P E R S P E C T I V E S
 PHOENIX CENTER FOR ADVANCED LEGAL & ECONOMIC PUBLIC POLICY STUDIES Revisiting Internet Use and Depression Among the Elderly George S. Ford, PhD June 7, 2013 Introduction Four years ago in a paper entitled
The U-Shape without Controls. David G. Blanchflower Dartmouth College, USA University of Stirling, UK.
 The U-Shape without Controls David G. Blanchflower Dartmouth College, USA University of Stirling, UK. Email: david.g.blanchflower@dartmouth.edu Andrew J. Oswald University of Warwick, UK. Email: andrew.oswald@warwick.ac.uk
Risky Choice Decisions from a Tri-Reference Point Perspective
 Academic Leadership Journal in Student Research Volume 4 Spring 2016 Article 4 2016 Risky Choice Decisions from a Tri-Reference Point Perspective Kevin L. Kenney Fort Hays State University Follow this
Pre-analysis Plan Outline for Sleepless in Chennai: The Consequences of Sleep Deprivation Among the Urban Poor
 Pre-analysis Plan Outline for Sleepless in Chennai: The Consequences of Sleep Deprivation Among the Urban Poor Pedro Bessone Tepedino MIT Gautam Rao Harvard University Frank Schilbach MIT Heather Schofield
NBER WORKING PAPER SERIES NUDGES IN EXERCISE COMMITMENT CONTRACTS: A RANDOMIZED TRIAL. Jay Bhattacharya Alan M. Garber Jeremy D.
 NBER WORKING PAPER SERIES NUDGES IN EXERCISE COMMITMENT CONTRACTS: A RANDOMIZED TRIAL Jay Bhattacharya Alan M. Garber Jeremy D. Goldhaber-Fiebert Working Paper 21406 http://www.nber.org/papers/w21406 NATIONAL
Economics 345 Applied Econometrics
 Economics 345 Applied Econometrics Lab Exam Version 1: Solutions Fall 2016 Prof: Martin Farnham TAs: Joffré Leroux Rebecca Wortzman Last Name (Family Name) First Name Student ID Open EViews, and open the
Does time inconsistency differ between gain and loss? An intra-personal comparison using a non-parametric. elicitation method (A revised version)
") WINPEC Working Paper Series No.E1807 August 2018 Does time inconsistency differ between and? An intra-personal comparison using a non-parametric elicitation method (A revised version) Shotaro Shiba, Kazumi
WINPEC Working Paper Series No.E1807 August 2018 Does time inconsistency differ between and? An intra-personal comparison using a non-parametric elicitation method (A revised version) Shotaro Shiba, Kazumi
Economics Bulletin, 2013, Vol. 33 No. 1 pp
 1. Introduction An often-quoted paper on self-image as the motivation behind a moral action is An economic model of moral motivation by Brekke et al. (2003). The authors built the model in two steps: firstly,
Who will benefit from using this app?
 INSTRUCTIONS for THE MINDFUL EATING COACH APP (available at Apple Store) (These instructions provide more detail than what is currently in the app under the Coaching tab) Who will benefit from using this
Integrated versus segregated accounting and the magnitude effect in temporal discounting
 Psychonomic Bulletin & Review 2005, 12 (4), 732-739 Integrated versus segregated accounting and the magnitude effect in temporal discounting RANDOLPH C. GRACE and ANTHONY P. MCLEAN University of Canterbury,
STEP II Conceptualising a Research Design
 STEP II Conceptualising a Research Design This operational step includes two chapters: Chapter 7: The research design Chapter 8: Selecting a study design CHAPTER 7 The Research Design In this chapter you
Belief Formation in a Signalling Game without Common Prior: An Experiment
 Belief Formation in a Signalling Game without Common Prior: An Experiment Alex Possajennikov University of Nottingham February 2012 Abstract Using belief elicitation, the paper investigates the formation
Feldexperimente in der Soziologie
 Feldexperimente in der Soziologie Einführungsveranstaltung 04.02.2016 Seite 1 Content 1. Field Experiments 2. What Do Laboratory Experiments Measuring Social Preferences Reveal about the Real World? Lab
Rational Behavior in Cigarette Consumption: Evidence from the United States
 2 Rational Behavior in Cigarette Consumption: Evidence from the United States Yan Song Abstract The primary focus of this essay is to use a long time series of state cross sections for the 1955-2009 time
Changing Public Behavior Levers of Change
 Changing Public Behavior Levers of Change Implications when behavioral tendencies serve as "levers" Adapted from: Shafir, E., ed. (2013). The Behavioral Foundations of Public Policy. Princeton University
The effects of providing fixed compensation and lottery-based rewards on uptake of medical male circumcision: a randomized trial
 The effects of providing fixed compensation and lottery-based rewards on uptake of medical male circumcision: a randomized trial Harsha Thirumurthy (UNC) Sam Masters (UNC) Joshua Graff Zivin (UCSD) Kawango
5 $3 billion per disease
 $3 billion per disease Chapter at a glance Our aim is to set a market size large enough to attract serious commercial investment from several pharmaceutical companies that see technological opportunites,
Heavily concentrated alcohol consumption in India
 Heavily concentrated alcohol consumption in India Standard drinks per day 0 1 2 3 4 5 5.0 4.9 2.8 2.3 1.4 0.7 India USA Russia Per capita (age 15+) Male drinkers only Source: WHO (2014), WHO (2001), own
Journal of Economic Behavior & Organization
 Journal of Economic Behavior & Organization 84 (212) 38 32 Contents lists available at SciVerse ScienceDirect Journal of Economic Behavior & Organization j our na l ho me p age: www.elsevier.com/locate/jebo
Effects of Sequential Context on Judgments and Decisions in the Prisoner s Dilemma Game
 Effects of Sequential Context on Judgments and Decisions in the Prisoner s Dilemma Game Ivaylo Vlaev (ivaylo.vlaev@psy.ox.ac.uk) Department of Experimental Psychology, University of Oxford, Oxford, OX1
Time-Inconsistent Generosity: Present Bias across Individual and Social Contexts
 Time-Inconsistent Generosity: Present Bias across Individual and Social Contexts Felix Kölle and Lukas Wenner University of Cologne July 2018 Abstract We extend the study of present bias from intertemporal
Behavioral Finance 1-1. Chapter 5 Heuristics and Biases
 Behavioral Finance 1-1 Chapter 5 Heuristics and Biases 1 Introduction 1-2 This chapter focuses on how people make decisions with limited time and information in a world of uncertainty. Perception and memory
People Do Not Discount Heavily in Strategic Settings, but They Believe Others Do
 Chapman University Chapman University Digital Commons ESI Working Papers Economic Science Institute 2014 People Do Not Discount Heavily in Strategic Settings, but They Believe Others Do Cary Deck Chapman
Simpson s paradox (or reversal paradox)
") Fallacy of division It is the opposite of the fallacy of composition. It occurs when it is automatically presumed that what is true at a larger scale (the global level) is true at some smaller scale (the
Fallacy of division It is the opposite of the fallacy of composition. It occurs when it is automatically presumed that what is true at a larger scale (the global level) is true at some smaller scale (the
Does Strategic Play Explain the Decay in Contributions in a Public Goods Game? Experimental Evidence
 Does Strategic Play Explain the Decay in Contributions in a Public Goods Game? Experimental Evidence Ananish Chaudhuri Department of Economics University of Auckland a.chaudhuri@auckland.ac.nz Tirnud Paichayontvijit
ORIENTATION SAN FRANCISCO STOP SMOKING PROGRAM
 ORIENTATION SAN FRANCISCO STOP SMOKING PROGRAM PURPOSE To introduce the program, tell the participants what to expect, and set an overall positive tone for the series. AGENDA Item Time 0.1 Acknowledgement
The Way to Choose: How Does Perceived Knowledge Flow
 The Way to Choose: How Does Perceived Knowledge Flow Iansã Melo Ferreira February 1, 2013 1 Third Year Seminars This is a new version of the work I presented last quarter. In response to some of the comments