Goal-setting for a healthier self: evidence from a weight loss challenge
|
|
|
- Teresa Quinn
- 5 years ago
- Views:
Transcription
1 Goal-setting for a healthier self: evidence from a weight loss challenge Séverine Toussaert (NYU) November 12, 2015
2 Goals as self-disciplining devices (1) 1. Goals are a key instrument of self-regulation. 2. n theory: -goals=referencepoint -falling below the goal) psychological loss 3. n the data: - higher goals) higher performance (Locke & Latham 2002) -largeevidenceforexternallyimposedgoals -evidencemorescarceforself-setgoals
3 Goals as self-disciplining devices (2) 1. For goals to work, they have to be SMART: Specific Measurable Achievable Realistic Time-bound 2. Often individuals set unrealistic goals for themselves: overconfidence bias lack of information 3. Can information provision help individuals: set more realistic goals? achieve higher performance outcomes?
4 This study: information and health goals 1. Study the effect of information provision on goal-setting and performance in the domain of health. 2. Field experiment w/ participants in a weight loss challenge: 8-week program with weekly weigh-ins Participants are NYU staff and faculty members Data from the 2015 challenge - 5th edition 3. Focus on health goals: weight loss and exercise Very popular goals The goal of 42% (16%) of contracts entered on stickk.com is to lose weight (exercise regularly).
5 Dataset (1) 1. Conducted a two-part online study: First survey administered in week 1 Follow-up survey administered at the end of week 4 2. Weekly weight loss recorded separately at a private gym: 9 weigh-ins organized (initial + 8 follow-up) weight measured on same day each week 3. Sample size: 257 participants in the challenge 176 enrolled in the study; 160 completed it. Final sample: 148 participants w/ available weight data.
6 Dataset (2) Sample characteristics: On average, 35 y.o. and 80% female. 45% are returning participants. Average starting weight: 169 lbs for females (US ref: 166 lbs) and 212 lbs for males (US ref: 196 lbs) BM: 28.5 for females and 30.2 for males. ref: normal, overweight, > 30 obese. 60% had a gym membership at the time of the challenge. Slightly over 50% exercise at least twice a week but 27% exercise less than once.
7 Road Map 1. Can goals be shaped by information? Are goal-setters responsive to information? s the effect domain-specific? 2. Can information help individuals achieve their goals? Overall impact on weight loss mpact on weight loss trajectory Goal achievement
8 Goal formation and information (1) Participants asked whether they wanted to set themselves a weight loss (exercise) goal for their internal motivation: weight loss: number of lbs to lose over the challenge (8 weeks) exercise: number of gym visits (first 4 weeks) purely intrinsic motivation; no incentives Two conditions: No nfo: Participants set their goals without guidance. nfo: Participants are told the choices and success rates of participants in the previous year.
9 Goal formation and information (2) On average, participants wanted to lose 14 pounds but managed to lose only 3 to 4 pounds over the eight week period. Overall, less than 3% of the participants who wanted to lose weight achieved their weight loss goal. On average, participants wanted to exercise at the gym about 13 times during the free month membership, but ended up exercising only about 6 times. Among those who indicated their interest in attending the gym, only 18% achieved their goal.
10 Effect of information on goal-setting
11 Table: Mean (std) of basic characteristics by nfo condition nformation No nformation p-value Panel A: Socio-demographic variables female (0.047) (0.046) age (1.169) (1.138) years of education (0.342) (0.333) yearly income 65, , (2, ) (2, ) Panel B: Challenge-related variables previous participant (0.059) (0.057) # of weigh-ins attended (0.299) (0.291) member of non-partner gym (0.059) (0.058) intends to increase exercise (0.050) (0.048) Panel C: Current weight status and goals initial weight (4.801) (4.673) initial BM (0.668) (0.650) satisfaction with current weight (0.162) (0.158) ideal weight loss (2.669) (2.899)

12 mpact of information on weight loss goals (1)
13 mpact of information on weight loss goals (2) Table: Distribution of weight loss goals by information condition weight loss goal w in lbs % of respondents (N) test diff =0 Goal number No nfo nfo p-value w < (17) 40.3 (29) w = (25) 26.4 (19) w > (34) 33.3 (24) Total (76) (72) mean goal Note: p-values from t-tests for each category and a 2 -test on all 3 categories.

14 mpact of information on weight loss goals (3)
15 mpact of information on weight loss goals (4) Table: Distribution of % weight loss goals by information condition weight loss goal pw as % of initial weight % of respondents (N) test diff =0 % goal No nfo nfo p-value pw apple (23) 34.7 (25) pw 2 (5, 8) 32.9 (25) 45.8 (33) pw (28) 19.4 (14) Total (76) (72) mean goal Note: p-values from t-tests for each category and a 2 -test on all 3 categories.

16 mpact of information on exercise goals (1)
17 mpact of information on exercise goals (2) Table: Distribution of exercise goals by information condition exercise goal g (in gym visits) % of respondents (N) test diff =0 Goal number No nfo nfo p-value g < (39) 52.8 (38) g = (10) 15.3 (11) g > (27) 31.9 (23) Total (76) (72) mean goal Note: p-values from t-tests for each category and a 2 -test on all 3 categories.
18 Determinants of goal setting: regression analysis absolute weight loss w relative weight loss p w number of gym visits g (1) (2) (3) (4) (5) (6) nfo -1.61* -1.64* -1.01** -1.03** (0.85) (0.86) (0.44) (0.44) (0.96) (1.00) initial weight w *** 0.06** (0.02) (0.02) (0.01) (0.01) (0.03) satisfaction w/ current weight -0.64* ** -0.36* 0.15 (0.35) (0.36) (0.18) (0.18) (0.42) ideal weight loss (0.03) (0.04) (0.01) (0.02) (0.04) member of non-partner gym ** -3.30*** -3.04*** (0.87) (0.44) (0.97) (1.00) intends to increase exercise 2.32** 1.41*** 1.99* 2.62** (1.04) (0.53) (1.16) (1.21) female (1.51) (0.77) (1.75) age (0.06) (0.03) (0.07) years of education (0.16) (0.08) (0.19) yearly income (0.03) (0.01) (0.03) returning participant (0.85) (0.43) (0.98) Observations R
19 Why a differential impact of information on weight loss and exercise? exercise goal: process-oriented goal weight loss: outcome-oriented goal Outcome-oriented goals are harder to evaluate: ) involve more uncertainty ) mapping between process and outcome is abstract Sensitivity of weight loss goals to information due to uncertainty about what is an achievable target.
20 Effect of information on weight loss outcomes
21 Weigh-in attendance data (1) 1. Despite some attrition, pretty good weight loss data: Graphs Almost 50% attended 7 or 8 weigh-ins. Less than 25% attended less than half of the weigh-ins (0-3). Halfway (final) weight recorded for 73% (57%) of participants. 2. No differential attrition across information conditions: Graphs Average # of weights recorded: 5.2 in No info and 5.7 in nfo (p-value = 0.28) 3. Assumptions on attrited sample: Data Zero weight loss imputed when final weight missing. Reasonable assumption: participants with fewer weights recorded tend to lose less weight at week 4 and 8. Average weekly weight loss computed when intermediate weight missing.
22 Weight loss outcomes Outcomes of interest: 1. cumulative weight loss 4w t 2 [ w, w] in lbs at week t 2 {4, 8} 2. % who lost, gained and maintained stable weight: weight loss: 4wt 1lbs weight stability: 4w t 2 ( 1, 1) lbs weight gain: 4w t apple 1lbs 3. % of goal reached: 4wt w 100
23 Weight loss statistics (1) Table: Mean (std) of weight loss measures week 4 week 8 outcome measures full sample restricted sample* full sample restricted sample weight loss w t in lbs 2.9 (3.5) 3.5 (3.6) 3.1 (4.2) 3.8 (4.1) % who lost weight 68.2 (46.7) 77.8 (41.8) 63.5 (48.3) 75.0 (43.6) % of goal reached 25.9 (36.6) 33.6 (36.9) 27.5 (45.0) 38.3 (51.8) N *Restrictedsamplereferstothepeoplewhoseweightwasrecordedduringweekt. ** N = 145 for full sample and N = 105 (82) for restricted sample at week 4 (8).

24 Weight loss statistics (2) Figure: Distribution of weight loss at week 8 (full sample)

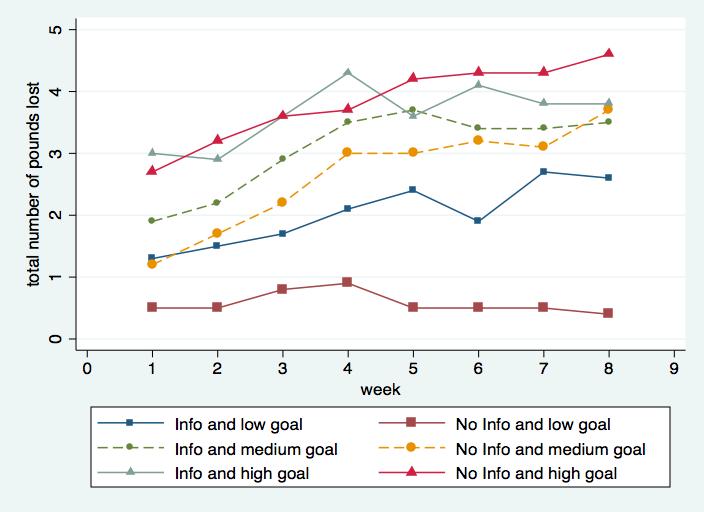
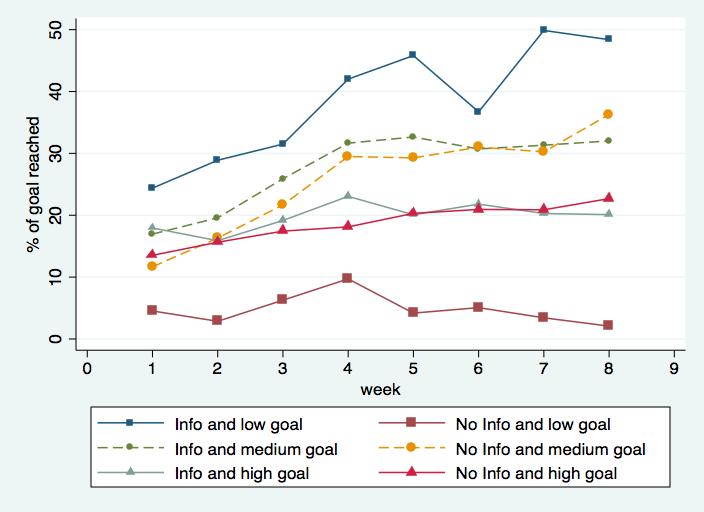
25 Weight loss by information condition (1)
26 Weight loss by information condition (2) weight loss w t (in lbs) % of goal reached 4wt w 100 t = 4 t = 8 t = 4 t = 8 (1) (2) (3) (4) (5) (6) (7) (8) nfo 1.03* 0.99* ** 13.61** 13.28* 14.87** (0.56) (0.54) (0.68) (0.67) (6.08) (5.96) (7.55) (7.49) weight loss goal pw 0.31*** 0.35*** 0.37*** 0.42*** (0.10) (0.10) (0.13) (0.12) (1.18) (1.14) (1.46) (1.43) initial weight w ** (0.01) (0.01) (0.01) (0.01) (0.08) (0.09) (0.10) (0.11) female -1.91** -1.75* ** (0.77) (0.96) (8.42) (10.59) age (0.04) (0.05) (0.40) (0.51) years of education -0.25** * (0.10) (0.13) (1.12) (1.41) yearly income (0.017) (0.021) (0.19) (0.24) returning participant (0.53) (0.66) (5.89) (7.40) exercise frequency 0.09*** 0.13*** 1.18*** 1.47*** (0.03) (0.04) (0.38) (0.48) Observations R
27 Weight loss by information condition (3) Lost weight: P { w t 1} Gained weight: P{ w t apple 1} t = 4 t = 8 t = 4 t = 8 (1) (2) (3) (4) (5) (6) (7) (8) nfo 0.196*** 0.207*** 0.140* 0.164** ** ** * ** (0.073) (0.073) (0.076) (0.078) (0.035) (0.030) (0.037) (0.034) weight loss goal pw 0.032** 0.036** 0.048** 0.057** ** ** *** *** (0.014) (0.014) (0.015) (0.015) (0.006) (0.005) (0.008) (0.007) initial weight w (0.001) (0.001) (0.001) (0.001) (0.0004) (0.0004) (0.0005) (0.0005) female *** *** (0.081) (0.104) (0.025) (0.034) age 0.009* (0.006) (0.006) (0.002) (0.002) years of education ** ** (0.014) (0.015) (0.005) (0.006) yearly income (0.003) (0.003) (0.001) (0.001) returning participant * * (0.075) (0.078) (0.028) (0.035) exercise frequency 0.012** 0.017*** ** *** (0.005) (0.005) (0.002) (0.002) Observations Mean dependent variable Nb: Ordered probit models of the propensity to lose (=1), maintain (=0) or gain (= -1) weight. Coefficients are marginal effects evaluated at the mean of the covariates.
28 Weight loss by information condition: summary 1. Overall, participants in nfo do better than in No nfo: Controlling for p w,weightlossatweek4is1lbshigherinnfo. Controlling for p w, participants in nfo reach a higher % of their goal both at week 4 & 8. They are also more (less) likely to lose (gain) at least 1lbs. 2. However the benefits of information vanish over time: No effect of nfo on total weight loss at week 8. Weaker effect on probability to lose/gain weight at week nterestingly, there is heterogeneity in the effect of information depending on the goal level: Low (p w apple 5%), Medium (p w 2 (5%, 8%)), High (p w 8%)
29 Heterogeneity (1)
30 Heterogeneity (2)
31 Heterogeneity (3) weight loss w t (in lbs) % of goal reached 4wt w 100 t = 4 t = 8 t = 4 t = 8 (1) (2) (3) (4) (5) (6) (7) (8) nfo 1.63* 1.67* 2.50** 2.55** 33.29*** 34.35*** 46.30*** 48.78*** (0.98) (0.95) (1.18) (1.17) (10.76) (10.38) (13.14) (12.84) medium goal pw,m 2.25** 2.10** 3.47*** 3.23*** 20.44* 17.84* 34.18*** 31.24** (0.97) (0.93) (1.17) (1.15) (10.38) (10.01) (12.68) (12.38) high goal pw,h 2.51*** 2.68*** 4.00*** 4.02*** * 21.50* (0.95) (0.93) (1.14) (1.15) (10.12) (9.98) (12.36) (12.34) pw,m nfo * -2.95* ** ** *** *** (1.33) (1.30) (1.60) (1.61) (14.40) (14.09) (17.59) (17.44) pw,h nfo * * ** ** (1.47) (1.45) (1.77) (1.78) (15.90) (15.61) (19.42) (19.31) initial weight w ** 0.014* 0.015* (0.007) (0.008) (0.009) (0.010) (0.077) (0.089) (0.094) (0.110) additional controls No Yes No Yes No Yes No Yes Observations R Nb: p w,m (p w,h )isanindicatorvariable=1iftheparticipant sgoalp w lies between 5% and 8% (above 8%) of his initial weight w 0.
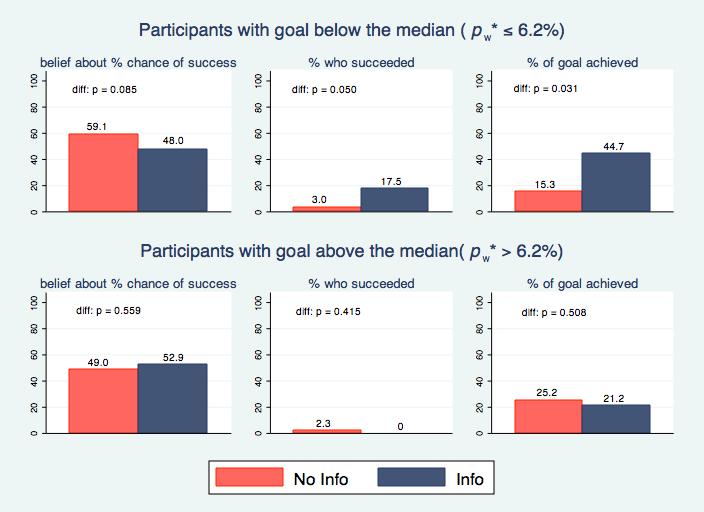
32 nterpretation (1) 1. Participants who set low goals in nfo are different from those in No nfo: nfo: lower goal set as a result of more realistic beliefs about chances of success No nfo: goal perceived as a limited tool of self-regulation (for instance because of low self-control) 2. Among those who set higher goals, overconfidence may have overridden the positive effect of information: Overconfident individuals may consider that statistics about the average participant do not apply to them. Therefore they will discard the information and behave like people in the No nfo treatment.
33 nterpretation (2)
34 Theoretical analysis Analysis based on Koch and Nafziger (2015) Key insight: Goals act as a reference point and deviations from the reference point are painful. Two key ingredients: 1. Reference-dependent utility with goals acting as the reference point. 2. Present-biased preferences generating intertemporal conflict. ) Goals = internal commitment mechanism to provide effort to lose weight
35 Model (1): Decisions Three-period model: t 2 {0, 1, 2} t = 0 : the agent sets effort goal e 2 [0, E]. No payoffs. t = 1 : the agent chooses effort level e with cost c(e). t = 2 : the agent loses weight w(e) with prob p 2 (0, 1) and 0 o.w. Assumptions: c 0 (e) > 0, c 00 (e) 0, w 0 (e) > 0, w 00 (e) < 0, w(0) =c(0) =0 w 0 (0) c 0 (0) > 0andlim e!e w 0 (e) c 0 (e) < 0
36 Model (2): Reference-dependent utility The instantaneous utility at t of effort e given goal e is given by u t (e e )=m t (e)+µ(m t (e) m t (e )) where m t (.) is the material payoff received at t and µ(.) reference-dependent utility (Köszegi & Rabin 2006): ( if > 0 µ( )= if apple 0 is the where 0=weightattachedtoreference-dependentcomponent and > 1=degreeoflossaversionoftheagent
37 Model (3): Reference-dependent utility (cont d) At t = 1, effort level e and goal e yield reference utility: ( µ(c(e) c(e [c(e ) c(e)] if c(e) < c(e ) )) = [c(e ) c(e)] if c(e) c(e ) At t = 2, goal e induces a reference lottery for the benefits L(e ):=(p w(e ); (1 p) 0) and the agent evaluates the outcome of the lottery L(e) :=(p w(e); (1 p) 0) against each possible realization of the reference lottery.
38 Model (4): Reference-dependent utility (cont d) Therefore µ(l(e) L(e )) = p 2 µ(w(e) w(e )) + p(1 p) (0 w(e )) + p(1 p) (w(e) 0)+ (1 p) 2 0 where µ(w(e) w(e )) = ( [w(e) w(e )] if w(e) > w(e ) [w(e) w(e )] if w(e) apple w(e )
39 Model (5): Present bias in effort The agent has a present bias 2 (0, 1) (Cf Laibson 1997) The expected utility of self t is: U t (e e )=u t (e e )+ 2X =t+1 u (e e ) Since m 0 = 0, m 1 (e) = c(e) and m 2 (e) =pw(e), self 0 weighs all payoff-relevant periods equally. However, self 1 discounts expected benefits by. As a result, e 1 < e 0 where e t = argmax e U t (e e )
40 Model (6): nformation When setting a goal e at t = 0, the agent overestimates his likelihood of success: p 2 (p, 1) At t = 1, before choosing e, the agent perfectly learns about the mapping between effort and weight loss p = p. nformation at t = 0aboutpastsuccessratescanshift downward the agent s perceived probability of success: p < p apple p N Downward shift only occurs if information about others past performance is considered as an informative signal for oneself.
41 Model (7): Predictions Problem solved by backward induction, starting with the optimal effort choice e of self 1 given goal e. t can be shown that the optimal goal e is a weakly increasing function of p and. Since p N p, the model predicts that: 1. Participants in No nfo set (weakly) more ambitious goals. 2. To counteract the effect of p N, those who set low goals in No nfo must have a lower (assuming is fixed). 3. Since participants in No nfo have more overoptimistic beliefs ( p p), they deviate from the goal more often than in nfo.
42 Conclusion Goal-setting = key instrument of self-regulation. However, effective instrument only if there is minimum knowledge about what is an appropriate target. nformation about others past performance may improve goal-setting and performance. The positive effect might be mitigated by an individual s overconfidence about his likelihood of success.
43 Additional data and robustness analysis

44 Weigh-in attendance data (2) Go back

45 Weigh-in attendance data (3) Go back
46 Weigh-in attendance data (4) Table: Relationship between weight loss and attendance Go back 4-week weight loss w 4 8-week weight loss w 8 (1) (2) (3) (4) # weights recorded t=4 1.15** (0.47) first 4 weights recorded 1.58** (0.72) # weights recorded t= (0.42) 7or8weightsrecorded 2.01* (1.10) constant *** ** (1.69) (0.59) (3.07) (0.98) Observations R Note: #weightsrecorded t=j refers to the number of weights recorded up to week j; weight loss is measured in lbs, with w t < 0 measuring weight gain.
47 Regressions on restricted sample (1) weight loss w t (in lbs) % of goal reached 4wt w 100 t = 4 t = 8 t = 4 t = 8 (1) (2) (3) (4) (5) (6) (7) (8) nfo 1.27* ** 13.38** (0.67) (0.67) (0.90) (0.93) (7.00) (7.07) (11.40) (11.77) weight loss goal pw 0.37*** 0.37*** 0.32* 0.30* -2.58* -2.51* (0.13) (0.12) (0.18) (0.17) (1.38) (1.35) (2.41) (2.32) initial weight w (0.008) (0.01) (0.01) (0.01) (0.09) (0.11) (0.13) (0.16) female -2.75*** *** (0.96) (1.27) (10.04) (16.12) age (0.05) (0.06) (0.54) (0.80) years of education -0.23* (0.13) (0.18) (1.37) (2.23) yearly income (0.02) (0.03) (0.23) (0.37) returning participant *** *** (0.66) (0.95) (7.03) (12.34) exercise frequency *** *** (0.04) (0.05) (0.43) (0.75) Observations R
48 Regressions on restricted sample (2) Lost weight: P{ w t 1} Gained weight: P{ w t apple 1} t = 4 t = 8 t = 4 t = 8 (1) (2) (3) (4) (5) (6) (7) (8) nfo 0.211*** 0.175** ** ** (0.074) (0.071) (0.092) (0.093) (0.040) (0.033) (0.047) (0.034) weight loss goal pw 0.032** 0.024* 0.064*** 0.056*** ** *** ** (0.014) (0.013) (0.020) (0.019) (0.007) (0.006) (0.011) (0.009) initial weight w (0.001) (0.001) (0.001) (0.001) (0.0004) (0.0004) (0.0005) (0.0004) female *** ** (0.060) (0.105) (0.028) (0.033) age (0.007) (0.007) (0.002) (0.002) years of education (0.014) (0.021) (0.006) (0.008) yearly income (0.003) (0.003) (0.001) (0.001) returning participant *** ** (0.075) (0.105) (0.030) (0.061) exercise frequency *** ** (0.004) (0.006) (0.002) (0.003) Observations Mean dependent variable Nb: Ordered probit models of the propensity to lose (=1), maintain (=0) or gain (= -1) weight. Coefficients are marginal effects evaluated at the mean of the covariates.
49 Regressions on restricted sample (3) weight loss w t (in lbs) % of goal reached 4wt w 100 t = 4 t = 8 t = 4 t = 8 (1) (2) (3) (4) (5) (6) (7) (8) nfo 2.21* ** *** 44.94*** 71.17*** 51.01** (1.22) (1.21) (1.54) (1.64) (12.71) (12.50) (19.56) (20.43) medium goal pw,m 2.17* *** 3.52** ** (1.14) (1.11) (1.53) (1.58) (11.25) (11.02) (18.88) (19.53) high goal pw,h 2.72** 2.40** 4.00** 2.79* (1.16) (1.17) (1.58) (1.65) (11.50) (11.55) (19.46) (20.38) pw,m nfo ** -3.93* *** *** *** *** (1.60) (1.59) (2.05) (2.11) (16.29) (16.18) (25.65) (26.14) pw,h nfo ** ** (1.83) (1.86) (2.36) (2.53) (18.49) (18.74) (29.43) (31.30) initial weight w (0.01) (0.01) (0.01) (0.01) (0.08) (0.10) (0.13) (0.16) additional controls No Yes No Yes No Yes No Yes Observations R Nb: pw,m (p w,h )isanindicatorvariable=1iftheparticipant sgoalp w lies between 5% and 8% (above 8%) of his initial weight w 0.
Connecting commitment to self-control: Evidence from a field experiment with participants in a weight loss challenge
 Connecting commitment to self-control: Evidence from a field experiment with participants in a weight loss challenge Séverine Toussaert (NYU) August 27, 2014 ntroduction (1): Theoretical Literature Rapid
Identity, Homophily and In-Group Bias: Experimental Evidence
 Identity, Homophily and In-Group Bias: Experimental Evidence Friederike Mengel & Sergio Currarini Univeersity of Nottingham Universita Ca Foscari and FEEM, Venice FEEM, March 2012 In-Group Bias Experimental
Food Labels and Weight Loss:
 Food Labels and Weight Loss: Evidence from the National Longitudinal Survey of Youth Bidisha Mandal Washington State University AAEA 08, Orlando Motivation Who reads nutrition labels? Any link with body
Chapter 1 Making Personal Wellness Choices
 Chapter 1 Making Personal Wellness Choices 1.1 Multiple Choice 1) Wellness is defined as A) the absence of disease. B) the highest level of fitness. C) the optimal soundness of body and mind. D) the ability
Classical Psychophysical Methods (cont.)
") Classical Psychophysical Methods (cont.) 1 Outline Method of Adjustment Method of Limits Method of Constant Stimuli Probit Analysis 2 Method of Constant Stimuli A set of equally spaced levels of the stimulus
Classical Psychophysical Methods (cont.) 1 Outline Method of Adjustment Method of Limits Method of Constant Stimuli Probit Analysis 2 Method of Constant Stimuli A set of equally spaced levels of the stimulus
A Brief Introduction to Bayesian Statistics
 A Brief Introduction to Statistics David Kaplan Department of Educational Psychology Methods for Social Policy Research and, Washington, DC 2017 1 / 37 The Reverend Thomas Bayes, 1701 1761 2 / 37 Pierre-Simon
Module 14: Missing Data Concepts
 Module 14: Missing Data Concepts Jonathan Bartlett & James Carpenter London School of Hygiene & Tropical Medicine Supported by ESRC grant RES 189-25-0103 and MRC grant G0900724 Pre-requisites Module 3
Introduction to Behavioral Economics Like the subject matter of behavioral economics, this course is divided into two parts:
 Economics 142: Behavioral Economics Spring 2008 Vincent Crawford (with very large debts to Colin Camerer of Caltech, David Laibson of Harvard, and especially Botond Koszegi and Matthew Rabin of UC Berkeley)
Behavioural Economics University of Oxford Vincent P. Crawford Michaelmas Term 2012
 Behavioural Economics University of Oxford Vincent P. Crawford Michaelmas Term 2012 Introduction to Behavioral Economics and Decision Theory (with very large debts to David Laibson and Matthew Rabin) Revised
Connecting commitment to self-control problems: Evidence from a weight loss challenge
 Connecting commitment to self-control problems: Evidence from a weight loss challenge Séverine Toussaert New York University March, 2016 Abstract In the context of a weight loss challenge, I use the menu
Achievement: Approach versus Avoidance Motivation
 LP 11E Achievement motivation 1 Achievement: Approach versus Avoidance Motivation Approach motivation: A motivation to experience positive outcomes Avoidance motivation: A motivation not to experience
Methods for Addressing Selection Bias in Observational Studies
 Methods for Addressing Selection Bias in Observational Studies Susan L. Ettner, Ph.D. Professor Division of General Internal Medicine and Health Services Research, UCLA What is Selection Bias? In the regression
Instrumental Variables I (cont.)
") Review Instrumental Variables Observational Studies Cross Sectional Regressions Omitted Variables, Reverse causation Randomized Control Trials Difference in Difference Time invariant omitted variables
Review Instrumental Variables Observational Studies Cross Sectional Regressions Omitted Variables, Reverse causation Randomized Control Trials Difference in Difference Time invariant omitted variables
Explaining Bargaining Impasse: The Role of Self-Serving Biases
 Explaining Bargaining Impasse: The Role of Self-Serving Biases Linda Babcock and George Loewenstein Journal of Economic Perspectives, 1997 報告人 : 高培儒 20091028 1 1. Introduction Economists, and more specifically
The Impact of Learning HIV Status on Marital Stability and Sexual Behavior within Marriage in Malawi
 The Impact of Learning HIV Status on Marital Stability and Sexual Behavior within Marriage in Malawi Theresa Marie Fedor Hans-Peter Kohler Jere R. Behrman March 30, 2012 Abstract This paper assesses how
Analysis of Confidence Rating Pilot Data: Executive Summary for the UKCAT Board
 Analysis of Confidence Rating Pilot Data: Executive Summary for the UKCAT Board Paul Tiffin & Lewis Paton University of York Background Self-confidence may be the best non-cognitive predictor of future
Gender specific attitudes towards risk and ambiguity an experimental investigation
 Research Collection Working Paper Gender specific attitudes towards risk and ambiguity an experimental investigation Author(s): Schubert, Renate; Gysler, Matthias; Brown, Martin; Brachinger, Hans Wolfgang
Regression Discontinuity Analysis
 Regression Discontinuity Analysis A researcher wants to determine whether tutoring underachieving middle school students improves their math grades. Another wonders whether providing financial aid to low-income
Detecting Anomalous Patterns of Care Using Health Insurance Claims
 Partially funded by National Science Foundation grants IIS-0916345, IIS-0911032, and IIS-0953330, and funding from Disruptive Health Technology Institute. We are also grateful to Highmark Health for providing
MMI 409 Spring 2009 Final Examination Gordon Bleil. 1. Is there a difference in depression as a function of group and drug?
 MMI 409 Spring 2009 Final Examination Gordon Bleil Table of Contents Research Scenario and General Assumptions Questions for Dataset (Questions are hyperlinked to detailed answers) 1. Is there a difference
The effects of providing fixed compensation and lottery-based rewards on uptake of medical male circumcision: a randomized trial
 The effects of providing fixed compensation and lottery-based rewards on uptake of medical male circumcision: a randomized trial Harsha Thirumurthy (UNC) Sam Masters (UNC) Joshua Graff Zivin (UCSD) Kawango
Glossary From Running Randomized Evaluations: A Practical Guide, by Rachel Glennerster and Kudzai Takavarasha
 Glossary From Running Randomized Evaluations: A Practical Guide, by Rachel Glennerster and Kudzai Takavarasha attrition: When data are missing because we are unable to measure the outcomes of some of the
Cancer survivorship and labor market attachments: Evidence from MEPS data
 Cancer survivorship and labor market attachments: Evidence from 2008-2014 MEPS data University of Memphis, Department of Economics January 7, 2018 Presentation outline Motivation and previous literature
A Multilevel Approach to Model Weight Gain: Evidence from NLSY79 Panel
 A Multilevel Approach to Model Weight Gain: Evidence from NLSY79 Panel Bidisha Mandal Washington State University bmandal@wsu.edu Obesity Trends* Among U.S. Adults BRFSS, 1985 (*BMI 30, or ~ 30 lbs. overweight
Ancestral Weight Loss Registry Demographics and Preliminary Results Through February 2012
 Ancestral Weight Loss Registry Demographics and Preliminary Results Through February 2012 Below is the first summary of a portion of the Ancestral Weight Loss Registry data. Data from 48 states and 12
Bayesian graphical models for combining multiple data sources, with applications in environmental epidemiology
 Bayesian graphical models for combining multiple data sources, with applications in environmental epidemiology Sylvia Richardson 1 sylvia.richardson@imperial.co.uk Joint work with: Alexina Mason 1, Lawrence
EXERCISE: HOW TO DO POWER CALCULATIONS IN OPTIMAL DESIGN SOFTWARE
 ...... EXERCISE: HOW TO DO POWER CALCULATIONS IN OPTIMAL DESIGN SOFTWARE TABLE OF CONTENTS 73TKey Vocabulary37T... 1 73TIntroduction37T... 73TUsing the Optimal Design Software37T... 73TEstimating Sample
Wishful thinking in willful blindness
 Wishful thinking in willful blindness Homayoon Moradi 1 Alexander Nesterov 2 1 WZB Berlin Social Science Center 2 Higher School of Economics, St.Petersburg WZB Job market presentation practice People often
An Economic Model of the Planning Fallacy
 An Economic Model of the Planning Fallacy Markus K. Brunnermeier 1, Filippos Papakonstantinou 2 and Jonathan A. Parker 3 1 Princeton University 2 Imperial College 3 Northwestern University Cornell University
What Are Your Odds? : An Interactive Web Application to Visualize Health Outcomes
 What Are Your Odds? : An Interactive Web Application to Visualize Health Outcomes Abstract Spreading health knowledge and promoting healthy behavior can impact the lives of many people. Our project aims
SELECTED FACTORS LEADING TO THE TRANSMISSION OF FEMALE GENITAL MUTILATION ACROSS GENERATIONS: QUANTITATIVE ANALYSIS FOR SIX AFRICAN COUNTRIES
 Public Disclosure Authorized Public Disclosure Authorized Public Disclosure Authorized Public Disclosure Authorized ENDING VIOLENCE AGAINST WOMEN AND GIRLS SELECTED FACTORS LEADING TO THE TRANSMISSION
Assessing Studies Based on Multiple Regression. Chapter 7. Michael Ash CPPA
 Assessing Studies Based on Multiple Regression Chapter 7 Michael Ash CPPA Assessing Regression Studies p.1/20 Course notes Last time External Validity Internal Validity Omitted Variable Bias Misspecified
Instrumental Variables Estimation: An Introduction
 Instrumental Variables Estimation: An Introduction Susan L. Ettner, Ph.D. Professor Division of General Internal Medicine and Health Services Research, UCLA The Problem The Problem Suppose you wish to
Do Women Shy Away from Competition? Do Men Compete too Much?
 This work is distributed as a Discussion Paper by the STANFORD INSTITUTE FOR ECONOMIC POLICY RESEARCH SIEPR Discussion Paper No. 04-30 Do Women Shy Away from Competition? Do Men Compete too Much? By Muriel
ACE Personal Trainer Manual, 4 th edition. Chapter 2: Principles of Adherence and Motivation
 ACE Personal Trainer Manual, 4 th edition Chapter 2: Principles of Adherence and Motivation 1 Learning Objectives Based on Chapter 2 of the ACE Personal Trainer Manual, 4 th ed., this session describes
The Impact of Relative Standards on the Propensity to Disclose. Alessandro Acquisti, Leslie K. John, George Loewenstein WEB APPENDIX
 The Impact of Relative Standards on the Propensity to Disclose Alessandro Acquisti, Leslie K. John, George Loewenstein WEB APPENDIX 2 Web Appendix A: Panel data estimation approach As noted in the main
NEW!!!! *Fill out CTF forms online * CTF New Membership CTF Membership Renewal USTL Register online through 10/15 at the pre-registration prices.
 Volume 22 Issue 10 October 2016 Inside this issue: A person with self-control is able to motivate themselves to do those things that are right because they want to do what is right, not because someone
Citation for published version (APA): Ebbes, P. (2004). Latent instrumental variables: a new approach to solve for endogeneity s.n.
: Ebbes, P. (2004). Latent instrumental variables: a new approach to solve for endogeneity s.n.") University of Groningen Latent instrumental variables Ebbes, P. IMPORTANT NOTE: You are advised to consult the publisher's version (publisher's PDF) if you wish to cite from it. Please check the document
University of Groningen Latent instrumental variables Ebbes, P. IMPORTANT NOTE: You are advised to consult the publisher's version (publisher's PDF) if you wish to cite from it. Please check the document
Delfini Evidence Tool Kit
 General 1. Who is sponsoring and funding the study? What are the affiliations of the authors? Study Design Assessment Internal Validity Assessment Considerations: This can be helpful information and is
Do Danes and Italians rate life satisfaction in the same way?
 Do Danes and Italians rate life satisfaction in the same way? Using vignettes to correct for individual-specific scale biases Viola Angelini 1 Danilo Cavapozzi 2 Luca Corazzini 2 Omar Paccagnella 2 1 University
Checklist for Randomized Controlled Trials. The Joanna Briggs Institute Critical Appraisal tools for use in JBI Systematic Reviews
 The Joanna Briggs Institute Critical Appraisal tools for use in JBI Systematic Reviews Checklist for Randomized Controlled Trials http://joannabriggs.org/research/critical-appraisal-tools.html www.joannabriggs.org
Iron Viking of the North Weight Loss Challenge
 2013 NPC Iron Viking of the North Weight Loss Challenge www.facebook.com/ironvikingofthenorth.com www.ironvikingofthenorth.com Start Date: February 8th 2013 Purpose: To provide a framework of fun and friendly
Introduction to Machine Learning. Katherine Heller Deep Learning Summer School 2018
 Introduction to Machine Learning Katherine Heller Deep Learning Summer School 2018 Outline Kinds of machine learning Linear regression Regularization Bayesian methods Logistic Regression Why we do this
Consistent with trends in other countries,1,2 the
 9 Trends in weight change among Canadian adults Heather M. Orpana, Mark S. Tremblay and Philippe Finès Abstract Objectives Longitudinal analyses were used to examine the rate of change of self-reported
Estimands, Missing Data and Sensitivity Analysis: some overview remarks. Roderick Little
 Estimands, Missing Data and Sensitivity Analysis: some overview remarks Roderick Little NRC Panel s Charge To prepare a report with recommendations that would be useful for USFDA's development of guidance
Alcohol and Self-Control
 Alcohol and Self-Control A Field Experiment in India Frank Schilbach MIT October 16, 2015 1 / 35 Alcohol consumption among the poor Heavy drinking is common among low-income males in developing countries.
Best on the Left or on the Right in a Likert Scale
 Best on the Left or on the Right in a Likert Scale Overview In an informal poll of 150 educated research professionals attending the 2009 Sawtooth Conference, 100% of those who voted raised their hands
Preview from Notesale.co.uk Page 23 of 50
 Page 23 of 50 Study 1: sales tax of toiletries in department store Design - DDD: triple difference estimator - compared the within-treatment-store" DiD estimator DD(TS) to a within-control-store" DiD estimator
Reliability and Validity
 Reliability and Today s Objectives Understand the difference between reliability and validity Understand how to develop valid indicators of a concept Reliability and Reliability How accurate or consistent
The Economics of tobacco and other addictive goods Hurley, pp
 s of The s of tobacco and other Hurley, pp150 153. Chris Auld s 318 March 27, 2013 s of reduction in 1994. An interesting observation from Tables 1 and 3 is that the provinces of Newfoundland and British
The Essential Role of Pair Matching in. Cluster-Randomized Experiments. with Application to the Mexican Universal Health Insurance Evaluation
 The Essential Role of Pair Matching in Cluster-Randomized Experiments, with Application to the Mexican Universal Health Insurance Evaluation Kosuke Imai Princeton University Gary King Clayton Nall Harvard
SUPPLEMENTARY INFORMATION
 Supplementary Statistics and Results This file contains supplementary statistical information and a discussion of the interpretation of the belief effect on the basis of additional data. We also present
Measures of Association
 Measures of Association Lakkana Thaikruea M.D., M.S., Ph.D. Community Medicine Department, Faculty of Medicine, Chiang Mai University, Thailand Introduction One of epidemiological studies goal is to determine
Beliefs and Utility - Experimental Evidence on Preferences for Information
 Beliefs and Utility - Experimental Evidence on Preferences for Information Armin Falk - briq and University of Bonn (joint with Florian Zimmermann) June 2017 - Belief Based Utility Conference, CMU Introduction
References. Christos A. Ioannou 2/37
 Prospect Theory References Tversky, A., and D. Kahneman: Judgement under Uncertainty: Heuristics and Biases, Science, 185 (1974), 1124-1131. Tversky, A., and D. Kahneman: Prospect Theory: An Analysis of
The RoB 2.0 tool (individually randomized, cross-over trials)
") The RoB 2.0 tool (individually randomized, cross-over trials) Study design Randomized parallel group trial Cluster-randomized trial Randomized cross-over or other matched design Specify which outcome is
The RoB 2.0 tool (individually randomized, cross-over trials) Study design Randomized parallel group trial Cluster-randomized trial Randomized cross-over or other matched design Specify which outcome is
Manuscript Presentation: Writing up APIM Results
 Manuscript Presentation: Writing up APIM Results Example Articles Distinguishable Dyads Chung, M. L., Moser, D. K., Lennie, T. A., & Rayens, M. (2009). The effects of depressive symptoms and anxiety on
Supplementary Web Appendix Transactional Sex as a Response to Risk in Western Kenya American Economic Journal: Applied Economics
 Supplementary Web Appendix Transactional Sex as a Response to Risk in Western Kenya American Economic Journal: Applied Economics Jonathan Robinson University of California, Santa Cruz Ethan Yeh y World
MYTHS ABOUT OBESITY. Author: Robert Helán
 MYTHS ABOUT OBESITY Author: Robert Helán Obesity is an issue on which many people hold strong opinions. Many of these opinions might not be based on scientific evidence, giving rise to speculations and
Experimental Political Science and the Study of Causality
 A/541575 Experimental Political Science and the Study of Causality From Nature to the Lab REBECCA B. MORTON New York University KENNETH C. WILLIAMS Michigan State University CAMBRIDGE UNIVERSITY PRESS
Data Summary Report, June 2009
 PEIA Weight Management Program Participant Survey Data Summary Report, June 2009 Completed by Sam Zizzi & Christiaan Abildso for Nidia Henderson WMP Survey Report 1 Table of Contents Section pg# Survey
What can go wrong.and how to fix it!
 What can go wrong.and how to fix it! Megha Pradhan Policy and Training Manager, J-PAL South Asia Kathmandu, Nepal 29 March 2017 Introduction Conception phase is important and allows to design an evaluation
Smoking, weight and outcomes in quitline research. Terry Bush, Laura Beebe, Michele Levine, Clarissa Hsu NAQC 2012 conference in Kansas
 Smoking, weight and outcomes in quitline research Terry Bush, Laura Beebe, Michele Levine, Clarissa Hsu NAQC 2012 conference in Kansas Purpose of Today's Presentation Summarize the literature on smoking,
Vitality Weight Loss Rewards (WLR) Frequently Asked Questions (FAQs)
 Frequently Asked Questions (FAQs)") Vitality Weight Loss Rewards (WLR) Frequently Asked Questions (FAQs) Weight Loss Rewards Body Mass Index Waist circumference Why should I join WLR? Glossary WLR BMI WC Maintaining a healthy weight is essential
Vitality Weight Loss Rewards (WLR) Frequently Asked Questions (FAQs) Weight Loss Rewards Body Mass Index Waist circumference Why should I join WLR? Glossary WLR BMI WC Maintaining a healthy weight is essential
Individual preference heterogeneity, targeting and welfare effects of soda taxes
 Individual preference heterogeneity, targeting and welfare effects of soda taxes Pierre Dubois, Rachel Griffith and Martin O Connell Institute for Fiscal Studies Lisbon, October 2017 1 / 44 Motivation:
Nudges: A new instrument for public policy?
 Nudges: A new instrument for public policy? M.C. Villeval (CNRS, GATE) - Origin: Behavioral Economics BE blends experimental evidence and psychology in a mathematical theory of strategic behavior (Camerer,
Physician Knowledge, Financial Incentives and Treatment Decisions for Depression
 The Journal of Mental Health Policy and Economics J. Mental Health Policy Econ. 1: 89 100 (1998) Physician Knowledge, Financial Incentives and Treatment Decisions for Depression Roland Sturm* and Kenneth
Non-Randomized Trials
 Non-Randomized Trials ADA Research Toolkit ADA Research Committee 2011 American Dietetic Association. This presentation may be used for educational purposes Learning Objectives At the end of this presentation
Bias in regression coefficient estimates when assumptions for handling missing data are violated: a simulation study
 STATISTICAL METHODS Epidemiology Biostatistics and Public Health - 2016, Volume 13, Number 1 Bias in regression coefficient estimates when assumptions for handling missing data are violated: a simulation
Survey Methods in Relationship Research
 Purdue University Purdue e-pubs Department of Psychological Sciences Faculty Publications Department of Psychological Sciences 1-1-2009 Survey Methods in Relationship Research Christopher Agnew Purdue
Do You Know That I Am Biased? An Experiment
 Do You Know That I Am Biased? An Experiment Sandra Ludwig a and Julia Nafziger b a University of Munich b ECARES and Solvay Business School, Université Libre de Bruxelles July 26, 2007 Abstract This experiment
STEVE LANTZ Steve s BMI is 39. Barriers to Effective Obesity Care: Highlights From the ACTION Study
 STEVE LANTZ Steve s BMI is 39 Barriers to Effective Obesity Care: Highlights From the ACTION Study ACTION study Introduction ACTION is the first study to explore the barriers to effective obesity care
Signalling, shame and silence in social learning. Arun Chandrasekhar, Benjamin Golub, He Yang Presented by: Helena, Jasmin, Matt and Eszter
 Signalling, shame and silence in social learning Arun Chandrasekhar, Benjamin Golub, He Yang Presented by: Helena, Jasmin, Matt and Eszter Motivation Asking is an important information channel. But the
Economics Bulletin, 2013, Vol. 33 No. 1 pp
 1. Introduction An often-quoted paper on self-image as the motivation behind a moral action is An economic model of moral motivation by Brekke et al. (2003). The authors built the model in two steps: firstly,
ST440/550: Applied Bayesian Statistics. (10) Frequentist Properties of Bayesian Methods
 Frequentist Properties of Bayesian Methods") (10) Frequentist Properties of Bayesian Methods Calibrated Bayes So far we have discussed Bayesian methods as being separate from the frequentist approach However, in many cases methods with frequentist
(10) Frequentist Properties of Bayesian Methods Calibrated Bayes So far we have discussed Bayesian methods as being separate from the frequentist approach However, in many cases methods with frequentist
Online Appendix A. A1 Ability
 Online Appendix A A1 Ability To exclude the possibility of a gender difference in ability in our sample, we conducted a betweenparticipants test in which we measured ability by asking participants to engage
Econometric analysis and counterfactual studies in the context of IA practices
 Econometric analysis and counterfactual studies in the context of IA practices Giulia Santangelo http://crie.jrc.ec.europa.eu Centre for Research on Impact Evaluation DG EMPL - DG JRC CRIE Centre for Research
Txt4Health: Using Mobile Technology in Public Health Communications and Education Campaigns
 Txt4Health: Using Mobile Technology in Public Health Communications and Education Campaigns Paul Meyer, J.D. and Pamela Johnson, Ph.D. August 2013 Disclosure Commercial Interest What was received? (Salary,
Conducting Strong Quasi-experiments
 Analytic Technical Assistance and Development Conducting Strong Quasi-experiments Version 1 May 2015 This report was prepared for the Institute of Education Sciences (IES) by Decision Information Resources,
Reading and maths skills at age 10 and earnings in later life: a brief analysis using the British Cohort Study
 Reading and maths skills at age 10 and earnings in later life: a brief analysis using the British Cohort Study CAYT Impact Study: REP03 Claire Crawford Jonathan Cribb The Centre for Analysis of Youth Transitions
It is Whether You Win or Lose: The Importance of the Overall Probabilities of Winning or Losing in Risky Choice
 The Journal of Risk and Uncertainty, 30:1; 5 19, 2005 c 2005 Springer Science + Business Media, Inc. Manufactured in The Netherlands. It is Whether You Win or Lose: The Importance of the Overall Probabilities
Time Discounting: Delay Effect and Procrastinating Behavior
 Time Discounting: Delay Effect and Procrastinating Behavior Shunichiro Sasaki 1 (Nagoya University of Commerce and Business) Shiyu Xie 2 (Fudan University) Shinsuke Ikeda 3 (Oasaka University) Jie Qin
The Art of Coaching in Primary Care
 The Art of Coaching in Primary Care By Maureen Ryan DNP, NP, CHWC, CST April 10, 2014 Attendees at this presentation will learn to utilize coaching strategies to facilitate sustainable change leading patients
Modelling Diabetes: A multi-state life table model
 Modelling Diabetes: A multi-state life table model Public Health Intelligence Occasional Bulletin No 9 Published in March 2002 by the Ministry of Health PO Box 5013, Wellington, New Zealand ISBN 0-478-26278-7
What Behaviors Do Behavior Programs Change
 What Behaviors Do Behavior Programs Change Yingjuan (Molly) Du, Dave Hanna, Jean Shelton and Amy Buege, Itron, Inc. ABSTRACT Utilities behavioral programs, such as audits and web-based tools, are designed
Social Preferences of Young Adults in Japan: The Roles of Age and Gender
 Social Preferences of Young Adults in Japan: The Roles of Age and Gender Akihiro Kawase Faculty of Economics, Toyo University, Japan November 26, 2014 E-mail address: kawase@toyo.jp Postal address: Faculty
Bridging the Gap: Predictors of Willingness to Engage in an Intercultural Interaction
 Bridging the Gap: Predictors of Willingness to Engage in an Intercultural Interaction Heather Dudley What influences people s willingness to interact with someone of a different cultural background from
PSA To screen or not to screen? Darrel Drachenberg, MD, FRCSC
 PSA To screen or not to screen? Darrel Drachenberg, MD, FRCSC Disclosures Faculty / Speaker s name: Darrel Drachenberg Relationships with commercial interests: Grants/Research Support: None Speakers Bureau/Honoraria:
Q1. A popular diet book claims that a low-carbohydrate diet results in quicker weight loss and a more healthy body than a low-fat diet.
 Q1. A popular diet book claims that a low-carbohydrate diet results in quicker weight loss and a more healthy body than a low-fat diet. Scientists carried out an investigation to see if this claim is true.
Randomization: Too Important to Gamble with
 Randomization: Too Important to Gamble with A Presentation for the Delaware Chapter of the ASA Oct 18, 2012 Dennis Sweitzer, Ph.D., Principal Biostatistician Medidata Randomization Center of Excellence
Version No. 7 Date: July Please send comments or suggestions on this glossary to
 Impact Evaluation Glossary Version No. 7 Date: July 2012 Please send comments or suggestions on this glossary to 3ie@3ieimpact.org. Recommended citation: 3ie (2012) 3ie impact evaluation glossary. International
DIABETES PREVENTION PROGRAM
 DIABETES PREVENTION PROGRAM The YMCA s Diabetes Prevention Program is a one-year, community-based program where participants work in small groups with a trained Lifestyle Coach in a relaxed, classroom
New evidence from SHARE data. J. Sicsic T. Rapp. Séminaire Modapa, 12 Avril 2018 PRELIMINARY DRAFT. LIRAES, Université Paris Descartes
 New evidence from SHARE data J Sicsic LIRAES, Université Paris Descartes Séminaire Modapa, 12 Avril 2018 PRELIMINARY DRAFT 1/ 29 Motivations Steady rise of health care expenditures (HCE) in GDP concerns
SOME STATISTICS ON WOMEN IN ASTRONOMY. Peter B. Boyce. increase three times that of men. Among young astronomers, approximately one in
 Some Statistics on 65 SOME STATISTICS ON WOMEN IN ASTRONOMY Peter B. Boyce ABSTRACT The number of women in astronomy has doubled in the last decade, a rate of increase three times that of men. Among young
A Strategy for Handling Missing Data in the Longitudinal Study of Young People in England (LSYPE)
") Research Report DCSF-RW086 A Strategy for Handling Missing Data in the Longitudinal Study of Young People in England (LSYPE) Andrea Piesse and Graham Kalton Westat Research Report No DCSF-RW086 A Strategy
Research Report DCSF-RW086 A Strategy for Handling Missing Data in the Longitudinal Study of Young People in England (LSYPE) Andrea Piesse and Graham Kalton Westat Research Report No DCSF-RW086 A Strategy
Risk attitude in decision making: A clash of three approaches
 Risk attitude in decision making: A clash of three approaches Eldad Yechiam (yeldad@tx.technion.ac.il) Faculty of Industrial Engineering and Management, Technion Israel Institute of Technology Haifa, 32000
Applied Quantitative Methods II
 Applied Quantitative Methods II Lecture 7: Endogeneity and IVs Klára Kaĺıšková Klára Kaĺıšková AQM II - Lecture 7 VŠE, SS 2016/17 1 / 36 Outline 1 OLS and the treatment effect 2 OLS and endogeneity 3 Dealing
Exploring the Impact of Missing Data in Multiple Regression
 Exploring the Impact of Missing Data in Multiple Regression Michael G Kenward London School of Hygiene and Tropical Medicine 28th May 2015 1. Introduction In this note we are concerned with the conduct
Fitness Nutrition Systems, LLC
 Define Your Goals Goals: Know what you want Motivation: Why are your goals important to you? On a scale from 1-10, how committed are you? 2 6 Components For Success Your program must includes each of the
Responsibility Effects in Decision Making under Risk
 Julius Pahlke Sebastian Strasser Ferdinand M. Vieider Responsibility Effects in Decision Making under Risk Discussion Paper SP II 2012 402 October 2012 Social Science Research Center Berlin (WZB) Research