HealthStat for Hospitals Guide
|
|
|
- Aron Paul
- 5 years ago
- Views:
Transcription


1 HealthStat for Hospitals Guide 30 JUNE 2010
2 Version History The table below outlines the changes that have been made to the dashboard and as such this latest version of the HealthStat for Hospitals Guide since its initial publication on the internet with January 2009 data. Dashboard Month (Data) January 2009 February 2009 March 2009 April 2009 Metric Changes NONE I7 R8b A3/A4 I3a/b/c/d and I4a/b I4a/b R8b R9b R9c A3b/A4b I4a/b I6 R1 R9b/R10a Details Original Baseline Version of Dashboards and Hospital Guide. Incorporation of the results of the previous Bed Review as a basis by which to determine trend in figures. Change to the use of Patient Visits as basis for assessment instead of Patient Encounters due to variation in interpretations as to what constituted an encounter. Clarification to titles in order to make it clear that referral wait times are those for Outpatients. Trimming of patient data at 2-sigma in order to remove the influence of outliers. Target for Inpatient and Daycase ALOS set by HealthStat to a variance from an absolute target adjusted for age and complexity from previous target based upon Best In Class performance. Scale increased to 250 in order to capture all hospital activity. Number of WTE Radiologists rounded to the nearest integer. Number of patient attendances at Emergency Department included in the denominator in order to more accurately reflect the full patient cohort of the hospital. Traffic Light based on the routine referral wait time for Ultrasound instead of an aggregate Overall calculation. Metrics associated to combined Inpatient and Daycase ALOS removed. Traffic light based on combined target of 60% of patients with a discharge plan and 30% with a discharge date in order to bring discharge date into the assessment. Description of variance as over/under budget instead of +/- to improve clarity of understanding. Real numbers (to 2 decimal places) used for Whole Time Equivalent calculation due to influence of 2
3 May 2009 July 2009 Sept 2009 Nov 2009 Dec 2009 Jan 2010 R10a/b/c None None A2 A5 and A6 I2 and I3c R1 R8b A5, A6, R10a, R10b, R10c R11 R11a A7 I3b All metrics with a traffic light A1a & A1b A2 R1 None 13a/13b rounding. Removal of Other consultant WTE numbers and clinic data from the calculations due to wide variation across hospitals with regards to Other consultant numbers and activity. Incorporation of definitions associated to day procedures in Appendix E. Incorporation of definitions associated to primary diagnosis in Appendix F. The total number of ED admissions in the month is shown numerically at the foot of the metric to provide additional context for the wait time numbers. Switching of order of metrics (A5 now Average Wait Time and A6 Percentage of Clinics) and removal of traffic light on A6. Removal of Obstetrics from Chart and Overall Figure. Change from Under or Over to Higher or Lower when describing Casemix variance. WTE data for this metric is now being submitted directly by the hospitals to HealthStat (i.e. via Healthstat Template). OPD data for these metrics is now being sourced from the Monthly Data Returns (MDR) submitted to the Business Intelligence Unit Acute Services Team (formerly PMU) Metric R11 renamed R11b and Traffic Light removed. This metric is now for information only New metric R11a introduced:consultant Contracts Percentage Within Contractual Ratio New Metric A7 Patient Wait Times for urgent colonoscopy (3 wait bands 0-28 days, 29-30days and 91+ days) introduced. New Metric I3b ALOS by inpatient basket of primary diagnosis introduced. Weighting of metrics introduced: High (4) Metrics A1a, A1b, A2, A5, I1, I2, R5, R9a, R10b, I3a Medium (3) Metrics A3a, A3b, A4a, A4b, A7, I6, R1, R4 Low (1) Metrics I4, R9c The figure for the total number of public elective (inpatient & day case) discharges in the previous month included under A1a/A1b charts. The figure for the total number of acute admissions from ED in the previous month included under A2 chart. Change from Higher or Lower to More Costly or Less Costly when describing Casemix variance Incorporation of additional definitions associated to Inpatient Basket in Appendix F. Order of metrics I3a/I3b reversed 3
4 March a I1 R5 R7 Enabling Information Metrics I1, I2, I3, I4 for Merlin Park Overall Traffic Light Metric 13a (inpatient basket) scored against target (target is customised, derived from casemix for each hospital, across each procedure included in the basket, based on international performance). Metric weighted high (4) Metric calculation for day case basket of 24 has been amended to exclude emergency inpatients. R5 (Absenteeism): This metric has been amended to exclude staff on long term sick leave from the traffic light (scoring) calculation. Proportion of long-term leave still visible on the chart. Metric R7 (NCHD vs Consultant Ratio) has been discontinued. Subsequent metrics have been renumbered in accordance. Enabling information introduced in table form at the top of each hospital dashboard (see page 19 for details) Data for metrics I1 (Day case rate), I2 (Day of procedure admission rate), I3 (ALOS) and I4 (Percentage of cases entered in HIPE) for Merlin Park combined with data for Galway University Hospital Traffic Light Rules amended to include that a hospital cannot score an Overall GREEN if it scores RED on ACCESS, INTEGRATION or RESOURCES. In such cases the Overall TL will be adjusted to AMBER. 4
5 Contents Version History 2 Contents 5 1 Introduction Transformation Programme Core Metrics This Document 9 2 The Dashboard Methodology Dashboard Visualisation Dashboard Example 15 3 Detailed Metric Descriptions Access Resources 39 Appendix A: List of Hospitals 56 Appendix B: HealthStat Monthly Hospital Template 58 Appendix C: Impact of Incomplete Hospital Data Submission on Traffic Lights _61 Appendix D: Consultant Led OPD Clinic to Specialty Group Mapping 63 Appendix E: Day Case Procedures 66 Appendix F: Primary Diagnosis Definitions included in Inpatient Basket 76 Appendix G: DRG to Specialty Mapping 80 Appendix H: Definition of Terms 95 5
6 1 Introduction The following section provides a brief introduction to the underlying rational and drivers for the HealthStat hospital dashboard, the core metrics that have been used as the basis for its creation, and an overview of this user guide. 1.1 Transformation Programme The Health Service Executive (HSE) is currently undergoing a major transformation programme that encompasses many elements. One component of this programme is to - Implement standards based performance measurement and management throughout the HSE. The objective of this part of the programme is to ensure that the best performance management can be achieved by each hospital in the delivery of patient services. A major input to the delivery of this component has been the development and implementation of a monthly hospital dashboard (subsequently referred to as the dashboard ) for those acute hospitals listed in Appendix A. These dashboards allow each incorporated hospital to not only monitor their performance across a number of metrics, but also to compare this to the performance of other hospitals and, as such, provide for the first time a mechanism whereby each hospital, hospital network and HSE executive can compare relative and absolute performances of hospitals, in turn enabling them to identify systemic issues, areas for improvement and examples of good practice. 1.2 Core Metrics The dashboard itself is centred around three key themes, namely: i) Access (the waiting times experience by people using hospitals), ii) iii) Integration (the patient journey once in the system), Resources (right people in the right place, value for money, effectiveness of applied resource). Within each of these themes there are a number of individual metrics, and these and the source of the data that is used to create them are summarised in the following table: 6
7 Table 1: Summary of Metrics and Data Sources Section Metric Data Source Access A1a A1b A2 A3a A3b A4a A4b A5 A6 A7 Integration Hospital Elective Medical and Surgical Procedures Waiting Time Distribution of Adult Elective Waiting Times Hospital Elective Medical and Surgical Procedures Waiting Time Distribution of Child Elective Waiting Times Emergency Department to Acute Admission Waiting Times GP to Hospital Referral Wait Times for Routine Outpatient Physiotherapy GP to Hospital Referral Wait Times for Routine Outpatient Diagnostics Consultant to Hospital Referral Wait Times for Routine Outpatient Physiotherapy Consultant to Hospital Referral Wait Times for Routine Outpatient Diagnostics Average waiting time for OPD Consultant Led Clinics Percentage of Consultant Led Clinics with a Routine Waiting Time over 90 days Patient Wait Times for Urgent Colonoscopy NTPF PTR Monthly Report NTPF PTR Monthly Report HSE Business Intelligence Unit Acute Services Team (formerly PMU) Winter Plan Report HealthStat Monthly Hospital Template HealthStat Monthly Hospital Template HealthStat Monthly Hospital Template HealthStat Monthly Hospital Template HSE Business Intelligence Unit Acute Services Team (formerly PMU) HSE Business Intelligence Unit Acute Services Team (formerly PMU) HSE Business Intelligence Unit Acute Services Team (formerly PMU) I1 Day Case Rates- Procedures Casemix I2 Day of Procedure Admission Rate for Elective Inpatients Casemix 7
8 Section Metric Data Source I3a I3b I4 I5 I6 Resource R1 R2 R3 R4 R5 R6 R7a R7b R8a ALOS by Inpatient Basket of Primary Diagnosis (trimmed at two standard deviations) Inpatient Average Length of Stay (trimmed at two standard deviations) Percentage of Cases Entered into HIPE Delayed Discharges Appropriateness of Admissions and Care Finance And Resource Usage Financial Breakdown Activity vs. Service Plan Staff Whole Time Equivalent Variance from Staff Ceiling Percentage of Staff Hours Lost Due to Absenteeism Distribution of Staff Allied Health Professional New to Return Patient Attendances Number of New and Return Visits per Staff Delivering Service Total Hospital Diagnostic Activity (Radiology) Casemix Casemix Casemix HSE Business Intelligence Unit Acute Services Team (formerly PMU) Delayed Discharge Report Current data: Acute Hospital Bed Review (May/June 2008) Previous data: Acute Hospital Bed Review (Jan-Feb 2007) HSE Corporate Reporting Services and Casemix base price HSE Corporate Reporting Services HSE Business Intelligence Unit Acute Services Team (formerly PMU) HSE National Employment Monitoring Unit HealthStat Monthly Hospital Template HSE National Employment Monitoring Unit HealthStat Monthly Hospital Template HealthStat Monthly Hospital Template HealthStat Monthly Hospital Template 8
9 Section Metric Data Source R8b Hospital Diagnostic Activity per Whole Time Equivalent Radiographer and Radiologist Radiographers WTE HSE Staff Census R8c R9a R9b R9c R10a Total Hospital Diagnostic Activity per Patient (Radiology) OPD Consultant Led Clinics Number of New Patients Seen per Whole Time Equivalent Consultant OPD Consultant Led Clinics - Distribution of Patient Attendance OPD Consultant Led Clinics Percentage of Patients that Did Not Attend Public Private Split of Activity HealthStat Monthly Hospital Template HSE Business Intelligence Unit Acute Services Team (formerly PMU) for New Patients Seen and HealthStat Monthly Template for WTE Consultants HSE Business Intelligence Unit Acute Services Team (formerly PMU) HSE Business Intelligence Unit Acute Services Team (formerly PMU) Business Intelligence Unit Acute Services Team (formerly PMU) Monthly Return R10b Consultant Contracts Percentage Within Contractual Ratio HIPE Report from Individual Hospitals These metrics were identified and consolidated by the Metrics Control Group, which is a HSE cross-departmental body created at the request of the CEO of the HSE to define the frame around which the dashboards would be initially created and operated. It is recognised that this set of metrics does not reflect all hospital activity, and it is anticipated that there shall be periodic reviews held by this group to consider amendments to existing metrics, or the creation of new metrics, using as a basis hospital feedback. It should be noted that full definitions for each of these metrics can be found in Section 3 of this document, and as such are not discussed further here. 1.3 This Document The purpose of this document is to provide the reader with the necessary information required to understand and interpret the monthly hospital dashboards. 9
10 Interpreting the dashboard may upon initial examination seem a relatively straightforward exercise. This is however not the case due to: i) the number of metrics incorporated (33), ii) iii) iv) the number of data items used to generate them (c.350), the detailed definition and calculation associated with each, the individual context within which each hospital operates. With regards to the structure of this document, section 2 details the overall dashboard (data sources, visual representation and common features), whilst section 3 details each of the 33 metrics in turn. There are also eight Appendices that provide information on: a) The acute hospitals currently incorporated; b) The HealthStat monthly hospital template; c) Impact of incomplete hospital data submission on traffic lights; d) The mapping of consultant led Outpatient Department (OPD) clinics to specialty groupings; e) A list of the Basket of 24 daycase procedures; f) Primary diagnosis definitions included in inpatient basket; g) The mapping of Diagnosis Related Groups (DRG s) to specialty groupings; h) A definition of terms relevant to the metrics. 10
11 2 The Dashboard The following section provides a brief overview of how the dashboard is generated and explains in detail its visual representation and features. 2.1 Methodology The following diagram illustrates the methodology used in the generation of the dashboard. When any underlying data required to generate the metrics is gathered by an existing source e.g. Casemix, Business Intelligence Unit Acute Services Team (formerly PMU), National Employment Monitoring Unit (NEMU), Finance, National Treatment Purchase Fund (NTPF), then this data is obtained from that existing source (note that this accounts for approximately 250 of the data items required). Where new data items are required, then these are obtained directly from each hospital via the HealthStat Monthly Hospital Template (see Appendix B). The following figure graphically represents the dashboard generation process and shows that: i) Once collected, all data is combined into a single data set on which a variety of calculations are performed; ii) The data is then disaggregated into hospital level data which is published for each individual hospital. Figure 1: Overview of Dashboard Generation Process HealthStat Templates BIU Acute Services Monthly Returns Casemix PTR Report HSE Corporate Reporting Data Analysis Hospital Dashboard.pdf Hospital Dashboard.pdf Hospital Dashboard.pdf Hospital Dashboard.pdf Hospital Dashboard.pdf Hospital Dashboard.pdf 11
12 2.2 Dashboard Visualisation Each dashboard consists of a set of common features that are summarised below and graphically represented in Figure Title The title lists the name of the hospital and the month upon which the hospital data used to generate the dashboard is based High Level Diagnostic traffic light indicators Each of the three themes or sectors around which the dashboard is created (i.e. Access, Integration and Resource) is also given a traffic light indicator, which is based upon the mean of the aggregate of each of the individual traffic lights in that sector. An overall traffic light indicator based on the three sector traffic lights for each hospital is also shown. The rules associated with the triggering of these traffic lights are detailed in Section 3 of this document and thus are not further elaborated upon here Key The key graphically shows how the following items are visually represented in the metrics: Hospital Delivery the performance of that hospital; Group Average the average performance of the hospitals; Best in Ireland (average of top 3 in peer group) the best performance in Ireland as derived from the average performance of the top 3 hospitals in peer group on that metric; Target the performance target against which hospital performance is measured. It should be noted that not all metrics contain each of the above elements as: In some cases the metric may not be applicable to an individual hospital (e.g. GP referrals for diagnostics) or the data may not have been submitted and in such cases hospital delivery will be missing; Where there is a target, it is performance against that target that takes priority and so group average or Best in Ireland performance is not shown; Where there is no target, there will obviously be no target information and in such cases either group average or Best in Ireland performance may be shown as a means of aiding further interpretation Source of Data Under each metric the target for the metric and the source of the data are listed. 12
13 2.2.5 Absolute Target and Marker For some metrics, the performance of the hospital is measured against an absolute target (e.g., All ED to Acute Admissions to occur within 6 hours in the case of metric A2). These absolute targets can either be specified as in the previous example (it is listed in the Service Plan for 2009) or unspecified, (e.g., metric I4, the percentage of cases entered into HIPE - there is an 80% target that as yet has not been specified in a formal manner). These targets are visually represented by a thick solid green line. The metrics that have a specified absolute target are: A1a, A1b, A2, A7, I1, I2, R1, R4, R5 The metrics that have an unspecified absolute target are: A3a, A3b, A4a, A4b, A5, I3a, I4, I5, I6, R9c, and R10a Relative Target and Marker For some metrics, instead of measuring hospital performance against an absolute target, they are measured against a relative target that is defined by Best in Ireland performance. The Best in Ireland measure is defined as the average of the performance of the three best hospitals in peer group and is visually represented by a thinner green dotted line joining each measure. The metric that has relative targets is R9a Group Average For metrics where it is not possible to measure performance against either an absolute or relative target, group average markers have been included as a means by which relative hospital performance can be assessed. These group averages are visually represented by a thin blue dotted line. The metrics that have group average markers are R2, R6, R7a and R8b Number of Instances Where a number appears in a bracket in a metric, this refers to the absolute number that makes up that part of the metric Individual Metric Traffic Light Indicator For those metrics against which the hospitals performance is being directly measured, there is an associated Traffic Light Indicator to visually depict the hospital s performance against that target. These indicators can have one of three colours, which have the following associated meanings: Green hospital performance on that metric is meeting or is within an acceptable tolerance of the target; 13
14 Amber hospital performance on that metric is outside the target / acceptable tolerance and is of concern; Red hospital performance on that metric is significantly outside the target / acceptable tolerance and is of major concern. The precise details by which each traffic light colour is triggered for each metric is detailed in Section 3 of this document and as such is not further discussed here. It should be noted at this point that, in the event of data being either not supplied or the metric itself not being applicable to the individual hospital, the traffic light can be switched off and in such instances it will have no colour. In the event of repeated lack of submission of data however, it may be decided to switch the traffic light to red until data is received and in such instances this shall be clearly communicated to the individual hospital. See Appendix C for details of the Impact of an incomplete data submission on traffic lights Hospital Key Points Key points for each hospital are contained at the end of the dashboard. This highlights any issues that will affect interpretation of the data e.g. if part of the dataset is missing for that month. Figure 2: Visual Representation of Common Elements to the Dashboard Title Traffic Light Indicator Key Individual Metric Traffic Light Indicator Relative Target and Marker Source of Data Absolute Target and Marker Number of Instances 14
15 2.3 Dashboard Example The following section presents by means of example a full dashboard, and shows that each dashboard is clearly constructed and delineated across the three themes of Access, Integration and Resource. Figure 3: Access Element of Hospital Dashboard 15

16 Figure 4: Integration Element of Hospital Dashboard 16
17 Figure 5: Resource Element of Hospital Dashboard 17
18 3 Detailed Metric Descriptions HSE HEALTH STATISTICS GLOSSARY OF TERMS Metric Name: Overall Hospital Traffic Light Indicator Description: Visual indication of the hospitals overall performance across Access, Integration and Resource 1. Data Inputs Active Hospital Metric Traffic Lights for Access, Integration and Resource 2. Reporting Frequency Monthly 3. Owner Business Intelligence Unit - HealthStat 4. Reporting Entity Business Intelligence Unit - HealthStat 5. Target Green 6. Calculation: Metric Calculation Not Applicable Traffic Light Calculation n = Sum of [(numerical value of each active traffic lights in Access, Integration and Resource) * (each active traffic light weighting)] / Weighted aggregate of active traffic lights for Access, Integration and Resource. Where Red = 3, Amber = 2, Green = Traffic Light Rules for Overall Indicator: If n is greater than or equal to 2.34 then the traffic light is Red; If n is greater than or equal to 1.66 but less than 2.34 then the traffic light is Amber; If n is less than 1.66 then the traffic light is Green. Note: If n is less than 1.66 (i.e. GREEN) for the Overall Traffic light but greater than or equal to 2.34 (i.e. RED) for ACCESS, INTEGRATION or RESOURCES the Overall Traffic Light will be adjusted to AMBER. 18
19 HSE HEALTH STATISTICS GLOSSARY OF TERMS Metric Name: Enabling Information Description: Description: Visual representation of timely access to selected services (enabling information) within a hospital i.e. 1. Data Inputs 1. Access within 24 hours for all GP referrals in catchment area to Medical Assessment Unit (MAU) for medical opinion; 2. Rapid access for hospital MAU to diagnostics; within 3 hours for ultrasound; 3. Rapid access for hospital MAU to diagnostics; within 24 hours for CT scans; 4. Direct GP/community access to ultrasounds within 4 weeks. Data sourced directly from hospitals (HealthStat hospital template) Note: Direct GP/Community access to ultrasounds within 4 weeks is currently the only service for which data is collated and being presented. 2. Reporting Frequency Six monthly or as updates received from hospitals 3. Owner Business Intelligence Unit - HealthStat 4. Reporting Entity Hospitals currently being reported on by HealthStat 5. Target If a service (as per 1 to 4 above) is provided, access to that service should be provided within the stated time-frame for that service. 6. Calculation: Not applicable 7. Traffic Light Rules for Overall Indicator: If a service is provided and it is provided within the stated timeframe it will be denoted by the letter Y (Yes) within a GREEN box. If a service is provided and it is not provided within the specified timeframe it will be denoted by the letter N (No) within a RED box. If the service is not provided it will be denoted by the letter N (No) within a RED box. Note: This information is not scored and hence not included in the overall score of the hospital but it is considered important additional information on performance. 19
20 3.1 Access HSE HEALTH STATISTICS GLOSSARY OF TERMS Metric Name: Sector Traffic Light For Access Description: Visual indication of the hospitals performance for Access 1. Data Inputs: Active Hospital Metric Traffic Lights for A1a, A1b, A2, A3a, A3b, A4a, A4b, A5 and A7 2. Reporting Frequency: Monthly 3. Owner: Business Intelligence Unit - HealthStat 4. Reporting Entity: Business Intelligence Unit - HealthStat 5. Target Green 6: Calculation: Metric Calculation Not Applicable Traffic Light Calculation n = [(Sum of (numerical value of each active traffic lights in Access) * (each active traffic light weighting)) / Weighted aggregate of active traffic lights for Access]. Where Red = 3, Amber = 2, Green = Traffic Light Rules: If n is greater than or equal to 2.34 then the traffic light is Red; If n is greater than or equal to 1.66 but less than 2.34 then the traffic light is Amber; If n is less than 1.66 then the traffic light is Green. 20
21 HSE HEALTH STATISTICS GLOSSARY OF TERMS Metric Name: A1a - Hospital Elective Medical/Surgical Waiting Times Distribution of Adult Elective Waiting Times Description: Graphical representation of the National Treatment Purchase Fund (NTPF) aggregate waiting times for inpatient and daycase elective medical/surgical procedures for adults for the previous month. 1. Source of Data Inputs: NTPF Patient Treatment Register (PTR) Monthly Report. 2. Reporting Frequency: Monthly 3. Owner: NTPF 4. Reporting Entity: NTPF 5. Target: 100% of adults treated within 6 months from the time of identification of clinical need for the elective procedure. Source: National Service Plan : Calculation: Metric Calculation Each category (e.g. 0 to 3 month adult elective wait time) shows the aggregate of adult inpatient and daycase waiting list in that timeframe as a percentage of the total number of cases for that grouping. Traffic Light Calculation n = [(number of adult cases waiting within 6 months) / (total number of adult cases on PTR)] * Traffic Light Rules: The traffic lights are based upon the absolute target detailed in 5 as calculated in 6. If n is 65% or less then the traffic light is Red; If n is greater than 65% but less than or equal to 85% then the traffic light is Amber; If n is greater than 85% then the traffic light is Green. TL Weighting = High (4) 21
22 HSE HEALTH STATISTICS GLOSSARY OF TERMS Metric Name: A1b - Hospital Elective Medical and Surgical Procedures Waiting Times Distribution of Child Elective Waiting Times Description: Graphical representation of the National Treatment Purchase Fund (NTPF) aggregate waiting times for inpatient and daycase elective procedures for children for the previous month. 1. Source of Data Inputs: NTPF Patient Treatment Register (PTR) Monthly Report. 2. Reporting Frequency: Monthly 3. Owner: NTPF 4. Reporting Entity: NTPF 5. Target: 100% of children treated within 3 months from the time of identification of clinical need for the elective procedure. Source: National Service Plan : Calculation: Metric Calculation Each category (e.g. 0 to 3 month wait time) shows the aggregate of inpatient and daycase waiting list in that timeframe as a percentage of the total number of cases for that grouping. Traffic Light Calculation n = [(number of child cases waiting within 3 months) / (total number of child cases on PTR)] * Traffic Light Rules: The traffic lights are based upon the absolute target detailed in 5 as calculated in 6. If n is 65% or less then the traffic light is Red; If n is greater than 65% but less than or equal to 85% then the traffic light is Amber; If n is greater than 85% then the traffic light is Green. TL Weighting = High (4) 22
23 HSE HEALTH STATISTICS GLOSSARY OF TERMS Metric Name: A2 Emergency Department to Acute Admission Wait Times Description: Graphical representation of the wait times for acute admission from Emergency Department (ED) from the point of decision to admit, as recorded in the hospital at 2pm each day and aggregated for the previous month. This is shown in four time categories (0 to 6 hours, 6 to 12 hours, 12 to 24 hours and > 24 hours) as a percentage of the total wait time (e.g. if half of all patients requiring admission are admitted within 6 hours, the figure for this time category shall be 50%). 1. Source of Data Inputs: Business Intelligence Unit Acute Services Team Winter Plan Report 2. Reporting Frequency: Monthly 3. Owner: Business Intelligence Unit Acute Services Team 4. Reporting Entity: Business Intelligence Unit Acute Services Team 5. Target: 100% of patients to be admitted within 6 hours of decision to admit. Source: National Service Plan Calculation: Metric Calculation Each category (e.g. 0 to 6 hours) shows the patients waiting to be admitted within that timeframe as a percentage of the total number of patients waiting to be admitted. Traffic Light Calculation n = [(No. of patients waiting 0-6 hours) / (no. of patients waiting 0-6 hours + no. of patients waiting 6-12 hours + no. of patients waiting hours + no. of patients waiting >24 hours)] * Traffic Light Rules: The traffic lights are based upon the absolute target detailed in 5 as calculated in 6. If n is 65% or less then the traffic light is Red; If n is greater than 65% but less than or equal to 85% then the traffic light is Amber; If n is greater than 85% then the traffic light is Green. TL Weighting = High (4) 23
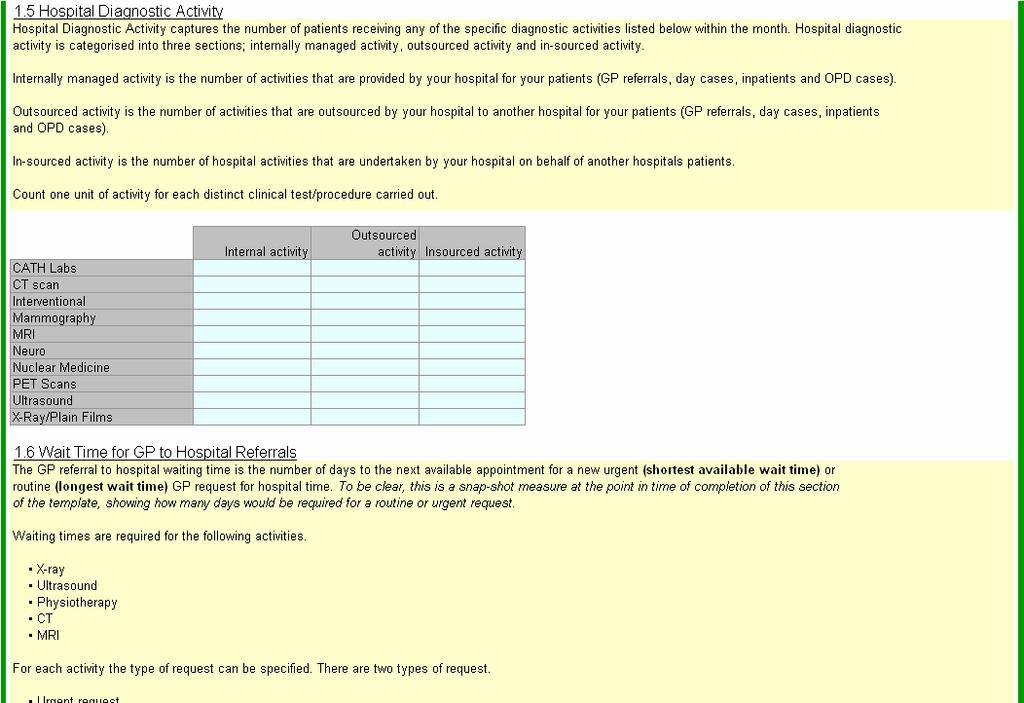
24 HSE HEALTH STATISTICS GLOSSARY OF TERMS Metric Name: A3a GP to Hospital Referral Wait Time for Routine Outpatient Physiotherapy Description: Visual representation of the length of time in calendar days to the next available routine GP referral appointment slot for a Physiotherapy appointment. 1. Source of Data Inputs: Section 1.6 of the HealthStat monthly hospital template (see Appendix B) 2. Reporting Frequency: Monthly 3. Owner: Business Intelligence Unit - HealthStat 4. Reporting Entity: Hospitals 5. Target: All routine referrals should be seen within 70 days. Source: This target is not formally specified but has been set by HealthStat to 70 days using as a basis, the assessment of targets and wait times in other comparable countries. 6. Calculation: Traffic Light Calculation n = (physiotherapy routine referral wait time / 70days) * Traffic Light Rules: If n is 135% or more then the traffic light is Red; If n is greater than or equal to 115% but less than 135% then the traffic light is Amber; If n is less than 115% then the traffic light is Green. TL Weighting = Medium (3) 24
25 HSE HEALTH STATISTICS GLOSSARY OF TERMS Metric Name: A3b GP to Hospital Referral Wait Time for Routine Outpatient Diagnostics Description: Visual representation of the length of time in calendar days to the next available routine GP referral appointment slot for Ultrasound, X-Ray, CT and MRI. 1. Source of Data Inputs: Section 1.6 of the HealthStat monthly hospital template (see Appendix B) 2. Reporting Frequency: Monthly 3. Owner: Business Intelligence Unit - HealthStat 4. Reporting Entity: Hospitals 5. Target: All routine ultrasound referrals should be seen within 70 days. Source: This target is not formally specified but has been set by HealthStat to 70 days using as a basis, the assessment of targets and wait times in other comparable countries. 6. Calculation: Traffic Light Calculation n = (ultrasound routine referral wait time / 70days) * Traffic Light Rules: If n is 135% or more then the traffic light is Red; If n is greater than or equal to 115% but less than 135% then the traffic light is Amber; If n is less than 115% then the traffic light is Green. TL Weighting = Medium (3) 25
26 HSE HEALTH STATISTICS GLOSSARY OF TERMS Metric Name: A4a Consultant to Hospital Referral Wait Time for Routine Outpatient Physiotherapy Description: Visual representation of the length of time in calendar days to the next available routine Consultant referral appointment slot for Physiotherapy 1. Source of Data Inputs: Section 1.7 of the HealthStat monthly hospital template (see Appendix B) 2. Reporting Frequency: Monthly 3. Owner: Business Intelligence Unit - HealthStat 4. Reporting Entity: Hospitals 5. Target: All routine referrals should be seen within 70 days. Source: This target is not formally specified but has been set by HealthStat to 70 days using as a basis, the assessment of targets and wait times in other comparable countries. 6. Calculation: Traffic Light Calculation n = (physiotherapy routine referral wait time / 70days) * Traffic Light Rules: If n is 135% or more then the traffic light is Red; If n is greater than or equal to 115% but less than 135% then the traffic light is Amber; If n is less than 115% then the traffic light is Green. TL Weighting = Medium (3) 26
27 HSE HEALTH STATISTICS GLOSSARY OF TERMS Metric Name: A4b Consultant to Hospital Referral Wait Time for Routine Outpatient Diagnostics Description: Visual representation of the length of time in calendar days to the next available routine Consultant referral appointment slot for Ultrasound, X-ray, CT and MRI. 1. Source of Data Inputs: Section 1.7 of the HealthStat monthly hospital template (see Appendix B) 2. Reporting Frequency: Monthly 3. Owner: Business Intelligence Unit - HealthStat 4. Reporting Entity: Hospitals 5. Target: All routine ultrasound referrals should be seen within 70 days. Source: This target is not formally specified but has been set by HealthStat to 70 days using as a basis, the assessment of targets and wait times in other comparable countries. 6. Calculation: Traffic Light Calculation n = (ultrasound routine referral wait time / 70days) * Traffic Light Rules: If n is 135% or more then the traffic light is Red; If n is greater than or equal to 115% but less than 135% then the traffic light is Amber; If n is less than 115% then the traffic light is Green. TL Weighting = Medium (3) 27
28 HSE HEALTH STATISTICS GLOSSARY OF TERMS Metric Name: A5 Average Waiting Time for OPD Consultant Led Clinics Description: Visual representation of the length of time in calendar days to the next available routine referral to a consultant led OPD clinic. This is presented both overall and by the following specialty groupings (Paediatrics, Otolaryngology, Orthopaedics, Ophthalmology, and General Medicine). Note: the mapping used for these specialty groupings is shown in Appendix D 1. Source of Data Inputs: Business Intelligence Unit Acute Services Team Monthly Data Return 2. Reporting Frequency: Monthly 3. Owner: Business Intelligence Unit Acute Services Team 4. Reporting Entity: Business Intelligence Unit Acute Services Team 5. Target: All routine referrals should be seen within 90 days. Source: This target is not formally specified but has been set by HealthStat to 90 days using as a basis, the assessment of targets and wait times in other comparable countries. 6. Calculation: Metric Calculation Overall figure = (sum of wait times for all consultant led clinic) / total number of clinics Specialty figure = (sum of wait times for consultant led clinics in that specialty) / number of consultant led clinics in that specialty Traffic Light Calculation n = (overall routine referral wait time / 90 days) * Traffic Light Rules: If n is 135% or more then the traffic light is Red; If n is greater than or equal to 115% but less than 135% then the traffic light is Amber; If n is less than 115% then the traffic light is Green. TL Weighting = High (4) 28
29 HSE HEALTH STATISTICS GLOSSARY OF TERMS Metric Name: A6 Percentage of Consultant Led Clinics With a Routine Wait Time over 90 days Description: Visual representation of the percentage of consultant led clinics in each hospital that have a wait time for a routine referral of greater than 90 calendar days. This is presented both overall and by the following specialty groupings (Paediatrics, Otolaryngology, Orthopaedics, Ophthalmology,, and General Medicine). Note: the mapping used for these specialty groupings is shown in Appendix D 1. Source of Data Inputs: Business Intelligence Unit Acute Services Team Monthly Data Return 2. Reporting Frequency: Monthly 3. Owner: Business Intelligence Unit Acute Services Team 4. Reporting Entity: Business Intelligence Unit Acute Services Team 5. Target: 0% of clinics having a wait time over 90 days for a new referral Source: This target is not formally specified but has been set by HealthStat to 90 days using as a basis, the assessment of targets and wait times in other comparable countries. 6. Calculation: Metric Calculation Overall figure = (total number of consultant led clinics with waiting time over 90 days / total number of consultant led clinics) * 100. Specialty figure = (number of consultant led clinics in that specialty with a waiting time over 90 days / total number of consultant led clinics in that specialty) * 100. Traffic Light Calculation Not Applicable 7. Traffic Light Rules: Not Applicable 29
30 HSE HEALTH STATISTICS GLOSSARY OF TERMS Metric Name: A7 Patient Wait Times for Urgent Colonoscopy Description: Graphical representation of the wait times for an urgent colonoscopy. The number of patients waiting is a snapshot number taken during the last week of the month. This is shown in three time categories (0 to 28 days, 29 to 90 days, and 91+ days) as a percentage of the total wait time (e.g. if half of all patients receive a colonoscopy within 28 days of being referred, the figure for this time category shall be 50%). 1. Source of Data Inputs: Business Intelligence Unit Acute Services Team Monthly Data Return 2. Reporting Frequency: Monthly 3. Owner: Business Intelligence Unit Acute Services Team 4. Reporting Entity: Business Intelligence Unit Acute Services Team 5. Target: 100% of patients receiving access to colonoscopy for urgent referral within 28 days. Source: National Service Plan Calculation: Metric Calculation Each category (e.g. 0 to 28 days) shows the patients treated within that timeframe as a percentage of the total number of patients treated. Traffic Light Calculation n = [(No. of patients waiting 0-28 days) / (no. of patients waiting 0-28 days + no. of patients waiting days + no. of patients waiting >90 days)] * Traffic Light Rules: The traffic lights are based upon the absolute target detailed in 5 as calculated in 6. If n is less than 100% then the traffic light is Red; If n is 100% then the traffic light is Green. TL Weighting = Medium (3) 30
31 Integration HSE HEALTH STATISTICS GLOSSARY OF TERMS Metric Name: Sector Traffic Light For Integration Description: Visual indication of the hospitals performance for Integration 1. Data Inputs: Active Hospital Metric Traffic Lights for I1, I2, I3a, I4 and I6 2. Reporting Frequency: Monthly 3. Owner: Business Intelligence Unit HealthStat 4. Reporting Entity: Business Intelligence Unit HealthStat 5. Target Green 6: Calculation: Metric Calculation Not Applicable Traffic Light Calculation n = [(Sum of (numerical value of each active traffic lights in Integration) * (each active traffic light weighting)) / Weighted aggregate of active traffic lights for Integration]. Where Red = 3, Amber = 2, Green = Traffic Light Rules: If n is greater than or equal to 2.34 then the traffic light is Red; If n is greater than or equal to 1.66 but less than 2.34 then the traffic light is Amber; If n is less than 1.66 then the traffic light is Green. 31
32 HSE HEALTH STATISTICS GLOSSARY OF TERMS Metric Name: I1 - Day Case Rates Procedures Description: Graphical representation of the percentage of the overall number of elective patients that are treated as day cases for the listed procedures included in the basket of 24 (see Appendix E). Note: the timeframe upon which this data is based is a rolling 12 months from the previous month (e.g. March 09 Dashboard will be based upon March 08 to Feb 09 data as coded into the Hospital In-Patient Enquiry scheme (HIPE)). Note: The types of investigative scopes included in the day-case basket are those scopes that should not result in the patient potentially being admitted overnight in the event that something is discovered and treated on the spot, or age/co-morbidities are such that they may potentially also need to an overnight stay, 1. Source of Data Inputs: Casemix 2. Reporting Frequency: Monthly 3. Owner: Casemix 4. Reporting Entity: Casemix 5. Target: 75% or more of the Basket of 24 procedures should be treated as day cases Source: This target is not formally specified but has been set by HealthStat to 75% using as a basis the aggregation and averaging of procedure specific targets for those procedures contained in the Basket of Calculation: Metric Calculation Basket of 24 Day Case Rate = Total number of day cases for those procedures / (Total number of elective inpatients for those procedure + total number of day cases for those procedures) Traffic Light Calculation n = (Basket of 24 Day Case Rate / 75%) * Traffic Light Rules: If n is 65% or less then the traffic light is Red; If n is greater than 65% but less than or equal to 85% then the traffic light is Amber; If n is greater than 85% then the traffic light is Green. Weighting = High (4) 32
33 HSE HEALTH STATISTICS GLOSSARY OF TERMS Metric Name: I2 Day of Procedure Admission Rate for Elective Inpatients Description: Graphical representation of the percentage of elective inpatients receiving the procedure or surgery for which they were admitted on the day that they were admitted. This is shown both overall and by the following specialty groupings (Surgical, Medical, Paediatrics, Gynaecology,, Cardiology, Urology, and Gastroenterology). Note: the timeframe upon which this data is based is a rolling 12 months from the previous month (e.g. March 09 Dashboard will be based upon the completeness of the HIPE data between March 08 and Feb 09). Note: the HIPE mapping used for these specialty groupings are shown in Appendix F. Note: Obstetrics not included in calculations 1. Source of Data Inputs: Casemix 2. Reporting Frequency: Monthly 3. Owner: Casemix 4. Reporting Entity: Casemix 5. Target: 75% of elective inpatients should be admitted on the day of their procedure Source: This target is not formally specified but has been set by HealthStat to 75% using as a basis, the assessment of targets and performance in other comparable countries. 6. Calculation: Metric Calculation Overall Day of Procedure Admission Rate = (total number of elective inpatients receiving a procedure or surgery admitted on their day of procedure or surgery / total number of elective inpatients in receipt of a procedure or surgery) * 100 Specialty Day of Procedure Admission Rate = (total number of elective inpatients in that specialty receiving a procedure or surgery admitted on their day of procedure or surgery / total number of elective inpatients in that specialty in receipt of a procedure or surgery) * 100 Traffic Light Calculation n = (Overall Day of Procedure Admission Rate / 75%) * Traffic Light Rules: If n is 65% or less then the traffic light is Red; If n is greater than 65% but less than or equal to 85% then the traffic light is Amber; If n is greater than 85% then the traffic light is Green. Weighting = High (4) 33
34 HSE HEALTH STATISTICS GLOSSARY OF TERMS Metric Name: I3a ALOS by Inpatient Basket of Procedures Description: Graphical representation of average length of inpatient stay by procedure (see Appendix F). Note: the timeframe upon which this data is based is a rolling 12 months from the previous month (e.g. March 09 Dashboard will be based upon March 08 to Feb 09 data as coded into the Hospital In-Patient Enquiry scheme (HIPE)). Note: this data is trimmed for outliers using as a basis 2 Standard Deviations. 1. Source of Data Inputs Casemix 2. Reporting Frequency: Monthly 3. Owner: Casemix 4. Reporting Entity: Casemix 5. Target: The Overall target is a custom target derived using as a basis the casemix for each hospital within each inpatient procedure included in the basket (e.g. if a hospital has only 1 case in the Abdominal Pain category (target of 2.13 days) and only 1 case in the Cerebrovasular Disease (target days) then the overall target is ({ } / 2 = days). Each procedure target within the basket is in turn based upon comparable international performance targets. The Overall ALOS is simply the sum of each individual ALOS divided by the number of patients. The Overall ALOS variance should be 0 days or less. Source: This target is not formally specified but has been set by HealthStat to the above. 6. Calculation: Metric Calculation Overall ALOS Variance = Overall ALOS Casemix Complexity Adjusted Target Traffic Light Calculation n = (Overall ALOS Variance / Casemix Complexity Adjusted Target) * Traffic Light Rule: If n is 10% or greater then the traffic light is Red; If n is greater than or equal to 5% but less than 10% then the traffic light is Amber; If n is less than 5% then the traffic light is Green. Weighting = High (4) 34
35 HSE HEALTH STATISTICS GLOSSARY OF TERMS Metric Name: I3b - Inpatient Average Length of Stay Description: Graphical representation of the overall average length of stay for all inpatients in days. Note: the timeframe upon which this data is based is a rolling 12 months from the previous month (e.g. March 09 Dashboard will be based upon March 08 to Feb 09 data as coded into the Hospital In-Patient Enquiry scheme (HIPE)). Note: this data is trimmed for outliers using as a basis 2 Standard Deviations. 1. Source of Data Inputs Casemix 2. Reporting Frequency: Monthly 3. Owner: Casemix 4. Reporting Entity: Casemix 5. Target: Not applicable 6. Calculation: Metric Calculation Overall ALOS = Total inpatient bed days / Total inpatients 7. Traffic Light Rule: Not applicable 35
36 HSE HEALTH STATISTICS GLOSSARY OF TERMS Metric Name: I4 Percentage of Cases Entered into HIPE Description: Graphical representation of the percentage of cases coded into the Hospital Inpatient Enquiry Scheme (HIPE) as compared to the number of discharges registered on the hospitals Patient Administration System (PAS). Note: the timeframe upon which this data is based is a rolling 12 months from the previous month (e.g. March 09 Dashboard will be based upon the completeness of the HIPE data between March 08 and Feb 09). 1. Source of Data Inputs: Casemix 2. Reporting Frequency: Monthly 4. Owner: Casemix 5. Reporting Entity: Casemix 6. Target: An absolute target of 80% completeness has been defined, which is based upon current completeness rules in HIPE (i.e. all coding is to be completed within 10 weeks of discharge). As such, assuming that the volume of cases being coded into HIPE remains relatively consistent throughout the year then, as a minimum, a completion rate of 80% should be achievable for all hospitals. 7. Calculation: Metric and Traffic Light Calculation Percentage Completion (n) = (total number of cases entered into HIPE in 12 month period / total number of discharges in 12 month period) * Traffic Light Rules: If n is less than 80% then the traffic light is Red; If n is greater than 80% then the traffic light is Green. Weighting = Low (1) 36
37 HSE HEALTH STATISTICS GLOSSARY OF TERMS Metric Name: I5 Delayed Discharges Description: Graphical representation of the percentage of bed days lost with respect to the total number of available bed days, due to their inappropriate occupancy by delayed discharge patients (e.g. those who have been identified as being medically fit for discharge into a non-acute setting). The number of delayed discharge patients, broken down by reason for delay, is also displayed by clicking on the raw data drill down button under the chart of this metric on the system. This is a snapshot number taken during the last week of the month. 1. Source of Data Inputs: Business Intelligence Unit- Acute Services Team Delayed Discharge Report 2. Reporting Frequency: Monthly 3. Owner: Business Intelligence Unit Acute Services Team 4. Reporting Entity: Business Intelligence Unit Acute Services Team 5. Target: Not applicable 6. Calculation: Metric Calculation Percentage of Bed Days Lost = Number of Bed Days Lost in the Month / Number of Bed Days Available in that Month 7. Traffic Light Rules Not applicable 37
38 HSE HEALTH STATISTICS GLOSSARY OF TERMS Metric Name: I6 Appropriateness of Admission and Care Definition: Tabular representation of the results of the HSE Acute Hospital Bed Review. Information contained in the table is: The percentage of inpatients admitted into an acute setting unnecessarily / inappropriately; The percentage of inpatients receiving treatment in an acute setting unnecessarily / inappropriately; The percentage of inpatients with a discharge plan; The percentage of inpatients with a discharge date. This information is presented both for the individual hospital (for those that were included in the survey) and as an average. 1. Source of Data Inputs: Acute Hospital Bed Review the date of the review as specified on the dashboard 2. Reporting Frequency: 6-monthly (TBC) 3. Owner: Individual hospitals 4. Reporting Entity: None 5. Target: 60% of inpatients should have a discharge plan 30% of inpatients should have a discharge date Source: These targets are not formally specified but has been set by HealthStat to the above using as a basis Irish inpatient ALOS, current levels of performance and an assessment of performance in comparable countries. 6. Calculation: n = {[(% of patients with discharge plan / 60%) + (% of patients with discharge date / 30%)] / 2} * Traffic Light Rules: If n is 65% or less then the traffic light is Red; If n is greater than 65% but less than or equal to 85% then the traffic light is Amber; If n is greater than 85% then the traffic light is Green. Weighting = Medium (3) 38
39 3.2 Resources HSE HEALTH STATISTICS GLOSSARY OF TERMS Metric Name: Sector Traffic Light for Resource Description: Visual indication of the hospitals performance for Resource 1. Source of Data Inputs: Active Hospital Metric Traffic Lights for R1, R4, R5, R9a, R9c and R10b. 2. Reporting Frequency: Monthly 3. Owner: Business Intelligence Unit HealthStat 4. Reporting Entity: Business Intelligence Unit HealthStat 5. Target: Green 6. Calculation: Metric Calculation Not Applicable Traffic Light Calculation n = (Sum of (numerical value of each active traffic lights in Resources) * (each active traffic light weighting)) / Weighted aggregate of active lights for Resources Where Red = 3, Amber = 2, Green = 1 7. Traffic Light Rules: If n is greater than or equal to 2.34 then the traffic light is Red; If n is greater than or equal to 1.66 but less than 2.34 then the traffic light is Amber; If n is less than 1.66 then the traffic light is Green. 39
40 HSE HEALTH STATISTICS GLOSSARY OF TERMS Metric Name: R1 Finance and Resource Usage Description: Tabular representation of: Year To Date (YTD) Expenditure versus YTD Budget Casemix adjusted base price 1. Source of Data Inputs: Finance Monthly Data Return for YTD Expenditure and YTD Budget Casemix for base price 2. Reporting Frequency: Monthly for expenditure and budget Yearly for base price 3. Owner: HSE Finance for expenditure and budget Casemix for base price 4. Reporting Entity: Finance Casemix 5. Target: Absolute target based upon the percentage variance of hospital expenditure from budget. Source: All hospitals should work within their allocated annual budgets. 7. Calculation: Metric Calculation budget variance = (actual expenditure budget) Traffic Light Calculation n = (budget variance / budget) * Traffic Light Rules: If n is 0.5% or greater then the traffic light is Red; If n is greater than 0.25% but less than 0.5% then the traffic light is Amber; If n is 0.25% or less then the traffic light is Green. Weighting = High (4) 40
41 HSE HEALTH STATISTICS GLOSSARY OF TERMS Metric Name: R2 Financial Breakdown Description: Graphical representation of allocation of YTD expenditure into the following categories: non-payroll, payroll-agency, payroll-overtime, basic-payroll. 1. Source of Data Inputs: Finance Monthly Data Return for non-payroll, payroll-overtime and basic-payroll. HealthStat monthly hospital template for payroll-agency. 2. Reporting Frequency: Monthly 3. Owner: Finance 4. Reporting Entity: Finance Hospitals 5. Target: Not applicable 6. Calculation: Metric Calculation YTD percentage spend in each category = YTD monetary expense in that category / YTD overall monetary expense 7. Traffic Light Rules: Not applicable 41
42 HSE HEALTH STATISTICS GLOSSARY OF TERMS Metric Name: R3 Activity vs. Service Plan Description: Graphical representation of the YTD performance of the hospital as a measure of percentage of cases completed above or below their service plan in the following groupings: Total, OPD Cases, Daycases, Inpatients. 1. Source of Data Inputs: Business Intelligence Unit Acute Services Team 2. Reporting Frequency: Monthly 3. Owner: Business Intelligence Unit Acute Services Team 4. Reporting Entity: Business Intelligence Unit Acute Services Team 5. Target: Not applicable 6. Calculation: Metric Calculation Total = (Total Number of Cases Treated Overall - Total Service Plan Target Number of Cases Overall) / Total Number of Cases Treated Overall * 100 By Category = (Total Number of Cases Treated in that Category - Total Service Plan Target Number of Cases in that Category)/ Total Number of Cases Treated in that Category * Traffic Light Rules: Not applicable 42
43 HSE HEALTH STATISTICS GLOSSARY OF TERMS Metric Name: R4 Staff WTE Variance from Staff Ceiling Description: Graphical representation of the number of WTE staff employed by the hospital as a measure of variance from their staff ceiling over a rolling three month time period. 1. Source of Data Inputs: HSE National Employment Monitoring Unit (NEMU) 2. Reporting Frequency: Monthly 3. Owner: NEMU 4. Reporting Entity: NEMU 5. Target: Absolute target based upon the percentage variance of hospital WTE staff complement from staff ceiling. Source: All hospitals should work within their staff ceilings. 6. Calculation: Metric Calculation Variance = (Actual WTE - Ceiling WTE) / Actual WTE Traffic Light Calculation n = (Variance / Ceiling WTE) * Traffic Light Rules: If n is greater than or equal to 1.5% then the traffic light is Red; If n is greater than or equal to 0.05% but less than 1.5 % then the traffic light is Amber; If n is less than 0.05% then the traffic light is Green. Weighting = High (4) 43
44 HSE HEALTH STATISTICS GLOSSARY OF TERMS Metric Name: R5 Percentage of Staff Hours Lost Due to Absenteeism Description: Graphical representation of the amount of time lost due to absenteeism, shown as a percentage of the total amount of available time for work. This is broken down between Uncertified, Certified and Long Term absenteeism and is shown both in total and for the following staff groupings: Medical / Dental, Nursing, Health and Social Care Professionals, Management / Administration, General Support Staff, Other Patient and Client Care. Note: While Uncertified, Certified and Long term leave are displayed the data is scored on certified and uncertified leave only. 1. Source of Data Inputs: Section 1.3 of the HealthStat monthly hospital template (see Appendix B). 2. Reporting Frequency: Monthly 3. Owner: Business Intelligence Unit HealthStat 4. Reporting Entity: Hospitals 5. Target: 3.5% Absenteeism or less Source: This is the latest Absenteeism target as defined and communicated by the HSE. 6. Calculation: Metric Calculation Total Absenteeism = (Total Hours Absent for uncertified and certified leave / Total Hours Available) * 100. Staff Group Absenteeism = (Hours Absent in that Staff Group / Hours Available in that Staff Group) * 100. Traffic Light Calculation n = (Total Absenteeism / 3.5) * Traffic Light Rules: If n is 135% or more then the traffic light is Red; If n is between 115% and less than 135% then the traffic light is Amber; If n is less than 115% then the traffic light is Green. Weighting = High (4) 44
45 HSE HEALTH STATISTICS GLOSSARY OF TERMS Metric Name: R6 Distribution of Staff Description: Graphical representation of the distribution of staff amongst the same staff groupings as listed in R5 above in addition to Agency staff. This is shown for each grouping as a percentage of the total number of WTE staff employed for each hospital. 1. Source of Data Inputs: HSE Performance Management Report 2. Reporting Frequency: Monthly 3. Owner: NEMU 4. Reporting Entity: NEMU Hospitals 5. Target: Not applicable As a means of drawing some comparison however, the group average staff distribution across each category is represented by a thin blue dotted line. 6. Calculation: Metric Calculation Percentage of staff in category = (number of staff in category / total number of staff (including agency)) * Traffic Light Rules: Not applicable 45
46 HSE HEALTH STATISTICS GLOSSARY OF TERMS Metric Name: R7a Allied Health Professional New to Return Patient Attendances Description: Graphical representation of ratio of new to return visits seen by Allied Health Professionals (AHPs) in the hospital for the previous month. This is shown both overall and by the following professions: Social Work Occupational Therapist Physiotherapy 1. Source of Data Inputs: Section 1.4 of the HealthStat monthly hospital template (see Appendix B) 2. Reporting Frequency: Monthly 3. Owner: Business Intelligence Unit HealthStat 4. Reporting Entity: Hospitals 5. Target: Not applicable - As a means of drawing some comparison however, the group average ratio is shown both overall and by specialty grouping by a thin blue dotted line. 6. Calculation: Metric Calculation Overall New to Return Visit Ratio = 1:(Total Number of Return Visits / Total Number of New Visits) Profession New to Return Visit Ratio = 1: (Total Number of Return Visits in that Profession / Total Number of New Visits in that Profession) 7. Traffic Light Rules: Not applicable 46
47 HSE HEALTH STATISTICS GLOSSARY OF TERMS Metric Name: R7b Number of New and Return Visits per Staff Delivering Service Description: Graphical representation of the number of new and return patient visits undertaken by Allied Healthcare Professionals (AHP) in the hospital. This is measured for Social Workers, Occupational Therapists and Physiotherapists and aggregated for an Overall Measure. 1. Source of Data Inputs: Section 1.4 of the HealthStat monthly hospital template (see Appendix B) for the number of new and return visits, the number of patients seen, and the number of staff ( Social Workers, Occupational Therapists and Physiotherapists) delivering service. 2. Reporting Frequency: Monthly 3. Owner: Business Intelligence Unit HealthStat 4. Reporting Entity: Hospitals 5. Target: Overall number of visits per staff delivering service should be comparable to the Best in Ireland number of visits. Source: There is no formal specification or set of comparisons against which to derive an absolute target so in this instance performance is measured against Best in Ireland performance. 6. Calculation: Metric Calculation Overall number of visits per Staff Delivering Service = (Total number of new visits + Total number of return visits) / Total number of AHP Staff Delivering Service Profession number of visits per Staff Delivering Service = Total number of visits (new + return) for that profession / Total number of AHP Staff Delivering Service Traffic Light Calculation Not applicable 7. Traffic Light Rules: 47
48 HSE HEALTH STATISTICS GLOSSARY OF TERMS Metric Name: R8a Total Hospital Diagnostic Activity (Radiology) Description: Graphical representation of the absolute number of diagnostic imaging undertaken within the hospital during the previous month. This is categorised as CT Scan, X-Ray/Plain Film, Ultrasound, PET Scans, Nuclear Medicine, Neuro, MRI, Mamography, Interventional and CATH Labs, and is split between Internal, Outsourced and Insourced activity. Note that CT and X-Ray/Plain Film are shown separately due to scaling issues. 1. Source of Data Inputs: Section 1.5 of the HealthStat monthly hospital template (see Appendix B) 2. Reporting Frequency: Monthly 3. Owner: Business Intelligence Unit HealthStat 4. Reporting Entity: Hospitals 5. Target: Not Applicable 6. Calculation: Metric Calculation Diagnostic Activity = Absolute number of diagnostic imaging undertaken within the hospital during the previous month 7. Traffic Light Rules: Not Applicable. 48
49 HSE HEALTH STATISTICS GLOSSARY OF TERMS Metric Name: R8b Hospital Diagnostic Activity per Whole Time Equivalent Radiographer and Radiologist Description: Graphical representation of the amount of imaging diagnostic activity per radiographer and per radiologist. 1. Source of Data Inputs: Section 1.5 of the HealthStat Monthly Hospital Template (see Appendix B) for the amount of imaging diagnostic activity. Section 1.1 of the HealthStat Monthly Hospital Template (see Appendix B) for the number of WTE Radiologists. NEMU Monthly Data Return for the number of WTE Radiographers. 2. Reporting Frequency: Monthly 3. Owner: Business Intelligence Unit HealthStat 4. Reporting Entity: Hospitals NEMU 5. Target: Not applicable As a means of drawing some comparison, the group average for diagnostic activity per radiographer and per radiologist are represented by a thin blue dotted line 6. Calculation: Metric Calculation Total Diagnostic Activity per Radiographer = (Sum of all internal and insourced imaging activity) / Total number of WTE Radiographers Total Diagnostic Activity per Radiologist = (Sum of all internal and outsourced imaging activity) / Total number of WTE Radiologists 7. Traffic Light Rules: Not applicable. 49
50 HSE HEALTH STATISTICS GLOSSARY OF TERMS Metric Name: R8c Total Hospital Diagnostic Activity per Patient (Radiology) Description: Graphical representation of the amount of imaging diagnostic activity per patient. 1. Source of Data Inputs: Section 1.5 of the HealthStat Monthly Hospital Template (see Appendix B) for the amount of imaging diagnostic activity. Business Intelligence Unit Acute Services Team Monthly Data Return for number of patients. 2. Reporting Frequency: Monthly 3. Owner: Business Intelligence Unit HealthStat 4. Reporting Entity: Hospitals Business Intelligence Unit Acute Services Team 5. Target: Not applicable As a means of drawing some comparison, the group average for diagnostic activity per patient is represented. 6. Calculation: Metric Calculation Total Diagnostic Activity per Patient = Sum of all internal and outsourced imaging activity / Total number of Inpatients, Daycases, Outpatients and ED attendances 7. Traffic Light Rules: Not applicable 50
51 HSE HEALTH STATISTICS GLOSSARY OF TERMS Metric Name: R9a OPD Consultant Led Clinics Number of New Patients Seen per Whole Time Equivalent Consultant Description: Graphical representation of the number of new patients seen per whole time equivalent at the Consultant led OPD Clinics undertaken in the hospital for the previous month. This is shown both overall and by the following specialty groupings: Paediatrics Otolaryngology Orthopaedics Ophthalmology Medicine Surgery Note that Other consultant WTE numbers and clinic details are excluded from this calculation due to large discrepancies between hospitals in this category. 1. Source of Data Inputs: Business Intelligence Unit Acute Services Team Monthly Data Return for the number of new patients seen at each consultant led clinic. Section 1.1 of the HealthStat Monthly Hospital Template (see Appendix B) for the number of consultants. 2. Reporting Frequency: Monthly 3. Owner: Business Intelligence Unit 4. Reporting Entity: Hospitals Business Intelligence Unit Acute Services Team 5. Target: Overall number of new patients seen per WTE should be comparable to the Best in Ireland number of new patients seen. Source: There is no formal specification or set of comparisons against which to derive an absolute target so in this instance performance is measured against Best in Ireland performance. 6. Calculation: Metric Calculation Overall Number of new patients = (Overall Number of New Patients / Total Number of WTE Consultants) No. of new patients in that Speciality = (Number of new patients in that speciality / Total Number of WTE Consultants in that Speciality Traffic Light Calculation n = (Overall number of new patients/ Best in Ireland number of new patients) * Traffic Light Rules: If n is 65% or less then the traffic light is Red; If n is greater than 65% but less than or equal to 85% then the traffic light is Amber; 51 If n is greater than 85% then the traffic light is Green. Weighting = High (4)
52 HSE HEALTH STATISTICS GLOSSARY OF TERMS Metric Name: R9b OPD Consultant Led Clinics Distribution of Patient Attendance Description: Graphical representation of ratio of new to return patients at the Consultant led OPD Clinics undertaken in the hospital for the previous month. This is shown both overall and by the following specialty groupings: Paediatrics Otolaryngology Orthopaedics Ophthalmology General Medicine Note that Other consultant WTE numbers and clinic details are excluded from this calculation due to large discrepancies between hospitals in this category. 1. Source of Data Inputs: Business Intelligence Unit Acute Services Team Monthly Data Return 2. Reporting Frequency: Monthly 3. Owner: Business Intelligence Unit Acute Services Team 4. Reporting Entity: Business Intelligence Unit Acute Services Team 5. Target: Not applicable 6. Calculation: Metric Calculation Overall New to Return Ratio = 1:(Total Number of Return Patients / Total Number of New Patients) Speciality New to Return Ratio = 1: (Total Number of Return Patients in that Speciality / Total Number of New Patients in that Speciality) 7. Traffic Light Rules: Not applicable 52
53 HSE HEALTH STATISTICS GLOSSARY OF TERMS Metric Name: R9c OPD Consultant Led Clinics Percentage of Patients that Did Not Attend Description: Graphical representation the percentage of Did Not Attends (DNA) at the Consultant led OPD Clinics undertaken in the hospital for the previous month. This is shown both overall and by the following specialty groupings: Paediatrics Otolaryngology Orthopaedics Ophthalmology General Medicine Note that Other consultant WTE numbers and clinic details are excluded from this calculation due to large discrepancies between hospitals in this category. 1. Source of Data Inputs: Business Intelligence Unit Acute Services Team Monthly Data Return 2. Reporting Frequency: Monthly 3. Owner: Business Intelligence Unit Acute Services Team 4. Reporting Entity: Business Intelligence Unit Acute Services Team 5. Target: An absolute target of 10% has been set Source: This target is not formally specified but has been set by HealthStat to 10% using as a basis of assessments the current performance of Irish hospitals, and the performance and targets for OPD DNA s in other countries. 6. Calculation: Metric Calculation Percentage DNA = (Total Number of DNA / sum (Total Number of New + Return +DNA)) * 100 Traffic Light Calculation n = (Percentage DNA / 10%) * Traffic Light Rules: If n is 135% or more then the traffic light is Red; If n is greater than or equal to 115% but less than 135% then the traffic light is Amber; If n is less than 115% then the traffic light is Green. Weighting = Low (1) 53
54 HSE HEALTH STATISTICS GLOSSARY OF TERMS Metric Name: R10a Public Private Split of Activity Description: Graphical representation of the split of hospital activity (daycase, inpatient elective and inpatient non-elective) between public and private patients. This is shown both in total and by the following specialty groupings: Paediatrics Otolaryngology Orthopaedics Ophthalmology General Medicine 1. Source of Data Inputs: Business Intelligence Unit Acute Services Team Monthly Data Return 2. Reporting Frequency: Monthly 3. Owner: Business Intelligence Unit Acute Services Team 4. Reporting Entity: Business Intelligence Unit Acute Services Team 5. Target: NA 6. Calculation: Metric Calculation Total percentage of public patients = [(Total number of public patients / Total number of public patients + Total number of private patients)] * 100 Traffic Light Calculation NA 8. Traffic Light Rules NA 54
55 HSE HEALTH STATISTICS GLOSSARY OF TERMS Metric Name: R10b Consultant Contracts Description: Graphical representation of the compliance of consultants with the public:private patient ratio stipulated in their contract. This is shown for inpatients and daycases respectively and refers to aggregate performance in the hospital. 1. Source of Data Inputs: HIPE Report from Individual Hospitals 2. Reporting Frequency: Quarterly 3. Owner: BIU 4. Reporting Entity: Hospitals 5. Target: 90% of consultants should be within their contracted ratio for public:private inpatient mix. [Note: target on inpatients only] Source: This target of 90% compliance has been set by HealthStat to take into consideration the difficulty in balancing caseload on a quarterly basis. 6. Calculation: Metric Calculation The aggregate percentage of consultants who are within their contracted public:private patient ratio is shown for Inpatient and Daycase categories per hospital. Traffic Light Calculation n = [(inpatient compliance percentage) / (90%)] * Traffic Light Rules: The traffic lights are based upon the absolute target detailed in 5 as calculated in 6. If n is 80% or less then Traffic Light is Red; If n is greater than 80% but less than or equal to 95% then Traffic Light is Amber; If n is greater than 95% then Traffic Light is Green. Weighting = High(4) 55
56 Appendix A: List of Hospitals The following Appendix lists the 29 acute casemix hospitals currently incorporated in the HealthStat hospital dashboard. Table A1: List of Acute Hospitals Currently Incorporated into HealthStat. Acute Hospitals in HealtStat Adelaide & Meath inc. National Children s Hospital, (AMNCH - Tallaght) Beaumont Hospital Cavan General Hospital Connolly Hospital, Blanchardstown Cork University Hospital Galway University Hospital Kerry General Hospital (Tralee) Letterkenny General Hospital Louth County Hospital, Dundalk Mallow General Hospital Mater Hospital Mayo General Hospital Mercy University Hospital Merlin Park University Hospital Mid Western Regional Hospital, Dooradoyle (Limerick Regional) Midland Regional Hospital at Mullingar Midland Regional Hospital at Portlaoise Midland Regional Hospital at Tullamore Our Lady of Lourdes Hospital, Drogheda 56
57 Our Lady s Hospital, Navan Portiuncula Hospital Sligo General Hospital South Infirmary Victoria Hospital, Cork St Colmcille s Hospital, Loughlinstown St James s Hospital St Luke s General Hospital, Kilkenny St Vincent s University Hospital Waterford Regional Hospital Wexford General Hospital 57
58 Appendix B: HealthStat Monthly Hospital Template The following Appendix contains a copy of the HealthStat Monthly Hospital Template, which each of the participating hospitals completes in order to provide some 100 of the 350 data items used to generate the Dashboards. HealthStat Monthly Hospital Template Adelaide, Meath inc. National Childrens Hospital, Tallaght Dear colleague, The HSE has developed an across the board performance metrics process called HealthStat, with a range of both aggregate/top line, and operational detail. As part of this process the HSE requires you to provide some additional monthly information that will be incorporated with data from other existing sources (i.e. NEMU, Casemix, PMU, Corporate Finance) to produce your hospital dashboard. In this Template we are requesting data from you for August This additional information is to be recorded in the following Excel template (which also includes guidance as to how it will be completed). It is required to be signed off by you as hospital CEO/GM, and returned to Healthstat@hse.ie with a copy to your network manager. s will be considered as a valid sign-off with the excel template attached and received direct from you or with your name in Cc. It is advised that each hospital CEO/GM take the opportunity to inform their consulting teams that the information is being collected. If you have any queries, then please also refer to the above or call Note that the completed template will be supplemented with the other validated sources to produce your hospital dashboard. August 2009 data is due by close of business 5th October NEW DATA ITEM. Section 1.4 Please provide the number of WTEs (including managers) that produced the activity for the month reported. Examples are provided to assist. PLEASE NOTE. metric R10a shows the throughput of new patients per WTE consultant. The graph originates from template section 1.1 Hospital Staff (consultant WTE) and section 1.8 Hospital OPD Consultant led clinics (new patients). It is essential that the WTE consultants and the activity new patients are matched. Both should be mapped according to Appendix D in the HealthStat for Hospitals User Guide (available on e.g. a Consultant Dermatologist should be mapped to WTE Medicine in 1.1 and the associated Dermatology OPD clinic activity mapped to Medicine in 1.8. Visiting consultants that produce OPD activity should also be included with the appropriate WTE portion entered in 1.1 and activity in 1.8. If you have any queries, then please HealthStat@hse.ie or call Many thanks for your continued help and support. Mark Turner Assistant National Director Decision Support 58


59 59


60 60
HealthStat for Hospitals Guide
 HealthStat for Hospitals Guide August 2012 Version History The table below outlines the changes that have been made to the dashboard and as such this latest version of the HealthStat for Hospitals Guide
RTT Exception Report
 Appendix 3 RTT Exception Report 1. Purpose To provide a summary of factors impacting on 18 week RTT performance and a revised forecast of red rated performance for Quarter 2 2015/16 for the admitted pathway.
Statistical Press Notice NHS referral to treatment (RTT) waiting times data November 2016
 waiting times data November 2016") Statistical Press Notice NHS referral to treatment (RTT) waiting times data November 2016 NHS England released statistics today on referral to treatment (RTT) waiting times for consultant-led elective
Statistical Press Notice NHS referral to treatment (RTT) waiting times data November 2016 NHS England released statistics today on referral to treatment (RTT) waiting times for consultant-led elective
Statistical Press Notice NHS referral to treatment (RTT) waiting times data August 2017
 waiting times data August 2017") Thursday 12 October 2017 Statistical Press Notice NHS referral to treatment (RTT) waiting times data August 2017 NHS England released statistics today on referral to treatment (RTT) waiting times for consultant-led
Thursday 12 October 2017 Statistical Press Notice NHS referral to treatment (RTT) waiting times data August 2017 NHS England released statistics today on referral to treatment (RTT) waiting times for consultant-led
Statistical Press Notice NHS referral to treatment (RTT) waiting times data July 2018
 waiting times data July 2018") Thursday 13 September 2018 Statistical Press Notice NHS referral to treatment (RTT) waiting times data July 2018 NHS England released statistics today on referral to treatment (RTT) waiting times for consultant-led
Thursday 13 September 2018 Statistical Press Notice NHS referral to treatment (RTT) waiting times data July 2018 NHS England released statistics today on referral to treatment (RTT) waiting times for consultant-led
Statistical Press Notice NHS referral to treatment (RTT) waiting times data July 2017
 waiting times data July 2017") Thursday 14 September 2017 Statistical Press Notice NHS referral to treatment (RTT) waiting times data July 2017 NHS England released statistics today on referral to treatment (RTT) waiting times for consultant-led
Thursday 14 September 2017 Statistical Press Notice NHS referral to treatment (RTT) waiting times data July 2017 NHS England released statistics today on referral to treatment (RTT) waiting times for consultant-led
Trust Board Meeting in Public: Wednesday 11 July 2018 TB
 Trust Board Meeting in Public: Wednesday 11 July 2018 Title Integrated Performance Report: Month 2 Status History For information. The report provides a summary of the Trust s performance against a range
Ayrshire and Arran NHS Board
 Paper 08 Ayrshire and Arran NHS Board Monday 25 November 2013 Waiting Times Report Author: Fraser Doris, Planning and Performance Officer Sponsoring Director: Liz Moore, Director of Acute Services Date:
STATISTICAL PRESS NOTICE NHS REFERRAL TO TREATMENT (RTT) WAITING TIMES DATA JANUARY 2013
 WAITING TIMES DATA JANUARY 2013") STATISTICAL PRESS NOTICE NHS REFERRAL TO TREATMENT (RTT) WAITING TIMES DATA JANUARY 2013 Data are published on consultant-led Referral to Treatment (RTT) waiting times for patients who were treated during
STATISTICAL PRESS NOTICE NHS REFERRAL TO TREATMENT (RTT) WAITING TIMES DATA JANUARY 2013 Data are published on consultant-led Referral to Treatment (RTT) waiting times for patients who were treated during
Imaging Performance Partnership. A Data Driven Approach to Your Imaging Program Strategy
 Imaging Performance Partnership A Data Driven Approach to Your Imaging Program Strategy PROGRAM GOALS Imaging Performance Partnership has a wide array of tools to support various aspects of imaging business
Challenges and opportunities in heart failure treatment: Irish example
 Challenges and opportunities in heart failure treatment: Irish example Joe Gallagher University College Dublin Ireland The Irish healthcare system Mixed public and private funding Primary healthcare is
Referral to treatment (RTT) waiting times statistics for consultant-led elective care 2014 Annual Report
 waiting times statistics for consultant-led elective care 2014 Annual Report") Referral to treatment (RTT) waiting times statistics for consultant-led elective care 2014 Annual Report 1 Referral to treatment (RTT) waiting times statistics for consultant-led elective care 2014 Annual
Referral to treatment (RTT) waiting times statistics for consultant-led elective care 2014 Annual Report 1 Referral to treatment (RTT) waiting times statistics for consultant-led elective care 2014 Annual
Tier 3 and 4 healthy weight and obesity services in Kent
 Tier 3 and 4 healthy weight and obesity services in Kent Model user guide September 2016 1 Background Tier 3 healthy weight services for Kent residents are currently commissioned by Kent County Council
Aneurin Bevan Health Board Access 2009 Performance Report
 Access 2009 Performance Report 1. Introduction This paper outlines current progress in meeting the Access 2009 Referral to Treatment Time 26 week target. It highlights actions taken to date, key challenges
Referral to treatment consultant-led waiting times
 Referral to treatment consultant-led waiting times How to Measure DH INFORMATION READER BOX Policy Clinical Estates HR / Workforce Commissioner Development IM & T Management Provider Development Finance
Waiting Times for Suspected and Diagnosed Cancer Patients
 Waiting Times for Suspected and Diagnosed Cancer Patients 2015-16 Annual Report Waiting Times for Suspected and Diagnosed Cancer Patients 1 Waiting Times for Suspected and Diagnosed Cancer Patients Prepared
Aligning the Publication of Performance Data Statistics Consultation
 Aligning the Publication of Performance Data Statistics Consultation NHS England INFORMATION READER BOX Directorate Medical Commissioning Operations Patients and Information Nursing Trans. & Corp. Ops.
Enc 9 Appendix 5 RTT Recovery Plan June 2015 PROGRESS UPDATE MANAGE R LEAD RISKS TO DELIVERY OF ACTION COMPLETION ON DATE NUMBER ACTION EXEC LEAD
 Enc 9 Appendix 5 RTT Recovery Plan June 2015 Status Key 5 Complete 4 On track 3 Some delay-expect to complete as planned or implemented but not consistently delivering 2 Significant delay unlikely to be
Alcohol-related Hospital Statistics Scotland 2011/12
 Publication Report Alcohol-related Hospital Statistics Scotland 2011/12 Publication date 24th September 2013 A National Statistics Publication for Scotland Contents Introduction... 2 Key points... 3 Results
GOVERNING BODY MEETING in Public 22 February 2017 Agenda Item 3.4
 GOVERNING BODY MEETING in Public 22 February 2017 Paper Title Purpose of paper Redesign of Services for Frail Older People in Eastern Cheshire To seek approval from Governing Body for the redesign of services
REPORT TO CLINICAL COMMISSIONING GROUP
 REPORT TO CLINICAL COMMISSIONING GROUP 12th December 2012 Agenda No. 6.2 Title of Document: Report Author/s: Lead Director/ Clinical Lead: Contact details: Commissioning Model for Dementia Care Dr Aryan
Consultation on publication of new cancer waiting times statistics Summary Feedback Report
 Consultation on publication of new cancer waiting times statistics Summary Feedback Report Information Services Division (ISD) NHS National Services Scotland March 2010 An electronic version of this document
STATISTICAL PRESS NOTICE NHS REFERRAL TO TREATMENT (RTT) WAITING TIMES DATA MAY 2011
 WAITING TIMES DATA MAY 2011") STATISTICAL PRESS NOTICE NHS REFERRAL TO TREATMENT (RTT) WAITING TIMES DATA MAY 2011 Main Points Data are published on consultant-led Referral to Treatment (RTT) waiting times for patients who were treated
STATISTICAL PRESS NOTICE NHS REFERRAL TO TREATMENT (RTT) WAITING TIMES DATA MAY 2011 Main Points Data are published on consultant-led Referral to Treatment (RTT) waiting times for patients who were treated
18 WEEK RTT RECOVERY PLAN. April 2015
 18 WEEK RTT RECOVERY PLAN April 2015 1. Background WHHT is not currently compliant with the national RTT standards which require 95% of non-admitted and 90% of admitted patients to receive their elective
What Computer Tools to Use for Your Quality and Safety Program
 What Computer Tools to Use for Your Quality and Safety Program Lincoln L. Berland, M.D., F.A.C.R. University of Alabama at Birmingham Disclosure Consultant to Nuance, Inc. Learning Objectives Understand
Report to Trust Board 26/01/2017. Report Title Operational Performance Report - December 2016 & Quarter /17 Report from
 Item 10 Report to Trust Board 26/01/2017 Report Title Operational Performance Report - December 2016 & Quarter 3 2016/17 Report from John Quinn, Director of Operations Prepared by Stephen Chinn, Senior
WELSH INFORMATION STANDARDS BOARD
 WELSH INFORMATION STANDARDS BOARD DSC Notice: DSCN / 01 Date of Issue: 22 nd March Ministerial / Official Letter: AC/AS/14/080/A9552379 Subject: Diagnostic and Therapy Services Waiting Times Return Sponsor:
NORTHERN HEALTH AND SOCIAL CARE TRUST. Waiting Times Summary Report
 NORTHERN HEALTH AND SOCIAL CARE TRUST Waiting Times Summary Report April 2014 1 Waiting Times The Northern Health & Social Care Trust monitors waiting time performance against a number of Departmental
Trust Board of Directors Public. Denise Gale. For Assurance and Information NOT APPLICABLE NOT APPLICABLE NOT APPLICABLE NOT APPLICABLE
 NLG(18)014 DATE OF MEETING 30 January 2018 REPORT FOR Trust Board of Directors Public REPORT FROM Richard Sunley, Deputy Chief Executive CONTACT OFFICER Denise Gale SUBJECT Cancer Performance and Backlog
The European Board of Urology
 Page 1 of 15 The European Board of Urology Sub-specialty certification application: Prostate cancer, A - General information A1 - APPLICATION IDENTIFICATION 1a. Application code blank 1b. EBU internal
KPI s September Megan Boivin Operations Manager 15 October KPI s HAC report 18/10/2007 Operations Manager : Megan Boivin
 KPI s September 27 Megan Boivin Operations Manager 15 October 27 KPI s HAC report 18/1/27 Operations Manager : Megan Boivin 63. Dec-6 May-6 Sep-7 KEY PERFORMANCE INDICATORS Month Year to date Month Year
Connolly Hospital / Dublin NW Dementia Project. Integrating care for People with Dementia Dr. Siobhan Kennelly, Project Lead
 Connolly Hospital / Dublin NW Dementia Project Integrating care for People with Dementia Dr. Siobhan Kennelly, Project Lead Background First National Audit of Dementia Care in Acute Hospitals (INAD) (2014)
Richard Watson, Chief Transformation Officer. Dr P Holloway, GP Clinical Lead for Cancer Lisa Parrish, Senior Transformation Lead
 GOVERNING BODY Agenda Item No. 08 Reference No. IESCCG 18-02 Date. 23 January 2018 Title Lead Chief Officer Author(s) Purpose Cancer Services Update Richard Watson, Chief Transformation Officer Dr P Holloway,
ALCOHOL AND DRUGS PLANNING FRAMEWORK
 ALCOHOL AND DRUGS PLANNING FRAMEWORK 1. NATIONAL CONTEXT 1.1 Scotland continues to have the highest alcohol and drug-related death rates in the UK with drug and alcohol problems particularly affecting
Vision for quality: A framework for action - technical document
 3. Frailty Vision for quality: A framework for action - technical document Contents 1.0 Introduction 1 2.0 The current situation in Warwickshire North 2 3.0 The case for change 4 4.0 Views and opinions
National Drug and Alcohol Treatment Waiting Times
 National Drug and Alcohol Treatment Waiting Times 1 October 31 December 2017 Publication date 27 March 2018 A National Statistics publication for Scotland This is a National Statistics Publication National
Standard Operating Procedure: Early Intervention in Psychosis Access Times
 Corporate Standard Operating Procedure: Early Intervention in Psychosis Access Times Document Control Summary Status: New Version: V1.0 Date: Author/Owner: Rob Abell, Senior Performance Development Manager
Palliative Care Operational Plan 2015
 Palliative Care Operational Plan 2015 2014 Palliative Care Priorities Ensure effective and timely access to palliative care services Meet the identified deficit in palliative care beds in West / North
MCIP Recruitment Pack
 MCIP Recruitment Pack Page 1 of 13 Welcome Thank you for the interest you have shown in the MCIP Programme. An exciting partnership has been established to redesign cancer care in Manchester. Funded by
NHS Wirral Clinical Commissioning Group Old Market House Hamilton Street Birkenhead Wirral CH41 5AL Tel:
 Our Ref: ID 834 NHS Wirral Clinical Commissioning Group Old Market House Hamilton Street Birkenhead Wirral CH41 5AL Tel: 0151 541 5830 Re: Freedom of Information Request Thank you for your request for
Progress in improving cancer services and outcomes in England. Report. Department of Health, NHS England and Public Health England
 Report by the Comptroller and Auditor General Department of Health, NHS England and Public Health England Progress in improving cancer services and outcomes in England HC 949 SESSION 2014-15 15 JANUARY
Costing report: Lipid modification Implementing the NICE guideline on lipid modification (CG181)
") Putting NICE guidance into practice Costing report: Lipid modification Implementing the NICE guideline on lipid modification (CG181) Published: July 2014 This costing report accompanies Lipid modification:
Putting NICE guidance into practice Costing report: Lipid modification Implementing the NICE guideline on lipid modification (CG181) Published: July 2014 This costing report accompanies Lipid modification:
Costing tool: Osteoarthritis Implementing the NICE guideline on osteoarthritis (CG177)
") Putting NICE guidance into practice Costing tool: Osteoarthritis Implementing the NICE guideline on osteoarthritis (CG177) Published: February 2014 This costing report accompanies the clinical guideline
Putting NICE guidance into practice Costing tool: Osteoarthritis Implementing the NICE guideline on osteoarthritis (CG177) Published: February 2014 This costing report accompanies the clinical guideline
Trust Board meeting in Public: Wednesday 14 November 2018 TB
 Trust Board meeting in Public: Wednesday 14 November 20 Title Integrated Performance Report: Month 6 Status History For information. The report provides a summary of the Trust s performance against a range
NHS Rotherham Clinical Commissioning Group
 NHS Rotherham Clinical Commissioning Group Operational Executive: 2 nd November 2015 Governing Body: 4 th November 2015 Review of Stroke Care Pathway GP Lead: Dr Phil Birks Lead Executive: Keely Firth
NATIONAL REHABILITATION HOSPITAL SPINAL CORD SYSTEM OF CARE (SCSC) OUTPATIENT SCOPE OF SERVICE
 OUTPATIENT SCOPE OF SERVICE") NATIONAL REHABILITATION HOSPITAL SPINAL CORD SYSTEM OF CARE (SCSC) OUTPATIENT SCOPE OF SERVICE Introduction: The Spinal Cord System of Care (SCSC) at the National Rehabilitation Hospital (NRH) provides
NATIONAL REHABILITATION HOSPITAL SPINAL CORD SYSTEM OF CARE (SCSC) OUTPATIENT SCOPE OF SERVICE Introduction: The Spinal Cord System of Care (SCSC) at the National Rehabilitation Hospital (NRH) provides
Therapy Report. Sentinel Stroke National Audit Programme (SSNAP)
") Therapy Report Sentinel Stroke National Audit Programme (SSNAP) This report was authored by the Sentinel Stroke National Audit Programme (SSNAP) helpdesk. www.strokeaudit.org SSNAP email ssnap@rcplondon.ac.uk
Therapy Report Sentinel Stroke National Audit Programme (SSNAP) This report was authored by the Sentinel Stroke National Audit Programme (SSNAP) helpdesk. www.strokeaudit.org SSNAP email ssnap@rcplondon.ac.uk
National Drug and Alcohol Treatment Waiting Times Report
 Publication Report National Drug and Alcohol Treatment Waiting Times Report October December 2016 Publication Date 28 March 2017 A National Statistics Publication for Scotland Contents Introduction...
Report by the Comptroller and. SesSIon January Improving Dementia Services in England an Interim Report
 Report by the Comptroller and Auditor General HC 82 SesSIon 2009 2010 14 January 2010 Improving Dementia Services in England an Interim Report 4 Summary Improving Dementia Services in England an Interim
Stratification Variables
 Stratification Variables The ACHS, in collaboration with relevant medical colleges, associations and specialty societies have developed the following stratification variables to enable like organisations
Report Number dchp 29/2014 Dundee CHP Committee 19 June 2014 MUSCULOSKELETAL ADVICE AND TRIAGE SERVICE (MATS)
") Item 12.2.1 Report Number dchp 29/2014 Dundee CHP Committee 19 June 2014 MUSCULOSKELETAL ADVICE AND TRIAGE SERVICE (MATS) 1. SITUATION AND BACKGROUND NHS Tayside implemented MATS on 11 November 2013, with
Item 12.2.1 Report Number dchp 29/2014 Dundee CHP Committee 19 June 2014 MUSCULOSKELETAL ADVICE AND TRIAGE SERVICE (MATS) 1. SITUATION AND BACKGROUND NHS Tayside implemented MATS on 11 November 2013, with
Brighton and Sussex University Hospitals NHS Trust Board of Directors. Mark Smith Chief Operating Officer
 Meeting: Brighton and Sussex University Hospitals NHS Trust Board of Directors Date: 24 th August 2015 Board Sponsor: Paper Author: Subject: Mark Smith Chief Operating Officer Clinical Director and Directorate
Project Brief. New Cancer Waiting Times. Data Quality Assurance Audit
 Project Brief New Cancer Waiting Times Data Quality Assurance Audit Version 1.0 Contents 1 Introduction...3 2 Data Recording and Submitting...4 3 Data Quality Assurance Audit...4 3.1 Areas of Investigation:...4
Scottish Bowel Screening Programme Statistics
 Publication Report Scottish Bowel Screening Programme Statistics For invitations between 1 November 2010 and 31 October 2012 Publication date 27 August 2013 A National Statistics Publication for Scotland
Mirus Metrics Process Companion
 Mirus Metrics Process Companion Contents Getting Started... 1 Executive Summary... 2 Key Functions... 3 Glossary... 4 Care Revenue... 5 Performance... 7 Planning (Mandatory Assessments)... 13 Planning
National Drug and Alcohol Treatment Waiting Times
 National Drug and Alcohol Treatment Waiting Times 1 April 30 June 2018 Publication date 25 September 2018 A National Statistics publication for Scotland This is a National Statistics Publication National
Performance Dashboard for the Substance Abuse Treatment System in Los Angeles
 Performance Dashboard for the Substance Abuse Treatment System in Los Angeles Abdullah Alibrahim, Shinyi Wu, PhD and Erick Guerrero PhD Epstein Industrial and Systems Engineering University of Southern
Dental Earnings and Expenses: Scotland, 2011/12
 Dental Earnings and Expenses: Published 25 October 2013 We are the trusted source of authoritative data and information relating to health and care. www.hscic.gov.uk enquiries@hscic.gov.uk Author: Responsible
Integrated Cancer Services Action Plan. Colchester Hospital University NHS Foundation Trust 31 March 2014
 Integrated Cancer Services Action Plan Colchester Hospital University NHS Foundation Trust 31 March KEY Implemented, clearly evidenced and externally approved On Track to deliver Some issues narrative
AROC Outcome Targets Report Inpatient Pathway 3
 AROC Outcome Targets Report Inpatient Pathway 3 Anywhere Hospital January 2013 December 2013 Australasian Faculty of Rehabilitation Medicine AROC impairment specific benchmarking process...3 Introducing
Briefing Paper. Single Cancer Pathway
 Briefing Paper Single Cancer Pathway Author: Tom Crosby, Clinical Director, Wales Cancer Network Owner: Wales Cancer Network Date: 27 th November 2017 Version: 1.0 Publication/ Distribution: Wales Cancer
Waverley Gate 2-4 Waterloo Place Edinburgh. Date 16/12/11 Your Ref Our Ref. Enquiries to Richard Mutch
 Lothian NHS Board Waverley Gate 2-4 Waterloo Place Edinburgh EH1 3EG Telephone 0131 536 9000 Fax 0131 536 9088 www.nhslothian.scot.nhs.uk Date 16/12/11 Your Ref Our Ref Enquiries to Richard Mutch Extension
AHP Musculoskeletal Service Redesign. Judith Reid MSc MMACP Consultant Physiotherapist in MSK NHS Ayrshire and Arran
 AHP Musculoskeletal Service Redesign Judith Reid MSc MMACP Consultant Physiotherapist in MSK NHS Ayrshire and Arran Local Drivers Routine referral practice Via acute care, duplication Long waiting times
Geriatric Emergency Management PLUS Program Costing Analysis at the Ottawa Hospital
 Geriatric Emergency Management PLUS Program Costing Analysis at the Ottawa Hospital Regional Geriatric Program of Eastern Ontario March 2015 Geriatric Emergency Management PLUS Program - Costing Analysis
National Cancer Patient Experience Survey Results. Milton Keynes University Hospital NHS Foundation Trust. Published July 2016
 National Cancer Patient Experience Survey 2015 Results Milton Keynes University Hospital NHS Foundation Trust Published July 2016 The National Cancer Patient Experience Survey is undertaken by Quality
Meeting the Future Challenge of Stroke
 Meeting the Future Challenge of Stroke Stroke Medicine Consultant Workforce Requirements 2011 201 Dr Christopher Price BASP Training and Education Committee Stroke Medicine Specialist Advisory Committee
NORTHERN HEALTH AND SOCIAL CARE TRUST
 NORTHERN HEALTH AND SOCIAL CARE TRUST Trust Corporate Performance Report June 2013 Date Issued: 24/07/13 Contents 1.0 Introduction / Summary 2.0 Commissioner Targets and Associated Activity 3.0 Access
The Galway Experience
 The Galway Experience Dr. Ruairi Waters 14.09.2018 Main acute hospital in West of Ireland Model 4 Hospital with 24/7 care Teaching Hospital (NUIG) Supra regional centre for cancer and cardiac services
DEMAND AND CAPACITY MODELLING
 DEMAND AND CAPACITY MODELLING How we used demand and capacity modelling to develop a robust and credible recovery plan Piers Young Deputy Chief Operating Officer (Elective Care) CONTENTS Brief history
abcdefghijklmnopqrstu
 CMO and Public Health Directorate Health Improvement Strategy Division Dear Colleague Scottish Abdominal Aortic Aneurysm Screening Programme This CEL outlines the plan for the implementation of the AAA
South Belfast Integrated Care Partnership. Transforming Delivery of Diabetes Care 2014
 South Belfast Integrated Care Partnership Transforming Delivery of Diabetes Care 2014 Background Context: Aims: Reduction in T2DM Earlier recognition of Type 1 diabetes in children Reduction in risk and
Primary Health Networks
 Primary Health Networks Drug and Alcohol Treatment Activity Work Plan 2016-17 to 2018-19 South Eastern Melbourne PHN When submitting this Activity Work Plan 2016-2018 to the Department of Health, the PHN
GOVERNING BODY REPORT
 GOVERNING BODY REPORT DATE OF MEETING: 20th September 2012 TITLE OF REPORT: KEY MESSAGES: NHS West Cheshire Clinical Commissioning Group has identified heart disease as one of its six strategic clinical
Primary Health Networks Greater Choice for At Home Palliative Care
 Primary Health Networks Greater Choice for At Home Palliative Care Brisbane South PHN When submitting the Greater Choice for At Home Palliative Care Activity Work Plan 2017-2018 to 2019-2020 to the Department
Dementia Post- Diagnostic Support
 Dementia Post- Diagnostic Support NHS Board Performance 2016/17 Publication date 5 February 2019 A Management Information publication for Scotland This is a Management Information publication Published
SELF ASSESSMENT REPORT (MULTI-DISCIPLINARY TEAM)
") SELF ASSESSMENT REPORT (MULTI-DISCIPLINARY TEAM) Network Trust MDT MDT Lead Clinician GMCN ROYAL WOLVERHAMPTON HOSPITALS The Royal Wolverhampton Hospitals Trust Lung MDT (11-2C-1) - 2011/12 Dr Angela Morgan
SELF ASSESSMENT REPORT (MULTI-DISCIPLINARY TEAM) Network Trust MDT MDT Lead Clinician GMCN ROYAL WOLVERHAMPTON HOSPITALS The Royal Wolverhampton Hospitals Trust Lung MDT (11-2C-1) - 2011/12 Dr Angela Morgan
Cancer Improvement Plan Update. September 2014
 Cancer Improvement Plan Update September 2014 1 Contents Page 1. Introduction 3 2. Key Achievements 4-5 3. Update on Independent Review Recommendations 6-13 4. Update on IST Recommendations 14-15 5. Update
Drug-Related Hospital Statistics Scotland 2014/15
 Publication Report Drug-Related Hospital Statistics Scotland 2014/15 Publication date 13 October 2015 A National Statistics Publication for Scotland Contents Introduction... 1 Key points... 2 Results and
MINUTE OF MEETING HELD ON 3 NOVEMBER 2008, ST ANDREW S HOUSE, EDINBURGH
 Scottish Government Health Department EMERGENCY ACCESS DELIVERY TEAM MINUTE OF MEETING HELD ON 3 NOVEMBER 2008, ST ANDREW S HOUSE, EDINBURGH Present: Tim Davison (Chair) Kathleen Bessos Dr. Anne Hendry
National Cancer Patient Experience Survey Results. University Hospitals of Leicester NHS Trust. Published July 2016
 National Cancer Patient Experience Survey 2015 Results University Hospitals of Leicester NHS Trust Published July 2016 Revised 17th August 2016 The National Cancer Patient Experience Survey is undertaken
Integrated Diabetes Care in Oxfordshire -patient's perspective. Avril Surridge
 Integrated Diabetes Care in Oxfordshire -patient's perspective Avril Surridge Today How does diabetes care in Oxfordshire look like from a patient s perspective? Good things What could be improved? National
Grommet insertion and adenoidectomy FOR CONSULTATION
 Grommet insertion and adenoidectomy FOR CONSULTATION 13 February 2013 Page 1 of 22 1 GROMMET INSERTION AND ADENOIDECTOMY... 3 1.1 Scope of HTA... 3 1.2 Surgical indications... 3 1.3 Surgical procedures,
CABINET PROCURING A SUBSTANCE MISUSE & COMMUNITY TREATMENT SERVICE IN RUTLAND
 CABINET Report No: 105/2017 PUBLIC REPORT 16 May 2017 PROCURING A SUBSTANCE MISUSE & COMMUNITY TREATMENT SERVICE IN RUTLAND Report of the Director of Public Health Strategic Aim: Safeguarding Key Decision:
National Cancer Patient Experience Survey Results. East Kent Hospitals University NHS Foundation Trust. Published July 2016
 National Cancer Patient Experience Survey 2015 Results East Kent Hospitals University NHS Foundation Trust Published July 2016 Revised 17th August 2016 The National Cancer Patient Experience Survey is
LCA Lung Clinical Forum. 21 st October 2014
 LCA Lung Clinical Forum 21 st October 2014 Welcome Dr Liz Sawicka Chair - LCA Lung Pathway Group Succession planning Dr Kate Haire Consultant in Public Health Medicine, LCA Commissioning Intentions for
Australian Sonographer Accreditation Registry (ASAR) Policy & Procedure 9 - Annual Reporting Requirements for Accredited Sonography Courses
 Policy & Procedure 9 - Annual Reporting Requirements for Accredited Sonography Courses") Sonography 1. Preamble ASAR s objective is to promote high standards of medical sonography in Australia which includes setting uniform, minimum standards of sonographer education by assessing and accrediting
Sonography 1. Preamble ASAR s objective is to promote high standards of medical sonography in Australia which includes setting uniform, minimum standards of sonographer education by assessing and accrediting
SCHEDULE 2 THE SERVICES
 04e SCHEDULE 2 THE SERVICES A. Service Specifications This is a non-mandatory model template for local population. Commissioners may retain the structure below, or may determine their own in accordance
2010 National Audit of Dementia (Care in General Hospitals) Guy's and St Thomas' NHS Foundation Trust
 Guy's and St Thomas' NHS Foundation Trust") Royal College of Psychiatrists 2010 National Audit of Dementia (Care in General Hospitals) Organisational checklist results and commentary for: Guy's and St Thomas' NHS Foundation Trust The 2010 national
Royal College of Psychiatrists 2010 National Audit of Dementia (Care in General Hospitals) Organisational checklist results and commentary for: Guy's and St Thomas' NHS Foundation Trust The 2010 national
Primary Health Networks
 Primary Health Networks Drug and Alcohol Treatment Activity Work Plan 2016-17 to 2018-19 Drug and Alcohol Treatment Budget Murray PHN When submitting this Activity Work Plan 2016-2018 to the Department
North Somerset Autism Strategy
 North Somerset Autism Strategy Approved by: Ratification date: Review date: September 2017 1 Contents 1 Introduction and background... 3 2 Defining Autism...Error! Bookmark not defined. 3 National and
We have reviewed the Winter Planning guidance for 2011/12 and have applied the guidance, where relevant, within this refreshed plan.
 NHS National Waiting Times Centre Winter Plan 2011/12 Introduction This plan outlines the proposed action that would be taken to deliver our key business objectives supported by contingency planning. This
JAWDA Quarterly Waiting Time Guidelines for (Specialized and General Hospitals)
") JAWDA Waiting Time Guidelines for (Specialized and General Hospitals) January 2019 Page 1 of 22 Table of Contents Executive Summary... 3 About this Guidance... 4 Performance Indicators... 5 APPENDIX -
JAWDA Waiting Time Guidelines for (Specialized and General Hospitals) January 2019 Page 1 of 22 Table of Contents Executive Summary... 3 About this Guidance... 4 Performance Indicators... 5 APPENDIX -
Hospital Sector
 Hospital Sector Schedule A: Funding Allocation Target Intended Purpose or Use of Funding Estimated 1 Funding Allocation FUNDING SUMMARY Global Funding (LHIN Allocation) Health System Funding Reform (HSFR)
Dementia Strategy. Contents
 Section Dementia Strategy Contents Page 1. Introduction 2 2. Context of Northern and Eastern Devon 2 3. Our Values and Principles 3 4. Key Result Areas 5 5. Needs Analysis 6 6. Model of Service Delivery
We are currently recruiting new members to advisory groups for the following research programmes:
 Information for applicants to join NIHR as an advisory group member: HTA Programme Topic Identification, Development and Evaluation (TIDE) panel Chairs 1. Background information The goal of the National
Alcohol-Related Hospital Statistics Scotland 2015/16
 Publication Report Alcohol-Related Hospital Statistics Scotland 2015/16 Publication date 25 October 2016 A National Statistics Publication for Scotland Contents Contents... 1 Introduction... 2 Using this
Section 3 - Psychiatric cover (read in conjunction with Section 1)
") Table of enefits HealthPlus Platinum pplicable to new registrations or renewals on/or after 1 st November, 2018. This Table of enefits must be read in conjunction with your Hospital Plan Terms and Conditions
Table of enefits HealthPlus Platinum pplicable to new registrations or renewals on/or after 1 st November, 2018. This Table of enefits must be read in conjunction with your Hospital Plan Terms and Conditions
Primary Health Networks
 Primary Health Networks Drug and Alcohol Treatment Activity Work Plan 2016-17 to 2018-19 Hunter New England & Central Coast Please note: This Activity Work Plan was developed in response to the HNECC PHN
Needs Assessment and Plan for Integrated Stroke Rehabilitation in the GTA February, 2002
 Funding for this project has been provided by the Ministry of Health and Long-Term Care as part of the Ontario Integrated Stroke Strategy 2000. It should be noted that the opinions expressed are those
KEY QUESTIONS What outcome do you want to achieve for mental health in Scotland? What specific steps can be taken to achieve change?
 SCOTTISH GOVERNMENT: NEXT MENTAL HEALTH STRATEGY Background The current Mental Health Strategy covers the period 2012 to 2015. We are working on the development of the next strategy for Mental Health.