Community network profile Herne Bay
|
|
|
- Shana Holt
- 5 years ago
- Views:
Transcription


1 Community network profile Herne Bay November 2015 Produced by Faiza Khan: Public Health Consultant Wendy Jeffries: Public Health Specialist Del Herridge, Zara Cuccu, Emily Silcock: Kent Public Health Observatory Last Updated: 9 th June 2016
2 Contents 1. Executive Summary Introduction Key Findings Introduction & Objectives Community Network Area Community Network Maternity Life expectancy at birth Community network life expectancy trend Ward level life expectancy General fertility rate Low birth weight Infant feeding Immunisations Infant mortality Demographic overview Practice population Registered population Ethnicity Socio-economic profile Deprivation Index of Multiple Deprivation Income Deprivation Affecting Children Index Income Deprivation Affecting Older People Index
3 6. Lifestyle Alcohol Modelled Binge Drinking Estimates Obesity Modelled Adult Obesity Estimates Smoking Modelled Adult Obesity Estimates Mental Health Contact with services Mental health contacts: age 15 to Mental health contacts: age 65 and above Quality outcomes framework Recorded prevalence Herne bay community network G82029 The coach house surgery G82090 St Annes group practice G82119 The park surgery G82204 William street surgery Recorded prevalence: trend analysis Herne Bay community network G82029 The coach house surgery G82090 St Annes group practice G82119 The park surgery G82204 William street surgery Recorded and expected prevalence Atrial fibrillation Coronary heart disease Hypertension Stroke
4 8.3.5 COPD Dementia Clinical achievement Herne bay community network G82090 St Annes group practice G82119 The park surgery G82204 William street surgery Hospital activity Emergency Hospital Admissions Emergency Hospital Admissions Asthma Coronary Heart Disease Chronic Obstructive Pulmonary Disease Diabetes Complications Falls Stroke Mental Health Alcohol Specific Hospital Admissions Alcohol Specific Hospital Admissions A&E and MIU Attendances Social care Mortality All age, all cause mortality All age, all cause mortality All cause mortality in the under 75s Premature Mortality: Cancer Under 75 Cancer mortality Premature mortality: Circulatory disease Under 75 Circulatory disease mortality
5 Appendix A: QOF clinical achievement indicators Appendix B: Social care definitions
6 1. Executive Summary 1.1 Introduction This community network profile for Herne Bay was put together from a variety of source information and data. It seeks to pull together a wide range of intelligence from Health & Social Care, as well as key demographic data from the Office for National Statistics, and present an overview of local need. The area called the Herne Bay Community Network was defined through discussion with the local clinical commissioning group and forms one of five networks within the Canterbury & Coastal CCG area. 1.2 Key Findings Maternity Life expectancy at birth o Between 2006 and 2014, Herne bay network has consistently had a lower life expectancy in comparison with Canterbury and Coastal CCG. o The Herne bay life expectancy based on 2006 to 2014 data (pooled) is 80.8 years, significantly lower than the CCG. General fertility rate o In 2014, there were 376 live births to women resident within the Herne Bay. The Herne Bay, general fertility rate was in 2006 and was in Low birth weight o In 2014, there were 28 low birth weight births to women resident within the Herne Bay. The Herne Bay, percentage of low birth weight births were 6.1% in 2006 and decreased to 4.5% in Infant feeding o The coverage within Herne Bay practices ranged between 90% and 79% during the mid-part of 2014/15. None of the practices had coverage higher than recommended levels. Immunisations o Of the practice level immunisations up to 1 and 2 years of age; three practices had uptake below 90%. Of the practice level immunisations up to 5 years of age; three practices had uptake below 90%. Infant mortality o In 2014, there were 14 still births to women resident within the Herne Bay. None of the Herne Bay mortality statistics were significantly different to Kent. 5
7 Demographic overview Practice population o The total registered population at September 2015 was 40,069, and Herne bay network has an older age profile in relation to the CCG. Ethnicity o 2.3% of the Herne bay network population were classified as being of black or minority ethnicity in the 2011 Census, significantly lower than the CCG proportion of 5.9%. Socio-economic profile Deprivation o The Herne Bay area shows all levels relative deprivation areas of Heron, West Bay and Greenhill & Eddington wards are amongst the most deprived quintile in the Canterbury & Coastal CCG area. Lifestyle Alcohol, Obesity & Smoking o Modelled estimates of binge drinking and smoking show higher levels in the more urban area and are aligned with areas of deprivation. Levels of obesity across Canterbury & Coastal are generally lower than the rest of Kent Mental health Contact with services o Herne Bay network has a significantly higher contact rate than both Kent and Canterbury and Coastal CCG for both people aged 15 to 64 (54.3 contacts per 1,000 population) and people aged 65 and above (104.5 contacts per 1,000 population). o For the 15 to 64 age band, Heron and West bay wards have significantly higher rates than both the CCG and Kent. o For the population aged 65 and above, Reculver and West bay wards have significantly higher rates than both the CCG and Kent. Quality outcomes framework Recorded prevalence o In 2014/15, Herne bay network had significantly higher prevalence of the following conditions, in comparison to Canterbury and Coastal CCG: atrial fibrillation, asthma, CHD, CKD, COPD, dementia, diabetes, epilepsy, heart failure, hypertension, learning disability, obesity and stroke. Recorded prevalence: trend analysis o The annual rate of change in prevalence of the following conditions was significantly higher in Herne bay than England for the following conditions: cancer, atrial fibrillation, asthma, COPD, stroke, CHD, heart failure. 6
8 o The annual rate of change of palliative care prevalence was significantly lower in Herne bay network compared to England. Recorded and expected prevalence o There were no significant differences in the percentage of expected prevalence diagnosed for dementia, atrial fibrillation, CHD, hypertension, COPD or stroke and TIA between any of the Herne bay practices and the Canterbury and Coastal CCG practices. Clinical achievement (see appendix A for definitions) o Herne bay network has significantly higher performance for QOF indicators CHD 006 than the CCG. o The performance for indicators asthma 003, COPD 004 and mental health 002 were significantly lower in Herne bay than for Canterbury and Coastal CCG. Hospital activity Emergency hospital admissions o The Herne Bay practice network showed a rate of change that was significantly higher than Kent; for the age standardised rate of emergency hospital admissions in the under 75 population between 2006/07 and 2014/15; for emergency admissions, asthma and diabetes complication emergency admissions. Alcohol specific hospital admissions o In Kent, the age standardised rate of alcohol specific hospital admissions has shown an increasing trend between 2006/07 and 2014/15. An increasing trend can also be observed within the Herne Bay practice network. The Herne Bay practice network did not show a rate of change that was significantly different to Kent. A&E and MIU attendances o The majority of residents attend A&E more than MIU s. There is a slightly higher proportion of male residents attending MIU s than female residents. o Across all networks, the Kent and Canterbury Hospital and the Queen Elizabeth the Queen Mother Hospital receive the highest proportions of residents from the networks. Influenza immunisations Uptake Social care Herne Bay has a significantly higher support services and home care rate per 10,000 population aged under 65, long term residential care home placement for under and over 65s, and direct payment rate compared to both Canterbury and Coastal CCG and Kent. 7
9 The long term care home nursing placement rate for people aged over 65 is significantly lower than Kent. Mortality All age, all cause mortality o Trends in all age, all cause mortality rates are falling. Highest rate locally is for Heron and Reculver wards. Premature mortality: cancer o Trends in under 75 cancer mortality are generally down across Herne Bay and the CCG area. Highest rates locally are found in Heron and Herne & Broomfield wards. Premature mortality: circulatory disease o The trend in under 75 circulatory diseases mortality is falling, Heron ward has the highest rate locally 8

10 2. Introduction & Objectives 2.1 Community Network Area Community Network The map below shows the breakdown of Herne Bay Community Network into wards and then into lower super output areas (LSOA s). An LSOA is a geographical region with a minimum population of 1,000 and an average population of 1,500. The Herne Bay Community Network has four general practices, all located in the same ward (Heron). 9
11 3. Maternity 3.1 Life expectancy at birth Life expectancy at birth is defined as The average number of years a baby born in a particular area or population can be expected to live if it experiences the current agespecific mortality rates of that particular area or population throughout its life by the South East Public Health Observatory. Life expectancy at birth has been calculated using primary care mortality database (PCMD) and the office for national statistics (ONS) data, and the SEPHO life expectancy tool. For the community networks, trends have been produced; however, it was not possible to do this at a ward level due to relatively small numbers of deaths Community network life expectancy trend Over the past nine years, life expectancy in Canterbury and Coastal CCG has steadily increased, from 81.2 years in 2006 to a peak of 82.9 years in In the past year, there has been a marginal decrease in life expectancy to 82.5 years. The rate of change for life expectancy observed for Canterbury and Coastal CCG has been an annual increase of 0.24 years. Greater fluctuations in life expectancy occur for the community networks, due to smaller populations. The Herne bay life expectancy has remained consistently lower than the Canterbury and Coastal life expectancy over the past nine years. The highest life expectancy in this network is observed in 2013, at 81.8 years, and the lowest in 2009 at 79.3 years. Life expectancy has increased at a rate of 0.16 years annually in Herne Bay between 2006 and 2014; this is not significantly different to the rate of change of the CCG. 10
12 3.1.2 Ward level life expectancy The life expectancy at birth in Herne Bay is 80.8 years, significantly lower than the CCG life expectancy of Heron ward has the lowest life expectancy at 78.5 years, significantly lower than the CCG. The highest life expectancy is in West bay at 82.1 years. Table 1: Life expectancy at birth (based on 2006 to 2014 data pooled) Wardname Life expectancy (years) Significantly different Greenhill and Eddington no Herne and Broomfield no Heron lower Reculver no West Bay no Herne Bay lower CCG
13 3.2 General fertility rate The general fertility rate is defined as the number of live births per 1,000 women aged years. This gives an indication of current fertility levels, but does not account for the different sizes of the population of age bearing women. In 2014, there were 17,305 live births in Kent; 376 of these were to women resident within the Herne Bay. In Kent, the general fertility rate within was in 2006 and increased to in The Herne Bay, general fertility rate was in 2006 and was in

14 3.3 Low birth weight Low birth weight is defined as the number of live births with stated birth weight below 2500g expressed as percentage of live births. Very low birth weight is defined as the number of live births with stated birth weight below 1500g expressed as percentage of live births. In 2014, there were 989 low birth weight births in Kent; 28 of these were to women resident within the Herne Bay. In Kent, the percentage of low birth weight was 6.5% in 2006 and decreased to 5.7% in The Herne Bay, percentage was 6.1% in 2006 and decreased to 4.5% in For the pooled years , there were 9,275 low birth weight births in Kent; 208 of these were to women resident within the Herne Bay. In Kent, the percentage of low birth weight was 6.01% and very low birth weight was 0.78%. The Herne Bay percentage of low birth weight was 5.78% and very low birth weight was 0.75% in

15 For , the practice low birth weight percentages ranged between 6.61% and 4.76%. 3.4 Infant feeding The following chart shows coverage and breastfeeding prevalence, which is recorded at the 6-8 week check. Coverage levels of 95% and greater have been recommended for the accurate assessment of breastfeeding prevalence. The CCG coverage was 74% and within Herne Bay practices ranged between 90% and 79% during the mid-part of 2014/15. None of the practices had coverage higher than recommended levels. The coverage for the Faversham practices had increased in the earlypart of 2015/16 for Coach House Surgery and St Annes Group Practice. Coverage rates below the recommended levels suggest that the prevalence indicators are less reliable and mask the true population prevalence with regard to breastfeeding continuation. However, we can say that the prevalence of breastfeeding was 20% and 24% in the Coach House Surgery and St Annes Group Practice respectively. 14


16 3.5 Immunisations The following charts show uptake of immunisations at 1, 2 and 5 years of age. Vaccine uptake gives an indication of the protection for the population against vaccine preventable disease. The following key has been used to highlight vaccine coverage: Less than 90% Between 90-95% More than 95% Of the practice level immunisations up to 1 and 2 years of age; three practices had uptake below 90%. Of the practice level immunisations up to 5 years of age; three practices had uptake below 90%. 15
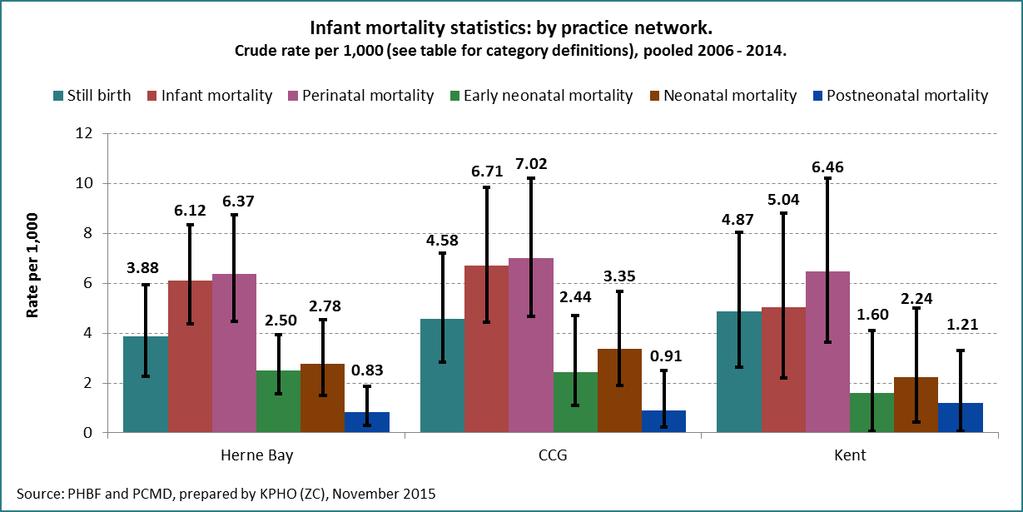
17 Up to 1st Birthday Up to 2nd Birthday Primaries Up to 2nd Birthday Boosters Practice Name DTaP/IPV/Hib MenC PCV DTaP/IPV/Hib MMR MenC Infant Hib/MenC PCV % Uptake % Uptake % Uptake % Uptake % Uptake % Uptake % Uptake % Uptake The Coach House Surgery 100.0% 100.0% 100.0% 92.9% 92.9% 100.0% 92.9% 92.9% St Annes Group Practice 88.9% 94.4% 88.9% 97.1% 91.2% 91.2% 91.2% 91.2% The Park Surgery 49.0% 76.5% 51.0% 85.4% 87.8% 78.0% 87.8% 78.0% William Street Surgery 85.7% 100.0% 85.7% 100.0% 100.0% 100.0% 100.0% 88.9% Herne Bay Network 68.0% 85.6% 69.1% 91.8% 90.8% 87.8% 90.8% 85.7% CCG 88.5% 93.7% 88.9% 94.4% 90.5% 91.3% 90.9% 88.7% Kent 88.1% 93.6% 89.1% 93.5% 88.0% 92.8% 88.5% 84.1% Up to 5th Birthday Primaries Up to 5th Birthday Boosters Practice Name DT/Pol MMR Hib MenC Pertussis PCV DTaP/IPV Hib/MenC MMR PCV % Uptake % Uptake % Uptake % Uptake % Uptake % Uptake % Uptake % Uptake % Uptake % Uptake The Coach House Surgery 100.0% 100.0% 100.0% 100.0% 100.0% 100.0% 85.0% 100.0% 85.0% 100.0% St Annes Group Practice 95.7% 93.5% 95.7% 95.7% 95.7% 95.7% 89.1% 93.5% 87.0% 93.5% The Park Surgery 96.6% 91.4% 96.6% 96.6% 96.6% 96.6% 82.8% 94.8% 79.3% 94.8% William Street Surgery 88.2% 88.2% 88.2% 94.1% 88.2% 88.2% 82.4% 94.1% 88.2% 76.5% Herne Bay Network 95.7% 92.9% 95.7% 96.5% 95.7% 95.7% 85.1% 95.0% 83.7% 92.9% CCG 94.9% 93.5% 94.9% 93.7% 94.9% 93.7% 85.1% 93.2% 84.1% 90.9% Kent 95.2% 93.9% 95.3% 93.5% 95.3% 93.9% 83.3% 92.0% 82.3% 89.2% 3.6 Infant mortality The following indicators and definitions have been used: Indicator Infant mortality rate Perinatal mortality rate Early neonatal mortality rate Neonatal mortality rate Post neonatal mortality Stillbirth rate Definition Number of deaths at ages under 1 year, per 1,000 live births. Number of stillbirths plus number of deaths at ages under 7 days, per 1,000 live births and stillbirths. Number of deaths at ages under 7 days, per 1,000 live births. Number of deaths at ages under 28 days, per 1,000 live births. Number of deaths at ages 28 days and over, but under 1 year, per 1,000 live births. Number of stillbirths per 1,000 live births and stillbirths. The following chart shows the infant mortality statistics for the pooled period In 2014, there were 755 still births in Kent; 14 of these were to women resident within the Herne Bay. None of the Herne Bay mortality statistics were significantly different to Kent. 16
18 17
 of the registered population were male and 51.4% (20,885) female, reflective of the CCG (48.5% male, 51.5% female).")
 and significantly higher proportions in the 55 and above age bands (p<0.001). Table 2: Registered population in Herne bay community network, September 2015 Age band Males Females")
19 4. Demographic overview 4.1 Practice population Registered population The total registered population of Herne bay community network was 40,069 at September % (19,724) of the registered population were male and 51.4% (20,885) female, reflective of the CCG (48.5% male, 51.5% female). Herne bay community network has an older population in comparison to the CCG, with significantly lower proportions of the population in the under 30 age bands (p<0.001) and significantly higher proportions in the 55 and above age bands (p<0.001). Table 2: Registered population in Herne bay community network, September 2015 Age band Males Females Persons
20 All ages Ethnicity Ethnicity data has been sourced from the 2011 Census (Office for National Statistics), and the percentage of the population belonging to a black or minority ethnic (BME) group calculated. Ethnic diversity is significantly lower in the Herne Bay Network at 2.3%, compared to the CCG (5.9%). 19
21 The wards in Herne bay community network all have a significantly lower percentage of black and minority ethnic population in comparison to the CCG. Of the general population, 1.2% (444 residents) are of Asian ethnicity, 0.9% (362) of mixed ethnicity, 0.3% (118) of Black African / Caribbean / Black British descent and 0.2% (68) of residents classified as other. Table 3: Black and ethnic minority population Ward Percentage BME Significantly different Reculver 1.9 lower Herne and Broomfield 2.3 lower West Bay 2.3 lower Greenhill and Eddington 2.9 Heron 3.4 CCG 5.8 lower lower - 20

22 5. Socio-economic profile 5.1 Deprivation Index of Multiple Deprivation 2015 The Canterbury and Coastal area exhibits a wide range of relative deprivation, the most deprived areas tend to be found in the more urban areas in central Canterbury, some parts of Faversham and the coastal town of Herne Bay. The map below shows relative deprivation for the Herne Bay community network. There are several areas that fall into the worst deprived quintile across Canterbury & Coastal CCG area. These found in West Bay, Heron and the Greenhill & Eddington Income Deprivation Affecting Children Index 2015 The Income Deprivation Affecting Children Index (IDACI) is derived from the Income domain within the overall Indices of Deprivation and is used as a child poverty measure. The pattern of child poverty across the Herne Bay area is very similar to overall deprivation. Approximately 33% of the children living in the most deprived parts of Heron ward are living in income deprived households. 21
23 22
24 5.1.3 Income Deprivation Affecting Older People Index 2015 The Income Deprivation Affecting Older People Index (IDAOPI) is also derived from the Income domain within the overall Indices of Deprivation and is used as an older people poverty measure. The areas of Herne Bay with the greatest level of older people poverty are found in the electoral wards of Heron, West Bay and a small part of Greenhill & Eddington (Greenhill area). Approximately 22% of the older people living in the most deprived parts of Heron ward are living in income deprived households. 23

25 6. Lifestyle 6.1 Alcohol Modelled Binge Drinking Estimates Binge drinking estimates are produced for the Association of Public Health Observatories (2007/08) and detail the percentage of adults who consume at least twice the daily recommended amount of alcohol in a single session (that is, eight or more units for men and six or more units for women). Highest rates across Canterbury & Coastal are found in residents of Northgate, Barton, Westgate and Wincheap. 24
26 6.2 Obesity Modelled Adult Obesity Estimates Adult obesity rates for small area geography are modelled from national surveys and produced by the Office for National Statistics. Highest levels (approx.. 30% 35%) are found in the electoral wards of Seasalter, Gorrell, West Bay, Heron, Herne & Broomfield, Sturry North, Sturry South and Northgate. 25

27 6.3 Smoking Modelled Adult Obesity Estimates Modelled smoking prevalence figures, at a small area level, were produced by the Office for National Statistics. Highest levels are found in Barton, Northgate and St Stephens wards. 26
 and West Bay (55.8) wards have significantly higher mental health contact rates per 1,000 population aged 15 to 64 in comparison with Canterbury and Coastal CCG (43.8) and Kent (41.0).")
28 7. Mental Health 7.1 Contact with services Mental health contact rate data has been provided by Kent and Medway NHS and social care partnership for Mental health contacts: age 15 to 64 Heron (94.4) and West Bay (55.8) wards have significantly higher mental health contact rates per 1,000 population aged 15 to 64 in comparison with Canterbury and Coastal CCG (43.8) and Kent (41.0). Herne and Broomfield has a significantly lower rate than the comparator areas, at As a network, Herne bay has a significantly higher rate than both the CCG and Kent, at 54.3 contacts with mental health services per 1,000 population. 27
. Reculver (102.3) and West bay (96.6) have rates significantly higher than Kent. Herne bay community network has a contact rate of 104.")
29 7.1.2 Mental health contacts: age 65 and above Heron ward (136.6) has a significantly higher contact rate per 1,000 people aged 65 and above than both Canterbury and Coastal CCG (88.8) and Kent (73.2). Reculver (102.3) and West bay (96.6) have rates significantly higher than Kent. Herne bay community network has a contact rate of per 1,000 population aged 65 and above, significantly higher than the CCG and Kent. 28
30 8. Quality outcomes framework 8.1 Recorded prevalence Spine charts have been produced to compare the general practice recorded prevalence of long term conditions with the Canterbury and Coastal CCG recorded prevalence in 2014/15. The Quality outcomes framework (QOF) uses an extract of practice list sizes as of 1st January 2015 and disease registers as at 31st March Recorded prevalence for most of long term conditions uses the total practice population. However, this differs for the following: Obesity 16 years and over practice population. Diabetes 17 years and over practice population. Chronic kidney disease 18 years and over practice population Epilepsy - 18 years and over practice population The practice population list sizes will be referred to below. Limitations A limitation of the QOF recorded prevalence is that analysis cannot differentiate between true prevalence and the effectiveness of case finding strategies between practices. The projected recorded prevalence has not been adjusted for any other factors known to influence the risk of long term conditions, such as changes in deprivation and in the demographic patterns of at risk population groups (such as, age). It is likely therefore, that the prevalence projections shown in this section are likely to be conservative estimates Herne bay community network For the purposes of the 2014/15 QOF data, Herne bay network had the following population: 29

31 Table 4 Age Herne Bay All age In 2014/15 Herne bay network had significantly higher prevalence of the following conditions in comparison to Canterbury and Coastal CCG: Atrial fibrillation Asthma Coronary heart disease Chronic kidney disease COPD Dementia Diabetes Epilepsy Heart failure Hypertension Learning disability Obesity Stroke 30

32 8.1.2 G82029 The coach house surgery For the purposes of the 2014/15 QOF data, the coach house surgery had the following population: Table 5 Age G82029 All age In 2014/15 the coach house surgery had significantly higher prevalence of the following conditions in comparison to Canterbury and Coastal CCG: Atrial fibrillation Asthma Coronary heart disease Chronic kidney disease Dementia Diabetes Epilepsy Hypertension Obesity Stroke 31

33 8.1.3 G82090 St Annes group practice For the purposes of the 2014/15 QOF data, St Annes group practice had the following population: Table 6 Age G82090 All age In 2014/15 St Annes group practice had significantly higher prevalence of the following conditions in comparison to Canterbury and Coastal CCG: Atrial fibrillation Asthma Cancer Coronary heart disease Chronic kidney disease COPD Dementia Diabetes Hypertension Obesity Stroke 32
34 8.1.4 G82119 The park surgery For the purposes of the 2014/15 QOF data, the park surgery had the following population: Table 7 Age G82119 All age In 2014/15 the park surgery had significantly higher prevalence of the following conditions in comparison to Canterbury and Coastal CCG: Asthma Coronary heart disease Chronic kidney disease COPD Dementia Diabetes Hypertension Mental health Stroke In 2014/15 the park surgery had significantly lower prevalence of the following conditions in comparison to Canterbury and Coastal CCG: Palliative care 33

35 8.1.5 G82204 William street surgery For the purposes of the 2014/15 QOF data, William street surgery had the following population: Table 8 Age G82204 All age In 2014/15 William street surgery had significantly higher prevalence of the following conditions in comparison to Canterbury and Coastal CCG: Dementia Diabetes Epilepsy Learning disability In 2014/15 William street surgery had significantly lower prevalence of the following conditions in comparison to Canterbury and Coastal CCG: Chronic kidney disease 34


36 8.2 Recorded prevalence: trend analysis Trend analysis has been carried out to explore the general practice rate of change for long term condition recorded prevalence between 2006/07 to 2013/14. This has been compared with the National rate of change, as the most reliable estimate Herne Bay community network The annual rate of change observed in prevalence of cancer, atrial fibrillation, asthma, COPD, stroke, CHD and heart failure is significantly higher than England, whilst the rate of change in palliative care prevalence is significantly lower. 35
37 8.2.2 G82029 The coach house surgery The annual rate of change observed in prevalence of hypertension, stroke, atrial fibrillation, dementia, mental health, and CHD is significantly higher than England, whilst the rate of change in COPD prevalence is significantly lower G82090 St Annes group practice The annual rate of change observed in prevalence of cancer, asthma, atrial fibrillation, stroke, CHD, mental health and heart failure is significantly higher than England, whilst the rate of change in palliative care prevalence is significantly lower. 36
38 8.2.4 G82119 The park surgery The annual rate of change observed in prevalence of cancer and COPD is significantly higher than England, whilst the rate of change in palliative care and mental health prevalence is significantly lower. 37
39 8.2.5 G82204 William street surgery The annual rate of change observed in prevalence of hypertension, COPD, atrial fibrillation and heart failure is significantly higher than England, whilst the rate of change in diabetes prevalence is significantly lower. 8.3 Recorded and expected prevalence Recorded and expected prevalence have been analysed to calculate the percentage of expected prevalence of each condition which has been diagnosed within each practice. Recorded prevalence was sourced from QOF (2014/15), and expected prevalence at practice level was available for the following conditions: Atrial fibrillation (2015, source: Public Health England) Coronary heart disease (2011, source: APHO) Hypertension (2011, source: APHO) Stroke (2011, source: APHO) COPD (2011, source: APHO) Dementia (2012, source: Primary Care Web Tool) 38
 to 78.1% at the park surgery.")
40 8.3.1 Atrial fibrillation As a network, Herne bay has identified 72.8% of the expected number of atrial fibrillation cases, slightly lower than the CCG (76.8%) and Kent (73.3%) percentages. Within the network, the percentage of cases detected ranges from 62.7% (William Street surgery) to 78.1% at the park surgery. None of the practices have a percentage which is significantly different to other practices within Canterbury and Coastal CCG. 39
41 8.3.2 Coronary heart disease 74.9% of the expected number of CHD patients have been identified in Herne bay network, much higher than the CCG percentage (67.9%) and the Kent percentage (64.5%). William Street surgery has identified the lowest percentage of cases (58.8%), whilst the coach house surgery has the highest percentage of diagnosed cases within the network, at 79.5%. 40
 in comparison to other practices within the network.")
42 8.3.3 Hypertension Across the Herne bay network, 55.7% of hypertension cases have been diagnosed, similar to the CCG (54.2%) and Kent (57.0%) percentages. The coach house surgery has identified the lowest proportion of cases (52.0%) in comparison to other practices within the network. The Park surgery has diagnosed the highest percentage of estimated cases, at 61.0%. 41
43 8.3.4 Stroke Across Herne bay network (94.7%), a higher percentage of stroke and TIA cases have been diagnosed than in Canterbury and Coastal CCG (90.3%) and Kent (84.8%). St Annes group practice have identified the lowest proportion of cases in the network, at 87.3%, whilst the coach house surgery has diagnosed the highest proportion, at 114.1%. This indicates that the practice has identified more patients with stroke and TIA than would be expected based on the modelled estimates. 42
44 8.3.5 COPD A higher percentage of estimated COPD cases have been diagnosed in Herne bay network (73.4%) compared to Canterbury and Coastal CCG (66.4%) and Kent (70.6%). The park surgery has identified the highest proportion of cases within the network (86.8%) whilst St Annes groups practice has diagnosed a lower proportion (62.6%) than other practices within the network. 43
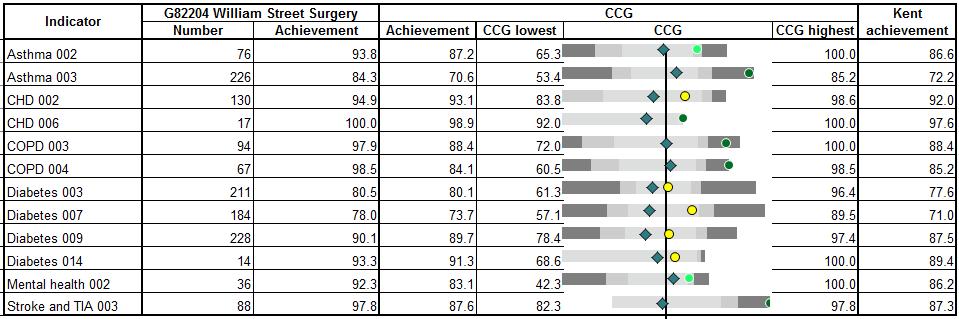
45 8.3.6 Dementia 70.2% of estimated dementia cases in Herne bay network have been diagnosed; this is higher than both the CCG (64.3%) and Kent (58.3%) proportions. Within the network, the percentage of cases diagnosed ranges from 60.8% (William street surgery) to 76.9% (the Park surgery). 8.4 Clinical achievement Spine charts have been produced to compare the general practice clinical achievement for long term conditions within Canterbury and Coastal CCG for 2014/15. The clinical achievement indicator definitions have been included in Appendix A Herne bay community network Herne bay community network has significantly higher performance than the CCG for CHD 006. The network has significantly lower performance for the following indicators: 44
46 Asthma 003 COPD 004 Mental health G82029 The coach house surgery The coach house surgery has significantly higher performance than the CCG for asthma 003, CHD 002, CHD 006, mental health 002 and stroke and TIA G82090 St Annes group practice St Annes group practice has significantly higher performance than the CCG for CHD 006, diabetes 009 and diabetes 014. The practice has significantly lower performance for the following indicators: Asthma 003 COPD 003 COPD 004 Mental health

47 8.4.4 G82119 The park surgery The park surgery has significantly higher performance than the CCG for CHD 006 and COPD 003. The practice has significantly lower performance for the following indicators: CHD002 Diabetes 003 Diabetes 007 Diabetes 009 Mental health G82204 William street surgery The park surgery has significantly higher performance than the CCG for asthma 002, asthma 003, CHD 006, COPD 003, COPD 004, mental health 002 and stroke and TIA
48 47
49 9. Hospital activity 9.1 Emergency Hospital Admissions The following Chapter explores the level of emergency hospital admissions in the under 75 population. This has focused on the ambulatory care sensitive conditions, including; asthma, chronic obstructive pulmonary disease and diabetes complications, as well as, a range of other diagnoses. High levels of emergency admissions for the ambulatory care sensitive conditions may indicate potentially preventable admissions. Notes on methodology: Age standardised rates have been presented to enable comparison of the practice networks without confounding by age. An analysis of trend and rate of change has been presented for the practice networks for the period 2006/07 to 2014/15. This has been compared to the CCG and Kent. An analysis by general practice has been presented, often in the case of small numbers; this has been presented for the pooled years 2006/ /15. This has been compared to the CCG and Kent Emergency Hospital Admissions In Kent, the age standardised rate of emergency hospital admissions in the under 75 population has increased between 2006/07 and 2014/15. The Herne Bay practice network showed a rate of change that was significantly greater than Kent. 48
50 Significantly higher age standardised rates of emergency hospital admissions in the under 75 population, in comparison to the CCG and Kent, can be identified for the following general practices; William Street Surgery, St Annes Group Practice and the Park Surgery Asthma In Kent, the age standardised rate of asthma emergency hospital admissions in the under 75 population has shown a stable trend between 2006/07 and 2014/15. The Herne Bay practice network showed a rate of change that was significantly greater than Kent. 49
51 A significantly higher age standardised rate of asthma emergency hospital admissions in the under 75 population, in comparison to the CCG and Kent, can be identified for William Street Surgery, the Park Surgery and St Annes Group Practice. 50

52 9.1.3 Coronary Heart Disease In Kent, the age standardised rate of coronary heart disease emergency hospital admissions in the under 75 population has shown a decreasing trend between 2006/07 and 2014/15. The Herne Bay practice network did not show a rate of change that was significantly different to Kent. 51

53 A significantly higher age standardised rate of coronary heart disease emergency hospital admissions in the under 75 population, in comparison to the CCG and Kent, can be identified for St Annes Group Practice Chronic Obstructive Pulmonary Disease In Kent, the age standardised rate of chronic obstructive pulmonary disease emergency hospital admissions in the under 75 population has shown a stable trend between 2006/07 and 2014/15. The Herne Bay practice networks did not show a rate of change that was significantly different to Kent. 52
54 Significantly higher age standardised rates of chronic obstructive pulmonary disease emergency hospital admissions in the under 75 population, in comparison to the CCG and Kent, can be identified for William Street Surgery. 53

55 9.1.5 Diabetes Complications In Kent, the age standardised rate of diabetes complications emergency hospital admissions in the under 75 population has shown an increasing trend between 2006/07 and 2014/15. The Herne Bay practice networks showed a rate of change that was significantly higher than Kent. 54
56 Significantly higher age standardised rates of diabetes complication emergency hospital admissions in the under 75 population, in comparison to the CCG and Kent, can be identified for the Coach House Surgery and William Street Surgery Falls In Kent, the age standardised rate of falls emergency hospital admissions in the under 75 population has shown a stable trend between 2006/07 and 2014/15. The Herne Bay practice network did not show a rate of change that was significantly different to Kent. 55
57 The age standardised rates of falls emergency hospital admissions in the under 75 population were not significantly different in comparison to the CCG and Kent. 56
58 9.1.6 Stroke In Kent, the age standardised rate of stroke emergency hospital admissions in the under 75 population has shown a stable trend between 2006/07 and 2014/15. The Herne Bay practice network did not show a rate of change that was significantly different to Kent. 57

59 The age standardised rates of stroke emergency hospital admissions in the under 75 population were not significantly different in comparison to the CCG and Kent Mental Health In Kent, the age standardised rate of stroke emergency hospital admissions in the under 75 population has shown an increasing trend between 2006/07 and 2014/15. The Herne Bay practice network did not show a rate of change that was significantly different to Kent. 58
60 The age standardised rates of mental and behavioural disorder emergency hospital admissions in the under 75 population were not significantly different in comparison to the CCG and Kent. 59

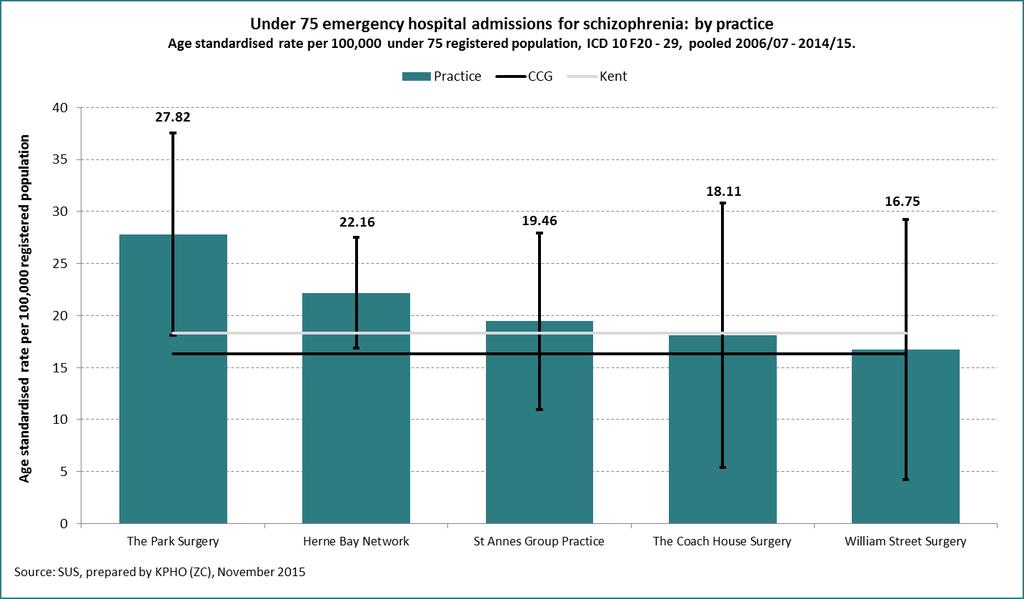
61 The age standardised rates of organic, mood affective mental disorders and disorders of adult personality and behaviour emergency hospital admissions in the under 75 population were not significantly different in comparison to the CCG and Kent. The age standardised rates of schizophrenia emergency hospital admissions in the under 75 population were not significantly different in comparison to the CCG and Kent. 60
62 61
63 9.2 Alcohol Specific Hospital Admissions The following Chapter explores the level of alcohol specific hospital admissions. Notes on methodology: Age standardised rates have been presented to enable comparison of the practice networks without confounding by age. The alcohol specific conditions include the range of conditions that are causally implicated and have an alcohol attributable fraction of 1, as defined by Public Health England. 1 An analysis of trend and rate of change has been presented for the practice networks for the period 2006/07 to 2014/15. This has been compared to the CCG and Kent. An analysis by general practice has been presented by gender, often in the case of small numbers; this has been presented for the pooled years 2006/ /15. This has been compared to the CCG and Kent Alcohol Specific Hospital Admissions In Kent, the age standardised rate of alcohol specific hospital admissions has shown an increasing trend between 2006/07 and 2014/15. The Herne Bay practice network did not show a rate of change that was significantly higher than Kent. 1 Public Health England (2015) Local alcohol profiles for England 2015 user guide. 62
64 Significantly higher age standardised rates of alcohol specific admissions in males, in comparison to the CCG and Kent, can be identified for the William Street Surgery. Significantly higher age standardised rates of alcohol specific admissions in females, in comparison to the CCG and Kent, can be identified for the William Street Surgery and the Park Surgery. 63

65 9.3 A&E and MIU Attendances A&E attendances are highest for children aged 0-4 years and people aged 65 plus years for all networks. No A&E attendance rates exceed the Kent rates for all age bands regarding the Herne Bay network. 64
 which makes up the majority for the working age population. 65")
66 MIU attendances are substantively lower than A&E attendances across the networks, apart from Sandwich and Ash where there are similar levels to A&E attendances. In the Herne Bay network, the highest proportion of MIU attendances comes from years (2.5%) which makes up the majority for the working age population. 65
 than MIU s (48.7%). In the Herne Bay network there is a higher proportion of males (53.")
67 The proportion of males attending MIU s is slightly higher than attending A&E; in Kent, 51.2% of males attend MIU s whilst 49.0% attend A&E. For female residents, this tends to the opposite trend: more females attend A&E (51.0% in Kent) than MIU s (48.7%). In the Herne Bay network there is a higher proportion of males (53.4%) attending MIU s than females (44.8%). Across all networks, the Kent and Canterbury Hospital and the Queen Elizabeth the Queen Mother Hospital receive the highest proportions of residents from the networks. In the Herne Bay network 44.6% of residents attend the Queen Elizabeth the Queen Mother Hospital; this is also the case in the Sandwich and Ash network where 38.3% of residents attend the Queen Elizabeth the Queen Mother Hospital. 66
68 10. Social care Social care data have been provided by the Adult Social Care department at Kent County Council. Ward level crude rates per 10,000 population have been calculated. For some indicators, either years or age bands have been pooled to increase reliability due to small numbers of people. For definitions of the indicators, see appendix B. Herne bay has a lower support services rate per 10,000 population aged 65 and over (6.9) than Kent (7.5) and Canterbury and Coastal CCG (7.3); however this is not significantly different. Heron has a significantly higher rate (15.1) than both the CCG and Kent. Reculver has a significantly lower rate than the CCG and Kent of
. Heron ward (36.5) has a significantly higher rate than both the CCG and Kent, whilst Herne and Broomfield and Reculver have significantly higher rates than the CCG.")
69 Herne bay has a significantly higher support services rate per 10,000 population aged under 65, at 19.7, compared to both Canterbury and Coastal CCG (10.7) and Kent (12.7). Heron ward (36.5) has a significantly higher rate than both the CCG and Kent, whilst Herne and Broomfield and Reculver have significantly higher rates than the CCG. 68
70 The number of people receiving meal service per 10,000 population is very low, at 1.7. This is a slightly lower rate than both the CCG (2.1) and Kent (3.7). None of the wards in Herne bay have a rate significantly different to the CCG or Kent. 69
71 Herne bay has a significantly higher long term residential care home placement rate for people aged under 65 than both the CCG (16.7) and Kent (9.7), at 12.9 per 10,000. Heron, Reculver and West bay all have significantly higher rates than the CCG and Kent. 70
72 Herne bay has a significantly higher number of long term residential care home placements per 10,000, at 199.3, than Canterbury and Coastal CCG (110.9) and Kent (96.0). Within Herne bay, Heron, Reculver and West bay wards have significantly higher rates than both the CCG and Kent. 71
73 The long term care home nursing placement rate of 24.3 placements per 10,000 population aged 65 and over is significantly lower than Kent (41.5), and lower than the CCG (39.3). Greenhill and Eddington and West bay wards have significantly lower rates than both the CCG and Kent. 72
74 Herne bay (11.8) has a significantly higher rate of people aged under 65 receiving home care than the CCG (6.2) and Kent (6.7). Reculver and West bay wards have significantly higher rates than the CCG and Kent. 73
75 For the population aged 65 and above, Herne bay (151.9) has a significantly higher rate of people receiving home care than Canterbury and Coastal CCG (116.6), and a higher rate than Kent (126.7). Greenhill and Eddington has a significantly higher rate than both the CCG and Kent, whilst Herne and Broomfield has a significantly lower rate than Kent. 74
76 Herne bay (3.2) has a higher enablement rate than both Kent (2.9) and Canterbury and Coastal CCG (2.7); however these differences are not significant. West bay has the highest rate within this community network; however, none of the wards have rates that are significantly different to the comparator areas. 75
77 Herne bay community network (24.0) has significantly higher direct payment rates than both the CCG (17.2) and Kent (19.5). West bay wards has a significantly higher rate than both the CCG and Kent, whilst Heron has a significantly higher rate than the CCG. Greenhill and Eddington has a significantly lower rate the both the CCG and Kent. 76
78 The direct payment rate in Herne bay community network (41.4) is significantly higher than Kent (34.8), and higher than the CCG (35.1). Heron ward has the highest rate in the network, significantly higher than Canterbury and Coastal CCG and Kent. 77
79 11. Mortality 11.1 All age, all cause mortality All age, all cause mortality Recent trends in all age, all cause mortality rates have been in a downward direction, with the Sandwich & Ash area consistently seeing the lowest rates in the Canterbury & Coastal CCG area. There has been a 12% fall in the rate between 2006 and 2014, this is in line with the wider area. The percentage fall in rates in Herne Bay is just 5%. The community network with the greatest reduction in rates is Whitstable where there was an 18% decrease. Five year, pooled, mortality for all causes at electoral ward level shows that the highest rates are in Heron ward (1225) and is within the worst quintile across the CCG. Reculver ward also has rates in excess of 1,000 per 100,000 population. The remaining wards in Herne Bay also exhibit high rates and this means that as a community network Herne Bay has an overall rate that is higher than all of the other networks locally. The rate for Herne Bay is 1007 per 100,000, higher than the Canterbury & Coastal CCG rate of 925 per 100,

80 All cause mortality in the under 75s Reductions in all cause mortality in the under 75s vary across the Canterbury & Coastal CCG area. The Canterbury & Rural community network area saw no reduction in standardised rates between 2006 and 2014, whereas the downward trend for Faversham was 29%. 79
 has the lowest rate in the community network area.")
81 The five year pooled rates at electoral ward level shows that the highest rate in the community network is 446 per 100,000 for Heron ward (the highest across the CCG). Reculver (274) has the lowest rate in the community network area. The overall under 75 mortality rate for Herne Bay is considerably higher (329) than the rate for Canterbury & Coastal as a whole (276) Premature Mortality: Cancer Under 75 Cancer mortality The overall trend for premature mortality due to cancer has been falling, although there was a sharp rise in In 2006 the age standardised rate for Canterbury & Coastal area was 141 per 100,000 this reduced to just 119 in 2012 but has risen to 142 in There is variation to this pattern within the local community networks. The 23% rise in rates in the Canterbury & Rural and Sandwich & Ash areas was match by a 23% fall in the Whitstable area rates across the nine year period. 80
82 The five year pooled rates at electoral ward level shows that Heron and Herne & Broadfield have rates in excess of 160 per 100,000 and are amongst the highest across Canterbury & Coastal. The ward with the lowest rate is Greenhill & Eddington with just 124 per 100,000. The overall under 75 cancer mortality rate for Herne Bay is higher (146) than the rate for Canterbury & Coastal as a whole (131). 81
83 11.3 Premature mortality: Circulatory disease Under 75 Circulatory disease mortality 82

84 The reduction in premature mortality due to circulatory diseases such as chronic heart disease and strokes has been falling over the past nine years. Across the Canterbury & Coastal CCG area rates have gone from 97 per 100,000 in 2006 to 60 per 100,000 in This rate of decrease is reflected across the local community networks with the exception of Faversham where the rate has only fallen by 8% across the same period. Five year pooled rates at an electoral ward level reveal that Heron ward (114) has the highest rate. The lowest rate is found in Reculver (61). The Herne Bay rate (79) is higher than that for Canterbury & Coastal CCG (68). 83
85 Appendix A: QOF clinical achievement indicators Asthma 002: AST002 The percentage of patients aged 8 or over with asthma (diagnosed on or after 1 April 2006), on the register, with measures of variability or reversibility recorded between 3 months before or anytime after diagnosis Asthma 003: AST003 The percentage of patients with asthma, on the register, who have had an asthma review in the preceding 12 months that includes an assessment of asthma control using the 3 RCP questions, NICE 2011 menu ID: NM23 CHD 002: CHD002 The percentage of patients with coronary heart disease in whom the last blood pressure reading (measured in the preceding 12 months) is 150/90 mmhg or less CHD 006: CHD006 The percentage of patients with a history of myocardial infarction (on or after 1 April 2011) currently treated with an ACE-I (or ARB if ACE-I intolerant), aspirin or an alternative anti-platelet therapy, beta-blocker and statin, NICE 2010 menu ID: NM07 COPD 003: COPD003 The percentage of patients with COPD who have had a review, undertaken by a healthcare professional, including an assessment of breathlessness using the Medical Research Council dyspnoea scale in the preceding 12 months COPD 004: COPD004 The percentage of patients with COPD with a record of FEV1 in the preceding 12 months Diabetes 003: DM003 The percentage of patients with diabetes, on the register, in whom the last blood pressure reading (measured in the preceding 12 months) is 140/80 mmhg or less, NICE 2010 menu ID: NM02 Diabetes 007: DM007 The percentage of patients with diabetes, on the register, in whom the last IFCC-HbA1c is 59 mmol/mol or less in the preceding 12 months, NICE 2010 menu ID: NM14 Diabetes 009: DM009 The percentage of patients with diabetes, on the register, in whom the last IFCC-HbA1c is 75 mmol/mol or less in the preceding 12 months Diabetes 014: DM014 The percentage of patients newly diagnosed with diabetes, on the register, in the preceding 1 April to 31 March who have a record of being referred to a structured education programme within 9 months after entry on to the diabetes register, NICE 2011 menu ID: NM27 Mental health 002: MH002 The percentage of patients with schizophrenia, bipolar affective disorder and other psychoses who have a comprehensive care plan documented in the record, in the preceding 12 months, agreed between individuals, their family and/or carers as appropriate Stroke and TIA 003: STIA003 The percentage of patients with a history of stroke or TIA in whom the last blood pressure reading (measured in the preceding 12 months) is 150/90 mmhg or less 84
14/15 Threshold 15/16 Points 15/16. Points. Retired Replaced by NM82/AF007. Replacement NO CHANGE
 SUMMARY OF CHANGES TO QOF 2015/1 - ENGLAND KEY No change Retired/replaced Wording and/or change Point or threshold change Indicator ID change 14/15 QOF ID 15/1 QOF ID NICE ID Indicator wording Changes
SUMMARY OF CHANGES TO QOF 2017/18 - ENGLAND CLINICAL
 SUMMARY OF CHANGES TO QOF 2017/18 - ENGLAND KEY No change Retired/replaced Wording and/or timeframe change Point or threshold change Indicator ID change 1/17 QOF ID 17/18 QOF ID NICE ID Indicator wording
17/18 Threshold 18/19 Points 18/19. Points NO CHANGE NO CHANGE NO CHANGE
 SUMMARY OF CHANGES TO QOF 2018/19 - ENGLAND 18-19 QOF005 KEY No change Retired/replaced Wording and/or timeframe change Point or threshold change Indicator ID change 17/18 QOF ID 18/19 QOF ID NICE ID Indicator
The contractor establishes and maintains a register of patients with AF
 Atrial Fibrillation The contractor establishes and maintains a register of patients with AF G5731 Those patients with AF in whom there is a record of CHADS2 score of 1, the % of patients who are currently
SUMMARY OF CHANGES TO QOF 2014/15 - ENGLAND CLINICAL
 SUMMARY OF CHANGES TO QOF 20 - ENGLAND KEY No change Retired /or change Point or threshold change Funding transferred to enhanced services change QOF NICE CLINICAL Atrial Fibrilation (AF) AF001 AF001 -
NATIONAL INSTITUTE FOR HEALTH AND CARE EXCELLENCE QUALITY AND OUTCOMES FRAMEWORK (QOF) INDICATOR DEVELOPMENT PROGRAMME. Indicator Assessment Report
 INDICATOR DEVELOPMENT PROGRAMME. Indicator Assessment Report") NATIONAL INSTITUTE FOR HEALTH AND CARE EXCELLENCE QUALITY AND OUTCOMES FRAMEWORK (QOF) INDICATOR DEVELOPMENT PROGRAMME Output: Advice for NHS England Assessment Report Date of QOF Advisory Committee meeting:
NATIONAL INSTITUTE FOR HEALTH AND CARE EXCELLENCE QUALITY AND OUTCOMES FRAMEWORK (QOF) INDICATOR DEVELOPMENT PROGRAMME Output: Advice for NHS England Assessment Report Date of QOF Advisory Committee meeting:
New indicators to be added to the NICE menu for the QOF and amendments to existing indicators
 New indicators to be added to the for the QOF and amendments to existing indicators 1 st September 2015 Version 1.1 This document was originally published on 3 rd August 2015, it has since been updated.
Locality Health Improvement Plan
 Locality Health Improvement Plan North Devon 2012/13 Public Health Annual Report 2011-12 The Northern Locality health improvement and tackling health inequalities plan is a mechanism for monitoring and
Royal Crescent Surgery
 NATIONAL GENERAL PRACTICE PROFILES PROFILE FOR Royal Crescent Surgery 25 Crescent Street, Weymouth, Dorset These profiles are designed to support clinical commissioning groups (s), GPs and local authorities
Summary of 2011/12 QOF indicator changes, points and thresholds
 Summary of 2011/12 QOF indicator changes, points and thresholds Retirements 2010/11 QOF ID 2010/11 Indicator Wording Points Threshold CHD5 The percentage of patients with coronary heart disease whose notes
Healtheast CCG - developing an understanding of health and wellbeing needs. Public Health NHS Norfolk and Waveney Cluster and Norfolk County Council
 Healtheast CCG - developing an understanding of health and wellbeing needs Public Health NHS Norfolk and Waveney Cluster and Norfolk County Council Acknowledgements Norfolk County Council Children s Services
Cardiovascular disease profile
 Background This chapter of the Cardiovascular disease profiles focuses on risk factors for cardiovascular disease and is produced by the National Cardiovascular Intelligence Network (NCVIN). The profiles
POTENTIAL LINKAGES BETWEEN THE QUALITY AND OUTCOMES FRAMEWORK (QOF) AND THE NHS HEALTH CHECK
 AND THE NHS HEALTH CHECK") POTENTIAL LINKAGES BETWEEN THE QUALITY AND OUTCOMES FRAMEWORK (QOF) AND THE NHS HEALTH CHECK Author: CHARLOTTE SIMPSON, SPECIALTY REGISTAR PUBLIC HEALTH (ST3), CHESHIRE EAST COUNCIL/MERSEY DEANERY SUMMARY
POTENTIAL LINKAGES BETWEEN THE QUALITY AND OUTCOMES FRAMEWORK (QOF) AND THE NHS HEALTH CHECK Author: CHARLOTTE SIMPSON, SPECIALTY REGISTAR PUBLIC HEALTH (ST3), CHESHIRE EAST COUNCIL/MERSEY DEANERY SUMMARY
Estimated number of people with hypertension. Significantly higher than the. Proportion. diagnosed with. hypertension
 Hypertension profile Background Diagnosis and control of hypertension in * This profile compares with data for, authorities in the South East region and the Office for National Statistics (ONS) group of
CQC Insight. NHS GP practices Indicators and methodology
 CQC Insight NHS GP practices s and methodology June 2017 Contents Introduction... 3 Background information on CQC Insight reports... 4 Displaying proportions as percentages... 5 Suppression rules... 5
Summary of 2012/13 QOF Changes
 Summary of QOF Changes Retirements 2011/12 CHD13 AF4 QP1 QP2 QP3 QP4 QP5 2011/12 Indicator Wording Threshold For patients with newly diagnosed angina (diagnosed after 1 April 2011), the percentage who
Bridgwater. Practices in Commissioning Locality
 Locality profile Part of the SOMERSET JOINT STRATEGIC NEEDS ASSESSMENT Practices in Locality 2 3 4 5 6 7 8 9 10 11 12 13 14 15 16 17 Cannington Health Centre Cranleigh Gardens Medical Centre East Quay
Of those with dementia have a formal diagnosis or are in contact with specialist services. Dementia prevalence for those aged 80+
 Dementia Ref HSCW 18 Why is it important? Dementia presents a significant and urgent challenge to health and social care in County Durham, in terms of both numbers of people affected and the costs associated
Quality And Outcomes Framework Guidance for the GMS Contract Wales 2018/19. June 2018
 Quality And Outcomes Framework Guidance for the GMS Contract Wales 018/19 June 018 Page 1 of 14 Strategic background Delivery of more care in the community and closer to home through primary care clusters
Public Health Profile
 Eastern Wakefield Primary Care Trust Public Health Profile 2005/06 Introduction Eastern Wakefield Primary Care Trust () is situated within the West Yorkshire Strategic Health Authority Area. The PCT commissions
BOLTON GPFEDERATION. Farnworth/Kearsley NEIGHBOURHOOD PLAN
 BOLTON GPFEDERATION Farnworth/Kearsley NEIGHBOURHOOD PLAN Summary Highlights Taken as a neighbourhood, Farnworth/Kearsley typical age range population for Bolton but suffers from significantly lower life
Hypertension Profile. NHS High Weald Lewes Havens CCG. Background
 NHS High Weald Lewes Havens Background Hypertension Profile Diagnosis and control of in NHS High Weald Lewes Havens * This profile compares NHS High Weald Lewes Havens with data for, a group of similar
Cardiovascular disease profile
 Cardiovascular disease profile Heart disease Background This chapter of the Cardiovascular disease profiles focuses on coronary heart disease (CHD) and heart failure and is produced by the National Cardiovascular
Data Flows for Direct Commissioning v1.54 Activity Reporting Programme Child Immunisations UNIFY Collections: Guidance
 Data Flows for Direct Commissioning (COVER) UNIFY Collections: Guidance v1.54 Activity Reporting Programme UNIFY Collections: Guidance Page 1 of 11 (COVER) UNIFY Collections: Guidance This document aims
GP Insight Report. Oaklands CQC ID:
 GP Insight Report Oaklands CQC ID: 1-542862750 1 CQC GP Insight Report June 2017 spacer Practice background > Introduction INTRODUCTION CONTEXTUAL INFORMATION This report details the CQC view of 11 Insight
2. Quality and Outcomes Framework: new NICE recommendations
 Proposed Changes to the GMS Contract 2013/14 1. GP pay and expenses uplift It is proposed GP pay and expenses is uplifted by 1.5%. This increased investment will allow for an average pay increase of up
GP Insight Report. The Family Practice CQC ID:
 GP Insight Report The Family Practice CQC ID: 1-562698152 1 CQC GP Insight Report February 2017 spacer Practice background > Introduction INTRODUCTION CONTEXTUAL INFORMATION This report details the CQC
Joint Strategic Needs Assessment: Health Profile for Lancashire North
 Joint Strategic Needs Assessment: Health Profile for Lancashire North Introduction This health profile forms part of a Joint Strategic Needs Assessment process for NHS Lancashire North CCG. Specifically
Scottish Quality and Outcomes Framework 2013/2014. Guidance for NHS Boards and GP practices
 Scottish Quality and Outcomes Framework 2013/2014 Guidance for NHS Boards and GP practices 1 May 2013 1 Contents Section 1 Introduction 5 General information on indicators 6 Disease registers 8 QOF Business
Summary of the Health Needs in Rugby Borough
 Rugby Borough Summary of the Health Needs in Rugby Borough Domain Indicator Rugby Borough 2010 Trend Warwickshire England Data Communities Children's and young people Adult's health and lifestyle Disease
Cardiology The interface between Primary and Secondary Care
 Cardiology The interface between Primary and Secondary Care Dr A Daniels GP, Cardiff South East Wales Cardiac Network The view from secondary care Referral to treatment times targets Clinics are full of
Cardiovascular disease profile - Heart disease. NHS Wirral CCG. June 2017
 Cardiovascular disease profile - Heart disease June 217 Background This chapter of the Cardiovascular disease profiles focuses on coronary heart disease (CHD) and heart failure and is produced by the National
Hull s Joint Strategic Needs Assessment: Analysis of Public Health Outcomes Framework Data Children and Young People
 s Joint Strategic Needs Assessment: Analysis of Public Health Outcomes Framework Data Children and Young People A summary of the data for each of the Public Health Outcomes Framework (PHOF) indicators
JSNA Data Refresh 2013/14 Diabetes Barnet
 JSNA Data Refresh 2013/14 Diabetes Barnet Diabetes is a common life-long health condition. There are 3 million people diagnosed with diabetes in the UK. Type 2 diabetes is a largely preventable disease
How a universal health system reduces inequalities: lessons from England
 How a universal health system reduces inequalities: lessons from England Appendix 1: Indicator Definitions Primary care supply Definition: Primary care supply is defined as the number of patients per full
Commissioning for value focus pack
 Commissioning for value focus pack Clinical commissioning group: NHS MILTON KEYNES CCG Focus area: Cardiovascular disease (CVD) pathway Version 2 June 2014 Contents 1. Background and context About the
Deaths from cardiovascular diseases
 Implications for end of life care in England February 2013 www.endoflifecare-intelligence.org.uk Foreword This report provides an excellent summary of the current trends and patterns in cardiovascular
Ref. No. Title Quality Dimension
 Ref. No. Title Quality Dimension NSR Pathway Topic CV35 Percentage of ST-elevation myocardial infarction (STEMI) patients who received primary angioplasty within 120 minutes of call (call to balloon time)
Scottish Quality and Outcomes Framework guidance for GMS contract 2015/16
 2015/16 Contents Section 1: Introduction... 6 Principles... 7 General information on indicators... 7 Disease registers (denominators)... 9 Clinical areas previously transferred to core... 10 Verification...
GENERAL PRACTITIONER DATA PACK GUIDANCE
 RESTRICTED For CQC internal use only This should NOT be shared outside CQC GENERAL PRACTITIONER DATA PACK GUIDANCE PRIMARY CARE DATA PACKS AND INSPECTION TEAM - November 2015 - Table of Contents Introduction...
Breastfeeding comparisons between initiation, days and 6-8 weeks in
 Breastfeeding comparisons between initiation, 10-14-days and 6-8 weeks in 2015-16 Breastfeeding comparisons at initiation, 10-14 days and 6-8 weeks in 2015/16 The following report includes information
Presentation map. Report - Township - Prestwich. PHE - Crown copyright and database rights 2014, Ordnance Survey ONS Crown Copyright 2014
 Presentation map PHE - Crown copyright and database rights 14, Ordnance Survey 16969 ONS Crown Copyright 14 1/16 Population Population by age group, 12 Population by age group, 12 aged under 16 (22.2 %)
BASILDON. Joint Strategic Needs Assessment (JSNA) Product for Clinical Commissioning Groups. May 2012
 Product for Clinical Commissioning Groups. May 2012") BASILDON Joint Strategic Needs Assessment (JSNA) Product for Clinical Commissioning Groups May 2012 NHS South West Essex Public Health Informatics Team Ian Wake, Consultant in Public Health Emma Sanford,
BASILDON Joint Strategic Needs Assessment (JSNA) Product for Clinical Commissioning Groups May 2012 NHS South West Essex Public Health Informatics Team Ian Wake, Consultant in Public Health Emma Sanford,
QOF (England): clinical indicators
: clinical indicators") QOF 2015 16 (England): clinical indicators Here is a quick summary of the planned changes for QOF in England for 2015 16. This covers only the clinical aspects of QOF, as you might need them in the consultation,
QOF 2015 16 (England): clinical indicators Here is a quick summary of the planned changes for QOF in England for 2015 16. This covers only the clinical aspects of QOF, as you might need them in the consultation,
Report - Ward: Blythe; Solihull (Ward (2013)) Presentation map
) Presentation map") Presentation map PHE - Crown copyright and database rights 214, Ordnance Survey 16969 ONS Crown Copyright 214 1/17 Population Population by age group, 212 Population by age group, 212 aged under 16 (19.1
Presentation map PHE - Crown copyright and database rights 214, Ordnance Survey 16969 ONS Crown Copyright 214 1/17 Population Population by age group, 212 Population by age group, 212 aged under 16 (19.1
TABLE OF CONTENTS TABLE OF FIGURES... 7 FOREWARD EXECUTIVE SUMMARY CHAPTER 1: DEMOGRAPHIC PROFILE Population structure...
 Page 1 of 264 TABLE OF CONTENTS TABLE OF FIGURES... 7 FOREWARD... 28 EXECUTIVE SUMMARY... 29 CHAPTER 1: DEMOGRAPHIC PROFILE... 31 1.1 Population structure... 31 1.2 Population projections by local authority
Joint Strategic Needs Assessment (JSNA) Picture of Lewisham - Part A 2018
 Picture of Lewisham - Part A 2018") Joint Strategic Needs Assessment (JSNA) Picture of Lewisham - Part A 2018 2 What is a JSNA? The JSNA Process in Lewisham The Borough Contents The JSNA is a process by which the current and future health
Joint Strategic Needs Assessment (JSNA) Picture of Lewisham - Part A 2018 2 What is a JSNA? The JSNA Process in Lewisham The Borough Contents The JSNA is a process by which the current and future health
POTENTIAL YEARS OF LIFE LOST (PYLL) SOUTH DEVON AND TORBAY 2009 to
 SOUTH DEVON AND TORBAY 2009 to") SOUTH DEVON AND TORBAY 2009 to 2014 1 Background Potential years of life lost (PYLL) represents the estimated number of potential years not lived by people who die before reaching a given age due to lack
SOUTH DEVON AND TORBAY 2009 to 2014 1 Background Potential years of life lost (PYLL) represents the estimated number of potential years not lived by people who die before reaching a given age due to lack
2015/16 General Medical Services (GMS) contract Quality and Outcomes Framework (QOF)
 contract Quality and Outcomes Framework (QOF)") 2015/16 General Medical Services (GMS) contract Quality and Outcomes Framework (QOF) Guidance for GMS contract 2015/16 March 2015 Publications Gateway Reference Number 03099 Contents Section 1 Introduction
2015/16 General Medical Services (GMS) contract Quality and Outcomes Framework (QOF) Guidance for GMS contract 2015/16 March 2015 Publications Gateway Reference Number 03099 Contents Section 1 Introduction
12/13 Threshold. 13/14 Points. 12/13 Points. Minor wording change (noted in bold) mnth change
 mnth change") NM0 NM NM5 NM4 NM2 NM7 NM NM5 NM48 NM07 NM4 NM45 NM24 NICE ID Summary of QOF changes for 201/14 in England KEY Retired New Replaced Wording amended /1 QOF ID AF1 AF5 1/14 QOF ID CLINICAL DOMAIN Atrial
NM0 NM NM5 NM4 NM2 NM7 NM NM5 NM48 NM07 NM4 NM45 NM24 NICE ID Summary of QOF changes for 201/14 in England KEY Retired New Replaced Wording amended /1 QOF ID AF1 AF5 1/14 QOF ID CLINICAL DOMAIN Atrial
Peterborough City Council Cardiovascular Disease Joint Strategic Needs Assessment SUMMARY. Section Number Section Page Number
 Cardiovascular Disease Joint Strategic Needs Assessment Summary 2015 1 Contents - Section Number Section Page Number 1 Introduction and Background to the CVD JSNA 3 1.1 Joint Strategic Needs Assessments
Time Series Analysis for selected clinical indicators from the Quality and Outcomes Framework
 Time Series Analysis for selected clinical indicators from the Quality and Outcomes Framework 21-26 Title Document Type Time Series Analysis for selected clinical indicators from the Quality and Outcomes
Brant County Community Health Status Report: 2001 OVERVIEW
 Brant County Community Health Status Report: 2001 OVERVIEW Brantford County of Brant Brant County Health Unit and Grand River District Health Council April 2001 Brant County Community Health Status Report:
Diabetes. Ref HSCW 024
 Diabetes Ref HSCW 024 Why is it important? Diabetes is an increasingly common, life-long, progressive but largely preventable health condition affecting children and adults, causing a heavy burden on health
Cardiovascular disease PCT health profile. County Durham. Contents
 Cardiovascular disease PCT health profile County Durham Cardiovascular diseases are the main cause of death in the UK causing around 156,8 deaths in in 28 (around a third of all deaths). Around 45% of
Quality And Outcomes Framework Guidance for the GMS Contract Wales 2014/15. June 2014
 Quality And Outcomes Framework Guidance for the GMS Contract Wales 2014/15 June 2014 Contents Section 1 Introduction 3 General information on indicators 4 Disease registers 6 Business rules 8 Exception
NATIONAL INSTITUTE FOR HEALTH AND CLINICAL EXCELLENCE
 NATIONAL INSTITUTE FOR HEALTH AND CLINICAL EXCELLENCE QUALITY AND OUTCOMES FRAMEWORK (QOF) INDICATOR DEVELOPMENT PROGRAMME Briefing paper QOF indicator area: Primary prevention of CVD Potential output:
Coronary heart disease and stroke
 4 Coronary heart disease and stroke Overview of cardiovascular disease Cardiovascular disease (CVD), also called circulatory disease, describes a group of diseases which are caused by blockage or rupture
National Diabetes Audit
 National Diabetes Audit Executive Summary Key findings about the quality of care for people with diabetes in England and Wales Report for the audit period 2007-2008 Prepared in partnership with: Executive
NICE Indicator Programme. Consultation on proposed amendments to current QOF indicators
 NICE Indicator Programme Consultation on proposed amendments to current QOF s Consultation dates: 18 July to 1 August 2018 This document outlines proposed amendments to a small number of QOF s in the diabetes
Proof of Concept: NHS Wales Atlas of Variation for Cardiovascular Disease. Produced on behalf of NHS Wales and Welsh Government
 Proof of Concept: NHS Wales Atlas of Variation for Cardiovascular Disease Produced on behalf of NHS Wales and Welsh Government April 2018 Table of Contents Introduction... 3 Variation in health services...
GOVERNING BODY REPORT
 GOVERNING BODY REPORT DATE OF MEETING: 20th September 2012 TITLE OF REPORT: KEY MESSAGES: NHS West Cheshire Clinical Commissioning Group has identified heart disease as one of its six strategic clinical
Dianne Johnson / Lee Panter / Sarah McNulty
 Cardiovascular Disease (heart disease and stroke) READER INFORMATION Need Identified Lead Author Cardiovascular Disease Dianne Johnson / Lee Panter / Sarah McNulty Date completed 07/02/11 Director approved
Equalities Analysis. Tobacco Control Plan for England Towards a Smokefree Generation
 Equalities Analysis Tobacco Control Plan for England Towards a Smokefree Generation July 2017 Contents 1. 2. 3. 4. 5. 6. 7. 8. 9. 10. 11. 12. 13. Introduction... 3 Engagement and Involvement... 3 Policy
The links between physical health in mental health
 The links between physical health in mental health A holistic approach to managing mental and physical health is needed. Physical and mental health are inextricably linked 1 What is the problem? It is
Physical Activity and Sport Framework Appendix 2 - Hertfordshire
 Physical Activity and Sport Framework Appendix 2 - Hertfordshire 1 CONTENTS This appendix provides a wealth of information and data to give the reader an understanding of the demographics, health information
Quality and Outcomes Framework guidance for GMS contract 2009/10. Delivering investment in general practice
 Quality and Outcomes Framework guidance for GMS contract 2009/10 Delivering investment in general practice March 2009 Contents Section 1. Principles 3 Section 2. Clinical Indicators 7 Secondary prevention
Somerset Joint Strategic Needs Assessment 2014/15
 Joint Stgic Needs Assessment 2014/15 Health Need in Areas It is possible to use the geographical location of GP practices to analyse differences between rural and urban areas. However, throughout the following
Quality And Outcomes Framework Guidance for the GMS Contract Wales 2013/14. May 2013
 Quality And Outcomes Framework Guidance for the GMS Contract Wales 2013/14 May 2013 Contents Section 1 Introduction 3 General information on indicators 4 Disease registers 6 Business rules 7 Exception
Cardiovascular Disease Joint Strategic Needs Assessment 2015
 Cardiovascular Disease Joint Strategic Needs Assessment 2015 Contents - Section Number Section Page Number 1 Introduction 2 1.1 Population, Geography & Current 6 CVD Prevalence 1.2 Predicted Future CVD
Lincolnshire JSNA: Stroke
 Lincolnshire JSNA: Stroke What do we know? Summary Around 2% of the population in Lincolnshire live with the consequences of this disease (14, 280 people) in 2010 Over 1,200 people were admitted for stroke
The South Derbyshire Health and Wellbeing Plan
 The South Derbyshire and Wellbeing Plan 2013-16 1. Vision and Aim A healthier and more active lifestyle across all communities. (c. Our Sustainable Community Strategy for South Derbyshire 2009-2029) The
Excess Winter Deaths. June 2017
 Excess Winter Deaths June 2017 1 Excess Winter Deaths Background Excess winter deaths are defined by the Office for National Statistics (ONS) as the difference between the number of deaths during the four
Public Health Outcomes Framework Key changes and updates for Peterborough: November 2017
 Public Health Outcomes Framework Key changes and updates for Peterborough: November 2017 Introduction and overview The Department of Health first published the Public Health Outcomes Framework (PHOF) for
NATIONAL INSTITUTE FOR HEALTH AND CLINICAL EXCELLENCE SCOPE
 NATIONAL INSTITUTE FOR HEALTH AND CLINICAL EXCELLENCE 1 Guideline title SCOPE Myocardial infarction: secondary prevention in primary and secondary care for patients following a myocardial infarction 1.1
GUIDE TO CODING AND DISEASE REGISTERS FOR THE CONTRACT (Scottish) Version 1.0. January 2014
 Version 1.0. January 2014") GUIDE TO CODING AND DISEASE REGISTERS FOR THE CONTRACT (Scottish) Version 1.0 January 2014 The following guidance discusses the effect of changes to the Quality and Outcomes Framework (QOF) for 2013-14
GUIDE TO CODING AND DISEASE REGISTERS FOR THE CONTRACT (Scottish) Version 1.0 January 2014 The following guidance discusses the effect of changes to the Quality and Outcomes Framework (QOF) for 2013-14
Community Needs Analysis Report
 Grampians Medicare Local Community Needs Analysis Report Summary October 2013 2 Contents Introduction 3 Snapshot of results 4 Stakeholder feedback 5 Health status of residents 6 Health behaviour of residents
Health Inequalities. Additional tables to accompany the 2016 Director of Public Health Annual Report
 Health Inequalities Additional tables to accompany the 2016 Director of Public Health Annual Report June 2017 Director of Public Health, Annual Report 2016 Supplementary Data Table no. OVERVIEW 1.1 Life
ScotPHO Tobacco Profiles Second release (January 2015)
") ScotPHO Tobacco Profiles Second release (January 2015) Salomi Barkat, Shivani Karanwal, Richard Lawder, Anna MacKinnon, Diane Stockton (ISD Scotland) and Fiona Moore (NHS Health Scotland) Contents Background...
ScotPHO Tobacco Profiles Second release (January 2015) Salomi Barkat, Shivani Karanwal, Richard Lawder, Anna MacKinnon, Diane Stockton (ISD Scotland) and Fiona Moore (NHS Health Scotland) Contents Background...
Hull s Adult Health and Lifestyle Survey: Summary
 Hull s 211-212 Adult Health and Lifestyle Survey: Summary Public Health Sciences, Hull Public Health April 213 Front cover photographs of Hull are taken from the Hull City Council Flickr site (http://www.flickr.com/photos/hullcitycouncil/).
Part 1 - Open to the Public. REPORT OF Director of Public Health
 Part 1 - Open to the Public ITEM NO. REPORT OF Director of Public Health TO Joint Lead Member Briefing for Adult Services, Health & Wellbeing ON Wednesday 5 October 2016 Public Health Monthly Briefing
Optimising Hypertension Management Clair Huckerby Pharmaceutical Adviser- Medicines Optimisation Lead
 Optimising Hypertension Management Clair Huckerby Pharmaceutical Adviser- Medicines Optimisation Lead Pharmaceutical Public Health Team The Office of Public Health and Dudley CCG Dudley - doing things
5.2 Main causes of death Brighton & Hove JSNA 2013
 Why is this issue important? We need to know how many people are born and die each year and the main causes of their deaths in order to have well-functioning health s. 1 Key outcomes Mortality rate from
Inequalities in health due to ethnicity and social deprivation an analysis of primary care data from one inner city area over a three year period
 Inequalities in health due to ethnicity and social deprivation an analysis of primary care data from one inner city area over a three year period Report to the National Audit Office Peter Schofield, PhD
DEMENTIA SERVICES REVIEW. Health and Social Care Needs Analysis. and analysis of Service Data
 DEMENTIA SERVICES REVIEW Health and Social Care Needs Analysis and analysis of Service Data April 2017 DOCUMENT TRAIL AND VERSION CONTROL SHEET Heading Dementia Health Needs Analysis and Service Data analysis
Health and Community. Directorate Health Health and and Wellbeing Community in Halton
 Health and Community Directorate Health Health and and Wellbeing Community in Halton Directorate HeaHealth and Wellbeing in Halton Joint Strategic Needs Assessment for Halton 2008 Contents Tables... 5
Guideline scope Hypertension in adults (update)
") NATIONAL INSTITUTE FOR HEALTH AND CARE EXCELLENCE Guideline scope Hypertension in adults (update) This guideline will update the NICE guideline on hypertension in adults (CG127). The guideline will be
NATIONAL INSTITUTE FOR HEALTH AND CARE EXCELLENCE Guideline scope Hypertension in adults (update) This guideline will update the NICE guideline on hypertension in adults (CG127). The guideline will be
SOUTHWARK OLDER PEOPLE S JSNA
 SOUTHWARK OLDER PEOPLE S JSNA March 2012 1 Southwark s JSNA for Older People: Overview and Recommendations Factsheet: The older population Factsheet 2: Wider determinants of Health in Older People (Income,
Pre-Conception & Pregnancy in Ohio
 Pre-Conception & Pregnancy in Ohio Elizabeth Conrey, PhD 1 January 217 1 State Maternal and Child Health Epidemiologist, Ohio Department of Health EXECUTIVE SUMMARY The primary objective of the analyses
INFORMATION TO SUPPORT THE DEVELOPMENT OF THE LINCOLNSHIRE CANCER STRATEGY
 INFORMATION TO SUPPORT THE DEVELOPMENT OF THE LINCOLNSHIRE CANCER STRATEGY Refreshed March 2013 Ann Ellis, Health Improvement Principal, NHS Lincolnshire Andrew Smith, Information Analyst, NHS Lincolnshire
Map 6: Percentage of people in the National Diabetes Audit (NDA) with Type 1 diabetes receiving all nine key care processes by PCT
 with Type 1 diabetes receiving all nine key care processes by PCT") 78 NHS ATLAS OF VARIATION ENDOCRINE, NUTRITIONAL AND METABOLIC PROBLEMS Map 6: Percentage of people in the National Diabetes Audit (NDA) with Type 1 diabetes receiving all nine key care processes by PCT
78 NHS ATLAS OF VARIATION ENDOCRINE, NUTRITIONAL AND METABOLIC PROBLEMS Map 6: Percentage of people in the National Diabetes Audit (NDA) with Type 1 diabetes receiving all nine key care processes by PCT
Hull and East Riding. Chronic Obstructive Pulmonary. Disease (COPD) Equity Audit
 Equity Audit") Hull and East Riding Chronic Obstructive Pulmonary Disease (COPD) Equity Audit December 2010 Robert Sheikh Iddenden, Andrew Taylor, Jenny Walker Hull and East Riding Chronic Obstructive Pulmonary Disease
Hull and East Riding Chronic Obstructive Pulmonary Disease (COPD) Equity Audit December 2010 Robert Sheikh Iddenden, Andrew Taylor, Jenny Walker Hull and East Riding Chronic Obstructive Pulmonary Disease
4. Health outcomes. 4.1 Life Expectancy. A profile of rural health in Wales. Fig. 22: Life expectancy at birth in fifths for persons
 4. Health outcomes 4.1 Life Expectancy Fig. 22: Life expectancy at birth in fifths for persons 1999-2003 Lowest fifth Next lowest fifth Medium fifth Next highest fifth Highest fifth Urban areas Fig. 23:
NHS TRAFFORD CLINICAL COMMISSIONING GROUP GOVERNING BODY 30 th June 2015
 Agenda Item No: 17 Part 1 X Part 2 NHS TRAFFORD CLINICAL COMMISSIONING GROUP GOVERNING BODY 30 th June 2015 Title of Report Purpose of the Report Tackling Health Inequalities in Trafford and CCG/Public
LOCALITY PROFILE PROFILE FOR WEST MID BEDS LOCALITY Public Health Evidence & Intelligence Directorate of Public Health
 LOCALITY PROFILE PROFILE FOR WEST MID BEDS LOCALITY 2013 Public Health Evidence & Intelligence Directorate of Public Health Policy & Document West Mid Beds Locality Profile 2013 (Phase 1) Operational &
Public Health Outcomes Framework. Summary for East Sussex. Indicators at a glance (February 2017)
") Public Health Outcomes Framework Indicators at a glance (February 2017) Notes: - Value cells are shaded red, amber or green to show significance compared to England, or where the value can be benchmarked
Public Health Outcomes Framework Indicators at a glance (February 2017) Notes: - Value cells are shaded red, amber or green to show significance compared to England, or where the value can be benchmarked
Health & Wellbeing Strategy. Lorna Payne Group Director Adults & Health
 Health & Wellbeing Strategy Lorna Payne Group Director Adults & Health Statutory Duty Local authority and CCG, through HWB, joint duty under Health and Social Care Act 2012 to prepare a Health and Wellbeing
NHS Stop Smoking Services
 NHS Stop Smoking Services May 2016 Produced by Colin Thompson: Public Health Consultant (Colin.Thompson@Kent.gov.uk) Rachel Kennard: Senior Intelligence Analyst (Rachel.Kennard@kent.gov.uk) Zara Cuccu:
Four Years of NHS Health Checks in Barnsley - Outcomes and Inequalities
 Four Years of NHS Health Checks in Barnsley - Outcomes and Inequalities Summary After four years of NHS Health Checks, Barnsley has access to aggregated data on over 47,000 people. This data was analysed
SCHEDULE 2 THE SERVICES
 1 SCHEDULE 2 THE SERVICES A. Service Specifications Mandatory headings 1 4: mandatory but detail for local determination and agreement Optional headings 5-7: optional to use, detail for local determination