BASILDON. Joint Strategic Needs Assessment (JSNA) Product for Clinical Commissioning Groups. May 2012
|
|
|
- Malcolm Wilcox
- 5 years ago
- Views:
Transcription

1 BASILDON Joint Strategic Needs Assessment (JSNA) Product for Clinical Commissioning Groups May 2012 NHS South West Essex Public Health Informatics Team Ian Wake, Consultant in Public Health Emma Sanford, Epidemiologist Vikki Ray, Health Needs Assessment Manager Tom Fowler, Senior Public Health Information Analyst 1
2 2 Contents 1. INTRODUCTION RECOMMENDATIONS FOR KEY CCG COMMISSIONING/QIPP PRIORITIES IN BASILDON Circulatory Disease Respiratory Disease Endocrine, Nutritional and Metabolic Problems Lung Cancer Lifestyle Issues 8 3. EXECUTIVE SUMMARY OF THE CLINICAL COMMISSIONING ISSUES IN BASILDON Demographics Burden of Illness Overall Analysis of spend Cost and Quality - Cancers and Turnaslo Cost and Quality - Endocrine Cost and Quality - Mental Health Learning Disabilities Neurological Conditions Eye & Vision Circulatory Diseases Respiratory Diseases Skin Condition Musculo-Skeletal system and Trauma Genito-Urinary System Maternity and Reproductive Health Healhty Individuals Social Care Needs Older People Health and Well-Being End of Life Care GMS / PMS and Pharmaceutical Services Diagnostics Services Prescribing KEY DEMOGRAPHICS Population Level of Deprivation Life Expectancy Summary / Conclusions BURDEN OF DISEASE AND PREVENTING ILL HEALTH Disease Prevalence Emergency Admissions Mortality Summary / Conclusions OVERALL ANALYSIS OF SPEND Programme Budgeting and SPOT tool analysis Overall Programme Budgeting Spend 34
3 6.3 Spend in NHS South West Essex compared to the ONS cluster group Spend versus Outcomes in South West Essex and our ONS Cluster Procedures of limited clinical value Conclusions - overall Analysis of Spend COST AND QUALITY ANALYSIS BY DISEASE CONDITION Cancer and Tumours Spend on Cancers and Tumours Key Indicator Outcomes for Cancers and Tumours Cancer Screening Cervical Cancer Screening Breast Cancer Screening Colerecta (Bowel) Cancer Screening Summary / Conclusions ENDOCRINE, NUTRITIONAL AND METABOLIC PROBLEMS Summary / Conclusions MENTAL DISORDERS Improving Access to Psychological Therapies Summary / Conclusions LEARNING DISABILITIES NEUROLOGICAL CONDITIONS Conclusions PROBLEMS OF VISION PROBLEMS OF CIRCULATION Summary / Conclusions PROBLEMS OF THE RESPIRATORY SYSTEM Summary / Conclusions PROBLEMS OF THE SKIN PROBLEMS OF MUSCULO-SKELETAL SYSTEM AND TRAUMA Summary / Conclusions PROBLEMS OF THE GENITOURINARY SYSTEM Summary / Conclusions MATERNITY AND REPRODUCTIVE HEALTH Summary / Conclusions PREVENTING ILL HEALTH AND IMMUNICATION Smoking Alcohol Obesity Childhood Obesity 123 3
4 9.3.2 Adult Obesity Immunisations Summary / Conclusions SOCIAL CARE NEEDS AND THIRD SECTOR COMMISSIONING GMS/PMS AND PHARMACEUTICAL SERVICES Summary / Conclusions OLDER PEOPLE HEALTH AND WELLBEING Summary / Conclusions END-OF-LIFE CARE Summary / Conclusion DIAGNOSTIC SERVICES Summary / Conclusions 143 Appendix A: Methodology for modelled estimates of expected number of emergency admissions by PCT 144 Appendix B: List of GP Practices in Basildon District 146 4
5 BASILDON JOINT STRATEGIC NEEDS ASSESSMENT PRODUCT for CLINICAL COMMISSIONING GROUPS 1. INTRODUCTION The Basildon District is situated in the southern part of Essex, 30 miles east of London. Covering some 42.5 square miles, the District includes the towns of Basildon, Billericay and Wickford. Some 70% of the District is rural with large areas of open farmland and scattered rural developments. Basildon is the largest district in the East of England region and the Council serves a population of approximately 172,000 people. The main areas of employment are engineering, retail, distribution and financial services. As a major player in the Thames Gateway region, Basildon is a priority area for regeneration and is recognised as the business and economic hub of South Essex. Basildon is now the second biggest employment zone in the Thames Gateway, outside of Canary Wharf. The population is currently served by Basildon District Council and NHS South Essex. The Basildon and Brentwood Clinical Commissioning Group (BBCCG) is a Clinical Commissioning Group that is geographically coterminous with Basildon District Council and Brentwood Borough Council areas. These are second tier local authorities, and as such BBCCG serves as population that is also served by Essex County Council. BBCCG is made up of four groups of GP Practices termed localities. Three of the four locality groups serve a population coterminous with Basildon District Council s population the Arterial Locality which serves populations in Billericay, Wickford and Pitsea, and the Partnership and Basildon Multi-Consortia localities that serve populations in Basildon town. BBCCG is responsible for ensuring that its commissioning plans link to Essex Shadow Health and Wellbeing Board s Joint Strategic Needs Assessment process (of which this product is part of), and to the priorities in the Essex Shadow Health and Wellbeing Strategy. BBCCG recently obtained status as a sub group of the Board of NHS South Essex and from April 2013 will be responsible for commissioning secondary health care services for the population of Basildon and Brentwood including leading on commissioning of the Basildon and Thurrock University Hospital trust contract for all CCGs in South Essex. This document has been produced with the intention of assisting Clinical Commissioning Groups (CCGs) in developing commissioning priorities. It provides a clinical profile of the population of Basildon, and compares local performance, spend and quality against other areas of England to identify where we are outliers. As such it should also provide a useful mechanism to assist the BBCCG and three localities that fall into the Basildon District Council area, in developing future QIPP priorities. Data is presented at a Basildon District Council level where available. However much health comparator data is only currently available at PCT level and where this is the case, the performance of South West Essex PCT has been compared with other PCTs in England. 5
6 The document does not generally consider data at a GP practice level as it is designed to be a commissioning tool for GP consortia rather than a primary care performance improvement document. However, on clinical issues where Basildon (or South West Essex PCT) is identified as an outlier compared to England or our Office of National Statistics (ONS) cluster PCTs (PCTs with similar population demographics), the Basildon CCG may wish to drill further down to GP practice level to identify where improvements could be made. The Public Health Informatics function is available to support this work if required. 6
7 2. RECOMMENDATIONS FOR KEY CCG COMMISSIONING/QIPP PRIORITIES IN BASILDON This report recommends that Basildon CCG prioritise the following areas for further investigation, care pathway commissioning review and development of QIPP programmes. 2.1 Circulatory Disease SWE PCT currently has the greatest spend per head on Circulatory Diseases compared to all of the other 23 Programme Budgeting disease categories (excluding other ). Our spend is greater than 2SDs (Standard Deviations) from mean spend within our ONS Cluster of PCTs (PCTs with similar population characteristics. It also spends more per head on coronary heart disease than any other PCT in England Case finding for CHD, Hypertension, Heart failure is poor, particularly hypertension which is a key driver for many other circulatory diseases. Despite high spend, clinical outcomes for patients are only average, and emergency admission rates for CHD are high. The CCG should: - Review commissioning arrangements of the relevant clinical care pathways in terms of circulatory disease, particularly CHD to ensure implementation of NICE Guidance /evidence of best practice and with a view to improving quality and efficiency and reducing cost - Identify practices within the consortia with poor case finding for hypertension, CHD and Heart Failure and ensure that this is addressed. - Ensure that National Institute of Clinical Excellence Guidelines for management of patients with Hypertension are being implemented by all practices. (NICE CG127, August Respiratory Disease Programme spend in South West Essex for respiratory problems are amongst the largest in England. Whilst outcomes in some areas of the programme are good including asthma and bronchitis, COPD has poor outcomes and poor case finding. The CCG should: - Review commissioning arrangements of the COPD care pathway to ensure evidence of best practice and with a view to improving quality and efficiency and reducing cost, ensuring current commissioning arrangements reflect the latest NICE Guidance for Commissioning Services for COPD (CMG43, January 2012). - Identify practices within the consortia with poor case finding for COPD and ensure that this is addressed. 7
8 2.3 Endocrine, Nutritional and Metabolic Problems The spend on Endocrine, Nutritional and Metabolic problems within SW Essex is above the ONS group average and is in the top quintile for spend nationally whilst performance and clinical outcomes are average. 50% of spend on this programme relates to diabetes, where South West Essex practices have below average performance in five out of 12 QOF indicators suggesting poor clinical management. Case finding for diabetes within primary care is also poor. The CCG should: - Review commissioning arrangements of the Diabetes care pathway(s) against NICE Guidance to ensure evidence of best practice is being implemented locally with a view to improving quality and reducing cost. - Identify practices with poor case finding of diabetic patients and address this - Ensure practices improve the management of patients with diabetes in primary care. 2.4 Lung Cancer Despite having below average spend per head of population on cancers as a whole, SWE PCT spends more per head on lung cancer than any other PCT in England. Despite having below average spend per head of population on cancers as a whole, SWE PCT spends more per head on lung cancer than any other PCT in England. The CCG should: - Work with the Essex Cancer network to review commissioning of the lung cancer care pathway against NICE Guidance to ensure quality and value for money. - Work with the Essex County Council Public Health Team and the Health and Essex Health and Wellbeing Board to ensure appropriate Tobacco Control programmes and early detection of lung cancer programmes are commissioned - Ensure that practices participate fully in smoking cessation initiatives by identifying and referring current smokers into commissioned smoking cessation services 2.5 Lifestyle Issues Although Local Government have the key commissioning responsibility for lifestyle programmes, GP Practices within CCGs have a key part to play in promoting healthy lifestyles to patients, delivering interventions or making appropriate referrals. Smoking prevalence in Basildon is significantly greater than regional and national rates and smoking cessation services are failing to impact on health inequalities by increasing quit rates of deprived communities over affluent ones. Obesity prevalence in Basildon is significantly greater than regional and national rates, yet Obesity QOF registers are below the expected levels. This is a result of low levels of physical activity and healthy eating amongst adults, compared to regional and national rates. Breastfeeding prevalence is also poor compared with comparator areas. Bottle feeding is a driver for obesity. Alcohol related hospital admissions are increasing at a faster rate than England s and emergency admissions for coronary heart disease are significantly greater in Basildon compared to England. 8
9 Alcohol, obesity and smoking are key drivers for hypertension and all the other four disease areas highlighted above. Focusing on primary prevention initiatives to address poor lifestyles is highly cost effective and will reduce secondary health care costs in the short, medium and long term. The CCG should: - Work with the Essex Health and Wellbeing Board and Essex County Council Public Health staff to ensure that appropriate lifestyle programmes are commissioned locally - Ensure practices promote healthy lifestyles to patients and refer patients into smoking cessation, obesity prevention/treatment, NHS checks, and alcohol brief screening and intervention commissioned programmes SUMMARY OF OTHER ISSUES THAT MAY WARRANT FURTHER INVESTIGATION Issue SW Essex PCT is in the highest spending quintile of expenditure per 100,000 population against all PCTs in England, particularly for burns where South West Essex is the second highest ranking PCT by spend in England. SW Essex PCT s spend on Disorders of the Blood ranks 4 th out of 152 PCTs with the majority of costs in secondary care Page Number SW Essex PCT s spend on Endocrine ranks 11 th out of 152 PCTs 35 South West Essex continues to have a large Miscellaneous Programme budgeting category. Investigating possible reasons why this category is so large recurrently for SWE will help re align any relevant spends to more appropriate programme budgeting categories and give a more accurate picture for spend and outcome analysis in the future. SW Essex PCT has a high number of cancer bed days and a large gap between the number of people who are on a palliative care register compared to what we would expect to find given our populations characteristics Casefinding (Diagnosis) of Diabetes is lower than expected in Basildon,and there is poor performance on some of the QOF disease management indicators for SW Essex. However, SW Essex has achievement significantly better than the national average in diabetes emergency admissions /61 SW Essex PCT s spend on Respiratory (other) ranks 15 th out of 152 PCTs 91 SW Essex PCT ranks very highly against other PCTs in terms of emergency readmissions to hospital within 28 days of discharge following fractured proximal 102 femur warrants further investigation. Most GP practices have CKD registers that are not statistically different from expected, however there are a few which may require further investigation
10 Issue There is a high rate of deliveries by C-Section and the large increase between 08/09 and 09/10 which may be unjustified and require improvements to the maternity care pathway Overall, women smoking at delivery has decreased in Basildon between 2006 and 2009, furthermore, at a rate faster than the East of England and England. However, it is worth noting the slight increase between that may warrant further monitoring and or investigation. Page Number Overall prescribing of anti-biotics in SW Essex is high compared to England PCTs 134 There are considerable differences in prescribing behaviours of different GP practices in terms of cost and quality within Basildon Basildon has a significantly higher proportion of people dying at hospital than the national average and is a major outlier when compared to other LA populations in England SW Essex PCT has a significantly higher rate of use of MRI and CT activity for its population than compared nationally
11 3. EXECUTIVE SUMMARY OF THE CLINICAL COMMISSIONING ISSUES IN BASILDON 3.1 Demographics The resident population of Basildon is greater in the younger (0-4, 5-9 and 10-14) and middle years (45-49) with a greater proportion of females than males aged over 44 years. A large proportion of practices in Basildon have high IMD scores indicating a greater level of deprivation. However, it is important to point out that four of the five least deprived practices in SW Essex are within the Basildon district indicating the large differences in deprivation within Basildon. Life expectancy has increased in both males and females within the Basildon locality from with life expectancy being greater in females than males. 3.2 Burden of Illness With the expected ageing and growth of the population and the drive to ensure earlier identification of many chronic conditions, we can expect a rise in disease prevalence and consequential increase in demand on health and social care services. However, early intervention and better clinical management of chronic health conditions can ameliorate expensive secondary care costs, particularly in terms of emergency admissions. Mortality rates have been significantly worse in SW Essex than the EoE average in every two year period from 2001 to 2008 for males, females and for both males and females combined. In Basildon Borough Council average disease prevalence for all practices is higher in eight of the 18 QOF conditions compared to the national average. Comparing numbers of patients on a chronic disease register to modelled expected prevalence suggests that the majority of practices within Basildon have less CHD, COPD and hypertensive patients on QOF disease registers than is expected suggesting poor case finding. This warrants further investigation as failure to identify and appropriately patients with chronic conditions will impact on patient health and drive significant increases in CCG future healthcare costs. 3.3 Overall Analysis of Spend There are some discrepancies in how individual PCTs may allocate expenditure across the list of categories used in the national programme budgeting analysis. Therefore some information provided in this report should be treated with caution. Programme budgeting information and analysis is only available at a PCT rather than LA level. NHS South West Essex has the highest expenditure per 100,000 population of any PCT in England on lung cancer, even though over all cancer spend rate is ranked at 103 out of 152 PCTs nationally. It is also has the highest expenditure per 100,000 for coronary heart disease, which contributes to the PCTs overall rank of 3 rd out of all PCTs for problems of circulation. This expenditure is likely to be a product of a large prevalence of smoking in our deprived populations, and working through Health and Wellbeing Boards to ensure appropriate Tobacco 11
12 Control Programmes are commissioned together with commissioning programmes that encourage the early detection of lung cancer and circulatory diseases are likely to impact positively on this issue. Spend on disorders of the blood ranks 4 th out of 152 PCTs with the majority of costs in secondary care. This warrants further investigation. Other areas of high spend compared to other PCTs are: Burns in Problems of the skin (ranked 2 nd out of 152 PCTs) Endocrine (ranked 11 th out of 152 PCTs) Problems of the respiratory system (other) (ranked 15 th out of 152 PCTs) Compared to our ONS cluster of PCTs, spend in SW Essex on the majority of programmes is lower. It is difficult, however, to conclude that no shift in spend needs to be made as we have a large spend in the Miscellaneous category which may reflect differences in coding between PCTs. Indeed if spending across all programme budgeting categories was brought into line with ONS PCT cluster averages, a net saving of 5,923,652 per annum would be delivered. Spend on Circulatory Disorders and Blood Disorders are over two standard deviations greater than the mean for our ONS cluster despite delivering only average outcomes. Further investigation is required as these are also high spending areas in absolute cash terms. 3.4 Cost and Quality Cancers and Tumours Spend on cancers and tumours in SWE is slightly below average for both England and ONS comparator PCTs. According to programme budgeting data South West Essex has the highest spend per head of all PCTs in England. Given the large disparity further investigation is needed in order to determine whether this spend is real or a coding issue. Given the large smoking population in Thurrock it is likely that at least some of this disparity is real spend. Although the incidence of cancer is comparatively low and mortality levels comparable to England, low numbers of people on palliative care registers may be resulting in a significantly higher number of cancer bed days being used (55.5 per 1000 pop vs 54.2 per 1000 pop). A decline in the number of patients being seen within two weeks could be detrimental to patients prognosis and to the areas future survival and mortality rates. The importance of maintaining a high level of cervical cancer screening and better targeting in year old women is clear. The Bowel Screening Programme is still in its early stages but to have a real impact on patients prognosis, and in incidence, and mortality rates, coverage needs improving. 12
13 3.5 Cost and Quality - Endocrine The spend on Endocrine, Nutritional and Metabolic problems within SW Essex is above the ONS group average and is in the top quintile for spend nationally. Despite this high spend SW Essex is performing at an average standard compared to all PCTs in England. SW Essex has achievement significantly below the national average in five of the 12 QOF diabetes indicators. Particular areas of concern include ACE inhibitor therapy and microalbuminuria testing where SW Essex is one of the worst performing PCTs nationally. SW Essex has achievement significantly above the national average in four of the QOF indicators with no significant difference with the England average in the remaining three indicators. More than 50% of diabetes patients in South West Essex are not receiving all 9 of the key care processes for Diabetes care as outlined by NICE; the complications associated with not keeping diabetes under control can have a huge financial impact. Interestingly SW Essex (-17%) and Brentwood (-25%) have significantly less diagnosed diabetes patients than expected. Thurrock (+9%) and Basildon (+3%) have significantly more diagnosed diabetes patients than expected. Given that detection of cases is lower than expected,and there is poor performance on some of the disease management indicators. One might expect that secondary care use, might be high, however, this is not the case: In terms of Secondary Care indicators SW Essex has achievement significantly better than the national average in diabetes emergency admissions per 100 on the disease register. SW Essex is performing significantly better in the number of bariatric procedures compared to the national average although there is no significant difference in the remaining Secondary Care indicators. One explanation of this disparity could be that patients are being diagnosed at a later stage of their diabetes and so being managed (well) in outpatients departments. Further investigation would need to be had in order to refute or accept this hypothesis. Improved early detection and management of the condition would have a great financial impact. Rates of mortality (<75) from diabetes are statistically in line with the England average (slightly lower). 3.6 Cost and Quality Mental Health Spend on Mental Health is currently low compared to our ONS Cluster and England average. It is estimated that 62% of our population who have Dementia are undiagnosed and of those who are diagnosed, only 76% are diagnosed have had a care review in the last year. This has resulted in South West Essex being in the highest quintile nationally for the rate of hospital admissions for Alzheimer s disease and Dementia, and means that the physical, Mental Health, and Social care needs are potentially not being met. The improving Access to Psychological Therapies (IAPT) programme in South West Essex is currently running well, and as a result almost 5 people per month are moving people from benefits into employment. 13
14 3.7 Learning Disabilities Spend on Learning Disabilities is in line with National and Cluster averages. 3.8 Neurological Conditions Our spend on this programme is average compared to other PCTs in the country. It is estimated that almost 20% of our registered practice population suffering from epilepsy are unknown to local clinicians. 3.9 Eye and Vision SW Essex has an average to low spend in the area of vision despite having a significantly high surgical intervention rate for cataracts. A lower than expected diabetic detection rate as shown in could give rise to increased spending with late diagnosis and complications from diabetes Circulatory Diseases Spend on this programme is significantly above average with SW Essex being the highest and third highest spending PCT nationally on coronary heart disease and overall problems of Circulation respectively. Mortality rates continue to improve and are significantly better than average. There is marked variation in observed and expected circulatory diseases prevalence rates, and observed rates are much lower than expected rates across CHD, Hypertension, Heart Failure and Stroke indicating poor case finding. Basildon has rates of emergency admissions for CHD significantly lower than the national average. Improving case finding and hence early intervention and management of CHD is likely to reduce emergency admissions rates which in turn should reduce overall spend on this programme. SW Essex has up to 38% of patients with Hypertension who are not on a disease register and therefore may not be getting appropriate clinical care to manage their disease. Hypertension is one of the leading causes of CHD, HF, Stroke and is a cause of CKD. Given that it can be easily controlled using drugs, it is imperative that more is done to keep it at a safe and healthy level within the population of SW Essex. The health effects from lowering blood pressure can be key in lowering the burden of disease from CVD and decreasing the large associated costs. It should therefore become a priority within SW Essex to find and treat people with hypertension. SW Essex has average performance in the management of its patients on disease registers relating to circulation. SW Essex is performing better than the national average with regards to BP for CHD and Stroke/TIA but significantly worse with regards to cholesterol for, CHD and Stroke/TIA. SW Essex needs to improve its performance in maintaining cholesterol levels below 5mmol in CHD and Stroke / TIA patients to decrease the costs associated with further complications. Consistent and effective lifestyle interventions will improve management of these patients. SW Essex has an average rate of coronary artery bypass graphs (CABG) and a rate of percutaneous transluminal coronary angioplasty (PTCA) significantly below average. SW Essex CCGs and GP practices within them should take further actions to tackle problems of Circulation including: Promoting smoking prevention and cessation Promotion of physical activity at all ages Improve management of cholesterol 14
15 Dissemination, implementation and monitoring of NICE guidance particularly in terms of identification and treatment of patients with hypertension Redeploy resources from lower cost-effective interventions 3.11 Respiratory Diseases Programme spend in south west Essex for respiratory problems are amongst the largest in England, with the PCT falling into the worse performing quintile. Although directly standardised mortality rates for Asthma and Emphysema and Bronchitis are significantly better than national rates, when other COPD is considered, our rates as a PCT and in Basildon are significantly worse. Case finding at a practice level for COPD is currently poor and improving this will likely impact positively on both outcomes for patients and overall programme spend. As such it is recommended that the CCG considers developing QIPP schemes to improve case finding, improve clinical management and reduce spend on COPD. Smoking is also the key risk factor for COPD and reducing smoking prevalence across Basildon should be a key priority for all key agencies 3.12 Skin Conditions South West Essex currently has a high spend on Conditions of the skin, we currently lie in the highest quintile nationally and are spend the second most in our cluster. More detailed analyses needs to be conducted to assess why this is Musculo-Skeletal system and Trauma South West Essex generally performs well on this programme. Despite Programme budgeting spend being average for England, outcomes are generally significantly better than for England, specifically in the areas of Primary and Revision Hip Replacements, Knee replacements, Emergency Admissions for Hip Replacements, and mortality from falls in the over 65s. The PCT has commissioned comprehensive falls prevention programmes since 2005 and these may partly explain our good performance on this programme. The high ranking of the PCT in terms of mean PROMS score for Hip Replacement suggests that our population are having hip replacements at a relatively early stage in terms of their health deterioration compared with other PCT populations. Given that the rate of Hip Replacements performed on our population is significantly lower than the England average, this does not suggest that we are performing unnecessary procedures. The very high ranking of the PCT in terms of emergency re-admissions to hospital within 28 days of discharge following fractured proximal femur warrants further investigation Genito-Urinary System SW Essex is one of the lowest spending PCTs nationally on problems of the Genitourinary System. However, SW Essex is performing at a comparable level given the lack of spend on this programme. SW Essex is not performing significantly worse when compared with the England average in any of the areas recorded within this programme. SW Essex is performing significantly better than the national average on kidney function testing, testing more patients relative to the national average. 15
16 That said, there are still improvements that can be made to the performance of SW Essex within this programme including better management of diabetes and hypertension to prevent renal failure Maternity and Reproductive Health Spend on Maternity and Reproductive Health is comparably high in South West Essex. This is partly explained by the fact that we have a comparably high birth rate. However, the high rate of deliveries by C-Section and the large increase between 08/09 and 09/10 may be unjustified and warrants investigation to determine whether there are potential improvements to be made to care pathways along with associated cost savings. Overall the rate of conceptions for females aged in Basildon has increased. Basildon rates remain higher than the East of England and England. More recently, the gap between conceptions nationally and Basildon is widening. Teenage pregnancy is a major driver a health inequality, both in terms of poor health and wellbeing outcomes for both parent and child, and because children of teenage mothers are much more likely to become teenage parents themselves, perpetuating inequality across generations. Lee Chapel North, Fryerns and Pitsea South East have conception rates significantly higher than that of England. The Billericay East, Billericay West and Burstead have rates significantly lower than England. Higher conception rates are generally found in wards with high deprivation. The rate of conceptions in Basildon has decreased between 1998 and 2009, but more recently it is increasing and those leading to abortion have also increased. Whilst termination has an associated initial cost, it could be argued to be a better result in terms of impact on reducing health inequalities, as a positive driver to reducing teenage maternities. It may also suggest an increase in aspiration within Basildon young people, as there is strong evidence that the aspirations and life chances of an under18 year old girl correlates positively with her decision to opt for a termination rather than a birth. That said, primary prevention of under 18 conceptions remains the best possible outcome for both our population and health economy and considering the recent trends in conception rates may need to be reviewed. There is a large gap between the breast feeding initiation rates in South West Essex compared to England and the East of England. Evidence suggests that breastfeeding reduces the risk of later consequences (to child in terms of childhood illness and mother in terms of breast cancer prevention), therefore there is potential in the reduction of costs in other areas by encouraging mothers to breast feed. Overall, women smoking at delivery has decreased in Basildon, furthermore, at a rate faster than the East of England and England. However, it is worth noting the slight increase between that may warrant further monitoring and or investigation. Basildon has a statistically significantly lower rate of smoking at time of delivery at 95% confidence compared to the East of England and England. From a public health point of view, this is mostly encouraging, although rates of smoking at time of delivery are likely to vary between different geographical areas of Basildon and correlate with deprivation levels. Basildon has an infant mortality rate that is lower than the average. 16
17 3.16 Healthy Individuals SW Essex PCT is in the highest quintile in terms of spend on preventing ill health per head of population when compared to other PCTs in England. However, given its high levels of deprivation is to be expected. When compared to its ONS cluster of PCTs, SW Essex spend on preventing ill health is average. Basildon has a smoking quit rate greater than the England, Thurrock and SW Essex average. However, smoking quit rate per 100,000 population will be a product of the proportion of the population of each PCT that smoke as well as the success of commissioned services in helping smokers quit at a population based level, and therefore should be interpreted with caution as a measure in terms of success in reducing smoking prevalence Smoking is strongly associated with deprivation. Within Basildon, the most deprived quintile in the CCG cluster has smoking prevalence rates almost three times that of the population living in the least deprived quintile. This is significant, as differences in smoking prevalence between affluent and deprived communities are this single biggest cause of health inequalities. NHS stop smoking services are successful at helping some smokers quit, they are failing to impact on health inequalities across the Basildon and Brentwood cluster, as smokers in our most deprived communities are not quitting smoking at a rate greater than our affluent ones. The rate of alcohol admissions for the Basildon population is greater than for the SW Essex population and regional averages but less than the national average. From to , admissions for Basildon have trended upwards, in line with England and SW Essex population, although have remained less than the rate for England. However, from to , the gap in admission rate between Basildon and England has narrowed, with admissions in Basildon increasing at a faster rate than those for England. Early identification of patients in primary care who are drinking at hazardous or harmful levels together with brief or extended alcohol interventions will impact positively on alcohol admission rates and have been shown to be extremely cost effective. Commissioning hospital based alcohol services that aim to provide tier II, III and IV alcohol related services to those admitted for disease related to alcohol have also shown to be highly cost effective and should be considered. Basildon has a greater percentage of obese adults than Brentwood and regional and national averages. There is no significant difference in prevalence of adult obesity between Basildon, Thurrock and Havering. There are 18,070 people on the Obesity registers of practices within Basildon in March 2011, giving a prevalence of 9.7%. This prevalence is significantly less than 24.2% obesity prevalence that was calculated from the Health Survey for England, suggesting significant under recording of obesity on GP practice registers. Basildon has a lower percentage of adults who are physically active compared to regional and national rates and 10 ONS comparator local authorities. However, because of the relatively wide confidence intervals we cannot conclude that there is any statistically significant difference between Basildon s percentage of physically active adults and that of any other comparator local authority or regional or national rates. 17
18 Basildon has a lower prevalence of healthy eating amongst adults compared to the East of England average and it has the third lowest percentage of healthy eating adults compared to its CIPFA local authority comparators. Basildon has a childhood obesity prevalence that is significantly less than England s and two of its ONS comparator local authorities. There is no statistically significant difference between childhood obesity prevalence in Basildon compared to the East of England region and the remaining ONS local authority comparators. Childhood Immunisation coverage has improved in SW Essex in the last three years significantly, and shows a slight improvement between and on every vaccination except Diphtheria, Tetanus, Polio and Pertussis booster, although the differences between the two years are small and could be due to random variation, coverage of Diphtheria, Tetanus, Polio and Pertussis booster and MMR remain below the 95% required for herd immunity. Childhood immunisations remain one of the most cost effect health interventions that the NHS undertakes, in terms of return on investment, and ensuring 95% herd immunity for all childhood immunisations is an important priority. SW Essex is in the best performing quintile and one of the best performing PCTs in England for flu vaccination coverage in the 65+ population Social Care Needs SW Essex is in the bottom quintile of spenders nationally and below the ONS Cluster Group average. The evidence suggests that collaborative working around carers support, community development and improved engagement with the third sector will promote innovative approaches in prevention work, support improved productivity and can contribute to significant savings to health and social care spend Older People Health & Well-being Emergency admissions in people aged 75 years and over within SW Essex are significantly lower than the national average. Up to 13.4% of the population of many wards within SW Essex are providing unpaid care. This is worrying because it is likely that these carers may be suffering from ill health themselves. The growth in the ageing population will translate into additional pressure on all services, especially with an increase in neurological, circulatory, endocrinology, respiratory and mental health conditions End of Life Care Basildon has a significantly higher level of deaths happening in hospital than the national average and is a major outlier compared to other local authority populations in England. The aim should be to achieve higher rates of patients dying at their place of choice (e.g. at home) and this requires collaborative working and good planning. Improving the number of patients recorded on a palliative care register and thus having and end of life plan might help to achieve this GMS/PMS and Pharmaceutical Services SW Essex is in the bottom quintile, below the ONS Cluster average and is spending less than all of the ONS Cluster comparators. 18
19 3.21 Diagnostic Services SW Essex has a significantly higher rate of use of MRI and CT activity for its population than compared nationally. It would be interesting to ascertain why SW Essex has such a significantly higher rate than compared nationally. This warrants further investigation Prescribing Programme Budgeting spend across SWE on GMS/PMS and Pharmaceutical services is generally low compared to other PCTs and our ONS PCT cluster. The percentage of all lipid lowering drugs prescribed as ezetimibe and the percentage of cephalosporins and quinolones as a percentage of all antibacterial drugs are also relatively low compared with other PCTs in England and in line with regional averages. This suggests across SW Essex prescribing behaviour is of relatively high quality. There are however significant differences between GP practices in Basildon in terms of prescribing behaviour which provides further scope for QIPP savings and quality improvements. Similarly, overall prescribing of anti-biotics is high compared to England PCTs and warrants further investigation. 19
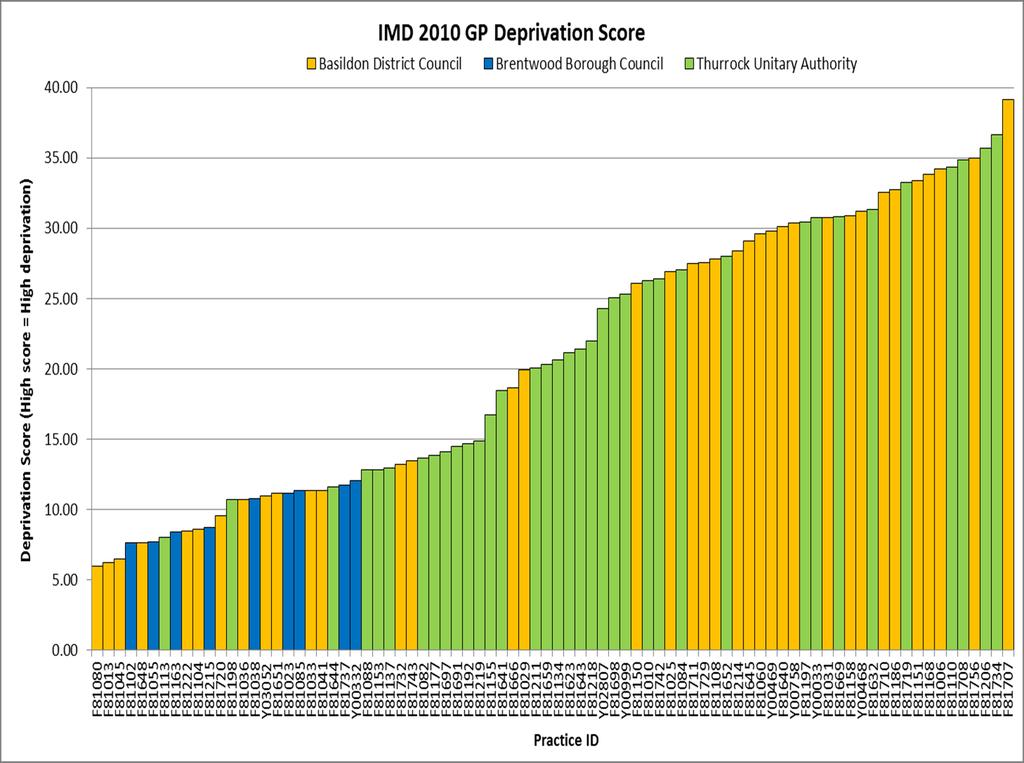
20 Age Group 4. KEY DEMOGRAPHICS 4.1 Population Figure 1 shows the 2010 population distribution, by age and sex, of Basildon compared to the 2010 England average. The percentage resident population of Basildon is greater in the younger (0-4, 5-9 and 10-14) and middle years (45-49) compared with the England average. There are a greater percentage of females than males aged over 44 years. Figure 1. Basildon population Resident Population of Basildon - June % of Total Population England Females England Males Basildon Females Basildon Males 4.2 Level of Deprivation Figure 2 shows GP practice level deprivation scores using the index of multiple deprivation (IMD) There is a large variation in the level of deprivation between practices in South West Essex. The majority of practices in Brentwood have low IMD scores where as there is much larger variation in the IMD scores of practices within Basildon and Thurrock. Figure 2. GP practice level deprivation scores using the index of multiple deprivation (IMD)
21 21
22 4.3 Life Expectancy Figure 3 shows life expectancy at birth for both males and females in Basildon comparing that to England and East of England from 2004 to Life expectancy has increased in both males and females within the Basildon locality from Life expectancy in Basildon is greater in females than males. The life expectancy for Basildon males is greater than the England average but less than the East of England average. Life expectancy for Basildon females is less than the East of England and England average except from where life expectancy at birth is equal to the national average. Figure 3. Basildon life expectancy trends 4.4 Summary / Conclusions The resident population of Basildon is greater in the younger (0-4, 5-9 and 10-14) and middle years (45-49) with a greater proportion of females than males aged over 44 years. A large proportion of practices in Basildon have high IMD scores indicating a greater level of deprivation. However, it is important to point out that four of the five least deprived practices in SW Essex are within the Basildon district indicating the large differences in deprivation within Basildon. Life expectancy has increased in both males and females within the Basildon locality from with life expectancy being greater in females than males. 22
23 5. BURDEN OF DISEASE AND PREVENTING ILL HEALTH This section provides an overall summary for SW Essex. More detailed information will be shown for the individual disease areas in later sections. 5.1 Disease Prevalence As part of the Quality and Outcomes Framework within which GP Practices can operate, disease registers are kept for a variety of conditions. These registers assist the GP Practice in ensuring that all patients are supported in managing their condition and receive the treatment they require. The following prevalence estimates are from the QOF disease registers. These are measures of disease register size so any observed change or difference may be due to the completeness of the disease register. Table 1 shows the current prevalence and number of patients on the disease registers compared to England for selected conditions. Early identification of at risk patients and better management of chronic conditions will enhance and improve quality of life, increase life expectancy and reduce costs by preventing hospital admissions. In Basildon Borough Council average disease prevalence for all practices is greater in eight of the 18 QOF conditions compared to the national average. The greatest absolute difference in disease prevalence in Basildon Borough Council compared to the national average was hypothyroidism (4.2% prevalence in Basildon Borough Council compared to 3% nationally). It is important to note that disease prevalence being higher than the England average may in fact be appropriate. Disease prevalence is dependent on many things such as the structure of a population. Higher disease prevalence may indicate better recording. In subsequent sections we will investigate and compare the current prevalence of diseases on the local registers with modelled estimates of the expected prevalence. Prevalence models provide estimates of underlying prevalence derived from population statistics and scientific research on the risk factors for each disease. The models can be used to support case-finding by identifying those areas where detection rates are low and targeting enhanced diagnostic activity on them. 23
24 Table 1. Table showing disease prevalence against England for range of different disease NHS South West Essex Prevalence for QOF conditions ( ) Data Source: National - The Information Centre SW Essex - QMAS (March 2011) Disease register (QOF ) CHD Heart Failure Stroke Hypertension Diabetes COPD Epilepsy Hypothyroidism Cancer Palliative Care MH Asthma Dementia Depression CKD AF Obesity LD England SW Essex Brentwood Borough Council Basildon District Council Thurrock Unitary Authority Count 13,278 2,390 6,257 4,631 Prevelance 3.4% 3.1% 3.2% 3.3% 2.9% Count 3, ,628 1,150 Prevelance 0.7% 0.8% 0.8% 0.9% 0.7% Count 6,805 1,358 3,114 2,333 Prevelance 1.7% 1.6% 1.8% 1.7% 1.5% Count 61,706 11,167 27,809 22,730 Prevelance 13.5% 14.6% 14.8% 14.9% 14.1% Count 18,535 2,735 8,656 7,144 Prevelance 5.5% 5.5% 4.5% 5.8% 5.7% Count 7,097 1,016 3,494 2,587 Prevelance 1.6% 1.7% 1.3% 1.9% 1.6% Count 2, , Prevelance 0.8% 0.7% 0.8% 0.8% 0.7% Count 16,307 2,661 7,838 5,808 Prevelance 3.0% 3.8% 3.5% 4.2% 3.6% Count 5,919 1,365 2,635 1,919 Prevelance 1.6% 1.4% 1.8% 1.4% 1.2% Count Prevelance 0.2% 0.1% 0.1% 0.1% 0.1% Count 2, ,447 1,000 Prevelance 0.8% 0.7% 0.6% 0.8% 0.6% Count 25,824 3,953 12,650 9,221 Prevelance 5.9% 6.1% 5.2% 6.8% 5.7% Count 1, Prevelance 0.5% 0.4% 0.6% 0.4% 0.4% Count 28,674 4,666 13,351 10,657 Prevelance 11.2% 8.7% 7.7% 9.2% 8.7% Count 14,085 2,305 6,740 5,040 Prevelance 4.3% 4.3% 3.8% 4.6% 4.1% Count 5,767 1,232 2,658 1,877 Prevelance 1.4% 1.4% 1.6% 1.4% 1.2% Count 38,870 4,660 17,450 16,760 Prevelance 10.5% 11.5% 7.5% 11.6% 13.2% Count 1, Prevelance 0.4% 0.4% 0.4% 0.4% 0.4% 24
25 Using modelled estimates figures 4-7 show a comparison of the observed QOF register sizes and expected register sizes for CHD, Hypertension, COPD and Stroke by practice for all practices in SW Essex. Value of 100 (0%) means observed= expected; above 100 (0%) means observed= higher than expected; below 100 (0%) means observed= lower than expected. Figure 4 shows observed versus expected CHD prevalence by practice within SW Essex. In terms of population CHD ascertainment, it is estimated that the majority of practices in SW Essex have less CHD patients that expected. Practices that fall below the 2SD and 3SD lower limit are from Basildon, Brentwood and Thurrock. There does not appear to be a trend in terms of which area has a greater proportion of practices below the 2SD and 3SD lower limit. One practice from the Basildon locality falls above the 3SD upper limit on the funnel indicating the practice has significantly more CHD patients than expected. Figure 4. Observed vs. Expected funnel plots for CHD for all practices in SW Essex 25
26 Figure 5 shows observed versus expected hypertension prevalence by practice within SW Essex. In terms of population hypertension ascertainment, it is estimated that all practices excluding one within SW Essex have less hypertension patients than expected with practices falling below the 3SD lower limit. One practice from the Basildon locality falls above the 3SD upper limit on the funnel indicating the practice has significantly more hypertensive patients than expected. Figure 5. Observed vs. Expected funnel plots for hypertension for all practices in SW Essex 26
27 Figure 6 shows observed versus expected COPD prevalence by practice within SW Essex. In terms of population COPD ascertainment, it is estimated that the majority of practices have less COPD patients than expected. Practices that fall below the 2SD and 3SD lower limit are from Basildon, Brentwood and Thurrock. One practice from the Basildon locality falls above the 3SD upper limit on the funnel and two practices fall above the 2SD upper limit indicating these practice have significantly more COPD patients than expected. Figure 6. Observed vs. Expected funnel plots for COPD for all practices in SW Essex 27
28 Figure 7 shows observed versus expected stroke / TIA prevalence by practice within SW Essex. In terms of population stroke / TIA ascertainment, it is estimated that the majority of practices have the expected number of stroke / TIA patients within SW Essex. A number of practices fall outside the 2SD and 3SD limits with the majority being from Basildon and Thurrock falling below the 2SD and 3SD lower limits. A practice from Basildon falls above the 3SD upper limit and two practices fall above the 2SD upper limit (Brentwood and Thurrock) indicating these practices have significantly more stroke / TIA patients that expected. Figure 7. Observed vs. Expected funnel plots for Stroke/TIA for all practices in SW Essex 28
29 Table 2 shows the projected prevalence of CHD, COPD, Hypertension and Stroke until 2020 by district. The prevalence of all conditions looks set to rise in all areas over the next eight years. This will not only have a large impact on the health of the population but it will also have massive implications on the NHS. This is most likely due to an increase in elderly population. Table 2. Estimated disease prevalence for CHD, COPD, Hypertension and Stroke for 2010, 2015 and Basildon Brentwood Thurrock Prevalence of CHD (persons 16+) 5.11% 5.40% 5.70% 5.29% 5.40% 5.60% 4.62% 5.80% 6.10% Prevalence of COPD (persons 16+) 2.89% 3.20% 3.30% 2.53% 2.60% 2.70% 2.76% 3.40% 3.60% Prevalence of Hypertension (persons 16+) % 32.20% 30.33% 30.70% 31.30% 28.43% 30.30% 31.20% Prevalence of stroke (persons 16+) 2.3% 2.4% 2.5% 2.5% 2.6% 2.7% 2.0% 2.4% 2.6% Figure 8 shows the DSR of emergency admission attendances per practice with national, regional and cluster averages. Figure y shows the DSR of A&E admissions per practice with national, regional and cluster averages. The DSR of emergency admission attendances and of A&E admissions is higher in Thurrock and Basildon compared to Brentwood. Over 50% of practices within SW Essex have a significantly greater rate of emergency admission attendances and of A&E admissions that the SW Essex average. There appears to be a link between practices in the rate of emergency admission attendances compared to A&E admissions. Practices that have high rates of emergency admission attendances normally also have high rates of A&E admissions. This is probably due to the areas of deprivation that the practices fall into. Figure 8. Directly standardised rate of Emergency Admission attendances per practice, with national, regional and cluster averages 29


30 Standardised Admission Rate Figure 9. Directly standardised rate of A&E Admissions with national, regional and cluster averages 5.2 Emergency admissions In 2010/11 SW Essex had 28,654 emergency admissions in total. Standardised rate of 67.7 per Compared to the East of England and national (74.5 and 89.0 respectively) figures this is significantly low. Figure 10. Standardised emergency admission rates, All PCTs, 2010/11 Using modelling methods we can model how many admissions would be expected for each GP practice in the country based on the size of a GP practice, the proportion of this total who are aged over 85, disability free life expectancy at age 70, indirectly standardised mortality rate, and CHD and diabetes QOF register sizes. 80% of the variation in number of emergency admissions nationally can be explained by these variables. (Methodology is explained in appendices A) We can then compare our observed number of emergency admissions in 2010/11 to this expected figure for all GP practices in South West Essex [figure 10]. 30
31 Figure 11 Figure 12 31

32 The value of 1 indicates that there is no difference between what would is observed and what would be expected. The figure shows that given characteristics of the South West Essex Population most GP practices have significantly fewer emergency admissions in 2010/11 than would be expected. When looking at emergency admissions as a total it may appear that there is not much room to make savings here, however there may still be admissions for specific diseases which are high compared to other areas, or higher than expected that could yield great savings. 5.3 Mortality Figure 13 shows the absolute difference in mortality between PCTs and the East of England average from 2001 to Mortality rates have been significantly worse in SW Essex than the EoE average in every two year period from 2001 to 2008 for males, females and for both males and females combined. This is probably because we have larger areas of deprivation compared with the EoE. Figure 13 Absolute Difference in Under-75 All-Cause Mortality between PCTs & East of England (EoE) 5.4 Summary / Conclusions Mortality rates have been significantly worse in SW Essex than the EoE average in every two year period from 2001 to 2008 for males, females and for both males and females combined. In Basildon Borough Council average disease prevalence for all practices is higher in eight of the 18 QOF conditions compared to the national average. Comparisons of observed versus expected prevalence suggests that the majority of practices within Basildon, Brentwood and Thurrock have less CHD, COPD and hypertensive patients than expected. This warrants further investigation as if there are a large number of people that have 32
33 undiagnosed conditions, it could have a detrimental effect on their health and costs to the NHS in the future. With the growth of an ageing population and the drive to ensure earlier identification of some chronic conditions, we can expect a rise in disease prevalence and consequential increase in demand on health and social care services. 33
34 6. OVERALL ANALYSIS OF SPEND 6.1 Programme Budgeting and SPOT tool analysis The programme budgeting project was introduced by the Department of Health in The aim being to develop a source of information to give a greater understanding of where money is being invested in the NHS and what is obtained for the investment. It maps Primary Care Trust expenditure to 23 programmes of care based on medical conditions such as mental health, cardio vascular disease and cancer. Programme Budgeting along with the Association of Public Health Observatories (APHO) SPOT tool is a powerful mechanism for assessing expenditure relative to clinical value by comparing a specific Primary Care Trust to other similar Primary Care Trusts. It is used to evaluate the effectiveness of the current pattern of resource deployment and to support and improve the process for identifying the most effective way of commissioning services for the future. It can also be used to identify future QIPP priorities. Each Primary Care Trust s expenditure per head of unified weighted population (UWP) by programme can be compared with the average for its ONS cluster. Regrettably this data is only available at PCT rather than CCG level. NHS South West Essex falls into the category of new and growing towns and is grouped with other similar Primary Care Trusts to provide a realistic benchmark. 6.2 Overall Programme Budgeting Spend (per 100,000 population) Compared to other PCTs. Overall, South West Essex PCT ranks 76 th out of 152 PCTs for spend per 100,000 populations on programmes in primary and secondary care. Figure 14 shows estimated Primary, Secondary and urgent/emergency care expenditure for a range of programme budgetary disease categories against national rank NHS South West Essex has the highest expenditure per 100,000 population of any PCT in England on lung cancer, even though over all cancer spend rate is ranked at 103 out of 152 PCTs nationally. It is worth noting spend on Lung Cancer is on Secondary Care services and that Programme budgeting estimations suggest no spend on early detection or prevention of lung cancer. It also has the highest expenditure per 100,000 for coronary heart disease, which contributes to the PCTs overall rank of 3 rd out of all PCTs for problems of circulation. Other areas of high spend compared to other PCTs are: Burns in Problems of the skin (ranked 2 nd out of 152 PCTs) Disorders of the blood (ranked 4 th out of 152 PCTs) Endocrine (ranked 11 th out of 152 PCTs) Problems of the respiratory system (other) (ranked 15 th out of 152 PCTs) 34
35 Figure 14 Expenditure per 100,000 population ( million) Total Programme Budgeting category expenditure PCT Rank (1 = Highest Expenditure) 01 Infectious diseases a HIV and AIDS x Infectious diseases (Other) Cancers and tumours a Head or neck cancers b Upper gastro intestinal cancers c Lower gastro intestinal cancers d Lung cancers e Skin cancers f Breast cancers g Gynaecological cancers h Urological cancers i Haematological cancers x Cancers and tumours (Other) Disorders of blood Endocrine, nutritional and metabolic problems a Diabetes b Endocrine x Endocrine, nutritional and metabolic problems (O Mental health disorders a Substance misuse b Organic mental disorders c Psychotic disorders d Child and adolescent mental health disorders x Mental health disorders (Other) Problems of learning disability Neurological a Chronic pain x Neurological (Other) Problems of vision Problems of hearing Problems of circulation a Coronary heart disease b Cerebrovascular disease c Problems of rhythm x Problems of circulation (Other) Problems of the respiratory system a Obstructive airways disease b Asthma x Problems of the respiratory system (Other)
36 Expenditure per 100,000 population ( million) Total Programme Budgeting category expenditure 6.3 Spend in NHS South West Essex compared to the ONS cluster group. PCT Rank (1 = Highest Expenditure) 12 Dental problems Problems of the gastro intestinal system a Upper gastro intestinal system problems b Lower gastro intestinal system problems c Hepatobiliary problems x Problems of the gastro intestinal system (Other) Problems of the skin a Burns x Problems of the skin (Other) Problems of the musculoskeletal system Problems due to trauma and injuries Problems of the genito urinary system a Genital tract problems b Renal problems c Sexually transmitted infections x Problems of genito urinary system (Other) Maternity and reproductive health Conditions of neonates Adverse effects and poisoning a Unintended consequences of treatment b Poisoning c Violence x Adverse effects and poisoning (Other) Healthy individuals Social care needs Other a GMS/PMS x Miscellaneous Other The overall spend per weighted head of population in NHS South West Essex is lower than its cluster but higher than the SHA average. Expenditure in the other category is less than the average for the cluster and for the SHA area for primary GMS/PMS spend and higher than the cluster and SHA in the miscellaneous category. Figure 15 shows NHS South West Essex spend per weighted head of population for in comparison to its ONS cluster. The highest spending programme is Circulation, where previous years showed Mental Health as the largest expenditure. 36

37 Figure 15 NHS South West Essex highest spend areas per head of population excluding programme 23 (Other) are: 180 per head per year on Circulation 174 on Mental Health 96 on Cancers & Tumours 96 on Musculoskeletal 95 on Respiratory Disease 37
38 However, in South West Essex most of our programmes appear to be spending less than the average for our cluster. It is difficult, however, to conclude that no shift in spend needs to be made when we have such a large Miscellaneous category. This category may be large for a variety of reasons: 1) Coding differences between PCTs 2) Coding differences between providers 3) How the PCT is structured Investigating possible reasons why this category is so large recurrently for SWE will help re align any relevant spends to appropriate programme budgeting categories and give a more accurate picture for spend and outcome analysis in the future. There are three areas where the PCT spend per head is higher than the Cluster average and may warrant investigation: 180 per head per year on Circulation 95 per head on Respiratory Disease 92 per head on Maternity If the PCT were to reduce its spend on each of these programmes so that it were in line with the ONS Cluster Average a potential saving of 18,194,074 would be delivered. Some of this potential saving may, however, be offset by programmes where our outcomes are particularly bad and spend is low. For South West Essex the programmes where some of the outcomes are poor and spend is lower than the cluster average are; Cancers and Tumours, Genito Urinary and Respiratory Diseases. If spend were to be brought in line with the cluster average in an effort to improve the outcomes identified in table 3 then an additional spend of up to 8,885,478 may be justified. This gives a net potential saving of 9,308,596. Table 3 SW Essex registered Population* Spend per head SW Essex Spend per head cluster Difference per head (SW Essex - ONS Potential saving Programme Problems with the Circulatory System ,847,304 Respiratory Diseases ,384,944 Maternity ,961,826 Cancers and Tumours ,118 Genito Urinary ,462,360 Total Net Saving 9,308,596 *SW Essex registered Population as at 1 st October Spend versus Outcome in South West Essex and our ONS Cluster 38
39 Figure 16 is a spine chart that shows variation in spend and outcomes compared to similar PCTs, the Strategic Health Authority (SHA) and England. In each category, spend in SW Essex compared to our ONS cluster is given first, and outcome(s) against our cluster below. Figure 16 Overall PCT 09/10 PCT 10/ /11 values ONS Cluster SHA England Notes Overall spend per weighted head of population 1,704 1,735 1,760 1,705 1,751 1 All age all cause mortality Deprivation - Index of Multiple Deprivation Slope Index of Inequality in Life Expectancy (males) Slope Index of Inequality in Life Expectancy (females) Mental Health Mental Health spend per weighted head of population Mortality from suicide and undetermined injury, DSR* Circulation Circulation spend per weighted head of population Mortality from circulatory diseases, DSR*, under 75 years Patients with CHD whose last blood pressure < 150/90 91% 90% 91% 90% 90% 4 Cancers and Tumours Cancer spend per weighted head of population Mortality from all cancers, DSR*, under 75 years % cancer patients receiving treatment within 2 months 83% 83% 87% 86% 86% 3 Musculoskeletal system Musculoskeletal spend per weighted head of population PROMs* EQ-5D Hips Gastrointestinal Disease Gastrointestinal spend per weighted head of population Mortality from gastrointestinal disease Genitourinary system Genitourinary spend per weighted head of population Genitourinary deaths within 30 days of admissions, ISR* % CRF* with hypertension on ACE*/ARB* therapy 89% 89% 91% 90% 90% 4 Respiratory Disease Respiratory spend per weighted head of population Mortality from Bronchitis, Emphysema & COPD*, DSR*, u Neurological Disease Neurological spend per weighted head of population Mortality from epilepsy, DSR*, under 75 years Maternity Maternity spend per weighted head of population % Low birth weights 6.8% 6.6% 7.3% 6.9% 7.3% 2 Other South West Essex PCT New and Growing Towns East of England SHA Lower spend Worse outcome z score ** Higher spend Better outcome Primary Care GMS*/PMS* spend per weighted head of population Miscellaneous spend per weighted head of population Lower spend England mean Higher spend Worse outcome Better outcome ** z scores A z score essentially measures the distance of a value from the mean (average) in units of standard deviations. A positive z score indicates that the value is above the mean whereas a negative z score indicates that the value is below the mean. A z score below -2 or above +2 may indicate the need to investigate further. PCT value SHA range ONS Cluster range *ACE - Angiotensin converting enzyme inhibitor *ARB - Angiotensin receptor blocker ONS Cluster 1. Department of Health 2010/11 *COPD - Chronic Obstructive Pulmonary Disease Clusters are used to group PCTs together 2. NCHOD data *CPA - Care Programme Approach according to key characteristics common 3. Healthcare Commission 2009/10 *CRF - Chronic Renal Failure to the population in that grouping. The Office of National Statistics derive these 4. Quality and Outcomes Framework 2010/11 * DSR - Directly Standardised Rate per 100,000 groupings, known as clusters, from 5. SHA and Cluster values are PCT averages *GMS - General Medical Services contract census data. 6. Information Centre 2009/10 *ISR - Indirectly Standardised Rate per 100, Population weighted average of LLSOA IMD 2010 *PMS - Patient Medical Services contract Notes 8. YHPHO data *PROMs - Patient Reported Outcome Measures 9. Significant changes were introduced to the Programme Budgeting data collection methodology in 2010/11. Expenditure in 2010/11 should not be directly compared to expenditure in 2009/10. 39

40 Figure 17 presents some of the information from previous spine chart in two dimensions, showing programme budgeting categories for NHS South West Essex (NHS SWE) by level of spend in comparison with outcomes, allowing easy identification of areas that warrant further attention. The largest spending programmes nationally are represented by larger dots on the graph. Programmes outside the inner (dotted) box (z score <-1.0 or > 1.0) are one standard deviation or more from the cluster mean and should be thought of as potential outliers. Programmes that lie outside the second solid box (z score <-2.0 or > 2.0) are two standard deviations from the cluster mean and should be thought of as significant outliers. Figure 17 NHS South West Essex highest spend areas relative to other PCTs in England are circulation and blood disorders. These programmes lie outside the solid pink =/ -2z box making them outliers compared to other PCTs in England, and investment does not appear to have resulted in significantly better outcomes. Other notably high spend programmes, compared to other PCTs, 40
41 with better outcomes include maternity, healthy individuals although because the z score on spend is greater than the z score on outcome, it could be argued for both of these programmes that better value should be being achieved. NHS South West Essex has only average outcomes for respiratory, genitourinary system and endocrine programmes despite high spend and so may warrant further investigation. Our most cost effective programme is trauma as it has the largest positive z score for outcome and largest negative z score for cost. However overall spend is relatively small compared to some other programmes. Infectious diseases and musculoskeletal programmes also show very positive outcomes for below average spend. The mental health programme which is our second largest area of spend per head of population is extremely encouraging in the sense that it delivers positive outcomes above 1 standard deviation from the mean and yet costs less than the mean per head of population compared to other PCTs. 6.5 Procedures of limited clinical value Through the drive to implement service modernisation that is efficient and high quality as funding growth slows, Procedures of Limited Clinical Value require review to ensure where possible, money can be redirected to delivery of better value treatments. Procedures of Limited Clinical Value are treatments considered to be clinically ineffective or not cost-effective. Figure 18 below shows some procedures of limited clinical value of Basildon District Council by activity and cost across over the last three years. 41


42 Figure 18 Overall, the spend on Procedures of Limited Clinical Value has increased from 4,675,693 in to 5,508,115 in , despite the activity of actual procedures decreasing from 2,117 to 2,004 procedures respectively. The greatest spend and activity in was for Bilateral Hips. The least spend was for Orthodontics at 1,374. Interventions relating to Minor skin lesions, myringotomy, back pain: injections and fusion have had a reduction in activity yet this is not reflected in the cost savings and may warrant further investigation. 6.6 Conclusions Overall Analysis of Spend NHS South West Essex highest spend areas per head of population excluding Programme 23 (Other) are: 180 per head per year on Circulation 174 on Mental Health 96 on Cancers & Tumours 96 on Musculoskeletal 95 on Respiratory Disease 42
43 NHS South West Essex has the highest expenditure per 100,000 population of any PCT in England on lung cancer, even though over all cancer spend rate is ranked at 103 out of 152 PCTs nationally. It is also has the highest expenditure per 100,000 for coronary heart disease, which contributes to the PCTs overall rank of 3 rd out of all PCTs for problems of circulation. This expenditure is likely to be a product of a large prevalence of smoking in our deprived populations, and working through Health and Wellbeing Boards to ensure appropriate Tobacco Control Programmes are commissioned together with commissioning programmes that encourage the early detection of lung cancer and circulatory diseases are likely to impact positively on this issue. Spend on disorders of the blood ranks 4 th out of 152 PCTs with the majority of costs in secondary care. This warrants further investigation. Other areas of high spend compared to other PCTs are: Endocrine (ranked 11 th out of 152 PCTs) Head and neck cancers (ranked 28 th out of 152 PCTs) Diabetes (ranked 29 th out of 152 PCTs) All of these areas warrant further investigation to assess the possibility of new QIPP initiatives to reduce spend. Compared to our ONS cluster of PCTs, spend in SW Essex on the majority of programmes is lower. It is difficult, however, to conclude that no shift in spend needs to be made as we have a large spend in the Miscellaneous category which may reflect differences in coding between PCTs. Indeed if spending across all programme budgeting categories was brought into line with ONS PCT cluster averages, a net saving of 5,923,652 per annum would be delivered. Spend on Circulatory Disorders and Blood Disorders are over two standard deviations greater than the mean for our ONS cluster despite delivering only average outcomes. Further investigation is required as these are also high spending areas in absolute cash terms. The most cost effective programme area is trauma which provides significantly better than average outcomes for significantly less than average spend. Mental Health, our second largest absolute spending area also performs well, with significantly better outcomes for less spend than ONS cluster means. 43

44 7. COST AND QUALITY ANALYSIS BY DISEASE CONDITION 7.1 Cancers and Tumours Spend on Cancers and Tumours Figure 19 shows Programme Budgeting spend on cancers and tumours by PCT, with SWE and its ONS cluster PCTs highlighted. Our spend on cancer services is in the second quintile nationally and in line with (slightly lower than average) ONS cluster average for NHS South West Essex. SW Essex expenditure is 96 per head vs the ONS cluster average of 97 per head. Figure 19 According to programme budgeting data South West Essex has the highest spend per head of all PCTs in England. The difference between spend per head for South West Essex and all other PCTs is illustrated in figure 19. Given the large disparity further investigation is needed in order to determine whether this spend is real or a coding issue. Given the large smoking population in Thurrock it is likely that at least some of this disparity is real spend. 44
45 Table 4: Spend per head of population on Lung Cancer 2010/11 Spend per head 2010/11 South West Essex England 3.50 ONS Comparator Group 4.72 Source: programme budgeting Figure Spend per Head on Lung Cancer 2010/11 Source: Programme Budgeting Key indicator Outcomes for Cancers and Tumours Figure 21 shows incidence, mortality rates of Cancer by type and key secondary care indicators. Overall and under 75 incidence of Cancer is significantly better than the regional and England average. However, both incidence of lung cancers and mortality from cancers is not significantly different from the England average but in the majority of cases is greater than regional average. Secondary care indicators for cancer show that cancer bed days in SWE are significantly worse than the England average but are on par with the region. Cancer emergency admissions are not significantly different from the England average and are in line with the East of England region. The high number of Cancer bed days could be explained by the fact that in South West Essex case finding is good [figure Z] but we appear to have a large gap between the number of people who are on a palliative care register compared to what we would expect to find given our populations characteristics [Figure A]. Further investigation would be required to ascertain that this is the case. 45
46 Figure 21 Key: Significantly better than England average Not significantly different from England average Significantly worse than England average No significance can be calculated England Key: Indicator 1 INCIDENCE OF CANCER Local Local Number Value Eng Avg Eng Worst England Range 2 All cancers All cancers u75 years Breast cancer Breast cancer u75 years Colorectal cancer Colorectal cancer u75 years Cervical cancer Cervical cancer u75 years Lung cancer Lung cancer u75 years Prostate cancer Prostate cancer u75 years MORTALITY FROM CANCER (DSR) 15 All cancers All cancers u75 years Breast cancer Breast cancer u75 years Colorectal cancer Colorectal cancer u75 years Cervical cancer Cervical cancer u75 years Lung cancer Lung cancer u75 years Prostate cancer Prostate cancer u75 years SECONDARY CARE 28 Cancer bed days per 1,000 popuation Cancer inpatient expenditure per 1000 population Cancer Emergency admissions per 100 on disease register ( ) Eng Best 46
47 Figure 22 Figure 23 47
48 Early diagnosis of cancer can have an impact on the prognosis, quality of life and mortality for a patient. Figure G shows the referral to assessment 2-week wait target. Figure 24 Figure 24 and 25 indicate an overall decline in the percentage of patients seen within two weeks of their referral and waits below the 93% target in May 2011 and from August 2011 to January Figure 25 48
49 Coverage (%) 7.2 Cancer Screening We currently offer screening for three types of cancer, Cervical, Breast and Bowel. It is known that early detection of most Cancers greatly improves prognosis. This section looks at screening coverage, incidence, and mortality for these cancers Cervical Cancer Screening Nationally screening for cervical cancer coverage has been showing a downward trend for some years. This trend was reversed in 2010 (Jade Goodey effect) but may or may not continue in this direction in the future. These trends are also reflected in local figures. Local coverage is generally lower than national levels. [Figure 26] Figure Coverage of cervical Screening Programme (25-64 yrs) South West Essex PCT East of England SHA England 49

50 Nationally the coverage has fallen most in the younger age groups and is currently only at 62.5 % in year olds [figure 27] Figure 27 A study published in 2011 by the National Cancer Intelligence Network in collaboration with the NHS Cervical Screening Programme, explores the link between an increase in cervical cancer incidence in younger women and a steady fall in the screening coverage (the percentage of eligible women regularly screened) in younger age groups. Findings were: Jason Poole, Head of Cancer Analysis at Trent Cancer Registry, summarises the key findings: There has been an increase in the incidence of cervical cancer in women aged under 35 since the late 1990s. Over this time there has also been a steady fall in the coverage in women of this age group. Increasing coverage in these age groups will be important to stop this trend. While screening older women leads to a substantial reduction in cervical cancer, screening in women aged has been shown to have little or no impact on rates of invasive cervical cancer at ages Indeed, the upward trend in incidence rates began from 2000 following several years of decline in coverage. Jason concludes: It is clear that as screening coverage decreases in younger women, incidence of cervical cancer rises. It is important that the recent upward trend in screening coverage continues, so that the number of women who develop cervical cancer can be reduced. [NHS Cervical Screening Programme Annual Review 2011] 50
51 Percentage (%) Incidence (per 100,000) Despite coverage reducing, incidence[figure 28] and premature mortality [figure 29] from Cervical Cancer are also both reducing, due to the success in early detection rates via the National Cervical Screening Programme and improvements in treatment options. Survival rates [figure 30] are also improving. Figure 28 Incidence of Cervical Cancer (25-64 yrs) South West Essex PCT East of England SHA England Figure 29 Percentage of Patients surviving for 5 years after diagnosis of Breast Cancer East of England SHA England 51
52 DSR (per 100,000) Figure Mortality (DSR - all ages) from Cervical Cancer South West Essex PCT East of England SHA England The spine chart [figure30] shows that mortality from cervical cancer is in line with the average for England. Screening coverage only explains a small amount of the variation in mortality rates across PCTs nationally but there is a general pattern that pcts with slightly higher coverage do have lower mortality rates [figure 31]. As the programme has been running for such a long time and has good coverage across the board one would not necessarily expect this relationship to be very strong, the variation in cancer mortality would be better explained by the ratio of early to advanced cancers detected through the programme and other factors such as deprivation, attitudes towards health and lifestyle. Figure 31 Coverage of Cervical Screening (2010/11) vs Mortality from Cervical Cancer (<75, 2008/10 pooled) R² =
53 Incidence (per 100,000 women Uptake (%) Breast Cancer Screening The uptake of Breast Cancer screening in South Essex is below the national and East of England Levels but is showing a slight upward trend. [Figure 32] Figure 32 Uptake of breast screening in women aged England East of England South Essex The incidence of breast cancer in South West Essex is in line with that of the East of England and the National. Over recent years the incidence in South West Essex may have reduced slightly but this reduction appears to be as a result of a large reduction in the Brentwood area where rates have since risen again suggesting that this may be the result of random variation. [Figures 33 and 34] Figure 33 Incidence (DSR) of Breast Cancer ENGLAND East of England SHA South West Essex PCT 53
54 DSR (per 100,000) Incidence (per 100,000 women Figure 34 Incidence (DSR) of Breast Cancer Thurrock UA Basildon CD Brentwood CD Rates of mortality from Breast Cancer have been steadily falling since 1993, both nationally and locally [Figure 35], this is a result of a long standing breast cancer screening programme with consistently high coverage, and improvements in treatment. Figure 35 Mortality (DSR - all ages) from Breast Cancer ENGLAND EAST OF ENGLAND South West Essex PCT The spine chart [figure 36] shows that mortality from breast cancer is in line with the average for England. 54
55 DSR Screening coverage only explains a small amount of the variation in mortality rates across PCTs nationally but there is a general pattern that pcts with slightly higher coverage do have lower mortality rates [figure 36]. As the programme has been running for such a long time and has good coverage across the board one would not necessarily expect this relationship to be very strong, the variation in cancer mortality would be better explained by the ratio of early to advanced cancers detected through the programme and other factors such as deprivation, attitudes towards health and lifestyle. Figure Coverage of Breast Screening (2010/11) vs Mortality from Breast Cancer (<75, 2008/10 pooled) R² = Coverage (%) Colerectal (Bowel) Cancer Screening The bowel cancer screening programme was rolled out in South West Essex in September 2008 and South East Essex in March Coverage for 2011/12 for South Essex was 51%. This is the lowest coverage in the East of England (Norfolk was highest at 62%). The programme has not been running for long enough to evaluate the impact it has had on incidence, and mortality. The spine chart [Figure 21] shows that mortality from colorectal cancer is in line with the average for England. 7.3 Summary / Conclusions Spend on cancers and tumours in SWE is slightly below average for both England and ONS comparator PCTs. According to programme budgeting data South West Essex has the highest spend per head of all PCTs in England. Given the large disparity further investigation is needed in order to determine whether this spend is real or a coding issue. Given the large smoking population in Thurrock it is likely that at least some of this disparity is real spend. 55
56 Although the incidence of cancer is comparatively low and mortality levels comparable to England, low numbers of people on palliative care registers may be resulting in a significantly higher number of cancer bed days being used (55.5 per 1000 pop vs 54.2 per 1000 pop). A decline in the number of patients being seen within two weeks could be detrimental to patients prognosis and to the areas future survival and mortality rates. The importance of maintaining a high level of cervical cancer screening and better targeting in year old women is clear. The Bowel Screening Programme is still in its early stages but to have a real impact on patients prognosis, and in incidence, and mortality rates, coverage needs improving. 56

57 8.1 Endocrine, Nutritional and Metabolic Problems This programme covers diseases such as diabetes, endocrine gland disorders, malnutrition and other nutritional disorders. The focus of our analysis will be on diabetes as a key area of concern. This is because 50% of the programmes spend is on diabetes. Figure 37 shows the spend on Endocrine, Nutritional and Metabolic Problems within SW Essex. The spend on these services (6.3m /100k) is above the ONS group average and is in the top quintile for spend nationally. Figure 37. Programme budgeting spend, Endocrine, Nutritional and Metabolic Problems - compared against all PCTs and ONS cluster Figure 37 shows the prevalence of Endocrine, Nutritional and Metabolic problems for different indicators within SW Essex. Mortality from diabetes in all ages within South West Essex and in adults under 75 years is in line with the national average. SW Essex has achievement significantly below the national average in five of the 12 QOF diabetes indicators. Particular areas of concern include ACE inhibitor therapy, neuropathy testing, cholesterol levels, renal function testing and micro-albuminuria testing which is an 57
 and blood")
58 important test to detect the onset of kidney disease. SW Essex has achievement significantly above the national average in four of the QOF indicators including blood pressure, retinal screening, controlled blood glucose levels (7 or less) and blood glucose levels (8 or less). There is no significant difference with the England average in the remaining three QOF diabetes indicators. SW Essex has achievement significantly below the national average in diabetes emergency admissions per 100 on the disease register. SW Essex is performing significantly better in the number of bariatric procedures compared to the national average. SW Essex is not significantly different in the remaining Secondary Care indicators. Figure 38. Spine chart showing the prevalence of Endocrine, Nutritional and Metabolic problems for different risk factors 58
 is not significantly different to the national average (10.7). Figure 39.")
59 Figure 39 shows lower limb amputations in diabetic patients for all PCTs in England. The rate of lower limb amputations in diabetic patients within SW Essex (7.7) is not significantly different to the national average (10.7). Figure 39. Lower Limb Amputations by PCT Figure 40 shows the percentage of people with diabetes receiving nine key care processes by PCT. SW Essex falls within the bottom of quintile 3 indicating the PCT is ranked mid-range out of all PCTs nationally. More than 50% of known diabetic patients are still not receiving all nine of the key care processes for diabetes care as recommended by NICE; the nine crucial tests at an annual review of diabetes management include measurements of weight, blood pressure, smoking status, HbA1c, urinary albumin, serum creatinine, cholesterol, and tests to assess whether the eyes and feet have been damaged by diabetes. These tests are essential to ensure that diabetes is controlled. If left unchecked, diabetes can lead to blindness, kidney failure and increase the risk of developing cardiovascular problems such as heart attacks and stroke. The cost savings linked to controlling diabetes are huge. 59


60 Figure 40. Percentage of people with diabetes receiving 9 key care processes by PCT Figure 41 shows observed versus expected diabetic prevalence by PCTs and for Basildon, Brentwood and Thurrock. Figure x2 shows observed versus expected diabetic prevalence by all practices in SW Essex. In terms of population diabetes ascertainment, it is estimated that the majority of PCTs in England and practices in SW Essex have less diabetes patients than expected. SW Essex and Brentwood have significantly less diabetes patients than expected. Thurrock and Basildon have significantly more diabetes patients than expected. It is important that every opportunity is taken in primary care to improve early identification of diabetics to ensure good care management and better patient outcomes. Figure 41. Observed vs. Expected prevalence for diabetes for all PCTs in England and LA 60
61 Figure 42. Observed vs. Expected prevalence for diabetes for all practices in SW Essex Source: QOF Register & ERPHO Modelled Estimates Figure 43 shows mortality from diabetes in people aged less than 75 years for all PCTs in England. There is no significant difference in mortality rates from diabetes in people aged less than 75 years between SW Essex and the national average. Figure 43. DSR from diabetes <75 funnel plot 61
 than the England and East of England average. Figure 44.")
 has significantly lower achievement compared to the national average (88.5%). It is important that diabetics are tested for micro-albuminuria to detect the onset of kidney disease.")
62 Figure 44 shows the rate of emergency hospital admissions for diabetic ketoacidosis and coma for all PCTs in England as well as the England and East of England average. Emergency hospital admissions for diabetic ketoacidosis and coma are lower in SW Essex (23.9) than the England and East of England average. Figure 44. Emergency Hospital Admissions for Diabetic Ketoacidosis and coma Figure 45 shows micro-albuminuria testing in patients with diabetes for all PCTs in England. SW Essex (85.4%) has significantly lower achievement compared to the national average (88.5%). It is important that diabetics are tested for micro-albuminuria to detect the onset of kidney disease. It is important to detect the onset of kidney disease for the health of the patient but also due to the associated costs for the NHS. Figure 45. Micro-albuminuria testing funnel plot 62
63 Figure 46 shows ACE inhibitor therapy in patients with diabetes for all PCTs in England. SW Essex (84.6%) has significantly lower achievement compared to the national average (88.8%) and is one of the worst performing PCTs nationally. ACE inhibitors can improve the function of a failing heart and the progression of kidney disease. It is important therefore that SW Essex improves performance in this area for health and cost benefits. Figure 46. ACE Inhibitor therapy for diabetes funnel plot Figure 47 shows cholesterol levels which are 5mmol or less in patients with diabetes in all PCTs in England. SW Essex is in line with the national average showing cholesterol is being managed well within diabetic patients. Figure 47. Cholesterol level <=5mmol funnel plot 63
64 Figure 48 shows controlled blood glucose levels in patients with diabetes in all PCTs in England. SW Essex is above the 3SD upper limit indicating that SW Essex has significantly more diabetes patients with a blood glucose level of 7 or less than the national average. Controlled blood glucose within diabetic patients is being managed very well within SW Essex compared to all PCTs in England. However, SW Essex is still only achieving 60% indicating further improvements need to take place. Figure 48. Control hyperglycaemia <=7mmol/L funnel plot Summary / Conclusion The spend on Endocrine, Nutritional and Metabolic problems within SW Essex is above the ONS group average and is in the top quintile for spend nationally. Despite this high spend SW Essex is performing at an average standard compared to all PCTs in England. SW Essex has achievement significantly below the national average in five of the 12 QOF diabetes indicators. Particular areas of concern include ACE inhibitor therapy and microalbuminuria testing where SW Essex is one of the worst performing PCTs nationally. SW Essex has achievement significantly above the national average in four of the QOF indicators with no significant difference with the England average in the remaining three indicators. More than 50% of diabetes patients in South West Essex are not receiving all 9 of the key care processes for Diabetes care as outlined by NICE; the complications associated with not keeping diabetes under control can have a huge financial impact. 64
65 Interestingly SW Essex (-17%) and Brentwood (-25%) have significantly less diabetes patients than expected. Thurrock (+9%) and Basildon (+3%) have significantly more diabetes patients than expected. Given that detection of cases is lower than expected,and there is poor performance on some of the disease management indicators. One might expect that secondary care use, and perhaps mortality, might be high, however, this is not the case: In terms of Secondary Care indicators SW Essex has achievement significantly below the national average in diabetes emergency admissions per 100 on the disease register. SW Essex is performing significantly better in the number of bariatric procedures compared to the national average although there is no significant difference in the remaining Secondary Care indicators. Rates of mortality (<75) from diabetes are statistically in line with the England average (slightly lower). One explanation of this disparity could be that patients are being diagnosed at a later stage of their diabetes and so being managed (well) in outpatients departments. Further investigation would need to be had in order to refute or accept this hypothesis. 65
. Figure 49.")
66 8.2 Mental Disorders The mental disorders programme covers all mental and behavioural disorders including neurosis and psychosis. It also covers areas such as drug and alcohol misuse, child psychiatry and mental health in older age (including Alzheimer s disease and dementia). Figure 49. Programme Budgeting Spend on Metal Disorders Figure 49 shows Programme Budgeting Spend per 100,000 population on Mental Disorders. South West Essex PCT is in the lowest ranking quintile of spend across PCTs in England for this programme and has a rate of spend less than the cluster average. Figure 50 shows some of the key wider determinants of health in Essex that can impact on the population of Basildon s mental health. The percentage of year olds who are not in education, training or employment (NEETS) are significantly worse than the England average. This cohort of the population are more likely to have poor health and die prematurely. They are also more likely to have lifestyle factors that impact on health (e.g. smoking and alcohol consumption) and suffer from mental health problems. Essex is significantly better than the England average for episodes of violent crime, working aged adults who are unemployed and alcohol attributable admissions which are associated with poor mental health. 66
67 Figure 50. Wider Determinants of Health Indicators for Mental Disorders Key: England Key: Significantly better than England average Not significantly different from England average Significantly w orse than England average No significance can be calculated Indicator Local Value Eng Eng Avg Worst England Range Eng Best 1 WIDER DETERMINANTS OF HEALTH 2 Percentage of year olds not in employment, education or training Episodes of violent crime per 1,000 population Working age adults who are unemployed, rate per 1,000 population Directly standardised rate for hospital admissions for alcohol attributable conditions, rate per 1000 p Number of people (aged 18-75) in drug treatment, rate per 1,000 population Figure 51 shows key indicators for Mental Disorders at PCT level. SW Essex performs well across the majority of indicators compared to other PCTs. Directly Standardised Mortality Rates from suicide in the under 75s and all suicides is significantly lower than the England average. Quality Outcomes Framework (QOF) attainment for mental health care plans is above both the regional and national average. However, QOF performance in patients with dementia and mental health admissions is significantly below the regional and national average. Figure 51. Key Indicators for Mental Disorders Key: Significantly better than England average Not significantly different from England average Significantly w orse than England average No significance can be calculated England Key: Indicator 1 MENTAL HEALTH MORTALITY Local Local Number Value Dementia is a man cause of disability in later life. The prevalence of Dementia increases with age and is estimated to be approximately at 20 per cent at 80 years of age. In a third of cases, Dementia is associated with other psychiatric symptoms such as depressive disorder, adjustment disorder, generalised anxiety disorder and alcohol related problems. South West Essex is ranked in the fourth worst quintile for Dementia diagnosis across all PCTs in England. Table 1 shows an estimated 38.6% of those with Dementia are diagnosed and a potential 2873 people in South West Essex are undiagnosed. However, Dementia diagnosis has Eng Avg Eng Worst England Range 2 Mortality from suicide Mortality from suicide u75 years QOF ATTAINMENT 5 Comprehensive care plan for patients on mental health register (MH6) Care review among patients with dementia (DM2) SECONDARY CARE 8 Mental Health Admissisons ( ) Emergency admissions for neuroses Emergency admissions for schizophrenia Eng Best 67

68 increased by 2.1% between 2010 and 2011 putting South West Essex in the third quintile of PCTS ranked by most improved diagnosis rates. Table 5. Estimated Dementia diagnosis Mapping the Dementia Gap 2011, Alzheimer s Society South West Essex No. of people on QOF Dementia register 2011 Estimated no. of people with Dementia (Diagnosed & Undiagnosed) Percentage of people with Dementia diagnosed % 2873 Number of people without a diagnosis Source: Dementia prevalence rates Dementia UK, 2007, 2008-based Subnational Population Projections, Office of National Statistics As previously highlighted, Dementia outcomes in respect of QOF performance for patients diagnosed whose care has been reviewed in the preceding 15 months (DEM2) are poor. The impact being that physical and mental health, social care needs and any secondary care communication or arrangements of both patients and their carers are potentially not being met. Figure 52 shows emergency admissions for Alzheimers and other related Dementia. The Alzheimers Society estimate Alzheimers is the most common cause of Dementia, affecting around 465,000 people in the UK. Essex is in the third ranking quintile for emergency hospital admissions relating to Alzheimers and Dementia and is above the regional and England average. This may reflect the poor QOF attainment for indicator DEM2 and is likely to be the cause of poor performance on the secondary care indicator Mental Health Admissions that is currently significantly worse than the England average. Figure 52 68
69 Employment and Support Allowance (Incapacity benefit) can be claimed by working age adults unable to work because of illness. Incapacity Benefit claimants make up the largest group of economically inactive people of working age in Britain and almost 40% are on Incapacity Benefit because of mental illness. Mental illness is the most common reason for claiming health-related benefits and costs the economy between 30 billion and 40 billion through lost production, sick pay, NHS treatment as well as the personal and financial costs that result from being out of work. Figure 53 shows claimants of incapacity benefits/severe disablement attributable to mental or behavioural disorders by local authority. Basildon District Council has below average incapacity benefit claims in comparison with other local authorities. Figure Improving Access to Psychological Therapies The Improving Access to Psychological Therapies (IAPT) programme is designed to support evidence-based psychological therapies, as approved by the National Institute for Health and Clinical Excellence (NICE), for people with depression and anxiety disorders. It was created to offer access to routine first-line services, treatment and where appropriate, medication to people experiencing depression and anxiety disorders from all communities within the local population that traditionally medication would have been the only available treatment. The programme was first targeted at people of working age but in 2010 was opened to adults of all ages. From 2011, its focus has broadened, following publication of Talking Therapies: a four-year plan of action, one of a suite of documents supporting No health without mental health, the cross- Government mental health strategy for people of all ages which will see a completed nationwide roll-out of psychological therapy services for adults, initiation of a stand-alone programme for children and young people and development of models of care for people with long-term physical conditions, medically unexplained symptoms and severe mental illness by April
70 Expected outcomes of the IAPT programme include: Increased health and well-being, with at least 50% of those completing treatment moving to recovery and most experiencing a meaningful improvement in their condition Patient choice and high levels of satisfaction from people using services and their carers Timely access, with people waiting no longer than locally agreed waiting times standards Improved employment, benefit, and social inclusion status including help for people to retain employment, return to work, improve their vocational situation, and participate in the activities of daily living. Table 5 shows the number of people that have been referred for psychological therapies between April and December 2011 for South West Essex, the East of England region and nationally. The number of referrals for South West Essex has increased each quarter in line with regional and national figures Table 5. The number of people who have been referred for psychological therapies Organisation Name April-June 2011 July-September 2011 October- December 2011 England 206, , ,192 East of England 19,508 20,105 20,628 South West Essex PCT 1,849 1,935 2,011 Figure 54 shows that South West Essex has a greater percentage of people that commence treatment following a referral than both the region and nationally. The waiting times from referral to first treatment/first therapeutic session could be impacting on this (Figure A). Figure 54. Percentage of people referred for psychological therapy that commence treatment 70
71 Figure 55. Referral to treatment waiting times A key indicator for IAPT is the number of people referred for psychological therapies with depression and anxiety disorders entering treatment and those that move from clinical caseness to recovery. For common mental health conditions treated in IAPT services, it is expected that a minimum of 15% of those in need would willingly enter treatment if available. This is the target set for full roll out in Figure B shows as at December 2011 South West Essex is treating 3% of those in need against the 3.75% quarterly target it will be expected to achieve by This is significantly higher than the achievement for both the region and nationally. Figure 56. People who have entered treatment as a proportion of those with anxiety or depression Data source: Improving Access to Psychological Therapies (IAPT) Key Performance Indicators (KPIs) Omnibus collection. Figure 57 shows the percentage of people that are moving to recovery after completing treatment through IAPT. South West Essex is achieving a higher recovery rate than both the East of England region and England. 71

72 Figure 57 Omnibus returns for South West Essex show that 43 people that have completed treatment through IAPT between April and December 2011 have moved off sick pay or ill-health related benefit. This equates to almost 5 people per month. This outcome results in previously mentioned savings to the economy, but more importantly a financial and personal gain to the individuals IAPT has helped Summary / Conclusions South West Essex PCT is in the lowest ranking quintile of spend across PCTs in England for Mental Disorders and has a rate of spend less than the cluster average The percentage of year olds who are not in education, training or employment (NEETS) are significantly worse than the England average. This cohort of the population are more likely to suffer from mental health problems. Essex is significantly better than the England average for episodes of violent crime, working aged adults who are unemployed and alcohol attributable admissions which are associated with poor mental health. Directly Standardised Mortality Rates from suicide in the under 75s and all suicides is significantly lower than the England average in South West Essex Quality Outcomes Framework (QOF) attainment for mental health care plans is above both the regional and national average. However, QOF performance in patients with dementia and mental health admissions is significantly below the regional and national average South West Essex is ranked in the fourth worst quintile for Dementia diagnosis across all PCTs in England with a potential 2873 undiagnosed. However, South West Essex is in the third quintile of PCTS ranked by most improved diagnosis rates. Essex is in the third ranking quintile for emergency hospital admissions relating to Alzheimers and Dementia and is above the regional and England average. This may reflect the poor QOF attainment for indicator DEM2 and is likely to be the cause of poor performance on the secondary care indicator Mental Health Admissions that is currently significantly worse than the England average. 72
73 Basildon District Council has below average incapacity benefit claims in comparison with other local authorities South West Essex PCT has a higher number of people being referred, entering, completing and recovering through the IAPT service than the East of England and England with almost 5 people per month moving off sick pay or ill health related benefits. 73

74 8.3 Learning Disabilities Figure 58 shows NHS South West Essex spend on learning disabilities. South West Essex has a higher spend than the average for its ONS cluster group. However, spend is average in comparison to all PCTs in England. Figure 58 74


75 8.4 Neurological Conditions Figure 59 shows Programme Budgeting spend on neurological problems by PCT, with SWE and its ONS cluster PCTs highlighted. Figure 59 Figure 60. Neurological health mortality and QOF attainment for epilepsy. As figures 59 and 60 show, SWE PCT s spend on neurological conditions is around average for its ONS cluster group, although in the second quintile nationally. Overall and under 75 mortality from epilepsy is greater than regional and national averages, but not statistically significantly so. There is also no significant difference in QOF attainment between SWE practices and regional and national averages for epilepsy. 75
76 Figure 61 shows the ratio of observed vs. expected prevalence of epilepsy for all PCTs in England. As figure 61 shows, it is estimated that almost 20% of our registered practice population suffering from epilepsy are unknown to local clinicians. Small numbers of epilepsy patients prevent us from making too many conclusions at a GP practice level, but figure A does identify some statistical outliers, that is not to ignore the fact that many of the GP practices for which we cannot draw statistical conclusions do have registers which appear to be much lower than expected. Figure 61 Figure 62 76

77 Figure 62 shows the percentage of patients with Epilepsy on drug treatment who are convulsion free for SWE and all other PCTs in England. As figure 8 shows, SWE s percentage of patients on drug treatment who are convulsion free is greater than both national means and 2SD funnel. This would suggest good clinical care of patients with Epilepsy once they are on the register. Figure Summary / Conclusions Spend on neurological conditions in SWE is about average for both England and ONS comparator PCTs and there is no significant difference in outcome from epilepsy mortality as a result, although both overall and under 75 mortality is on the poorer side of national averages. The data would suggest that this may be due to inadequate case finding of patients with epilepsy rather than poor clinical care once on QOF registers. 77

78 8.5 Problems of Vision Problems with vision cover areas such as low vision and blindness (related to age-related macular degeneration - AMD), cataracts, glaucoma, disorders of the retina and squint. It is important that the NHS aims to delay the average age of onset of loss of visual acuity in patients with hypertension, diabetes and glaucoma. Figure 63 shows programme budgeting spend on problems of vision. SW Essex is in the bottom middle half of quintile two. This level of allocated spend for vision problems was bottom for the ONS Cluster Group and places the PCT in the bottom third of PCTs nationally. Figure 63. Programme budgeting spend problems of vision - compare against all PCTs and ONS cluster neurological disorders, key indicators compared to England. Figure 64 shows the rate of cataract procedures within SW Essex compared with all PCTs in England. SW Essex is an outlier for cataract surgery in having a significantly higher rate than the national average. It is estimated that one third of people aged 65 years and over will have cataracts. It is important that the NHS aims to delay the average age of onset of loss of visual acuity in patients with hypertension, diabetes and glaucoma. With a growing ageing population and a continued lack of spend in this area the rate of cataract procedures could increase within SW Essex. 78
79 Figure 64. Funnel plot Rate of cataract procedure removal by 100K population Summary / Conclusions SW Essex has an average to low spend in the area of vision (Figure x) despite having a significantly high surgical intervention rate for cataracts (Figure y). A lower than expected diabetic detection rate as shown in figure x (Endocrine section) could give rise to increased spending with late diagnosis and complications from diabetes. 79
80 Expenditure ( million per 100,000 population) Milton Keynes PCT Medway Teaching PCT Bexley PCT Peterborough PCT Sw indon PCT Havering PCT West Essex PCT South West Essex Teaching PCT 8.6 Problems of Circulation This area of spend includes all of CVD, including hypertension and is closely linked to the programme covering endocrine, nutritional and metabolic diseases in relation to diabetes and blood lipids as risk factors. Figure 65 shows programme budgeting spend on problems of circulation. SW Essex is in the top three of quintile five indicating it is the third highest spending PCT nationally. Age is a key risk factor for problems with circulation. The number of hospital admissions rises sharply at 45 years. It is this cohort of the population that is set to significantly increase in the next 15 years, so unless steps are taken to prevent illness or its complications, it will put increased pressure on hospital beds and more costs on the NHS. Figure 65. Programme budgeting spend on problems of circulation All PCTs expenditure per 100,000 population Programme category Primary Care Trust Care Setting ONS Cluster level Population weighting Benchmark Note on interpretation: PCTs with large amounts of expenditure in category 23x for a given care setting may have less expenditure allocated to disease specific categories within that care setting. To aid comparison of expenditure on disease specific categories and within care settings the All commissioner chart with 23x sheet shows the same information as the chart below with additional information on the amount of expenditure in 23x for the chosen care setting on the negative y axis st quintile 3rd quintile 5th quintile PCTs within selected cluster level 2nd quintile 4th quintile South West Essex Teaching PCT National average National Rank Lowest to Highest 80
81 Figure 66 shows key indicators for problems of circulation. Problems of circulation mortality contains 10 indicators and of these 10 indicators SW Essex is performing significantly better than the national average in seven of them with no significant difference in the remaining three. SW Essex is performing significantly worse than the national average in four of the 10 QOF indicators. Particular areas of concern are CHD patients total cholesterol 5mmol or less and stroke/tia patients with total cholesterol 5mmol or less. There is no significant difference between SW Essex and the national average in the seven remaining QOF indicators. SW Essex is performing significantly better than the national average in five of the nine secondary care indicators. There is no significant difference in the remaining four indicators between SW Essex and the national average. Figure 66. Key Indicators for Problems of Circulation Key: England Key: Significantly better than England average Not significantly different from England average Significantly w orse than England average No significance can be calculated Indicator Local Number Local Value Eng Avg Eng Worst England Range Eng Best 1 PROBLEMS OF CIRCULATION MORTALITY (DSR) 2 All circulatory disease All circulatory disease u75 years Acute myocardial infarction Acute myocardial infarction u75 years Coronary heart disease Coronary heart disease u75 years Hypertensive disease Hypertensive disease u75 years Stroke Stroke u75 years QOF ATTAINMENT 13 CHD patient BP 150/90 or less (CHD6) CHD patient total cholesterol 5mmol or less (CHD8) CHD patients treated with beta blocker (CHD10) Patient with history of MI treated with ACE (CHD11) CHD patients with record of influenza immunisation (CHD12) Patients with stroke/tia history with BP 150/90 or less (STROKE6) Stroke/TIA patients with total cholesterol 5mmol or less (STROKE8) Stroke/TIA patients with record of influenza immunisation (STROKE10) Hypertensive patients with BP 150/90 or less (BP5) HF patients due to LVD being treated with ACE (HF3) SECONDARY CARE 24 % of patients who spend at least 90% of their time on a stroke unit No TIA cases with a higher risk of stroke who are then subsequently treated within 24hrs Angiogram - Elective Angiogram - emergency CABG - Elective All Ages PTCA - Elective All Ages AF Emergency admissions per 100 on disease register ( ) CHD Emergency admissions per 100 on disease register ( ) COPD Emergency admissions per 100 on disease register ( ) Data Sources: 1-11 Nchod, QOF (NEEPCT & NHS Information Centre), 25 DH, HES Data, NHS Comparators 81
82 Figure 67 shows mortality from Hypertensive disease in persons under 75 years for all PCTs in England and for Basildon, Brentwood and Thurrock LA populations. Mortality from Hypertensive disease in persons under 75 years in SWE, Basildon and Thurrock is in line with the national average. Brentwood is an outlier falling below the 2SD lower limit indicating it is having significantly less deaths from Hypertensive disease compared to the national average. Figure 67. Mortality from Hypertensive disease in the under 75s Figure 68 shows the percentage of Stroke patients who spend 90% of their time on a Stroke unit. SW Essex is in line with the national average indicating over 70% of patients are spending 90% of their time on a stroke unit. Figure 68. Percentage of Stroke patients who spend 90% of time on a Stroke unit 82
83 Figure 69 shows the rate of elective CABG admissions for all PCTs in England and figure y shows the rate of elective PTCA admissions for all PCTs in England. The rate of elective CABG admissions within SW Essex is in line with the national average. However, the rate of elective PTCA admissions within SW Essex is significantly below the national average. Revascularisation (CABG and PTCA) is accepted as an effective intervention in managing patients with coronary artery disease to improve symptoms and/or prognosis. Recent studies have shown that over one year, CABG was more expensive and offered greater survival than PTCA but little added benefit in terms of quality adjusted life years. The costs associated with CABG interventions are around 40% more than PCTA; clinicians need to ensure that the overall benefit for the patients of having a CABG justifies the additional costs. Figure 69. CABG Admissions Elective (2008/09) Figure 70. PCTA Admissions Elective (2008/09) 83
84 Figure 71 shows the percentage of patients with CHD whose last measured cholesterol was 5mmol or less for all PCTs in England. SW Essex falls below the 3SD lower limit on the funnel indicating SW Essex is performing significantly worse than the national average. It is important to keep cholesterol levels low in CHD patients to decrease the costs associated with further CHD complications. Figure 71. QOF for Cholesterol for CHD Patients Figure 72 shows the percentage of patients with TIA or stroke whose last measured total cholesterol is 5mmol or less for all PCTs in England. SW Essex falls below the 3SD lower limit on the funnel indicating SW Essex is performing significantly worse than the national average. Figure 72. QOF for Cholesterol for TIA/Stroke Patients 84
85 Figure 73 shows emergency CHD admissions per 100 on the disease register for all PCTs in England. SW Essex is in the bottom third of PCTs nationally indicating we are performing well in managing CHD patients on the disease register. Figure 73. Emergency CHD Admissions per 100 on Disease Register ( ) Figures show a comparison of the observed versus expected prevalence for CHD, HF, Hypertension and Stroke by PCT for all PCTs in England. Value of 0% means observed= expected; above 0% means observed= higher than expected; below 0% means observed= lower than expected. Figure 74 shows the observed versus expected prevalence for CHD for all PCTs in England. In terms of population CHD ascertainment, it is estimated that the majority of PCTs in England have significantly less CHD patients than expected. SW Essex falls below the 3SD lower limit on the funnel indicating the prevalence of CHD is significantly less than expected. We can say with 99% confidence that SW Essex has up to 18% of patients with CHD are not on a disease register and therefore may not be getting appropriate clinical care to manage their disease. This may be impacting on the high programme spend in SW Essex compared with other PCTs. 85
86 Figure 74. Observed Vs Expected CHD Prevalence Figure 75 shows the completeness of Heart Failure GP practice disease registers for SW Essex compared to other PCTs, by plotting PCTs in England s differences between observed and expected figures on HF registers on a funnel plot. Figure 76 shows the completeness of Heart Failure GP practice disease registers for all practices in SW Essex. Figures 75 and 76 indicate that case finding of HF patients is poor and we can say with a high degree of confidence that there are patients with who should be on this register who are not. Figure 75. Observed Vs Expected HF Prevalence 86
87 Figure 76. Observed Vs Expected HF Prevalence Figure 77 shows the observed versus expected prevalence for Hypertension for all PCTs in England. In terms of population Hypertension ascertainment, it is estimated that the majority of PCTs in England have significantly less Hypertension patients than expected. SW Essex falls below the 3SD lower limit on the funnel indicating the prevalence of Hypertension is significantly less than expected. We can say with a high degree of confidence that there are patients with who should be on this register who are not and therefore may not be getting appropriate clinical care to manage their disease. Figure 77. Observed Vs Expected Hypertension Prevalence 87
88 Figure 78 shows the completeness of Stroke GP practice disease registers for SW Essex compared to other PCTs, by plotting PCTs in England s differences between observed and expected figures on Stroke registers on a funnel plot. Like all PCTs in England, case finding of Stroke patients is poor and we can say we can say with a high degree of confidence that there are patients with who should be on this register who are not. Figure 78. Observed Vs Expected Stroke Prevalence Figure 79 shows emergency CHD admissions for all local and unitary authorities in England. Brentwood falls below the 3SD lower limit indicating there have been significantly less CHD emergency admissions than compared with the national average. Both Basildon and Thurrock fall above the 3SD upper limit on the funnel indicating there have been significantly more emergency admissions than the national average. 88
89 Figure 79. Emergency CHD Admissions in Unitary & Local Authorities ( ) Summary / Conclusions Spend on this programme is significantly above average with SW Essex being the third highest spending PCT nationally on problems of Circulation. Mortality rates continue to improve and are significantly better than average. There is marked variation in observed and expected circulatory diseases prevalence rates, and observed rates are much lower than expected rates the difference for CHD is -18%, hypertension is -38%, HF is -48% and stroke is -10%. The earlier identification of at risk patients will further contribute to the rising circulatory diseases prevalence in SW Essex and expected to further increase demand for CHD services locally. However, early clinical intervention and good clinical management of patients with CHD is likely to reduce overall healthcare costs in the medium term as it will reduce more expensive emergency or complicated procedures. Figure 79 (Emergency CHD admissions for all local and unitary authorities in England) shows both Basildon and Thurrock fall above the 3SD upper limit on the funnel indicating there have been significantly more emergency admissions in these areas than the national average. It could therefore be concluded that although it appears the prevalence of CHD (Figure 79) and HF (Figures 75/76) is significantly less than expected, hospital admissions are actually significantly greater than expected meaning that inadequate case finding and early intervention is driving high emergency hospital admissions, which is then driving overall spend. SW Essex has indifferent performance in the management of patients on the relevant cardio vascular disease (CVD) registers. SW Essex is performing better than the national average with regards to BP and CHD / Stroke or TIA but significantly worse with regards to cholesterol and 89
90 CHD / Stroke or TIA. SW Essex needs to improve its performance in maintaining cholesterol levels below 5mmol in CHD and Stroke / TIA patients to decrease the costs associated with further complications. Consistent and effective lifestyle interventions will improve management of these patients. SW Essex has an average rate of coronary artery bypass graphs (CABG) and a rate of percutaneous transluminal coronary angioplasty (PTCA) significantly below average. As previously mentioned, SW Essex has up to 38% of patients with Hypertension who are not on a disease register and therefore may not be getting appropriate clinical care to manage their disease. Hypertension is one of the leading causes of CHD, HF, Stroke and is a cause of CKD. Given that it can be easily controlled using drugs, it is imperative that more is done to keep it at a safe and healthy level within the population of SW Essex. The health effects from lowering blood pressure can be key in lowering the burden of disease from CVD and decreasing the large associated costs. It should therefore become a priority within SW Essex to find and treat people with hypertension. SW Essex needs to take further actions to tackle problems of Circulation including: Smoking prevention and cessation Promotion of physical activity at all ages Improve management of cholesterol Secondary prevention following angina, myocardial infarction (MI) and stroke Dissemination, implementation and monitoring of NICE guidance particularly in terms of identification and treatment of patients with hypertension Redeploy resources from lower cost-effectiveness interventions 90
91 8.7 Problems of the Respiratory System This programme covers the entire respiratory tract and includes among others, disease of the nose and throat, asthma, emphysema, chronic obstructive pulmonary disease and respiratory failure. Figure 80 Figure 80 shows Programme Budgeting spend ( million per 100,000 population) on respiratory problems by PCT, with SWE and its ONS cluster PCTs highlighted. In SWE, spend on respiratory problems falls within the services is in the fifth quintile nationally making it one of the greatest in the country. Spend on respiratory problems is also greater than all of our ONS Cluster PCTs and the ONS cluster mean. SW Essex s high spend on respiratory problems translates to some good health outcomes as shown in Figure 81. Directly Standardised Mortality Rates of Asthma and Bronchitis and Emphysema are significantly better than national averages, although DSR of Bronchitis, Emphysema and other COPD is significantly worse. All other outcome indicators in figure 81 show no significant difference to national averages. 91

92 Figure 81 Figure 82 shows Directly Standardised Mortality Rate for Asthma as a funnel plot comparing SW Essex and Basildon, and Thurrock LA populations to all other PCT populations in England. Regrettably there is not currently data for Brentwood available. South West Essex PCT lies below the 2SD lower funnel suggesting that asthma mortality rates are significantly lower than the average for PCTs in England. However, Basildon s asthma mortality rate falls within the 2SD funnels, suggesting no significant difference between local and national asthma mortality rates. Figure 82 92
93 Figures 83.1 and 83.2 show completeness of GP practice asthma registers in terms of observed/expected ratio of patients. We can say with a high degree of confidence that there are patients with who should be on this register that are not and therefore may not be getting appropriate clinical care to manage their disease. This may be impacting on the relatively high programme spend of this programme in south west Essex compared to other PCTs. Figure 83.1 Figure 83.2 Source: QOF Register & ERPHO Modelled Estimates 93
94 Figure 84 Figure 85 Figure 84 shows Directly Standardised mortality rate from Bronchitis, Emphysema and other COPD for SWE PCT and Basildon, Brentwood and Thurrock Local Authority populations compared to all other PCT populations in England, presented as a funnel plot. South West Essex PCT and Thurrock Local authorities have mortality rates that are significantly greater than the average for PCTs in England. Given that the mortality rate excluding other COPDs for South West Essex is significantly better than the average for England, other COPD appears to be the cause of our poor performance. This is potentially concerning and a QIPP priority given the PCT s high overall programme budget spend on respiratory conditions. 94

95 Figure 85 shows the completeness of COPD GP practice disease registers for south west Essex compared to other PCTs, by plotting PCTs in England s differences between observed and expected figures on COPD registers on a funnel plot. Like the majority of PCTs in England, case finding of COPD patients is poor and we can say with 99% confidence that up to 29% of patients with COPD are not recorded on a practice COPD register. This provides further explanation as to our high programme spend and poor health outcome in this disease area. Figure 86. Emergency bed-days per 1,000 patients for COPD (2008-9) Despite relatively high directly standardised mortality rates for COPD and high programme budget spend for this area, emergency bed days per 1000 COPD prevalence is in the second best performing quintile in the country Conclusions Programme spend in south west Essex for respiratory problems are amongst the largest in England, with the PCT falling into the worse performing quintile. Although directly standardised mortality rates for Asthma and Emphysema and Bronchitis are significantly better than national rates, when other COPD is considered, our rates as a PCT and in Basildon are significantly worse. Case finding at a practice level for COPD is currently poor and improving this will likely impact positively on both outcomes for patients and overall programme spend. As such it is recommended that the CCG considers developing QIPP schemes to improve case finding, improve clinical management and reduce spend on COPD. Smoking is also the key risk factor for COPD and reducing smoking prevalence across Basildon should be a key priority for all key agencies 95

96 8.8 Problems of the Skin Spend on this programme covers conditions such as eczema, dermatitis, psoriasis, cellulitis, leg ulcers, acne, moles and pigments changes among others. South West Essex has higher than average spend in comparison to its ONS cluster. It is in the fifth quintile of expenditure per 100,000 population against all PCTs in England, particularly for burns where South West Essex is the second highest ranking PCT by spend in England. Figure 87. Programme Budgeting Spend on Problems of the Skin 96

97 8.9 Problems of Musculo-Skeletal System and Trauma The spend on this programme covers conditions such as juvenile arthritis, gout, rheumatoid arthritis, auto-immune disease, osteoarthritis, osteoporosis, joint deformities, back pain and other chronic pain of bone, muscle or joints. It excludes healthcare costs due to injuries. Figure 88. Programme Budgeting Spend on Problems of the Musculo-Skeletal System and Trauma Figure 88 shows Programme Budgeting Spend per 100,000 population on Problems of the Musculo-Skeletal System and Trauma. SW Essex PCT is in the middle quintile of spend across PCTs in England for this programme and has a rate of spend approximately equal to its ONS cluster mean. 97
98 Figure 89. Key Indicators for Musculo-Skeletal System and Trauma Figure 89 shows key indicators for Musculo-skeletal system an trauma at PCT level. SW Essex performs well across the majority of indicators compared to other PCTs. Directly Standardised Mortality Rates from accidental falls, accidental falls in the under 75s and all femur fractures is significantly lower than the England average. Similarly, hospital admissions for primary hip and knee replacements and revision hip replacements are also all significantly lower than England averages. However, the percentage of emergency readmissions to hospital within 28 days for fractured proximal femur in SW Essex is significantly worse than England averages. Figure 90. Primary Hip Replacement (2009/10) 98
99 Figure 91. Revision Hip Replacements (2009/10) Figures 90 and 91 show funnel plots of Rate of Primary and Revision Hip replacements per 100,000 population for each PCT in England and Basildon, Brentwood and Thurrock local authority populations in 2009/10. Rates of primary hip replacements for both SW Essex and Basildon, Brentwood and Thurrock local authority areas are significantly less than England PCTs. For revision hip replacements, rates are significantly less for SW Essex, Basildon and Thurrock, but not significantly different for Brentwood. This may reflect the fact that life expectancy in Basildon and Thurrock populations is less than that for Brentwood due to the additional health inequalities faced by Basildon and Thurrock populations compared to Brentwood. As such, a smaller proportion of the population in Thurrock and Basildon are living long enough to require revision Hip Replacements compared to Brentwood. It could also suggest that patients in Basildon and Thurrock are more likely to have other health conditions that make surgical procedure for revision hip replacements more risky. 99
 (Mean Pre-Operative EQ-5DX Index score) for Hip replacement surgery for")
100 Figure 92. PROMS Pre Operative Score for Hip Replacement Figure 92 shows the Pre-Operative Patient Recorded Outcome Measure Scores (PROMS) (Mean Pre-Operative EQ-5DX Index score) for Hip replacement surgery for all England PCTs in 2009/10. The EQ-5D descriptive system provides two headline measures of general pre and postoperative health, the EQ-5D Index and EQ-VAS. The health gain is the difference between the scores before and after the operation for each measure. The EQ-5D descriptive system of health-related quality of life states consists of five dimensions - mobility, self-care, usual activities, pain/discomfort and anxiety/depression - each of which can take one of three responses. The responses record three levels of severity - no problems/some or moderate problems/extreme problems - within a particular EQ-5D dimension. These five states are combined using weights to give a single index measure which ranges from to 1, where 1 is the best possible state of health. SW Essex ranked in quintile five for mean PROMS score for Hip replacement surgery, suggesting that patients are having hip replacements at a point where their health has deteriorated less than patients in other PCTs in England. 100

101 Figure 93. Hip Replacement Emergency Admissions Figure 94. Mortality from Falls Figures 93 and 94 show rate of emergency admissions for hip replacements and mortality rate from falls in the over 65s for all England PCTs. SW Essex has rates for both emergency admissions for hip replacements and mortality from falls in the over 65s which are significantly less than England PCT averages. This would suggest good falls prevention programmes and possibly good after care following a fall. The latter is supported by the data in figure 95 which shows that SW Essex PCT has deaths within 30 days of emergency admission to hospital for fractured proximal femur that are smaller than regional and national averages and are in the 101


102 second best performing quintile in the country. However, figure 96 highlights that SW Essex has some of the greatest emergency re-admission rates to hospital within 28 days of discharge for fractured proximal femur, suggesting that patients may be being discharged too quickly, or that after care in the community is inadequate. Figure 95 Figure
103 8.9.1 Conclusions / Summary South West Essex generally performs well on this programme. Despite Programme budgeting spend being average for England, outcomes are generally significantly better than for England, specifically in the areas of Primary and Revision Hip Replacements, Knee replacements, Emergency Admissions for Hip Replacements, and mortality from falls in the over 65s. The PCT has commissioned comprehensive falls prevention programmes since 2005 and these may partly explain our good performance on this programme. The high ranking of the PCT in terms of mean PROMS score for Hip Replacement suggests that our population are having hip replacements at a relatively early stage in terms of their health deterioration compared with other PCT populations. The very high ranking of the PCT in terms of emergency re-admissions to hospital within 28 days of discharge following fractured proximal femur warrants further investigation. 103

104 8.10 Problems of the Genitourinary System This area covers a range of conditions affecting the genitourinary tract (GU). Figure 97 shows programme budgeting spend on problems of the GU for all PCTs in England and the ONS cluster comparators. The spend on this programme covers conditions such as nephritis, acute and chronic renal failure, urinary stones, cystitis, prostate disease, diseases of the testes and ovaries, pelvic inflammatory disease, endometriosis, fibroids, uterine prolapse, menstrual disorders and sexually transmitted infections but excluded infertility. SW Essex is spending less than the ONS cluster average and less than all of the ONS cluster comparators. Furthermore it is in the bottom half of the first quintile indicating it is one of the lowest spending PCTs nationally on problems of the Genitourinary System. Figure 97. Programme budgeting spend on problems of Genitourinary System 104
105 Figure 98 shows key indicators for problems of the genitourinary system. There is no significant difference in mortality rates from chronic renal failure in SW Essex compared with the national average. SW Essex has significantly greater achievement than the national average on kidney function testing which is positive because evaluating how well the kidneys are working means that kidney problems can be diagnosed earlier and therefore treated earlier preventing more serious complications. There is no significant difference in achievement of the remaining QOF indicators (BP 145/85 and ACE/ARB Therapy) in SW Essex compared to the national average. Figure 98. Key Indicators for Problems of the Genitourinary System Key: Significantly better than England average Not significantly different from England average Significantly w orse than England average No significance can be calculated England Key: Indicator 1 MORTALITY Local Number Local Value Eng Avg Eng Worst England Range 2 Chronic Renal Failure Chronic Renal Failure u75 years QOF ATTAINMENT 5 BP 145/85 (CKD3) ACE/ARB Therapy (CKD5) Kidney function test (CKD6) Eng Best Figure 99 shows the observed versus expected prevalence of chronic kidney disease (CKD) for all GP practices in Basildon, Brentwood and Thurrock. Most GP practices have registers that are not statistically different from expected, however there are a few which may require further investigation. Figure 99. Observed vs. Expected Prevalence CKD by practices in SW Essex Source: QOF Register & ERPHO Modelled Estimates 105
106 Figure 100 shows the use of ACE inhibitor and ARB therapy in CKD with hypertension and proteinuria. There is no significant difference in the use of ACE inhibitor and ARB therapy in CKD with hypertension and proteinuria in SW Essex, Basildon, Brentwood and Thurrock compared with the national average. Figure 100. Use of ACE inhibitor & ARB therapy in CKD Summary / Conclusions SW Essex is one of the lowest spending PCTs nationally on problems of the Genitourinary System. However, SW Essex is performing at a comparable level given the lack of spend on this programme. SW Essex is not performing significantly worse than compared with the England average in any of the areas recorded within this programme. SW Essex is performing significantly better than the national average on kidney function testing, testing more patients relative to the national average. This said there are still improvements that can be made to the performance of SW Essex within this programme. 106


107 8.11 Maternity and Reproductive Health Spend on this programme covers infertility services (e.g. IVF), family planning, termination of pregnancy, supporting people through pregnancy to childbirth and parenting. Figure 101. Programme Budgeting Spend on Maternity and Reproductive Health Figure 101 shows Programme Budgeting Spend per 100,000 population on Maternity and Reproductive Health. SW Essex PCT is in the highest quintile of spend across PCTs in England for this programme and has a rate of spend that is higher than its ONS cluster. However, outcomes for this programme are above average in comparison to other PCTs. Currently the number of births per year in South West Essex is at 5610 births per year, which is higher than the England rate as shown in Figure 102. This is expected to fall to 5400 by the year Figure

108 The delivery to older mothers aged 35 years and older is less than the rate for the region and England. Deliveries have fallen from 977 in to 896 in The delivery to teenage mother aged less than 20 years is similar to that of the region and England. Figure 103 shows the percentage of caesarean sections for South West Essex. The percentage of caesareans has increased from 26.3% to 28.8% between and respectively and remains significantly higher than that of the East of England and England percentages. Figure 103. Percentage of caesarean sections The increase in deliveries by C-Section may be unjustified and warrants investigation to determine whether there are potential improvements to be made to care pathways along with associated cost savings. Teenage pregnancy is a major driver a health inequality, both in terms of poor health and wellbeing outcomes for both parent and child, and because children of teenage mothers are much more likely to become teenage parents themselves, perpetuating inequality across generations. Figure 104 shows the conception rates for females aged in Basildon. Overall the rate of conceptions has increased between 2004 and Basildon rates remain higher than the East of England and England. However, more recently the gap between conceptions nationally and Basildon is widening. 108

109 Figure 104. Basildon under 18 conception rates for women aged Figure 105 shows under 18 conception rates by Basildon wards in comparison to England. Lee Chapel North, Fryerns and Pitsea South East have conception rates significantly higher than that of England. The Billericay East, Billericay West and Burstead have rates significantly lower than England. Higher conception rates are generally found in wards with high deprivation. Figure 105. Under 18 conception rates ( ) by Basildon wards 109
110 Figure 106 shows the under 18 conception rate for Basildon and the percentage that lead to abortion. Overall, the rate of conceptions has decreased between 1998 and 2009, but more recently it is increasing and those leading to abortion have also increased. Whilst termination has an associated initial cost, it could be argued to be a better result in terms of impact on reducing health inequalities, as a positive driver to reducing teenage maternities. It may also suggest an increase in aspiration within Basildon young people, as there is strong evidence that the aspirations and life chances of an under 18 year old girl correlates positively with her decision to opt for a termination rather than a birth. That said, primary prevention of under 18 conceptions remains the best possible outcome for both our population and health economy and considering the recent trends in conception rates may need to be reviewed. Figure 106. Under 18 Conception rates for Basildon District Council Figure 107 shows breastfeeding initiation from for South West Essex. Initiation rates in South West Essex are consistently lower, with an increasing difference, when compared to England and the East of England. Evidence suggests that breastfeeding reduces the risk of later consequences (to child in terms of childhood illness and mother in terms of breast cancer prevention), therefore there is potential in the reduction of costs in other areas by encouraging mothers to breast feed. 110
111 Figure 107. Trend in breastfeeding initiation in South West Essex Smoking during pregnancy is related to many adverse effects on health and reproduction, in addition to the general health effects of tobacco. A number of studies have shown that tobacco use is a significant factor in miscarriages among pregnant smokers, and that it contributes to a number of other threats to the health of the foetus. Smoking nearly doubles the risk of low birth weight babies. Infants born to smokers weigh on average 200 grams less than infants born to women who do not smoke. Premature and low birth weight babies face an increased risk of serious health problems as new-borns have chronic lifelong disabilities such as cerebral palsy (a set of motor conditions causing physical disabilities), mental retardation and learning problems. Overall, they also face an increased risk of death. Figure 108 shows the percentage of pregnant women with smoking status recorded, still smoking at time of delivery for Basildon from Overall, women smoking at delivery has decreased in Basildon, furthermore, at a rate faster than the East of England and England. However, it is worth noting the slight increase between that may warrant further monitoring and or investigation. Figure 109 shows that 10.7% of pregnant women in Basildon are still smoking at the time they deliver in 2009/10. Basildon has a statistically significantly lower rate of smoking at time of delivery at 95% confidence compared to the East of England and England. 111

112 Figure 108. Percentage of women smoking at time of delivery Figure 109. Percentage of women smoking at time of delivery From a public health point of view, this is mostly encouraging, although rates of smoking at time of delivery are likely to vary between different geographical areas of Basildon and correlate with deprivation levels. Infant mortality is defined as the ratio of infant deaths to live births. Figure 110 shows the infant mortality rate of all local authorities in England. Basildon has an infant mortality rate that is lower than the average. 112
113 Figure 110. Infant mortality rate per 1000 live births Summary / Conclusions Spend on Maternity and Reproductive Health is comparably high in South West Essex. This is partly explained by the fact that we have a comparably high birth rate. However, the high rate of deliveries by C-Section and the large increase between 08/09 and 09/10 may be unjustified and warrants investigation to determine whether there are potential improvements to be made to care pathways along with associated cost savings. Overall the rate of conceptions for females aged in Basildon has increased. Basildon rates remain higher than the East of England and England. More recently, the gap between conceptions nationally and Basildon is widening. Teenage pregnancy is a major driver a health inequality, both in terms of poor health and wellbeing outcomes for both parent and child, and because children of teenage mothers are much more likely to become teenage parents themselves, perpetuating inequality across generations. Lee Chapel North, Fryerns and Pitsea South East have conception rates significantly higher than that of England. The Billericay East, Billericay West and Burstead have rates significantly lower than England. Higher conception rates are generally found in wards with high deprivation. The rate of conceptions in Basildon has decreased between 1998 and 2009, but more recently it is increasing and those leading to abortion have also increased. Whilst termination has an associated initial cost, it could be argued to be a better result in terms of impact on reducing health inequalities, as a positive driver to reducing teenage maternities. It may also suggest an increase in aspiration within Basildon young people, as there is strong evidence that the aspirations and life chances of an under 18 year old girl correlates positively with her decision to opt for a termination rather than a birth. That said, primary prevention of under 18 conceptions remains the best possible outcome for both our population and health economy and considering the recent trends in conception rates may need to be reviewed. 113
114 There is a large gap between the breast feeding initiation rates in South West Essex compared to England and the East of England. Evidence suggests that breastfeeding reduces the risk of later consequences (to child in terms of childhood illness and mother in terms of breast cancer prevention), therefore there is potential in the reduction of costs in other areas by encouraging mothers to breast feed. Overall, women smoking at delivery has decreased in Basildon, furthermore, at a rate faster than the East of England and England. However, it is worth noting the slight increase between that may warrant further monitoring and or investigation. Basildon has a statistically significantly lower rate of smoking at time of delivery at 95% confidence compared to the East of England and England. From a public health point of view, this is mostly encouraging, although rates of smoking at time of delivery are likely to vary between different geographical areas of Basildon and correlate with deprivation levels. Basildon has an infant mortality rate that is lower than the average. 114

115 9. PREVENTING ILL HEALTH AND IMMUNISATION This programme includes health improvement and prevention programmes for example commissioned activity that reduces and prevents smoking and obesity, promotes sensible drinking or provides health trainers to deprived communities. It also includes immunisation programmes. Figure 111. Programme Budgeting Spend on Preventing Ill-health and Immunisation Source: The most common causes of mortality, premature mortality and morbidity in Basildon, and areas of biggest healthcare spend - Cardio-vascular disease, cancer, COPD, mental health and diabetes are all driven by one or more of common lifestyle factors; smoking, obesity (linked to nutrition and physical activity), and alcohol consumption. As such, initiatives that improve the lifestyle behaviours of our population will impact positively on both mortality and morbidity rates and healthcare costs. Both smoking and obesity rates in Thurrock are greater than national and regional averages. Figure 111 shows Programme Budgeting Spend on Preventing Ill Health and Immunisation per head of population for all PCTs in England and SW Essex PCT s ONS Cluster. SW Essex PCT is in the highest quintile in terms of spend on preventing ill health per head of population when compared to other PCTs in England. However, given its high levels of deprivation is to be expected. When compared to its ONS cluster of PCTs, SW Essex spend on preventing ill health is average. 115

116 Worcester CD Bexley LB Gravesham CD Broxbourne CD Crawley CD Gosport CD Gloucester CD Swindon UA Havering LB Medway UA Ipswich CD Wellingborough CD Thurrock UA Milton Keynes UA Basildon CD Stevenage CD Dartford CD Forest Heath CD Rushmoor CD Peterborough UA Harlow CD Northampton CD East of England England 9.1 Smoking Figure 112 Figure 112 shows the four week smoking quit rate (through NHS commissioned services) per 100,000 population for all PCTs in England plus Thurrock, Basildon and Brentwood local authority populations. Basildon has a smoking quit rate greater than the England, Thurrock and SW Essex average. However, smoking quit rate per 100,000 population will be a product of the proportion of the population of each PCT that smoke as well as the success of commissioned services in helping smokers quit at a population based level, and therefore should be interpreted with caution as a measure in terms of success in reducing smoking prevalence Figure Adult (aged 16+) Smoking Prevalence ( ) Source: APHO Health Profiles
117 Percentage of Smokers Figure 113 shows the overall adult smoking prevalence in Basildon LA area for 2009/10 compared to the England mean and the Basildon LA ONS Cluster comparator local authorities. These are local authorities which have populations that are similar to Basildon in characteristics such as age structure and deprivation levels. Due to the large confidence intervals it is not possible to conclude that there is a statistically significant difference in smoking prevalence between Basildon and any other ONS comparator LA. However, this is likely to be due to the relatively small sample of population surveyed in each local authority area as a proportion of the total population. Smoking is strongly associated with deprivation. Figure 114 shows the prevalence of smoking of the population aged 16 plus in deprivation quintiles across the Basildon and Brentwood CCG Cluster from The most deprived quintile (Q5) in the CCG cluster has smoking prevalence rates almost three times that of the population living in the least deprived quintile (Q1). This is significant, as differences in smoking prevalence between affluent and deprived communities are this single biggest cause of health inequalities. Figure % Adult (aged 16+) Smoking Prevalence by Deprivation Quintile, Basildon and Brentwood CCG % 25.00% 20.00% 15.00% 10.00% 5.00% 0.00% Quintile 1 Quintile 2 Quintile 3 Quintile 4 Quintile 5 BB CCG Source: NHS South West Essex Public Health Directorate (2012) Figure 115 shows the rate of access per smoker to NHS commissioned stop smoking services per estimated smoking population x 1000, by deprivation quintile and for the Basildon and Brentwood CCG cluster population. Access is defined as accessing an NHS commissioned/provided stop smoking service and setting a four week quit date. This demonstrates how successful our stop smoking services are at attracting individual smokers to make a quit attempt, as a rate of the total population of smokers living in areas of differing affluence and deprivation within Basildon and Brentwood. 117
118 Access per smoking population x 1000 Figure Access to NHS Stop Smoking Services per estimated smoking population aged 16+ x Quintile 1 Quintile 2 Quintile 3 Quintile 4 Quintile 5 BB CCG Source: NHS South West Essex Public Health Directorate (2011) Smokers in the most deprived 20% of MSOAs the Basildon and Brentwood CCG area (quintile 5) access NHS stop smoking services at a rate that is significantly greater than cluster s overall rate of access per estimated smoking population and the rate of access of smokers within deprivation quintiles 4, 2 and 1. However there is no significant difference in rate of access between quintiles 3 and 5. We can be confident of this with 95% statistical significance. Ideally, if smoking cessation services are going to impact on health inequalities there should be an increase in access between each quintile from 1 to 5 that is statistically significantly different. Figure 116 shows the success rate that smokers from MSOAs in the five deprivation quintiles across Basildon and Brentwood CCG area have in quitting smoking through an NHS stop smoking service and remaining quit at four weeks. (i.e. the conversion rate of smokers setting a quit date to a four week quit). 118
119 Figure % Percentage of smokers making a quit attempt through NHS Services in 2008/9 and 2009/10 who remained quit at four weeks 60.00% 50.00% 40.00% 30.00% 20.00% 10.00% 0.00% Quintile 1 Quintile 2 Quintile 3 Quintile 4 Quintile 5 BB CCG Source: NHS South West Essex Public Health Directorate (2012) NICE Guidance i states that all NHS stop smoking services should achieve a minimum 35% conversion percentage of smokers setting a quit rate to those remaining quit at four weeks, to be considered of adequate quality. As figure 116 shows, smokers from all five deprivation quintiles achieve a quit success rate at four weeks above 35%, however the success rate of quitters decreases as deprivation increases, with smokers in the 40% most deprived MSOAs in the Basildon and Brentwood CCG area having a quit success rate less than the cluster s overall rate, and smokers the 60% most affluent MSOAs having a quit success rate at four weeks greater than the cluster s overall rate This mirrors national research which shows the smokers from deprived communities find it more difficult to quit smoking than those from affluent ones. ii However, if health inequalities are to be reduced it makes it even more imperative to attract a greater proportion of smokers from deprived quintiles into NHS stop smoking services compared to from affluent communities. Figure 117 shows the rate of smoking quitting at four weeks through NHS commissioned services per estimated total adult (16+) smoking population (x1000) within MSOAs across the five quintiles of deprivation in the Basildon and Brentwood Cluster area, and for the cluster as a whole. 119
120 Quit rate per smoking population x 1000 Figure Rate of smoking quits per estimated smoking population x Quintile 1 Quintile 2 Quintile 3 Quintile 4 Quintile 5 BB CCG Source: NHS South West Essex Public Health Directorate (2012) Because the confidence intervals for the quit rates of each deprivation quintile overlap, we cannot conclude with 95% confidence that there is any statistically significant difference in smoking quit rate for smokers from deprivation quintiles 1,3,4 and 5 in Basildon and Brentwood CCG area. This would suggest that whilst NHS stop smoking services are successful at helping some smokers quit, they are failing to impact on health inequalities across the Basildon and Brentwood cluster, as smokers in our most deprived communities are not quitting smoking at a rate greater than our affluent ones. 120

121 9.2 Alcohol Figure 118 Figure 118 shows rate of alcohol related admissions to hospital for all PCTs in England plus for Basildon, Brentwood and Thurrock local authority populations. The rate of alcohol admissions for the Basildon population is greater than for the SW Essex population and regional averages but less than the national average. Figure
122 Figure 119 shows that alcohol related hospital admission rate from to for Basildon have trended upwards, in line with England and SW Essex population, although have remained less than the rate for England. However, from to , the gap in admission rate between Basildon and England has narrowed, with admissions in Basildon increasing at a faster rate than those for England. There is strong evidence to show both the effectiveness and cost effectiveness of alcohol screening and brief intervention initiatives in terms of identifying and changing the behaviour of patients drinking alcohol at hazardous and harmful levels, in order to prevent alcohol dependence. The estimated return on investment (ROI) for the Alcohol DES has been calculated to be A Directed Enhanced Service (DES) for Alcohol Related Risk Reduction was introduced in 2009 to encourage screening of newly registered patients for alcohol use. Patients registering with the GP over the age of 16 were to be screened using FAST, AUDIT C, or AUDIT PC screening tools. If this resulted in a positive screen, as outlined by the trigger points of the test, a full AUDIT would then be carried out. Ensuring maximum screening of newly registered patients in line with the DES is likely to result in considerable cost savings to the cluster in terms of alcohol attributable healthcare costs. 1 DoH Alcohol Ready Reckoner V5.2 (Updated February 2011) 122
123 Percentage (%) 9.3 Obesity The need to tackle the problem of obesity relates to the undisputed evidence that obesity is a risk factor for a range of health problems. The four most common medical problems linked to obesity are coronary heart disease, hypertension, type 2 diabetes and osteoarthritis. The incidence of all these conditions increases with increasing body weight Childhood Obesity Childhood obesity is a complex public health issue that is a growing threat to children s health. If the number of obese children continues to rise, today s children and future generations could have shorter life expectancies than their parents. Tackling childhood obesity requires changes in the behaviour of individual children, their parents and of society in general and reflects recent trends across most developing countries to greater fat and sugar consumption and reduced physical activity. There is also evidence to suggest that babies who are breastfed are less likely to be obese in adulthood. Since 2005, PCTs have been required to collect height and weight data for BMI on all primary school children in reception year (ages 4/5) and year 6 (ages 10/11) through the National Childhood Measurement programme (NCMP). Figure Prevalence of Obesity in Year 6 Children ( ) England East of England Jung NHS Centre for Reviews and Dissemination,

124 Figure 120 shows the prevalence of obesity in children at year 6 for Basildon and its ONS cluster of local authorities, together with regional and national prevalence from NCMP data. Basildon has a childhood obesity prevalence that is significantly less than England s and two of its ONS comparator local authorities. There is no statistically significant difference between childhood obesity prevalence in Basildon compared to the East of England region and the remaining ONS local authority comparators Adult Obesity Figure 121 shows the estimated prevalence of obese adults aged 16+ by local authority areas, comparing Basildon with geographical neighbours, the national and East of England average. Figure 121 Source: ERPHO Basildon has a greater percentage of obese adults than Brentwood and regional and national averages. There is no significant difference in prevalence of adult obesity between Basildon, Thurrock and Havering. 124
 Figure 122 shows estimated prevalence of obese adults aged 16+ in Basildon compared with its ONS cluster local authorities.")
125 Percentage (%) Figure 122 Prevalence of Adults who are Obese aged 16 Years and over England East of England Source: ERPHO (Health Survey for England) Figure 122 shows estimated prevalence of obese adults aged 16+ in Basildon compared with its ONS cluster local authorities. Basildon has a greater percentage of obese adults than five of its comparator local authority populations. Only one comparator local authority (Swale) has a significantly greater percentage of obese adults than Basildon. There are 18,070 people on the Obesity registers of practices within Basildon in March 2011, giving a prevalence of 9.7%. This prevalence is significantly less than 24.2% obesity prevalence that was calculated from the Health Survey for England suggesting significant under recording of obesity on GP practice registers. Obesity at an individual patient level is a product of an excess of calories consumed through eating compared to those burned off through metabolism and physical activity. Figures R shows the percentage of Basildon residents who eat healthy (as defined by eating five or more portions of fruit and vegetables per day) compared to Basildon s ONS cluster local authorities. Whilst it is still possible to consume too many calories whilst eating five portions of fruit and vegetables a day, it is the best proxy measure available to us in terms of healthy eating habits. 125
126 Harlow CD Stevenage CD Dartford CD Northampton CD Basildon CD Swale CD North Braintree CD Cherwell CD Gloucester CD Chelmsford CD Dacorum CD Basingstoke and Bedford UA Colchester CD Percentage (%) Percentage (%) Figure 123 Estimated prevalence of adults (16+) that eat healthily ( ) England East of England Whilst the absolute percentage of Basildon adults aged 16+ who eat healthy is less than regional and national averages, because of the relatively wide confidence intervals, there is no statistically significant difference between Basildon and any other ONS comparator local authorities or national rates. Figure Percentage (%) of Adults who are Physically Active England East of England Source: APHO LA Public Health Profiles Figure 124 shows the percentage of adults in Basildon who are physically active compared to its ONS comparator local authorities and regional and national rates. Physically active is defined as 126
127 Participation in moderate intensity sport and active recreation on 20 or more days in the previous 4 weeks. Basildon has a lower percentage of adults who are physically active compared to regional and national rates and 10 ONS comparator local authorities. However, because of the relatively wide confidence intervals we cannot conclude that there is any statistically significant difference between Basildon s percentage of physically active adults and that of any other comparator local authority or regional or national rates. Encouraging patients to eat more healthily or become more physically active, or referring them into commissioned health improvement programmes (e.g. Vitality) that assist patients to improve their lifestyles is likely to impact positively on Basildon s obesity problem which in turn should translate into reduced future healthcare cost savings in terms of lifestyle related diseases such as CVD, hypertension, diabetes etc. 127
128 % Immunised 9.4 Immunisations Figure 125 shows Childhood Immunisation coverage by 5 th Birthday for SW Essex in and together with coverage for the best and worst performing PCTs in England. Childhood Immunisation coverage has improved in SW Essex in the last three years significantly, and shows a slight improvement between and on every vaccination except Diptheria, Tetanus, Polio and Pertussis booster, although the differences between the two years are small and could be due to random variation, Coverage of Diptheria, Tetanus, Polio and Pertussis booster and MMR remain below the 95% required for herd immunity. Childhood immunisations remain one of the most cost effect health interventions that the NHS undertakes, in terms of return on investment, and ensuring 95% herd immunity for all childhood immunisations is an important priority. Figure 125. Comparison of Selected Childhood Immunisation Programmes Childhood Immunisation by 5th Birthday Best PCT* SWE PCT Worst PCT* SWE PCT (Q1-3) Diptheria, Tetanus, Polio Hib Diptheria, Tetanus, Polio & Pertussis Booster 88.7 MMR (First Dose) MMR (First and Second Dose) Figure 126. Flu Uptake in 65+ years Percentage of patients aged 65 and over immunised against influenza by Primary Care Trust, % Q1 Q3 Q2 Q4 South West Essex PCT 80.00% Q5 England 70.00% 60.00% 50.00% 40.00% 30.00% 20.00% 10.00% 0.00% Source: NHS Information Centre PCTs ranked Figure 126 shows uptake of flu vaccination in the 65 and older age group, ranked by PCT in England. SW Essex is in the best performing quintile and one of the best performing PCTs in England for flu vaccination coverage in the 65+ population. 1 National Institute of Health and Clinical Excellence (NICE), Smoking Cessation Services in Primary Care, Pharmacy, Local Authorities and Workplaces
129 1 Jarvis, M. J. and Wardle, J (2005) Social patterning of health behaviours: the case of cigarette smoking. In: Marmot, M. and Wilkinson, R. (eds) Social Determinants of Health. Oxford: Oxford University Press,2 nd edition Summary / Conclusions SW Essex PCT is in the highest quintile in terms of spend on preventing ill health per head of population when compared to other PCTs in England. However, given its high levels of deprivation is to be expected. When compared to its ONS cluster of PCTs, SW Essex spend on preventing ill health is average. Basildon has a smoking quit rate greater than the England, Thurrock and SW Essex average. However, smoking quit rate per 100,000 population will be a product of the proportion of the population of each PCT that smoke as well as the success of commissioned services in helping smokers quit at a population based level, and therefore should be interpreted with caution as a measure in terms of success in reducing smoking prevalence Smoking is strongly associated with deprivation. Within Basildon, the most deprived quintile in the CCG cluster has smoking prevalence rates almost three times that of the population living in the least deprived quintile. This is significant, as differences in smoking prevalence between affluent and deprived communities are this single biggest cause of health inequalities. NHS stop smoking services are successful at helping some smokers quit, they are failing to impact on health inequalities across the Basildon and Brentwood cluster, as smokers in our most deprived communities are not quitting smoking at a rate greater than our affluent ones. The rate of alcohol admissions for the Basildon population is greater than for the SW Essex population and regional averages but less than the national average. From to , admissions for Basildon have trended upwards, in line with England and SW Essex population, although have remained less than the rate for England. However, from to , the gap in admission rate between Basildon and England has narrowed, with admissions in Basildon increasing at a faster rate than those for England. Early identification of patients in primary care who are drinking at hazardous or harmful levels together with brief or extended alcohol interventions will impact positively on alcohol admission rates and have been shown to be extremely cost effective. Commissioning hospital based alcohol services that aim to provide tier II, III and IV alcohol related services to those admitted for disease related to alcohol have also shown to be highly cost effective and should be considered. Basildon has a greater percentage of obese adults than Brentwood and regional and national averages. There is no significant difference in prevalence of adult obesity between Basildon, Thurrock and Havering. There are 18,070 people on the Obesity registers of practices within Basildon in March 2011, giving a prevalence of 9.7%. This prevalence is significantly less than 24.2% obesity prevalence that was calculated from the Health Survey for England, suggesting significant under recording of obesity on GP practice registers. Basildon has a lower percentage of adults who are physically active compared to regional and national rates and 10 ONS comparator local authorities. However, because of the relatively wide confidence intervals we cannot conclude that there is any statistically significant difference 129
130 between Basildon s percentage of physically active adults and that of any other comparator local authority or regional or national rates. Basildon has a lower prevalence of healthy eating amongst adults compared to the East of England average and it has the third lowest percentage of healthy eating adults compared to its CIPFA local authority comparators. Basildon has a childhood obesity prevalence that is significantly less than England s and two of its ONS comparator local authorities. There is no statistically significant difference between childhood obesity prevalence in Basildon compared to the East of England region and the remaining ONS local authority comparators. Childhood Immunisation coverage has improved in SW Essex in the last three years significantly, and shows a slight improvement between and on every vaccination except Diphtheria, Tetanus, Polio and Pertussis booster, although the differences between the two years are small and could be due to random variation, coverage of Diphtheria, Tetanus, Polio and Pertussis booster and MMR remain below the 95% required for herd immunity. Childhood immunisations remain one of the most cost effect health interventions that the NHS undertakes, in terms of return on investment, and ensuring 95% herd immunity for all childhood immunisations is an important priority. SW Essex is in the best performing quintile and one of the best performing PCTs in England for flu vaccination coverage in the 65+ population. 130

131 10. SOCIAL CARE NEEDS AND THIRD SECTOR COMMISSIONING This area of spend covers a wide range of activities, which aims to enhance quality of life by collaborating with other agencies, especially the third sector. For example, working with our partners to ensure better support for carers, rehabilitation in the community, collaborating to ensure affordable warmth and minimise the effects of fuel poverty, and collaboration in Children s Centres. The evidence (see the Public Health Outcomes Evidence Base and NHS Outcomes Evidence Based Practice documents) suggests that joint investment in these activities will promote innovative approaches in prevention work, can improve productivity (through improved effectiveness) and can contribute to significant savings to health and social care spend. Figure 127 shows programme budgeting spend on social care needs and third sector commissioning by PCT and ONS cluster. SW Essex is in the bottom quintile of spenders nationally and below the ONS Cluster Group average. However, due to the very large variation between the highest and lowest spenders across the country some discrepancies in the reporting may be present and caution is needed in any interpretation of the data. Figure 127. Programme Budgeting Spend on Social Care Needs and Third Sector Commissioning by PCT and ONS cluster

132 11. GMS/PMS and PHARMACEUTICAL SERVICES This programme includes all other expenditure that cannot be allocated to any of the other categories. The biggest element at present is the GMS & Pharmaceutical Services Contract. In time, better information will allow this area of NHS expenditure to be allocated to the appropriate Programme Budget category. Figure 128 shows programme budgeting on GMS/PMS and pharmaceutical services by PCT and ONS cluster. SW Essex is in the bottom quintile, below the ONS Cluster average and is spending less than all of the ONS Cluster comparators. Figure 128. Programme Budgeting on GMS/PMS and Pharmaceutical Services by PCT and ONS cluster There are a number of indicators that can be used to measure or monitor prescribing in primary care. Indicators are often used within the performance management process or locally in prescribing incentive schemes. These can be used to ensure that patients are receiving optimal care (e.g. statins for CVD risk factors), for minimising the risk of the spread of medicine-resistant bacteria by over prescribing of antibiotics and for cost reduction measures (e.g. generic prescribing of statins). 132
133 Items per Antibacterial STAR-PU Percentage Figure % Ezetimibe of all Lipid Lowering Drugs by PCT, Oct - Dec South West Essex PCT's ranked Q1 Q2 Q3 Q4 Q5 Figure 129 shows the percentage of all lipid lowering drugs prescribed as ezetimibe by PCT. SW Essex is in the second lowest quintile with 3.2% of lipid lowering drugs being prescribed as ezetimibe. Ezetimibe does not have the same evidence-base as statins, especially in terms of outcome data. It is also less cost-effective than statin therapy. It is therefore an area of prescribing which is being reviewed as one of the QIPP prescribing workstreams. In SW Essex prescribing costs have shown a 31% reduction in 2011/12 compared to the previous year. Figure Antibacterial Items per STAR-PUs by PCT, Oct to Dec 2011 South West Essex PCT's ranked Q1 Q2 Q3 Q4 Q5 133

134 Figure 130 shows the number of antibiotic items prescribed per STAR-PU by PCT for the third quarter of 2011/12. This provides an indication of the volume of prescribing by the PCT and suggests that SW Essex is demonstrating a high usage of antibiotics. As well as contributing to costs, a high usage of antibiotics may also increase the incidence of antibiotic resistance. Figure Percentage Cephalosporins & Quinolones of all Antibacterial Drugs by PCT, Oct to Dec South West Essex PCT's ranked Q1 Q2 Q3 Q4 Q5 Figure 131 shows proportion of cephalosporins and quinolones as a percentage of all antibacterial drugs prescribed by individual PCT in the last quarter of 2011/12. A higher use of cephalosporins and/or quinolones in primary care is associated with a higher rate of hospital acquired infections such as C. diff. SW Essex is in the second lowest quintile for this indicator, showing a lower use of cephalosporins and quinolones compared to antibiotics as a whole. Figure


135 Figure 132 shows the percentage of cephalosporins and quinolones as a proportion of all items prescribed by each PCT for SW Essex and our ONS cluster PCTs. The use of cephalosporins and quinolones in SW Essex is below the England average, and in line with the SHA average. Figure 132 Figure 9.6 shows cephalosporins and quinolones prescriptions as a proportion of all antibiotic items prescribed by GP practices in Basildon for the last quarter for 2011/12. There are significant differences in rates of prescribing of these drugs between different GP practices, although the majority of practices are prescribing rates below both PCT and England averages. Figure 133 Figure 134 shows the percentage of statins that are prescribed as either pravastatin or simvastatin across SW Essex and our ONS Cluster PCTs. SW Essex has a smaller percentage of all statins prescribed that are pravastatin/simvastatin compared to regional and national percentages and a smaller percentage than all but three of our ONS cluster PCTs. However, this indicator will become less relevant as a marker of cost-effective prescribing once the cost of atorvastatin reduces following patent expiration of Lipitor. 135

136 Figure 134 Figure 134 shows that there are considerable differences in prescribing habits between practices within Basildon Summary / Conclusions Programme Budgeting spend across SWE on GMS/PMS and Pharmaceutical services is generally low compared to other PCTs and our ONS PCT cluster. The percentage of all lipid lowering drugs prescribed as ezetimibe and the percentage of cephalosporins and quinolones as a percentage of all antibacterial drugs are also relatively low compared with other PCTs in England and in line with regional averages. This suggests across SW Essex prescribing behaviour is of relatively high quality. There are however significant differences between GP practices Basildon in terms of prescribing behaviour which provides further scope for QIPP savings and quality improvements. Similarly overall prescribing of anti-biotics is high compared to England PCTs and warrants further investigation. 136
137 12. OLDER PEOPLE HEALTH AND WELLBEING As people get older, mobility becomes a common problem and many could become isolated and unable to access the services they need. It is estimated that the number of people aged 65+ living on their own, will increase by 44% by 2025 and are the highest user of statutory services, although locally hospital admissions, in people aged 75yrs and over, is amongst the lowest in England. Loneliness can damage both physical and mental health and can be further exacerbated by lack of transport and poor mobility. The growth in the ageing population will translate into additional pressure on all services, especially with an increase in neurological, circulatory, endocrinology, respiratory and mental health conditions. It is estimated that two thirds of people with dementia are looked after by unpaid carers. According to research conducted by the Royal Pharmaceutical Society of Great Britain (RPSGB), older people are taking a cocktail of medicines without fully understanding what they are or the side effects they are causing, with one in five patients not complying with their medication. Primary care practitioners and partner agencies need to encourage older people to have a regular Medicine Use Review (MUR). Figure 135 shows emergency hospital admissions in the over 75s in SW Essex compared to all PCTs in England. SW Essex is below the 3SD limit indicating that emergency admissions in people aged 75yrs and over is significantly lower than the national average. Figure 135. Funnel plot Emergency admissions rate per 1000K population in persons over

138 Figure 136 shows the percentage of the population providing unpaid care within Essex. The main areas of SW Essex providing unpaid care are within Basildon and Brentwood. The information shown here only accounts for the carers we know about and not the thousands of other unknown adults, young people and children who are caring for someone. Figure 136. Percentage of Population providing unpaid care 12.1 Summary / Conclusions Emergency admissions in people aged 75 years and over within SW Essex are significantly lower than the national average but with an ageing population this number could increase over time % and % of the population of many wards within SW Essex are providing unpaid care. This is worrying because it is likely that these carers may be suffering from ill health themselves. The growth in the ageing population will translate into additional pressure on all services, especially with an increase in neurological, circulatory, endocrinology, respiratory and mental health conditions. 138
Joint Strategic Needs Assessment: Health Profile for Lancashire North
 Joint Strategic Needs Assessment: Health Profile for Lancashire North Introduction This health profile forms part of a Joint Strategic Needs Assessment process for NHS Lancashire North CCG. Specifically
Of those with dementia have a formal diagnosis or are in contact with specialist services. Dementia prevalence for those aged 80+
 Dementia Ref HSCW 18 Why is it important? Dementia presents a significant and urgent challenge to health and social care in County Durham, in terms of both numbers of people affected and the costs associated
Locality Health Improvement Plan
 Locality Health Improvement Plan North Devon 2012/13 Public Health Annual Report 2011-12 The Northern Locality health improvement and tackling health inequalities plan is a mechanism for monitoring and
Healtheast CCG - developing an understanding of health and wellbeing needs. Public Health NHS Norfolk and Waveney Cluster and Norfolk County Council
 Healtheast CCG - developing an understanding of health and wellbeing needs Public Health NHS Norfolk and Waveney Cluster and Norfolk County Council Acknowledgements Norfolk County Council Children s Services
Commissioning for value focus pack
 Commissioning for value focus pack Clinical commissioning group: NHS MILTON KEYNES CCG Focus area: Cardiovascular disease (CVD) pathway Version 2 June 2014 Contents 1. Background and context About the
GOVERNING BODY REPORT
 GOVERNING BODY REPORT DATE OF MEETING: 20th September 2012 TITLE OF REPORT: KEY MESSAGES: NHS West Cheshire Clinical Commissioning Group has identified heart disease as one of its six strategic clinical
Summary of the Health Needs in Rugby Borough
 Rugby Borough Summary of the Health Needs in Rugby Borough Domain Indicator Rugby Borough 2010 Trend Warwickshire England Data Communities Children's and young people Adult's health and lifestyle Disease
2. Quality and Outcomes Framework: new NICE recommendations
 Proposed Changes to the GMS Contract 2013/14 1. GP pay and expenses uplift It is proposed GP pay and expenses is uplifted by 1.5%. This increased investment will allow for an average pay increase of up
Dianne Johnson / Lee Panter / Sarah McNulty
 Cardiovascular Disease (heart disease and stroke) READER INFORMATION Need Identified Lead Author Cardiovascular Disease Dianne Johnson / Lee Panter / Sarah McNulty Date completed 07/02/11 Director approved
NORTH EAST ESSEX. Joint Strategic Needs Assessment for Clinical Commissioning Group. October 2011
 Embracing better health for all NORTH EAST ESSEX Joint Strategic Needs Assessment for Clinical Commissioning Group October 2011 Public Health Team Vittoria Polito Krishna Ramkhelawon Natacha Bines 1 CONTENT
BOLTON GPFEDERATION. Farnworth/Kearsley NEIGHBOURHOOD PLAN
 BOLTON GPFEDERATION Farnworth/Kearsley NEIGHBOURHOOD PLAN Summary Highlights Taken as a neighbourhood, Farnworth/Kearsley typical age range population for Bolton but suffers from significantly lower life
Lincolnshire JSNA: Cancer
 What do we know? Summary Around one in three of us will develop cancer at some time in our lives according to our lifetime risk estimation (Sasieni PD, et al 2011). The 'lifetime risk of cancer' is an
OP- JSNA Factsheet 3: Mortality
 OP- JSNA Factsheet 3: Mortality Summary The death rate in Southwark has been reducing for the last seventeen years. The gap between Southwark and London and England has also narrowed greatly. In the last
GOVERNING BODY MEETING in Public 22 February 2017 Agenda Item 3.4
 GOVERNING BODY MEETING in Public 22 February 2017 Paper Title Purpose of paper Redesign of Services for Frail Older People in Eastern Cheshire To seek approval from Governing Body for the redesign of services
The National perspective Public Health England s vision, mission and priorities
 The National perspective Public Health England s vision, mission and priorities Dr Ann Hoskins Director Children, Young People and Families Public Health England May 2013 Mission Public Health England
Public Health Profile
 Eastern Wakefield Primary Care Trust Public Health Profile 2005/06 Introduction Eastern Wakefield Primary Care Trust () is situated within the West Yorkshire Strategic Health Authority Area. The PCT commissions
NHS North East Essex. Clinical Commissioning Group Profile Executive Summary. Essex Joint Strategic Needs Assessment.
 NHS North East Essex Clinical Commissioning Group Profile Executive Summary A product of the Essex Joint Strategic Needs Assessment Jo Broadbent, Consultant in Public Health Colin Seward, Public Health
ELR CCG Annual General Meeting. Tuesday 26 September 2017
 ELR CCG Annual General Meeting Tuesday 26 September 2017 1 Programme Welcome and introductions Responses to questions submitted today A patient and carer experience - Living with Dementia An introduction
The South Derbyshire Health and Wellbeing Plan
 The South Derbyshire and Wellbeing Plan 2013-16 1. Vision and Aim A healthier and more active lifestyle across all communities. (c. Our Sustainable Community Strategy for South Derbyshire 2009-2029) The
Item Number: 6 NHS VALE OF YORK CLINICAL COMMISSIONING GROUP GOVERNING BODY MEETING. Meeting Date: 7 November Report Author: Report Sponsor:
 Item Number: 6 NHS VALE OF YORK CLINICAL COMMISSIONING GROUP GOVERNING BODY MEETING Meeting Date: 7 November 2013 Report Sponsor: Dr Emma Broughton Clinical Lead for Primary Care Programme Report Author:
JSNA Stockport Digest Smoking. JSNA Digest Smoking. December JSNA Digest for Smoking
 JSNA Digest Smoking December 2007 JSNA Digest for Smoking 1 This digest aims to provide information on the key lifestyle issue of smoking; describing current patterns within Stockport and anticipated future
Diabetes. Ref HSCW 024
 Diabetes Ref HSCW 024 Why is it important? Diabetes is an increasingly common, life-long, progressive but largely preventable health condition affecting children and adults, causing a heavy burden on health
NATIONAL INSTITUTE FOR HEALTH AND CLINICAL EXCELLENCE
 NATIONAL INSTITUTE FOR HEALTH AND CLINICAL EXCELLENCE QUALITY AND OUTCOMES FRAMEWORK (QOF) INDICATOR DEVELOPMENT PROGRAMME Briefing paper QOF indicator area: Primary prevention of CVD Potential output:
Community network profile Herne Bay
 Community network profile Herne Bay November 2015 Produced by Faiza Khan: Public Health Consultant (Faiza.Khan@Kent.gov.uk) Wendy Jeffries: Public Health Specialist (Wendy.Jeffries@Kent.gov.uk) Del Herridge,
REPORT TO CLINICAL COMMISSIONING GROUP
 REPORT TO CLINICAL COMMISSIONING GROUP 12th December 2012 Agenda No. 6.2 Title of Document: Report Author/s: Lead Director/ Clinical Lead: Contact details: Commissioning Model for Dementia Care Dr Aryan
Cardiology The interface between Primary and Secondary Care
 Cardiology The interface between Primary and Secondary Care Dr A Daniels GP, Cardiff South East Wales Cardiac Network The view from secondary care Referral to treatment times targets Clinics are full of
Health & Wellbeing Strategy. Lorna Payne Group Director Adults & Health
 Health & Wellbeing Strategy Lorna Payne Group Director Adults & Health Statutory Duty Local authority and CCG, through HWB, joint duty under Health and Social Care Act 2012 to prepare a Health and Wellbeing
The new PH landscape Opportunities for collaboration
 The new PH landscape Opportunities for collaboration Dr Ann Hoskins Director Children, Young People & Families Health and Wellbeing Content Overview of new PH system PHE function and structure Challenges
Director of Public Health Annual Report Heywood, Middleton and Rochdale Primary Care Trust (HMRPCT)
") Director of Public Health Annual Report Heywood, Middleton and Rochdale Primary Care Trust (HMRPCT) June 2007 Baseline Assessment of Health Inequalities in the Borough CONTENTS CONTENTS page FOREWORD
Director of Public Health Annual Report Heywood, Middleton and Rochdale Primary Care Trust (HMRPCT) June 2007 Baseline Assessment of Health Inequalities in the Borough CONTENTS CONTENTS page FOREWORD
Optimising Hypertension Management Clair Huckerby Pharmaceutical Adviser- Medicines Optimisation Lead
 Optimising Hypertension Management Clair Huckerby Pharmaceutical Adviser- Medicines Optimisation Lead Pharmaceutical Public Health Team The Office of Public Health and Dudley CCG Dudley - doing things
Smoking in Pregnancy. Policy Context. Chris Tudor-Smith Health Improvement Division Welsh Government
 Smoking in Pregnancy Policy Context Chris Tudor-Smith Health Improvement Division Welsh Government Harms from smoking remain In Wales: Causes around 5,450 deaths each year in 35 year olds and over Major
Coronary heart disease and stroke
 4 Coronary heart disease and stroke Overview of cardiovascular disease Cardiovascular disease (CVD), also called circulatory disease, describes a group of diseases which are caused by blockage or rupture
Bridgwater. Practices in Commissioning Locality
 Locality profile Part of the SOMERSET JOINT STRATEGIC NEEDS ASSESSMENT Practices in Locality 2 3 4 5 6 7 8 9 10 11 12 13 14 15 16 17 Cannington Health Centre Cranleigh Gardens Medical Centre East Quay
Commissioning for Value: Where to Look January 2016
 OFFICIAL Commissioning for Value: Where to Look January 2016 Gateway ref: 04599 Contents Foreword: Professor Sir Bruce Keogh The RightCare programme: Wave one Supporting the Five Year Forward View Supporting
HEALTH NEEDS ASSESSMENT: DISEASES OF THE RESPIRATORY SYSTEM. A report assessing the respiratory health need of the population of Bolton
 EXECUTIVE SUMMARY HEALTH NEEDS ASSESSMENT: DISEASES OF THE RESPIRATORY SYSTEM January 2009 A report assessing the respiratory health need of the population of Bolton AUTHOR Mark Cook Public Health Intelligence
Joint Health and Wellbeing Strategy for Rochdale Borough
 Joint Health and Wellbeing Strategy for Rochdale Borough 2012 2015 Co-operating in Rochdale for Better Health & Wellbeing Contents 1. FOREWORD... 3 2. EXECUTIVE SUMMARY... 4 3. VISION AND WAYS OF WORKING...
Commissioning for Value Where to Look pack
 Commissioning for Value Where to Look pack Hertfordshire and West Essex - STP area December 2016 Neurological April 2016 Contents Introduction to your Where to Look pack Supporting the STP process NHS
HERTS VALLEYS CCG PALLIATIVE AND END OF LIFE CARE STRATEGY FOR ADULTS AND CHILDREN
 HERTS VALLEYS CCG PALLIATIVE AND END OF LIFE CARE STRATEGY FOR ADULTS AND CHILDREN 2016-2021 1 1. Introduction Herts Valleys Palliative and End of Life Care Strategy is guided by the End of Life Care Strategic
Commissioning for Value: Where to Look January 2016
 OFFICIAL Commissioning for Value: Where to Look January 2016 Gateway ref: 04599 Contents Foreword: Professor Sir Bruce Keogh The RightCare programme: Wave one Supporting the Five Year Forward View Supporting
PRIMARY CARE CO-COMMISSIONING COMMITTEE 8 SEPTEMBER 2015
 Part 1 Part 2 PRIMARY CARE CO-COMMISSIONING COMMITTEE 8 SEPTEMBER 2015 Title of Report Trafford Palliative care Quality Premium Scheme 2015/16 Purpose of the Report The purpose of the report is to detail
The links between physical health in mental health
 The links between physical health in mental health A holistic approach to managing mental and physical health is needed. Physical and mental health are inextricably linked 1 What is the problem? It is
Commissioning for Value: Where to Look January 2016
 OFFICIAL Commissioning for Value: Where to Look January 2016 Gateway ref: 04599 Contents Foreword: Professor Sir Bruce Keogh The RightCare programme: Wave one Supporting the Five Year Forward View Supporting
Commissioning for Value: Where to Look January 2016
 OFFICIAL Commissioning for Value: Where to Look January 2016 Gateway ref: 04599 Contents Foreword: Professor Sir Bruce Keogh The RightCare programme: Wave one Supporting the Five Year Forward View Supporting
National study. Closing the gap. Tackling cardiovascular disease and health inequalities by prescribing statins and stop smoking services
 National study Closing the gap Tackling cardiovascular disease and health inequalities by prescribing statins and stop smoking services September 2009 About the Care Quality Commission The Care Quality
Commissioning for Value: Where to Look January 2016
 OFFICIAL Commissioning for Value: Where to Look January 2016 Gateway ref: 04599 Contents Foreword: Professor Sir Bruce Keogh The RightCare programme: Wave one Supporting the Five Year Forward View Supporting
Commissioning for Value: Where to Look January 2016
 OFFICIAL Commissioning for Value: Where to Look January 2016 Gateway ref: 04599 Contents Foreword: Professor Sir Bruce Keogh The RightCare programme: Wave one Supporting the Five Year Forward View Supporting
Commissioning for Better Outcomes in COPD
 Commissioning for Better Outcomes in COPD Dr Matt Kearney Primary Care & Public Health Advisor Respiratory Programme, Department of Health General Practitioner, Runcorn November 2011 What are the Commissioning
POTENTIAL LINKAGES BETWEEN THE QUALITY AND OUTCOMES FRAMEWORK (QOF) AND THE NHS HEALTH CHECK
 AND THE NHS HEALTH CHECK") POTENTIAL LINKAGES BETWEEN THE QUALITY AND OUTCOMES FRAMEWORK (QOF) AND THE NHS HEALTH CHECK Author: CHARLOTTE SIMPSON, SPECIALTY REGISTAR PUBLIC HEALTH (ST3), CHESHIRE EAST COUNCIL/MERSEY DEANERY SUMMARY
POTENTIAL LINKAGES BETWEEN THE QUALITY AND OUTCOMES FRAMEWORK (QOF) AND THE NHS HEALTH CHECK Author: CHARLOTTE SIMPSON, SPECIALTY REGISTAR PUBLIC HEALTH (ST3), CHESHIRE EAST COUNCIL/MERSEY DEANERY SUMMARY
Commissioning for Value: Where to Look January 2016 NHS North East Hampshire and Farnham CCG. Gateway ref: 04599
 OFFICIAL Commissioning for Value: Where to Look January 2016 Gateway ref: 04599 Contents Foreword: Professor Sir Bruce Keogh The RightCare programme: Wave one Supporting the Five Year Forward View Supporting
Draft Falls Prevention Strategy
 Cheshire West & Chester Council Draft Falls Prevention Strategy 2017-2020 Visit: cheshirewestandchester.gov.uk Visit: cheshirewestandchester.gov.uk 02 Cheshire West and Chester Council Draft Falls Prevention
Commissioning for Value: Where to Look January 2016
 OFFICIAL Commissioning for Value: Where to Look January 2016 Gateway ref: 04599 Contents Foreword: Professor Sir Bruce Keogh The RightCare programme: Wave one Supporting the Five Year Forward View Supporting
Commissioning for Value: Where to Look January 2016
 OFFICIAL Commissioning for Value: Where to Look January 2016 Gateway ref: 04599 Contents Foreword: Professor Sir Bruce Keogh The RightCare programme: Wave one Supporting the Five Year Forward View Supporting
Commissioning for Value: Where to Look January 2016
 OFFICIAL Commissioning for Value: Where to Look January 2016 Gateway ref: 04599 Contents Foreword: Professor Sir Bruce Keogh The RightCare programme: Wave one Supporting the Five Year Forward View Supporting
Health and Community. Directorate Health Health and and Wellbeing Community in Halton
 Health and Community Directorate Health Health and and Wellbeing Community in Halton Directorate HeaHealth and Wellbeing in Halton Joint Strategic Needs Assessment for Halton 2008 Contents Tables... 5
Commissioning for Value: Where to Look January 2016
 OFFICIAL Commissioning for Value: Where to Look January 2016 Gateway ref: 04599 Contents Foreword: Professor Sir Bruce Keogh The RightCare programme: Wave one Supporting the Five Year Forward View Supporting
Commissioning for Value: Where to Look January 2016
 OFFICIAL Commissioning for Value: Where to Look January 2016 Gateway ref: 04599 Contents Foreword: Professor Sir Bruce Keogh The RightCare programme: Wave one Supporting the Five Year Forward View Supporting
Commissioning for Value: Where to Look January 2016
 OFFICIAL Commissioning for Value: Where to Look January 2016 Gateway ref: 04599 Contents Foreword: Professor Sir Bruce Keogh The RightCare programme: Wave one Supporting the Five Year Forward View Supporting
Commissioning for Value: Where to Look January 2016
 OFFICIAL Commissioning for Value: Where to Look January 2016 Gateway ref: 04599 Contents Foreword: Professor Sir Bruce Keogh The RightCare programme: Wave one Supporting the Five Year Forward View Supporting
Commissioning for Value: Where to Look January 2016
 OFFICIAL Commissioning for Value: Where to Look January 2016 Gateway ref: 04599 Contents Foreword: Professor Sir Bruce Keogh The RightCare programme: Wave one Supporting the Five Year Forward View Supporting
Commissioning for Value: Where to Look January 2016
 OFFICIAL Commissioning for Value: Where to Look January 2016 Gateway ref: 04599 Contents Foreword: Professor Sir Bruce Keogh The RightCare programme: Wave one Supporting the Five Year Forward View Supporting
Commissioning for Value: Where to Look January 2016
 OFFICIAL Commissioning for Value: Where to Look January 2016 Gateway ref: 04599 Contents Foreword: Professor Sir Bruce Keogh The RightCare programme: Wave one Supporting the Five Year Forward View Supporting
8. OLDER PEOPLE Falls
 8. OLDER PEOPLE 8.2.1 Falls Falls and the fear of falling can seriously impact on the quality of life of older people. In addition to physical injury, they can lead to social isolation, reductions in mobility
Estimated number of people with hypertension. Significantly higher than the. Proportion. diagnosed with. hypertension
 Hypertension profile Background Diagnosis and control of hypertension in * This profile compares with data for, authorities in the South East region and the Office for National Statistics (ONS) group of
Our Plans for Improving Your Health
 Our Plans for Improving Your Health Lewisham Clinical Commissioning Group Our Plans for Improving Your Health This summary sets out how Lewisham GPs are planning to use available NHS resources to make
14. HEALTHY EATING INTRODUCTION
 14. HEALTHY EATING INTRODUCTION A well-balanced diet is important for good health and involves consuming a wide range of foods, including fruit and vegetables, starchy whole grains, dairy products and
Adult Obesity. (also see Childhood Obesity) Headlines. Why is this important? Story for Leeds
 Headlines. Why is this important? Story for Leeds") Adult Obesity (also see Childhood Obesity) Headlines raise awareness of the scale, complexity and evidence base in relation to this issue, including promotion of the Change4Life campaign contribute to
Adult Obesity (also see Childhood Obesity) Headlines raise awareness of the scale, complexity and evidence base in relation to this issue, including promotion of the Change4Life campaign contribute to
Commissioning for Value: Where to Look January 2016
 OFFICIAL Commissioning for Value: Where to Look January 2016 Gateway ref: 04599 Contents Foreword: Professor Sir Bruce Keogh The RightCare programme: Wave one Supporting the Five Year Forward View Supporting
Commissioning for Value: Where to Look January 2016
 OFFICIAL Commissioning for Value: Where to Look January 2016 Gateway ref: 04599 Contents Foreword: Professor Sir Bruce Keogh The RightCare programme: Wave one Supporting the Five Year Forward View Supporting
Commissioning for Value: Where to Look January 2016
 OFFICIAL Commissioning for Value: Where to Look January 2016 Gateway ref: 04599 Contents Foreword: Professor Sir Bruce Keogh The RightCare programme: Wave one Supporting the Five Year Forward View Supporting
Commissioning for Value: Where to Look January 2016
 OFFICIAL Commissioning for Value: Where to Look January 2016 Gateway ref: 04599 Contents Foreword: Professor Sir Bruce Keogh The RightCare programme: Wave one Supporting the Five Year Forward View Supporting
Commissioning for Value: Where to Look January 2016
 OFFICIAL Commissioning for Value: Where to Look January 2016 Gateway ref: 04599 Contents Foreword: Professor Sir Bruce Keogh The RightCare programme: Wave one Supporting the Five Year Forward View Supporting
Commissioning for Value: Where to Look January 2016
 OFFICIAL Commissioning for Value: Where to Look January 2016 Gateway ref: 04599 Contents Foreword: Professor Sir Bruce Keogh The RightCare programme: Wave one Supporting the Five Year Forward View Supporting
Commissioning for Value: Where to Look January 2016
 OFFICIAL Commissioning for Value: Where to Look January 2016 Gateway ref: 04599 Contents Foreword: Professor Sir Bruce Keogh The RightCare programme: Wave one Supporting the Five Year Forward View Supporting
Commissioning for Value: Where to Look January 2016
 OFFICIAL Commissioning for Value: Where to Look January 2016 Gateway ref: 04599 Contents Foreword: Professor Sir Bruce Keogh The RightCare programme: Wave one Supporting the Five Year Forward View Supporting
Commissioning for Value: Where to Look January 2016
 OFFICIAL Commissioning for Value: Where to Look January 2016 Gateway ref: 04599 Contents Foreword: Professor Sir Bruce Keogh The RightCare programme: Wave one Supporting the Five Year Forward View Supporting
Commissioning for Value: Where to Look January 2016
 OFFICIAL Commissioning for Value: Where to Look January 2016 Gateway ref: 04599 Contents Foreword: Professor Sir Bruce Keogh The RightCare programme: Wave one Supporting the Five Year Forward View Supporting
Hull and East Riding. Chronic Obstructive Pulmonary. Disease (COPD) Equity Audit
 Equity Audit") Hull and East Riding Chronic Obstructive Pulmonary Disease (COPD) Equity Audit December 2010 Robert Sheikh Iddenden, Andrew Taylor, Jenny Walker Hull and East Riding Chronic Obstructive Pulmonary Disease
Hull and East Riding Chronic Obstructive Pulmonary Disease (COPD) Equity Audit December 2010 Robert Sheikh Iddenden, Andrew Taylor, Jenny Walker Hull and East Riding Chronic Obstructive Pulmonary Disease
Commissioning for Value: Where to Look January 2016
 OFFICIAL Commissioning for Value: Where to Look January 2016 Gateway ref: 04599 Contents Foreword: Professor Sir Bruce Keogh The RightCare programme: Wave one Supporting the Five Year Forward View Supporting
Public Health Observatories: An introduction to the London Health Observatory in England and recent developments in Alberta. Learning objectives
 Public Health Observatories: An introduction to the London Health Observatory in England and recent developments in Alberta Justine Fitzpatrick 19 th February 2008- Public Health WORKS Speaker Series Learning
Commissioning for Value: Where to Look January 2016
 OFFICIAL Commissioning for Value: Where to Look January 2016 Gateway ref: 04599 Contents Foreword: Professor Sir Bruce Keogh The RightCare programme: Wave one Supporting the Five Year Forward View Supporting
ACTIVE TAMESIDE STRATEGY, GROWTH AND DEVELOPMENT
 Report to: HEALTH AND WELLBEING BOARD Date: 19 January 2017 Board Member / Reporting Officer: Subject: Report Summary: Recommendations: Links to Health and Wellbeing Strategy: Policy Implications: Financial
Getting serious about preventing cardiovascular disease
 Getting serious about preventing cardiovascular disease Southwark s Experience Professor Kevin Fenton Director of Health and Wellbeing, London Borough of Southwark February 2018 Twitter: @ProfKevinFenton
Commissioning for Value: Where to Look January 2016
 OFFICIAL Commissioning for Value: Where to Look January 2016 Gateway ref: 04599 Contents Foreword: Professor Sir Bruce Keogh The RightCare programme: Wave one Supporting the Five Year Forward View Supporting
Commissioning for Value Where to Look pack
 Commissioning for Value Where to Look pack Leicester, Leicestershire and Rutland - STP area December 2016 Neurological April 2016 Contents Introduction to your Where to Look pack Supporting the STP process
Commissioning for Value Where to Look pack
 Commissioning for Value Where to Look pack Nottinghamshire - STP area December 2016 Neurological April 2016 Contents Introduction to your Where to Look pack Supporting the STP process NHS RightCare and
Cardiovascular disease profile
 Background This chapter of the Cardiovascular disease profiles focuses on risk factors for cardiovascular disease and is produced by the National Cardiovascular Intelligence Network (NCVIN). The profiles
Bedfordshire, Luton and Milton Keynes (BLMK) Sustainability and Transformation Partnership (STP) Central Brief: October 2017
 Sustainability and Transformation Partnership (STP) Central Brief: October 2017") Bedfordshire, Luton and Milton Keynes (BLMK) Sustainability and Transformation Partnership (STP) Central Brief: October 2017 Issue date: 2 November 2017 News Work progresses on proposed merger of Bedfordshire
Bedfordshire, Luton and Milton Keynes (BLMK) Sustainability and Transformation Partnership (STP) Central Brief: October 2017 Issue date: 2 November 2017 News Work progresses on proposed merger of Bedfordshire
JSNA: LIVING WELL POPULATION
 JSNA: LIVING WELL POPULATION In the Census 2011 219,300 Bolton residents (79.3%) reported their health as being very good or good. However, of the 116,370 households in Bolton there are 33,300 (28.7%)
Commissioning for Value: Where to Look January 2016
 OFFICIAL Commissioning for Value: Where to Look January 2016 Gateway ref: 04599 Contents Foreword: Professor Sir Bruce Keogh The RightCare programme: Wave one Supporting the Five Year Forward View Supporting
Commissioning for Value Where to Look pack
 Commissioning for Value Where to Look pack Milton Keynes, Bedfordshire and Luton - STP area December 2016 Neurological April 2016 Contents Introduction to your Where to Look pack Supporting the STP process
NHS TRAFFORD CLINICAL COMMISSIONING GROUP GOVERNING BODY
 Agenda Item No: Part 1 X Part 2 NHS TRAFFORD CLINICAL COMMISSIONING GROUP GOVERNING BODY 25.4.17 Title of Report Purpose of the Report Public Health Update This report provides an update to the Clinical
Commissioning for Value: Where to Look January 2016
 OFFICIAL Commissioning for Value: Where to Look January 2016 Gateway ref: 04599 Contents Foreword: Professor Sir Bruce Keogh The RightCare programme: Wave one Supporting the Five Year Forward View Supporting
Commissioning for Value: Where to Look January 2016
 OFFICIAL Commissioning for Value: Where to Look January 2016 Gateway ref: 04599 Contents Foreword: Professor Sir Bruce Keogh The RightCare programme: Wave one Supporting the Five Year Forward View Supporting
Commissioning for Value: Where to Look January 2016
 OFFICIAL Commissioning for Value: Where to Look January 2016 Gateway ref: 04599 Contents Foreword: Professor Sir Bruce Keogh The RightCare programme: Wave one Supporting the Five Year Forward View Supporting
Commissioning for Value: Where to Look January 2016
 OFFICIAL Commissioning for Value: Where to Look January 2016 Gateway ref: 04599 Contents Foreword: Professor Sir Bruce Keogh The RightCare programme: Wave one Supporting the Five Year Forward View Supporting
Commissioning for Value: Where to Look January 2016
 OFFICIAL Commissioning for Value: Where to Look January 2016 Gateway ref: 04599 Contents Foreword: Professor Sir Bruce Keogh The RightCare programme: Wave one Supporting the Five Year Forward View Supporting
Commissioning for Value: Where to Look January 2016
 OFFICIAL Commissioning for Value: Where to Look January 2016 Gateway ref: 04599 Contents Foreword: Professor Sir Bruce Keogh The RightCare programme: Wave one Supporting the Five Year Forward View Supporting
Commissioning for Value: Where to Look January 2016
 OFFICIAL Commissioning for Value: Where to Look January 2016 Gateway ref: 04599 Contents Foreword: Professor Sir Bruce Keogh The RightCare programme: Wave one Supporting the Five Year Forward View Supporting
Costing report: Lipid modification Implementing the NICE guideline on lipid modification (CG181)
") Putting NICE guidance into practice Costing report: Lipid modification Implementing the NICE guideline on lipid modification (CG181) Published: July 2014 This costing report accompanies Lipid modification:
Putting NICE guidance into practice Costing report: Lipid modification Implementing the NICE guideline on lipid modification (CG181) Published: July 2014 This costing report accompanies Lipid modification:
Community Needs Analysis Report
 Grampians Medicare Local Community Needs Analysis Report Summary October 2013 2 Contents Introduction 3 Snapshot of results 4 Stakeholder feedback 5 Health status of residents 6 Health behaviour of residents