Administration. September 1, 2003
|
|
|
- Jessie Burns
- 6 years ago
- Views:
Transcription
1
2 Administration 300 North San Antonio Road Santa Barbara, CA / FAX 805/ Roger Heroux, MPA Director Peggy Langle, Deputy Director Michele Mickiewicz, MPH Deputy Director Jane Overbaugh Deputy Director Elliot Schulman, MD, MPH Health Officer/Medical Director September 1, 2003 Dear Community Members: I am pleased to be able present you with the findings of our most recent health assessment report with data from the 2001 California Health Interview Survey (CHIS). Interviews were conducted in over 1,000 households to give us a snapshot of the health of county residents. Assessing the community s health has long been a central focus of public health. In recent years, our work to protect and ensure the public s health has been broadened to include new threats such as bioterrorism and emerging communicable diseases like West Nile Virus and SARS. As we move through the 21 st century, the Public Health Department will continue to play a vital role in assessing and protecting the health of the residents of Santa Barbara County. Sound data on health status and health needs is critical to plan for our future and ensure that appropriate services are available. This report presents the most recent information on the health of residents of Santa Barbara County. I am confident that it will be an invaluable tool for those of us who work in the health field in our efforts to create a healthier Santa Barbara County. Sincerely, Roger E. Heroux, MPA, Director Public Health Department

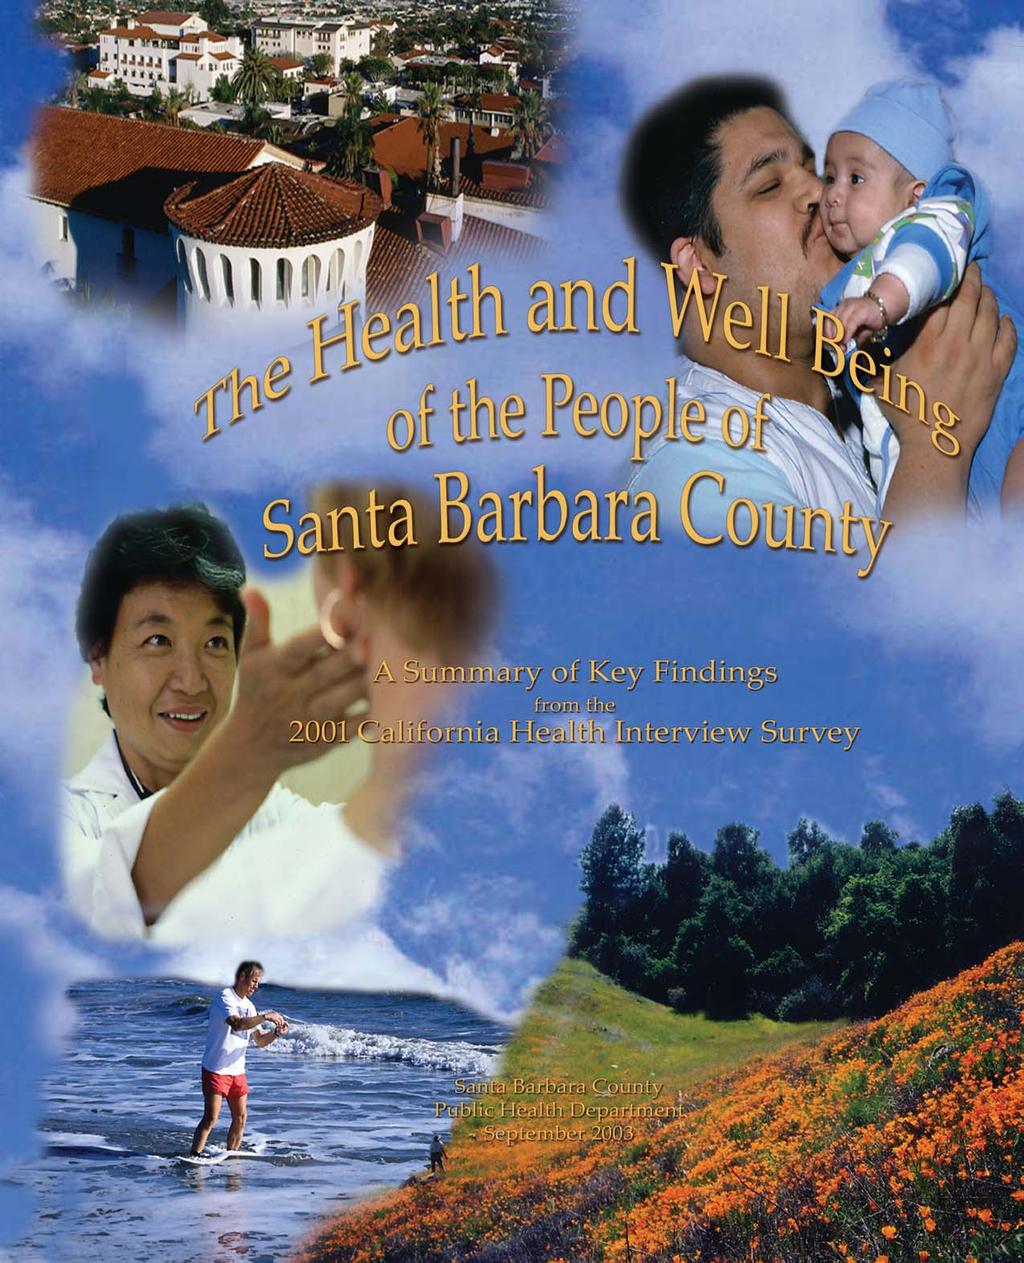
3 The Health and Well-Being of the People of Santa Barbara County A Summary of Key Findings from the 2001 California Health Interview Survey Santa Barbara County Public Health Department September 2003

4 Contents Introduction and Project Description...1 Perceived Health Status...5 Access to Care...6 Dental Health...8 Lifestyle Risk Factors...9 Exercise, Nutrition, and Bodyweight...9 Alcohol, Tobacco, and Other Drugs...12 STDs and Births to Teens...16 Mental Health...17 Keeping Healthy...18 Chronic Conditions...20 Diabetes...20 Asthma...20 Injury Prevention...21 Conclusion: Call to Action...23 Spotlight on Public Health Department Programs...23 Appendix A: Methodology of the 2001 Survey...29 Appendix B: List of the 2001 Survey Topics...30 Acknowledgements...31
5 Introduction Surveys on the health of Santa Barbara County residents were conducted in 1999 and in In 2000, a report entitled The Health and Well-Being of the People of Santa Barbara County was produced with the results from the 1999 Community Health Assessment Survey (CHAS 1 ). In 2001, the California Health Interview Survey (CHIS) was conducted in all California counties by the University of California, Los Angeles (UCLA) Center for Health Policy Research. This report highlights the key findings of the CHIS survey and offers comparisons to the CHAS findings where appropriate. Improving the Health of our County In the past, when people thought about the quality of health in their community, they associated it with a largely disease-free population and the availability of high tech medical facilities. More recently, however, people have broadened their view of health to incorporate additional elements including a focus on preventing illness, disease, and injury rather than relying primarily on treatment. Most health professionals now recognize that significant individual and community-wide health improvements can best occur through collaborative relationships between individuals and a wide range of organizations: public health agencies, social service agencies, hospitals, clinics, volunteer programs, business and industry, and grassroots efforts. Locally, a variety of efforts to build coalitions aimed at community-wide health improvement has occurred over the past few years. These efforts have emphasized commitment from all partners to work together for the good of the community. In addition, they have incorporated a much broader definition of health including physical, mental and social well-being. The Santa Barbara County Public Health Department is hopeful that we all can continue to work together to develop a strategy for community health improvement by: utilizing the data and information contained within this report identifying common health needs that cut across our communities working with the broadest possible coalition of community representatives to plan and implement specific strategies designed to enhance the health of our region and its communities and residents; and evaluating and documenting the impact of these health improvement strategies The information presented in this report is only the first step in actively enhancing our county's health and well-being. This is our invitation for you to join us as partners, enhance our collective understanding of our communities and their unique and common health needs and help develop the solutions we can offer together. 1 Description of the 1999 Survey - Community Health Assessment Survey (CHAS) The Community Health Assessment Survey collected data on the county's health through telephone interviews in both English and Spanish with a representative sample of county residents over 1000 adults and 400 children. The survey was conducted by Information Transfer Systems, Inc. of Ann Arbor, Michigan, a nationally prominent community health assessment firm. The questionnaire addressed important topics such as physical and mental health status, health insurance, nutrition and diet, injury prevention, and other factors related to health within our county. 1

6 Description of the 2001 Survey California Health Interview Survey The California Health Interview Survey (CHIS), a new source of health information for California, is the largest state health survey conducted in the United States. The 2001 CHIS collected information from 55,428 households, randomly selected from every county in the state. The CHIS 2001 sample and questionnaires in six languages were designed so that the results would be most inclusive of the State's ethnically diverse population. With a focus on public health and access to health care, CHIS 2001 provides statewide information for California's overall population and local-level information for counties for purposes of planning and for making comparisons. The CHIS project interviewed 55,428 adults (aged 18 years and older), 5,801 adolescents (aged years) and 12,592 parents about a child (aged less than 12 years). In Santa Barbara County, information was collected from 1,001 adults, 93 adolescents and 223 children. Survey Methodology A random-digit dialing telephone approach was used which allowed non-listed numbers to be included in the sample. In order to collect meaningful information for key population subgroups such as Hispanics and farm workers, the plan disproportionately sampled residents in the Santa Maria and Guadalupe areas. One adult was randomly selected to be interviewed from among all adults living in the contacted household. Only the selected person was eligible for the interview. In households where there were children associated with the selected adult, one adolescent (aged 12-17) was interviewed and information was obtained for one child under age 12 by interviewing the adult most knowledgeable about that child's health care. Both the child and adolescent were each randomly chosen if more than one child or adolescent resided in the household and with whom the selected adult was "associated" as either a parent or guardian. The overall response rate for the survey was 62.1% (this compares to the 65% response rate for the survey conducted in 1999). The county adult response rate was 41.1%, adolescent rate was 26.0% and the child rate was 66.8%. For a more detailed description of the CHIS survey methodology, please see Appendix A. 2
7 Comparing the Survey Samples to the County Population As with the 1999 survey, the CHIS sample was weighted to make it comparable to the Santa Barbara County population as a whole on key demographic factors. The following table compares the weighted survey samples from the 1999 CHAS and 2001 CHIS survey to 2000 census data for Santa Barbara County. SB County 2000 Census 1999 Survey (CHAS) Weighted Countywide 2001 Survey (CHIS) Weighted Countywide Gender Male 50.0% 49.8% 49.7% Female 50.0% 50.2% 50.3% Race/ Ethnicity White, non- Hispanic 56.9% 61.3% 62.6% * 57.5% Hispanic 34.2% Non-White 38.7% 29.3% * 35.2% Other 8.9% Education 8.1% * 7.4% < High School 20.8% 17.5% 16.8% High School Grad 49.8% 23.4% 54.4% Some College/ College Grad 29.4% % Age % 18.6% 14.9% % 24.2% 12.8% % 18.9% 15.1% % 12.5% 11.2% % 10.1% 7.8% % 9.0% 6.8% % 6.8% 5.7% Income household < $10, % 8.6% 11.0%(< $10,000) $10,00-$24, % 16.9% 14.3% ($10,001-$20,000) $25,000-$34, % 23.7% 34.5% ($20,001 $50,000) $35,000-$49, % 15.7% $50, % 35.1% 40.2% (>50,001 and greater) * UCLA definition of race/ethnicity (CTPR) Department of Finance definition of race/ethnicity 3

8 Understanding this Report Unless otherwise specified, the survey findings reported here refer to the 2001 CHIS survey. In many charts, comparisons are made to the California population and findings from the 1999 CHAS survey. Additional comparison data for the United States comes from a national survey called the Behavioral Risk Factor Surveillance System (BRFSS). For non survey-related information, the California Department of Health Services publication, County Health Status Profiles 2002, and the web pages of the federal Centers for Disease Control and Prevention (CDC) were consulted. To help interpret the findings, comparisons are also made to Healthy People 2010 objectives. Healthy People 2010 is the national prevention initiative that identifies opportunities to improve the health of all Americans by putting forth health targets for the nation. Where possible, we measure our findings against these national Healthy People 2010 goals. A list of survey topics for the 2001 CHIS survey can be found in Appendix B. Findings Are Encouraging With Opportunities for Improvement As in the 1999 survey, the survey results from 2001 show the overall health status of Santa Barbara County residents is exceptionally high, compared to other communities, and in many cases, the state and the nation. Some of the key bright spots based on the results of the survey include: Only 17% of adults report they smoke cigarettes. Over 86% of women over age 40 have had a mammogram. 76% of children aged 6-11 always wear a safety helmet when riding a bicycle. There are, however, substantial opportunities for health status and risk factor improvements that cut across all population subgroups within the county. Areas of concern include: Across all Santa Barbara County residents, 21% of adults (aged 18-65) and 16% of youth (aged 0-17) have no health care coverage. Almost 42% of adults and 29% of children (aged 2-11) reported no dental care coverage. 54% of adults and 11% of youth (aged 12-17) are overweight or obese. 45% of adults say that they had not engaged in any vigorous physical activities (activities that cause heavy breathing or increased heart rate) in the previous month. 11% of adolescents say that they had not engaged in any vigorous physical activities (activities that cause heavy breathing or increased heart rate) in the previous week. Almost half of adults do not get the recommended 5 servings of fruits and vegetables each day. 48% of drinking young adults (aged 18 to 29) reported they had engaged in binge drinking at least once in the past month. 15% of adolescents (aged 12 to 17) reported that they had ridden in a car driven by someone who had consumed alcohol. Only 24% of adolescents (aged 12-17) reported that they always wear a safety helmet when riding a bicycle. 4
9 Perceived Health Status One of the first questions asked in both the 1999 and 2001 survey was "Would you say that in general your health is excellent, very good, good, fair, or poor?" In 2001, 15% of surveyed Santa Barbara County residents described their health in general as fair or poor. This is a comparable finding to all of California, where approximately 16% of residents described their health as fair or poor. Nationwide in 2001, 14% of all respondents rated their health status as fair or poor. Perceived Health Status General Health Status California General Health Status Santa Barbara Fair 13% Poor 3% Excellent 25% Fair 13% Poor 2% Excellent 26% Good 29% Good 29% Very Good 30% Very Good 30% Hispanic adult residents of Santa Barbara County were significantly more likely to rate their general health as fair or poor, with 33% (26% in 1999) reporting they felt their general health was fair or poor compared to about 13% (8% in 1999) for non-hispanic respondents. Summary: Perceived Health Status About 15% of Santa Barbara County residents described their health in general as fair or poor. This is about the same as for the state as a whole (16%). Hispanic adults were significantly more likely to rate their general health as fair or poor than non- Hispanic adults (33% and 13% respectively). 5
10 Access to Care Santa Barbara County has a variety of high quality health and medical care providers in both the private and public sector to address a broad-range of health needs within our communities. Our public health services, social services, mental health services, medical facilities and communitybased health organizations are well-regarded. Unfortunately, not all of our residents can access care within this system. Lack of insurance continues to be a major determinant of access to needed health services. Nationwide in 2001, only 13% reported that they lacked health insurance. In our county, about 1 in 5 respondents under age 65 reported they had no health care coverage in both the 1999 and 2000 survey. Among county Hispanics the percentage was higher with 38% of those under age 65 having no health care coverage. In comparison, the percent of respondents under age 65 in California who reported no health care coverage was 16% in The Healthy People 2010 Objective for the nation is that no children and adults under age 65 will lack health care coverage. People with no health care coverage are much less likely to get preventive care and more likely to delay seeking care when they are ill. Uninsured patients are less than half as likely to have had any recent medical visits. Those with health insurance coverage may still find cost a barrier. The cost of needed medications is often an insurmountable barrier for people with limited economic means. Even those who are fairly well off financially can be impacted by the need for costly medications. Just over 9% of insured adults reported that their health insurance did not cover the cost of prescription medications (down from 13% in 1999). Fortunately, this proportion was lower in the county s youth (aged 0-17) with 3% not being covered for medications under their health plan. Respondents were asked what the main reason for delaying or not receiving the medical care that they felt they needed during the last 12 months. Cost was the main factor for 16% of adults and 20% of children aged 11 years and younger. No Health Insurance Santa Barbara County vs. California and % 20.8.% 18.1% % SB County California HP 2010 objective 0% 6

11 Cost Delayed/Prevented Receipt of Care Santa Barbara County % 15.5% Cost was the main factor for delaying or not receiving medical care for 16% of adults and 20% of children. 5 0 Adults Children An important aspect of health care access is whether individuals have a source of care that they usually go to if they are sick or need advice about their health. In 2001, 13% of adults (down from 25% in 1999) and 6% of youth under age 18 (down from 13%) did not have a continuing source for medical care. The Healthy People 2010 national goal is for 4% or less of all adults and 3% or less of our nation s children to lack a regular medical care source. Summary: Access to Care About 1 in 5 Santa Barbara County adults and children have no health insurance. Health insurance doesn't cover the cost of prescription medications for over 9% of insured adults and 3% of the youth (aged 0-17 years). Cost/lack of insurance caused a delay or prevented care deemed needed for 16% of adults, and 20% of children (aged 0-11 years). 13% of adults and 6% of youth do not have a regular source of medical care. 7
12 Dental Health Dental Health has been consistently identified in local needs assessments as a major unmet need in Santa Barbara County. This preventable health problem begins early: 17% of 2- to 4-year-olds, 52% of 8-year-olds, and 78% of 17-year-olds nationally already have tooth decay. Among low-income children, almost 50% of tooth decay is untreated. This can lead to pain, dysfunction, poor appearance, and low bodyweight problems that greatly reduce a child s capacity to succeed. While significant improvements have been made in preventing and controlling dental cavities and gum disease during the past two decades, many in Santa Barbara County have been left behind. We know that people with no dental care coverage are less likely to get preventive dental care and treatment. Across the county, almost 42% of adults and 29% of children (aged 2-11) reported no dental care coverage. This rate was even higher in the Hispanic community with almost 60% of Hispanic adults and 37% of Hispanic children (aged 2-11) reporting no dental care coverage. Adults also have serious oral health problems nationally. Almost 1 in 3 adults have untreated tooth decay. More than 25% of adults older than 65 years have lost all of their teeth because of tooth decay or gum disease. Each year, about 30,000 cases of oral and throat cancer are diagnosed, and more than 8,000 people die of these diseases. No Dental Insurance by Race/Ethnicity and Age Santa Barbara County % 36.6% 36.2% 22.5 Children Adults Hispanic residents of all ages are more likely not to have dental insurance. Non-Hispanic Hispanic In 1999, almost 25% of adults and 8% of children reported untreated dental problems and 30% of adults and 27% of children had not had a routine dental check-up for more than a year. This was similar to the findings in 2001, where just under 29% of adults, 22% of teens (aged 12-17) and 28% of children (aged 2-11 years) had not seen a dental professional in over a year. Summary: Dental Health 42% of adults and 29% of children (aged 2-11) in Santa Barbara County have no dental insurance. Among Hispanic residents, 60% of adults and 37% of children (aged 2-11) reported having no dental coverage. Almost 29% of adults, 22% adolescents, and 28% of children had not been to the dental office in over a year. 8
13 Lifestyle Risk Factors Many preventable health problems including about half of all premature deaths are believed to be caused by the items in the table below: Causes of Death in the United States, Actual, 1990 (as percentages of total deaths) Tobacco use 19% Poor diet/lack of exercise 14% Alcohol use 5% Infectious agents 4% Pollutants/toxins 3% Firearms 2% Risky sexual behavior 1% Motor vehicle crashes 1% Illicit drug use 1% McGinnis JM, Foege WH. Actual causes of death in the United States. JAMA 1993; 270: There is ample medical evidence that lack of exercise, poor nutrition, and excess body weight negatively affect the health of individuals throughout their lives. Such factors are known to contribute to cardiovascular disease, diabetes, cancer, and osteoporosis, and may be related to longevity. As such, they contribute to some of the leading causes of death of our adults. When positive health habits are introduced and adopted at an early age, there is a greater chance that these habits will be continued into adulthood. This is particularly important because exercise habits, nutrition practices, and weight patterns prove to be extremely difficult for most adults to change. Both the 1999 and 2001 surveys measured aspects of each of these lifestyle risk factors. They tell us that overall, adults and children in Santa Barbara County do not exercise enough, their diets need improvement, and a substantial proportion are Summary: Exercise overweight. By improving our personal health behaviors and pursuing a healthier lifestyle, we can increase the potential to address the fundamental causes of health problems. Exercise In the 1999 survey, 46% of county adults reported that they did not get as much physical activity or exercise as they should. Almost a quarter of adults reported that they never did any vigorous activities that caused heavy breathing or increased their heart rate for at least 20 minutes. In 2001, 45% of adults surveyed reported that they had not engaged in vigorous activities for at least 10 minutes in the last 30 days and 11% of all adolescents (aged 12-17) surveyed reported that they had not undertaken vigorous activity for at least 20 minutes in the last seven days. 45% of adults reported that they had not engaged in vigorous physical activity (activities that cause heavy breathing or increased heart rate) for at least 10 minutes in the last month. 11% of adolescents reported that they had not engaged in vigorous physical activity (activities that cause heavy breathing or increased heart rate) for at least 20 minutes in the last week. 9

14 Nutrition Over the past 20 years, research has provided substantial evidence concerning the value of a balanced diet that includes eating five servings daily of fruits and vegetables. In 2001, 51% of adults reported that on average they consumed the recommended number of servings. For some residents, limited financial resources impact the ability to provide food. Data for Santa Barbara County from the 2001 CHIS survey indicate that: More than 5% of Santa Barbara County adults reported that they often could not afford balanced meals in the last 12 months. Just under 2% of adults in households at or below the 300% of poverty level reported that they receive food stamps. Almost 4% of adults whose household income was at or below 300% of poverty level were receiving WIC services (women, infant and children nutrition program). Overall, 9% of children (aged 0-11) receive food stamps and 26% (aged 0-5) are in the WIC program. Almost 9% of adults reported that they were food insecure or unable to afford enough food in the past 12 months. Summary: Nutrition Almost half of adults do not consume the recommended 5 servings of fruits and vegetables each day. Over 5% of adults reported that often in the last 12 months they could not afford balanced meals. 10
15 Bodyweight Nationally, poor diet and physical inactivity lead to 300,000 deaths each year second only to tobacco use. People who are overweight or obese increase their risk of heart disease, diabetes, high blood pressure, arthritis-related disabilities, and some cancers. Not getting an adequate amount of exercise is associated with needing more medication, visiting a physician more often, and being hospitalized more often. Many people think a much smaller percentage of people in Santa Barbara County have weight problems than people in the rest of the United States, but that is not the case. In 2001, 54% of Santa Barbara County adults were overweight or obese while in the US overall 58% were overweight or obese. The percent of overweight adults in Santa Barbara County is about the same as for California overall. The Healthy People 2010 objective for the nation is for not more than 40% of adults to be overweight or obese. Adult Bodyweight Santa Barbara County and % 51.0% 46.1% 44.3% 2.9% 1.8% Underweight Normal Overweight/obese When we look at exercise, nutrition, and obesity in our children, the picture is not very different from that found for adults: 11% of our adolescents (aged 12-17) are overweight or obese based on growth chart percentiles for their age and gender. Clearly we can do a lot to improve these lifestyle factors that are so closely linked to our health status for both adults and children % Adults Bodyweight Adults vs. Adolescents Santa Barbara County % 10.8% 89.2% Adolescents Overweight or Obese Not Overweight or Obese Summary: Bodyweight 54% of adults, 11% of adolescents are overweight or obese. Almost 54% of adults, 11% of adolescents (aged 12-17) in SB County are overweight or obese. Comparing by gender, 63% of adult males and 44% of adult females are overweight or obese. 11


16 Alcohol Use As in the United States and California, our communities are significantly affected by the use and abuse of alcohol and drugs. Not everyone chooses to drink alcohol, and of those who do, most limit their intake to amounts that produce no serious health or social consequences. Some adults, however, consume alcohol in quantities and frequencies that put them and others at risk for serious health consequences. Alcoholism and alcohol abuse are responsible for increased risks of heart disease, cancer, cirrhosis of the liver and suicide. Domestic and violent crime, lost time and productivity in the work place and drunk driving all are affected by alcohol abuse. In Santa Barbara County, about 65% of adults report they consumed alcohol in the past month. This is somewhat more than the percentage reported for California as a whole (59%). In Santa Barbara County, about 26% of adults that had alcohol in the previous month consumed 3 or more alcoholic drinks per day. Binge Drinking An area of concern for alcohol consumption is the extent of "binge drinking". Individuals are considered binge drinkers if they consumed five or more drinks on a single occasion, one or more times during the past month. In Santa Barbara County, 27% of adult respondents who drink alcohol were categorized as binge drinkers according to this definition (up from 21% in 1999). This rate is about the same as for California overall where 26% of adults reported binge drinking. For the nation as a whole the percentage was 15%. Looking at binge drinking by gender, 37% of drinking men had at least one such binge drinking experience in the prior month (up from 31% in 1999), compared to 14% of drinking women (up from 10% in 1999). It is also important to note younger adults (18-29 years) who drink alcohol reported the highest rates of binge drinking (48%) compared to drinking adults aged 30 and older (18%). Almost everybody is concerned at some level with the risks posed by drivers who are under the influence of alcohol. In 2001, almost 15% of adolescents admitted having ridden in a car with a driver that has consumed alcohol. Without a doubt, these figures underestimate the magnitude of this problem. 12
17 % Male Binge Drinking in Past Month by Age Santa Barbara County and % 45.6% 61.2% 33.6% 29.3% 18.7% 12.4% Binge drinking was highest among those legally underage for consuming alcohol, aged Female Binge Drinking in Past Month by Age Santa Barbara County and % % 18.2% 18.3% 14.6% % 2% 2.4% Summary: Alcohol Use About 65% of adults in the county reported they had consumed alcohol in the past month. About 26% of adults reported consuming 3 or more drinks a day on average. Overall, 27% of adults reported they had at least one episode of binge drinking (5 or more drinks on one occasion) in the past month. 13
18 Tobacco Use The use of tobacco, in all its forms, has been shown to be the primary cause or contributing factor in the incidence of many disabling and potentially fatal disorders, including cancer, heart disease, high blood pressure, stroke, circulatory problems and emphysema. Each year, 440,000 people die of diseases caused by smoking or another form of tobacco use that s about 20% of all deaths in the United States. Pregnant women who smoke are more likely than non-pregnant women to have spontaneous abortions. They are also more likely to have low birth-weight babies; low birth weight is linked to many infant health disorders % 20.5% Adult Cigarette Smokers Santa Barbara County and % 26.5% 22.9% 16.5% % 9.6% The harmful effects of smoking can be seen in the major causes of death our residents experience. Heart disease is the leading cause of death in our county with cancer the second leading cause of death. Lung cancer is the second most frequently diagnosed type of cancer for both men and women. The two-year average age-adjusted lung cancer death rate in our county was 41.9 per 100,000 people between 1999 and This rate is below the rate for California (46.8/100,000) and below the Healthy People 2010 national goal of no more than 44.9 deaths per 100,000 people. Summary: Tobacco Use Overall 17% of Santa Barbara County adults currently smoke. The rate is highest among adults aged at just under 27%. Despite this widely publicized information, about 44% of all adults reported ever having smoked and 17% of all adults interviewed in the survey reported that they are current smokers. This is comparable to California as a whole with 42% of adults ever having smoked and almost 17% being current smokers. Nationally, 23% of people report that they currently smoke. While the Santa Barbara County rate of 17% is good compared with the nation, there is much work to be done to meet the Healthy People 2010 national goal for 12% or less of all adults to smoke. More than 1 in 5 young adults (aged 18-30) is a current smoker. HP 2010 objective 12% Along with information gathered through this survey, it should be noted that surveys done through other sources point out the special threat that smoking poses to our young people. In one such study, minors were able to purchase tobacco in 30% of stores in Santa Barbara County in In a 2001 survey on tobacco use at the University of California at Santa Barbara (UCSB), almost 29% of students surveyed reported smoking within the past 30 days. Several partnerships have been formed to address and combat the startling prevalence of tobacco use in our communities, including CEASE, the Coalition Engaged in a Smoke-Free Effort, a consortium of local agencies and community members who are working to decrease tobacco use. Over 8% of the adolescents (aged 12-17) surveyed reported having regularly smoked at one time and 6% were current smokers. 14
 reported that they had tried an illicit drug such as cocaine, marijuana or glue sniffing in the 2001")
19 Drug Use There is no doubt that inappropriate drug use is a national, state, and local problem. Even though drug use is substantially under-reported in surveys, 14% of adolescents (aged 12-17) reported that they had tried an illicit drug such as cocaine, marijuana or glue sniffing in the 2001 CHIS survey. These findings concerning substance abuse alcohol and other drugs are unsettling. By any standard, our adults and children, and the neighborhoods and communities in which they live, continue to suffer from these problems. The most recent data on drug-related deaths ( ) shows us that Santa Barbara County s twoyear average age-adjusted death rate of 10.6 deaths per 100,000 population is higher than the state s age-adjusted death rate of 8.7 deaths/100,000. The Healthy People 2010 national objective for drugrelated deaths is 1.0 death/100,000. Summary: Drug Use In the 2001 survey, 14% of adolescents (aged 12-17) reported that they had tried an illicit drug such as cocaine, marijuana and glue sniffing. Santa Barbara County s age-adjusted rate for drug-related deaths exceeds the state average and the Healthy People 2010 national objective. 15
. Chlamydia is the most frequently reported communicable disease in the county, state and nation as a whole.")
20 STDs and Births to Teens In the CHIS survey, respondents aged years were asked questions regarding their sexual practices and 20% reported that they had had sexual intercourse. With sexual activity comes increased risk for sexually transmitted diseases (STDs). Chlamydia is the most frequently reported communicable disease in the county, state and nation as a whole. This disease is the number one cause of preventable infertility in women. Locally and elsewhere, Chlamydia disproportionately effects our youth. In our county in 2001, 74% of female cases were in the age range of years and 64% of the male cases were in the age range of years. For Santa Barbara County in 2001, there were 218 cases of Chlamydia and 21 cases of Gonorrhea per 100,000 population. While the rates for Santa Barbara County are lower than the rates for California overall, both rates are higher than the Healthy People 2010 national objectives. The three-year average age-specific birth rate for mothers aged years, , was 44.9 per 1,000 population for Santa Barbara County and 50.3 per 1,000 for California. As portrayed in the map of the county (below), the Santa Maria region had the highest proportion of births to teen mothers in 2001 with 5.58%. This proportion reflects 124 births to teens out of 2,223 total area births. The Lompoc/Santa Ynez Valley region follows with 2.82% (31/1,102) and then the Santa Barbara area with 2.18% (50/2,290). According to the Centers for Disease Control and Prevention, adolescent pregnancy and childbearing have been associated with adverse health and social consequences for young women and their children. Teen Births as Percentage of Total Births by Area Santa Barbara County
21 Mental Health The mental health and well-being of our citizens are compelling concerns, since poor mental health can affect individuals' ability to function successfully at work, at school, and with family and friends. Poor mental health can also be associated with poor health practices, including alcohol and drug abuse. Suicide took the lives of 29,350 Americans in In 2000, there were 1.7 times as many suicides as homicides. Suicide is the third leading cause of death for young people aged in the United States. Males are more than four times more likely to die from suicide than are females. However, females are more likely to attempt suicide than are males. Across the nation, 57% of suicides in 2000 were committed with a firearm. 15 Death Rate Due to Suicide Santa Barbara County vs. California Suicides/100, HP 2010 objective 5/100,000 0 SB County California The two-year average annual age-adjusted death rate due to suicide for in the county was 10.8 per 100,000 population. This rate is higher than the California rate of 9.5/100,000 and the Healthy People 2010 national objective of 5/100,000 or less. In the 2001 data from the CHIS survey indicate 16% of adult respondents reported that during the past 12 months they needed help for emotional or mental health problems, such as feeling sad, blue, anxious or nervous. In terms of the use of mental health services, 8% of adults in the 2001 survey reported having seen a doctor or mental health professional for mental health concerns, including stress, alcohol/drug problems, or personal and family problems. Among county youth, aged years, 17% were seen in the previous year for psychological or emotional counseling. Of county adults who needed or received help for emotional, mental health, or substance abuse problems in the past 12 months, 10% reported they had difficulties or delays in getting that help. Summary: Mental Health About 8% of adults reported having seen a mental health professional for mental health problems such as stress, alcohol/drug problems, and personal/family problems. 17% of those aged had psychological or emotional counseling in the past year. Ten percent of adults had difficulties or delays in getting the mental/emotional help that they needed. 17
22 Keeping Healthy: Preventive Care Many of the most important medical care advances over the past 50 years have been improvements in diagnostic and screening tests that permit early identification of risk factors for illness or injury. It is well known that the earlier that health problems, such as high blood pressure, high cholesterol, diabetes, cancer and other chronic diseases can be detected, the greater the potential for successful treatment. In many cases, Santa Barbara County does well at ensuring our residents get the recommended health screenings. For example, in 1999, 92% of adults reported having had their blood pressure checked within the past two years. This approaches the Healthy People 2010 national objective of 95%. In the 2001 survey, 21% of adult respondents reported having currently or having had high blood pressure. In 1999, 74% of adults aged 65 and older had a flu shot in the previous year. This percentage dropped to 69% in In California and in the United States, these rates were 67% and 66% respectively. In 2001, influenza and pneumonia combined were the 6 th leading cause of death in Santa Barbara County. Women s Health A bright spot is in women's health screening. More than 86% of the adult women aged 40 or more years surveyed reported they had ever had a mammogram (up from 85% in 1999). Among Hispanic women the percentage was lower at 73% vs. non-hispanic women at 89%. Of all women surveyed that had ever had a mammogram, 87% had one in the last two years. This exceeds the Healthy People 2010 national objective for mammograms for women age 40 and older that at least 70% to have had one in the last 2 years. About 94% of all adult women reported ever having had a Pap smear test and of those, 89% had one within the past 3 years. Healthy People 2010 national objectives for the same are 97% and 90% respectively. These types of women's health screenings greatly improve early detection and successful treatment of breast and cervical cancers. Pap Test within Three Years Santa Barbara County vs. California % 90.6% HP 2010 Objective 90% SB County California Santa Barbara County almost meets the Healthy People 2010 national objective for women getting a Pap test within three years. 18
 test that can detect early signs of prostate cancer.")
23 Men s Health Prostate cancer is the second most common cancer among men (behind lung cancer). There is a screening test called the PSA (Prostate Specific Antigen) test that can detect early signs of prostate cancer. In the 2001 survey, about 45% of men aged 40 or older reported that they had never had a PSA test. In California overall the percentage was 57%. Increased education to men about the value of these screening tests can result in earlier detection of cancers and improved treatment outcomes. Summary: Keeping Healthy - Preventive Care 69% of adults aged 65 and older received a flu vaccination in the previous year. 87% of women (aged 40 and over) who had ever had a mammogram had one in the last two years. This exceeds The Healthy People 2010 national objective. 94% of all women had ever had a pap test and of those that did, 89% had had one in the last three years. 19

24 Chronic Conditions Diabetes Diabetes affects nearly 16 million Americans and contributes to about 200,000 deaths a year. Diabetes can cause heart disease, stroke, blindness, kidney failure, leg and foot amputations, pregnancy complications, and deaths related to influenza and pneumonia. Some estimates report that for every two people diagnosed with diabetes, there is another person who has diabetes but does not know it. In 2001, diabetes was the 10 th leading cause of death in our county. Diabetes is usually manageable through diet and medications. Greater screening efforts are needed to locate those with diabetes who are not aware of it. Also needed are improved strategies to help those with diabetes to manage their disease and avoid the debilitating results of uncontrolled diabetes. Close to 6% of adults reported that they had been told by a health professional that they have diabetes. Among Hispanic respondents, more than 7% had been told they have diabetes. This means that over 16,000 adults in Santa Barbara County (including over 5,000 Hispanics) have been diagnosed with diabetes with an estimated additional 8,000 people who have diabetes but don't know it. Asthma Asthma is a serious chronic disease. Rising asthma prevalence, especially among children, is a cause for concern. Close to 20.3 million Americans (6.3 million children) had asthma in 2001 for a rate of 7,340 per 100,000 population. Asthma is responsible for numerous emergency room visits, missed days of school and work, and it seriously impacts the lives of adults and children alike. The 2001 survey indicated that over 11% of respondents in Santa Barbara County had been diagnosed with asthma. In the county s younger population, approximately 1 in 10 children and adolescents have been told by a health professional that they have asthma. The survey also provides the encouraging news that only 18% of asthmatic children (aged 0-11) experienced asthma symptoms once or more per month in the past year and only 25% sometimes had to limit their activity due to asthma. This indicates we are experiencing good levels of success in managing the disease. Summary: Chronic Conditions Almost 6% of adults have been told by a health professional that they have diabetes. 11% of adolescents and 10% of children have been told by a health professional that they have asthma. Only 18% of asthmatic children (aged 0-11) experienced regular asthma symptoms and only 25% had to limit their activity at times due to asthma. 20
25 SB Co CA Injury Prevention Injuries are not, as we used to think, accidents. Injuries are often predictable and preventable. It is by understanding and monitoring injuries that interventions can be developed and implemented. Unintentional injuries are the leading cause of death in the United States for people aged Each year, more than 90,000 people die in the U.S. as a result of unintentional injuries. During an average year in the U.S., unintentional injuries account for nearly 31 million emergency room visits. For , the two-year average ageadjusted death rate due to unintentional injuries for Santa Barbara County was 33 per 100,000 population. In California overall, the rate was 27.4 per 100,000. The Healthy People 2010 national objective is 17.5 per 100,000 population. Motor Vehicle-Related Deaths The latest data show that Santa Barbara County has met the Healthy People 2010 goal for motor vehicle-related death with an age-adjusted death rate is 5.3 per 100,000 population. The Healthy People 2010 national objective is not more than 9.2 deaths per 100,000 population. Children Who Always Wear Bike Helmets Santa Barbara County vs. California % Seat Belt Usage Seat belts are the single most effective means for occupants to reduce the risk of death and serious injury in a motor vehicle crash. The 1999 survey showed that Santa Barbara County adults were doing fairly well on seat belt use with 89% reporting they always use seat belts. For adolescents, the percentage was lower with 76% reporting that they always wear seat belts in the The Healthy People 2010 national objective for seat belt use is 92%. Bicycle Helmet Usage Nationally, bicycle-related head injuries account for about 500 deaths, 17,000 hospitalizations, and 153,000 emergency department visits each year. Age is a factor for bicycle-related injuries and deaths: the rate of injury is highest for children aged 5-15 years and the rate of death is highest for children aged years. Males are more than 2 times more likely to be killed per bicycle trip than females. Universal helmet use could save one life each day and prevent one head injury every 4 minutes across the country. Of Santa Barbara County children aged 6-11 years who had ridden a bicycle in the last year, 76% reported they always wear a helmet when riding. This compares favorably to California overall where 61% of 6 to 11 year-olds reported the same. The usage of helmets was not so universal among the Santa Barbara County s older children, however; with only 24% of those aged reporting that they always wear a bike helmet when riding % 76% of county children (aged 6-11) wear bike helmets whenever they ride. 0 SB County California 21

26 Firearm Injuries Firearm injuries and deaths have been on the rise in the United States. Prevention strategies focused on reducing or eliminating deaths and injuries due to firearms include reducing the proportion of homes with firearms that are loaded and unlocked. For , the two-year average age-adjusted firearm-related death rate for the Santa Barbara County was 6.2 per 100,000. This is above the national objective of 4.1 per 100,000 and below the state rate of 9.3 per 100,000. In 2001, almost 1 in 4 respondents in Santa Barbara County reported a firearm kept in or around the home. Summary: Injury Prevention Santa Barbara County has an age-adjusted rate of 33 per 100,000 population for deaths due to unintentional injury. This rate exceeds the Healthy People 2010 national objective of 17.5 deaths per 100,000 population. While about 3 out of 4 children (6-11 years) reported they always wear a bike helmet when riding, less than 1 in 4 adolescents (12-17 years) reported the same. While the rate of Santa Barbara County adults who report they always wear a seat belt approaches 90%, the rate for adolescents (12-17 years) is lower with 76% reporting that they always wear a seatbelt when driving or riding in a vehicle. In 2001, almost 1 in 4 adults reported they have a firearm kept in or around the home. Of those, just half reported they had taken gun safety training. 22

27 Conclusion: Call to Action Having the 2001 California Health Interview Survey as a tool, key leaders, elected officials, hospital CEOs, health planners and administrators are better equipped to develop new programs, set policy, advocate for or introduce legislation, and allocate resources based on the health needs of Santa Barbara County residents. Utilizing comparable survey items from the 1999 survey, trends can be assessed related to health needs, health and risk factor status, lifestyle practices and access to health care. The bright spots, or areas about which we can be proud include: Low adult smoking rates Use of bicycle helmets by children under age 12 High rates of preventive screenings like mammograms The opportunities for improvement include: Increasing access to health insurance Increasing access to dental services Improving nutrition and physical fitness status Decreasing obesity Decreasing alcohol and other drug use Spotlight on Programs The data from the 2001 CHIS survey give us a snapshot of the health of the people in Santa Barbara County and allow us to see how we compare with other counties and the state. It helps us see where we are doing well and where we can do better. There are many programs in place throughout the county that offer services that promote the health and well-being of our residents. The information below highlights just a few of the programs and services that are available through the County Public Health Department focusing on: Improving Access to Medical Care Reducing or Preventing Obesity Reducing Use of Tobacco Improvements in these three lifestyle and risk factors can bring significant improvements to the health and quality of life of our residents. 23


28 Programs and Services to Promote Access to Care Tobacco Settlement Access to medical care has been enhanced significantly through tobacco settlement funding that the County Board of Supervisors allocates each year to pay for hospital and emergency room care and medical care from physicians and dentists. The Board of Supervisors has directed that these funds be used exclusively to meet the health needs of the county. This allows thousands of Santa Barbara County residents who are uninsured and are not eligible for other payment sources to get the medical, dental, and hospital care they need. Here is a summary of how the funds from the tobacco settlement have been used to improve access to care since July of 2000: 1,147 hospital inpatient days were provided for adults and children; Outpatient hospital services were provided to 268 patients; Reimbursement levels were maintained for physicians providing specialty care to 4,537 adults in the MIA (Medically Indigent Adult) Program; 1,132 adults and children were provided access to needed specialty care; Dental care was provided to 656 children with unmet dental health needs; 1,158 emergency room physician encounters were funded in the fiscal year. Health Care For the Homeless Program Through a federally funded grant, the Health Care For the Homeless (HCH) program of the County Public Health Department emphasizes a multidisciplinary approach to delivering care to homeless persons, combining aggressive street outreach with integrated systems of primary care, mental health services, substance abuse services, case management, and client advocacy. Emphasis is placed on coordinating efforts with other community health providers and social service agencies. The HCH program recognizes the complex needs of homeless people and strives to provide a coordinated, comprehensive approach to the care provided to homeless clients, and in such a way that welcomes them as patients. Specifically, the HCH program: Provides primary care and substance abuse services at locations accessible to homeless people; Provides around-the-clock access to emergency health services; Refers homeless persons for necessary hospital services; Refers homeless persons for needed mental health services unless these services are provided directly; Provides outreach services to inform homeless individuals of the availability of services; Aids homeless individuals in establishing eligibility for housing assistance and services under entitlement programs. 24
 The Public Health Department s WIC Program serves pregnant women, new mothers, breastfeeding women, infants and")
29 Programs and Services Focused on Reducing or Preventing Obesity A number of programs and services focused on reducing or preventing obesity are available through the Nutrition Services unit of the Public Health Department including: WIC (Women, Infants and Children Nutrition Program) The Public Health Department s WIC Program serves pregnant women, new mothers, breastfeeding women, infants and children under five years of age whose income is less than 185% of the federal poverty level. In the past four years, WIC has increasingly emphasized the importance of breastfeeding as a critical preventive practice to support optimal growth and development and reduce the tendency for children to be overweight. The WIC staff offer breastfeeding education, support, and guidance to encourage breastfeeding for WIC clients. WIC nutrition education classes are focused on obesity prevention. The importance of physical activity and adequate intake of fruits and vegetables have been incorporated into fun, interactive classes. Nutrition Network This community-based social marketing project serves low income mothers 30 years old or less, in San Luis Obispo, Santa Barbara and Ventura Counties to increase their consumption of fruits and vegetables as snacks. Fun, interactive snack parties are held for groups of young mothers to educate and promote the benefits and ease of choosing fruits and vegetables as snack foods (replacing less nutritious, empty calorie foods). Evaluation shows that participants are improving their motivation, knowledge, and behavior by eating more fruits and vegetables. The Nutrition Network also sponsors the Gold Coast Collaborative which coordinates a diverse group of stakeholders to research the severity of the overweight/obesity problem in the Gold Coast Region (San Luis Obispo, Santa Barbara and Ventura Counties). A policy brief is in development, with release expected in summer or fall Project LEAN ( Food on the Run ) This program works with high school students in low-income schools to improve the nutrition and physical activity environment in schools. The focus is on empowering students, parents, community members and school officials to take leadership roles to change policies. Projects include: Educating students, parents and school officials about healthy beverage choices and detrimental effects of excessive soda consumption. Educating school board members about the importance of nutrition policies in schools, to promote an optimal learning environment and to prevent obesity. 25

30 Partners for Fit Youth (PFY) Coalition Focused on reaching school-age children and youth in Santa Barbara County, the Partners for Fit Youth Coalition is working to improve the health of youth and their families through education, intervention, outreach, and environmental changes, to prevent chronic disease and to promote healthy weight. PFY Coalition Accomplishments: Led the effort to improve beverage choices in vending machines in the Santa Maria Joint Union School District; Organized and co-sponsored two Children and Weight conferences; Conducted a survey of school physical activity programs; Formed the School Nutrition Advisory Committee (SNAC) at Santa Barbara High School; Obtained funding to support physical activity training after school in Santa Maria; Conducted radio and TV interviews to increase awareness of childhood obesity. School Nutrition Advisory Council (SNAC) The SNAC serves over 2000 students at Santa Barbara High School and works to create a healthy food environment to promote optimal school performance. Formed in November 2002, this group has assessed all the food and beverage options on campus, and will make recommendations to the school board in July The committee has already influenced the offering of more nutritious choices in the Parent, Teacher, Student Association (PTSA) Student Store, and will request the reduction or elimination of soft drinks on campus. The group will assist school administration in complying with existing food and nutrition regulations. 26
31 Programs and Services Focused on Reducing the Use of Tobacco The Tobacco Prevention Settlement Program (TPSP) of the County Public Health Department provides prevention, cessation and enforcement services throughout the county. The program activities focus on: Helping smokers break their addiction to tobacco; Preventing youth and all non-smokers from becoming tobacco users; Protecting the public from exposure to secondhand smoke; Limiting minors' access to tobacco products; and Increasing awareness of the tobacco industry's marketing and promotional influences. Below are some of the programs and services that are offered through the Tobacco Prevention Settlement Program: Cessation Services Cessation classes are available throughout Santa Barbara County at low or no cost. Classes serve approximately 350 clients per year and offer free nicotine replacement therapy and reimbursement for buproprion prescriptions which increase quit rates. In addition: Since 2001, over 50 community agency personnel and staff at drug and alcohol treatment programs have been trained to assist their clients with tobacco cessation. Approximately 70% of all class participants are able to quit smoking or chewing by the end of the class. Relapse prevention classes are offered to increase the long-term success of class participants, which is typically around 30% at the six-month follow-up. Tobacco Prevention Programs Educational prevention programs target youth and young adults who are most at risk to begin smoking or chewing tobacco. This includes funding in-class tobacco education programs at elementary and junior high schools, and after-school and weekend drama, arts, and athletic programs. Twenty-one projects are currently funded, some examples are: Isla Vista Parks and Recreation Hiking for Health teen program which provides tobacco education and weekend hiking trips for teens. City of Santa Maria Recreation and Parks Department that provides youth smoking cessation and tobacco-free activities at the Abel Maldonado Community Youth Center. Protecting the Public from Secondhand Smoke Secondhand smoke is a Class A carcinogen. To protect the public from secondhand smoke, the Tobacco Prevention Settlement Program educates the public about all local and state laws that regulate the use of tobacco in indoor and outdoor locations. Specific goals accomplished in the past year include: Respond to complaints from citizens and coordinate with businesses and law enforcement to insure that all worksites are smoke-free. Provide signage for public and private worksites in communities that have enacted outdoor smoking restrictions. Provide signage to all public parks to increase compliance with the state law banning smoking within 25 feet of all playgrounds. Limiting Minors Access to Tobacco Almost all smokers begin smoking by age 19, 80% before 18 years of age. To protect youth from the dangers of tobacco addiction, the Tobacco Prevention Settlement Program works to prevent youth access to tobacco. To accomplish this objective, TPSP has: Worked with the City and County of Santa Barbara to enact ordinances that require that tobacco retailers obtain a license. Funded law enforcement to conduct undercover operations to enforce laws that prohibit merchants from selling tobacco to minors. Survey, educate, and bring all retailers into compliance with laws related to the sale of tobacco. 27

32 Increase Awareness of Tobacco Industry's Marketing and Promotional Influences The tobacco industry spends 2.5 million every day advertising and promoting tobacco in California. To counter this influence, TPSP created Money, an anti-tobacco media campaign aimed at 18 to 24 year olds. The campaign is recognized by 90% of the target audience. Its purpose is: To influence younger teens and young adults to refrain from beginning to use tobacco; To keep those who have just begun to use tobacco from continuing; and To influence current smokers and chewers to quit. TPSP also uses an ongoing radio, television, and print media campaign to promote smoking cessation classes. These advertisements insure that smokers and chewers across the county know that cessation classes are available to them, and insure that funded classes are fully enrolled. 28
33 Appendix A Methodology The CHIS 2001 sample design The 2001 California Health Interview Survey (CHIS 2001) is a representative sample of the California population. CHIS 2001 is a two-stage, geographically stratified random-digit-dial (RDD) sample design. At the first stage, California telephone numbers were randomly generated by computer and then a random sample of these were drawn within each of 41 predefined geographic areas or "strata" (33 strata are individual counties and 8 strata are groupings of counties with small population sizes). These telephone numbers were then dialed and screened to determine if they were households and thus eligible for the survey. At the second stage, one adult was randomly selected to be interviewed from among all adults living in the contacted household. Only the selected person was eligible for the interview. In households where there were children associated with the selected adult, one adolescent (age 12-17) was interviewed and information was obtained for one child under age 12 by interviewing the adult most knowledgeable about that child's health care. Both the child and adolescent were each randomly chosen if more than one child or adolescent resided in the household and with whom the selected adult was "associated" as either a parent or guardian. (Adjustment factors for the selection mechanisms have been incorporated into the data's sample weights.) Because a minimum sample size goal of 800 adult interviews was set for each stratum, CHIS 2001 over-sampled counties with small populations and as a result over-sampled rural areas. Sample size goals larger than 800 (ranging from 1,000 to 2,660) were set for counties with larger population sizes. The largest county sample, over 11,000 adult interviews, was allocated to Los Angeles County. Additionally, supplemental geographic samples were collected in three cities (Berkeley, Long Beach, Pasadena) and in three counties (San Francisco, Santa Barbara, Solano). CHIS 2001 also over-sampled several ethnic minority population groups, supplementing the sample for Koreans, Vietnamese, South Asians, Japanese, American Indian and Alaska Natives, and Cambodians. CHIS 2001 completed 55,428 adult interviews statewide, 5,801 interviews with adolescents, ages 12-17, and 12,592 interviews with parents of young children (under age 12). A total of 73,821 telephone interviews were conducted in one of six available languages. A county or group of counties make up a sampling stratum for which a target number of adult interviews was predetermined based on the original sample design. In Santa Barbara County, 1,001 adults, 93 adolescents (12-17 years) and 223 children were surveyed. These totals include a requested oversampling in two zipcode areas in Santa Barbara County, and (Santa Maria and Guadalupe). Each area was planned for a yield of 100 adult completed cases. Each oversample area was sampled using the RDD approach (as was with the main survey). The oversample cases were then combined and weighted together with main Santa Barbara County sample cases as a single file. 29
34 Appendix B Santa Barbara County 2001 California Health Interview Survey Topics Adult Interview Topic Areas Teen Interview Topic Areas (ages 18 and above) (ages 12 to 17) Age, gender, race, ethnicity Physical activity Injury prevention Health status Women's health Healthcare use and access Health conditions Cancer screening Health insurance Health behaviors Dental health Employment Diet Mental health Income Age, gender, race, ethnicity Young women's health Computer use Health status Skin cancer prevention Parent relationship Health conditions Dental health Health care Health behaviors Mental health Sexuality Experience with firearms Employment Diet Injury prevention Future plans Physical activity Child Interview Topic Areas (under age 12) Age, gender, race, ethnicity Physical activity Computer Use Health status Child care Family involvement Health problems Dental health Health care Health behaviors Mental health Health insurance Diet Injury prevention 30
35 Acknowledgements This report was produced by the Epidemiology Unit of the Public Health Department, Roger E. Heroux, Director. The Public Health Department is a department of the County of Santa Barbara. Santa Barbara County Board of Supervisors 1 st District - Naomi Schwartz 2 nd District - Susan Rose 3 rd District- Gail Marshall 4 th District - Joni Gray 5 th District Joseph Centeno County Administrator Michael F. Brown For Additional Copies If you would like additional copies of this summary report please contact: Amy Bellomy, RN, MPH - Senior Epidemiologist Santa Barbara County Public Health Department 345 Camino del Remedio Santa Barbara, CA / abellom@co.santa-barbara.ca.us

36
San Diego County Health Briefs North Coastal Region
 Non-Communicable Disease This brief contains 2009 chronic disease health data for the of San Diego County. Data are provided from the Community Health Statistics Unit and the 2009 California Health Interview
Sarpy/Cass Department of Health and Wellness
 This 2012 Community Health Report Card is the product of many community surveys and agency recordkeeping. The staff at the Sarpy/ Department of Health and Wellness finds value in all of this community
HealtheCNY Indicator List by Data Source
 American Community Survey 23 Adults with Health Insurance Children Living Below Poverty Level Children with Health Insurance Families Living Below Poverty Level Homeowner Vacancy Rate Homeownership Households
Health Profile Chartbook 2016 Kalkaska County
 Health Profile Chartbook 2016 Kalkaska County 2016 Chartbooks The 2016 Chartbooks provide a snapshot of the health status of the District Health Department #10 jurisdiction. Information is presented by
Health Profile Chartbook 2016 Mecosta County
 Health Profile Chartbook 2016 Mecosta County 2016 Chartbooks The 2016 Chartbooks provide a snapshot of the health status of the District Health Department #10 jurisdiction. Information is presented by
2016 Collier County Florida Health Assessment Executive Summary
 2016 Florida Health Assessment Executive Summary Prepared by: The Health Planning Council of Southwest Florida, Inc. www.hpcswf.com Executive Summary To access the report in its entirety, visit http://www.hpcswf.com/health-planning/health-planningprojects/.
2016 PRC Community Health Needs Assessment
 2016 PRC Community Health Needs Assessment Staunton City, Waynesboro City, and Augusta County, Virginia Prepared for: Augusta Health By Professional Research Consultants, Inc. The PRC Community Health
Community Health Needs Assessment
 Community Health Needs Assessment Scott County, Missouri This assessment will identify the health needs of the residents of Scott County, Missouri, and those needs will be prioritized and recommendations
WASHINGTON STATE COMPARISONS TO: KITSAP COUNTY CORE PUBLIC HEALTH INDICATORS May 2015
 WASHINGTON STATE COMPARISONS TO: KITSAP COUNTY CORE PUBLIC HEALTH INDICATORS This is a companion document to the Core Public Health Indicators that provides a comparison of to Washington State for the
PHACS County Profile Report for Searcy County. Presented by: Arkansas Center for Health Disparities and Arkansas Prevention Research Center
 PHACS County Profile Report for Searcy County Presented by: Arkansas Center for Health Disparities and Arkansas Prevention Research Center Contents Introduction... Page 2 Demographics...Page 3 Social Environment
Colorado Health Disparities Profiles
 Health Disparities Profiles includes: Larimer County Population Total Population Source: CDC/NCHS 2007-based, bridged-race population estimates, 2007. Social Determinants of Health 287,574 248,312 26,629
Community Health Needs Assessment PREPARED BY
 Community Health Needs Assessment PREPARED BY DEAR COMMUNITY PARTNERS We all know that good health is essential for a productive and thriving community. Furthermore, we understand that conditions in the
These are more than words. They are the principles and philosophy that drive every decision that ProMedica makes as an organization.
 Foreword Mission-driven. Community-based. Not-for-profit. These are more than words. They are the principles and philosophy that drive every decision that ProMedica makes as an organization. With people
Colorado Health Disparities Profiles
 Health Disparities Profiles County includes: Jackson, Moffat, Rio Blanco, and Counties Population Total Population 22,382 43,638 4,861,515 21,015 39,473 3,508,736 904 3,224 909,833 140 263 228,718 210
Prince George s County Health Department Health Report Findings
 Prince George s County Health Department 2018 Health Report Findings Our Residents Socioeconomic Factors Compared to Maryland, Prince George s residents: have a higher median household income, are employed
Table of Contents INTRODUCTION... 2 METHODOLOGY Appendix 1 Comparison of Peer Counties... 6
 Table of Contents INTRODUCTION... 2 METHODOLOGY... 4 Appendix 1 Comparison of... 6 Appendix 2 Key Findings from the MAPP Assessments... 7 BARRIERS TO HEALTHCARE ACCESS... 7 HEALTH STATUS... 9 DEATH INDICATORS...
Centers for Disease Control and Prevention (CDC) Coalition C/o American Public Health Association 800 I Street NW Washington, DC,
 Coalition C/o American Public Health Association 800 I Street NW Washington, DC,") Centers for Disease Control and Prevention (CDC) Coalition C/o American Public Health Association 800 I Street NW Washington, DC, 20001 202-777-2514 Donald Hoppert, Director of Government Relations, American
Centers for Disease Control and Prevention (CDC) Coalition C/o American Public Health Association 800 I Street NW Washington, DC, 20001 202-777-2514 Donald Hoppert, Director of Government Relations, American
Summary of Findings. Significant Health Needs of the Community. Areas of Opportunity Identified Through This Assessment. Healthy Lifestyles
 Summary of Findings Significant Health Needs of the Community The following areas of opportunity represent the significant health needs of the community, based on the information gathered through this
Pennsylvania Department of Health 2003 Behavioral Risks of McKean County Adults Page 1
 2003 Behavioral Health Risks Of Adults Collaborative Board Pennsylvania Department of Health 2003 Behavioral Risks of Adults Page 1 Introduction The Centers for Disease Control and Prevention (CDC) and
Vanderbilt Institute for Medicine and Public Health Women s Health Research Tennessee Women s Health Report Card TENNESSEE DEPARTMENT OF HEALTH
 Vanderbilt Institute for Medicine and Public Health Women s Health Research 2009 Tennessee Women s Health Report Card TENNESSEE DEPARTMENT OF HEALTH 2009 Tennessee Women s Health Report Card Rationale
WASHINGTON COUNTY COMMUNITY HEALTH SURVEY 2016
 WASHINGTON COUNTY COMMUNITY HEALTH SURVEY 2016 Commissioned by: Aurora Health Care Children s Hospital of Wisconsin Froedtert & Medical College In Partnership with: Center for Urban Population Health Washington
Baptist Health Jacksonville Community Health Needs Assessment Implementation Plans. Health Disparities. Preventive Health Care.
 Baptist Health Jacksonville Community Health Needs Assessment Implementation Plans Health Disparities Infant Mortality Prostate Cancer Heart Disease and Stroke Hypertension Diabetes Behavioral Health Preventive
Community Health Needs Assessment
 Community Health Needs Assessment Gratiot County Community Health Assessment Community Health Assessment Data Sources Primary Data (new data collected first-hand) Community Opinion Survey Provider Opinion
The Cecil County Community Health Survey 2009 Report
 The Cecil County Community Health Survey 2009 Report May 2010 Cecil County Health Department 401 Bow Street Elkton, Maryland 21921 410-996-5113 www.cecilcountyhealth.org Acknowledgement Thank you again
Factual Information Contained in this Report: PURPOSE. Health Perceptions. Health Insurance Coverage. Health Care Access. Preventive Health Care
 Factual Information Contained in this Report: Health Perceptions Health Insurance Coverage Health Care Access Preventive Health Care Maternal and Child Health Alcohol, Tobacco, and Other Drug Use PURPOSE
Pennsylvania Department of Health 2006 Behavioral Risks of Chester County Adults Page 1
 2006 Behavioral Health Risks Of Adults Healthy Communities Partnership Department of Health 2006 Behavioral Risks of Adults Page 1 Introduction The Centers for Disease Control and Prevention (CDC) and
Pierce County Health Indicators
 Pierce County Health Indicators 3629 S. D. St., Tacoma WA 98418-6813 Phone: 253-798-7668 email: oapi@tpchd.org Demographics Characteristics Latest Year count Percent WA State count Percent Data Source
Lincoln County. Community Health Assessment
 Community Health Assessment Contents Acknowledgements 1 Introduction 2 Key Informant Health Survey 3 Community Health Data 7 Demographics 8 Substance Abuse 10 Mental Health and Trauma 11 Chronic Disease
Pierce County Health Indicators
 Pierce County Health Indicators Updated 11/10/2016 Demographics Characteristics Latest Year count Percent WA State count Percent Total Population 2015 830,120 7,061,408 2015 Total Percent Total Percent
Results of Lahey Health Community Health Needs Assessment Survey: Wenham October, 2012
 Results of Lahey Health Community Health Needs Assessment Survey: October, 2012 Table 1: Number of respondents and response rates by town. Also, reporting average age, gender and household income based
Results of Lahey Health Community Health Needs Assessment Survey: Gloucester October, 2012
 Results of Lahey Health Community Health Needs Assessment Survey: October, 2012 Table 1: Number of respondents and response rates by town. Also, reporting average age, gender, and household income based
KENOSHA COUNTY COMMUNITY HEALTH SURVEY 2016
 KENOSHA COUNTY COMMUNITY HEALTH SURVEY 2016 Commissioned by: Aurora Health Care Children s Hospital of Wisconsin United Hospital Systems In Partnership with: Center for Urban Population Health Kenosha
Community Health Status Assessment
 Community Health Status Assessment EXECUTIVE SUMMARY The Community Health Status Assessment (CHSA) is one of four assessments completed as part of the 2015-2016 Lane County Community Health Needs Assessment
David V. McQueen. BRFSS Surveillance General Atlanta - Rome 2006
 David V. McQueen Associate Director for Global Health Promotion, National Center for Chronic Disease Prevention and Health Promotion, Atlanta BRFSS Surveillance General Atlanta - Rome 2006 Behavioral Risk
Oakwood Healthcare Community Health Needs Assessment Indicators
 POPULATION Sub-Category Education Socioeconomic Violence High School High School Dropouts Graduation Rate (Percent) Some College Births to Unmarried Women Children in Poverty Children in Singleparent Households
Initial Report of Oregon s State Epidemiological Outcomes Workgroup. Prepared by:
 Alcohol Consumption and Consequences in Oregon Prepared by: Addictions & Mental Health Division 5 Summer Street NE Salem, OR 9731-1118 To the reader, This report is one of three epidemiological profiles
HIP Year 2020 Health Objectives related to Perinatal Health:
 PERINATAL HEALTH Perinatal health is the health and wellbeing of mothers and babies before, during, and after child birth. As described by Healthy People 2020, Pregnancy can provide an opportunity to identify
2017 Community Health Needs Assessment Report
 2017 Community Health Needs Assessment Report, Florida Prepared for: By: Professional Research Consultants, Inc. 11326 P Street Omaha, NE 68137-2316 www.prccustomresearch.com 2017-0313-02 June 2017 Table
Tobacco, Alcohol, and
 Healthier San Joaquin County Community Assessment 2011 Tobacco, Alcohol, and Drug Use Summary... 100 Indicators Tobacco Use... 101 Tobacco Use Among Pregnant Women... 103 Alcohol Consumption... 104 Adult
Health System Members of the Milwaukee Health Care Partnership
 Health System Members of the Milwaukee Health Care Partnership Aurora Health Care Children s Hospital of Wisconsin Columbia St. Mary s Health System Froedtert Health Wheaton Franciscan Healthcare In Collaboration
5 Public Health Challenges
 5 Public Health Challenges The most recent Mecklenburg County Community Health Assessment (CHA) prioritized the prevention of premature death and disability from chronic disease as the number one public
Nutrition and Physical Activity
 Nutrition and Physical Activity Lifestyle choices made early in life have a significant impact on the patterns of chronic disease developed in adulthood. In the U.S., poor diet and physical inactivity
2011 PRC Community Health Report
 2011 PRC Community Health Report Sponsored by Deaconess Hospital Community Health Partners (CHP) Gallatin City- Health Department Gallatin, Madison & Park Counties, Montana Professional Research Consultants,
MILWAUKEE COUNTY COMMUNITY HEALTH SURVEY 2015
 MILWAUKEE COUNTY COMMUNITY HEALTH SURVEY 2015 Commissioned by: Aurora Health Care Children s Hospital of Wisconsin Columbia St. Mary s Health System Froedtert Health Wheaton Franciscan Healthcare In Partnership
2010 Community Health Assessment Yellowstone County, Montana
 2010 Community Health Assessment, Montana EXECUTIVE SUMMARY Sponsored By The Alliance Billings Clinic RiverStone Health St. Vincent Healthcare Prepared by Professional Research Consultants, Inc. (PRC)
CSR Greater Fargo-Moorhead Community Health Needs Assessment of Residents. August 2015
 2015 Greater Fargo-Moorhead Community Health Needs Assessment of Residents August 2015 Results from a March 2015 generalizable survey of community residents in the Greater Fargo-Moorhead Metropolitan Area
HEALTH FACTORS Health Behaviors. Adult Tobacco Use Adolescent Alcohol Use Healthy Eating School Food Environment Physical Activity
 HEALTH FACTORS Health Behaviors Adult Tobacco Use Adolescent Alcohol Use Healthy Eating School Food Environment Physical Activity 1 Adult Tobacco Use Definition: For this assessment, adult tobacco use
EXECUTIVE SUMMARY West Virginia Youth Risk Behavior Survey Results of High School Students. By Chad Morrison, January Male Female.
 Grade Sex EXECUTIVE SUMMARY 2013 West Virginia Youth Risk Behavior Survey Results of High School Students By Chad Morrison, January 2015 The Youth Risk Behavior Surveillance System was developed by the
Washington County Community Health Survey Report 2014
 Washington County Community Health Survey Report 2014 Commissioned by: Aurora Health Care Children s Hospital of Wisconsin Froedtert & Medical College of Wisconsin In Partnership with: Center for Urban
WAUKESHA COUNTY COMMUNITY HEALTH SURVEY 2017
 WAUKESHA COUNTY COMMUNITY HEALTH SURVEY 2017 Commissioned By: Aurora Health Care Children s Hospital of Wisconsin Froedtert & the Medical College of Wisconsin ProHealth Care Wheaton Franciscan Healthcare
North Shore Community Health Survey Summary
 North Shore Community Health Survey Summary This research provides valuable behavioral data, lifestyle habits, and the prevalence of risk factors and disease conditions of North Shore residents. This summary
North Mississippi Medical Center
 North Mississippi Medical Center h e a l t h a s s e s s m e n t 2 0 1 3 Lee County Lee County Health Assessment, 2013 August 2013 Preface This health assessment is a source of health information for
Baptist Health Nassau Community Health Needs Assessment Priorities Implementation Plans
 Baptist Health Nassau Community Health Needs Assessment Priorities Implementation Plans Health Disparities Heart Disease Stroke Hypertension Diabetes Adult Type II Preventive Health Care Smoking and Smokeless
OZAUKEE COUNTY COMMUNITY HEALTH SURVEY 2016
 OZAUKEE COUNTY COMMUNITY HEALTH SURVEY 2016 Commissioned by: Aurora Health Care Children s Hospital of Wisconsin Columbia St. Mary s Health System In Partnership with: Center for Urban Population Health
2012 PRC Community Health Needs Assessment Report
 2012 PRC Community Health Needs Assessment Report, California Sponsored by Mercy Medical Center Merced Professional Research Consultants, Inc. 11326 P Street Omaha, Nebraska 68137-2316 (800) 428-7455 www.prconline.com
Health Status Disparities in New Mexico Identifying and Prioritizing Disparities
 Health Status Disparities in New Mexico Identifying and Prioritizing Disparities Public Health Division March 23 Health Status Disparities in New Mexico Identifying and Prioritizing Disparities New Mexico
Executive Summary To access the report in its entirety, visit
 Executive Summary To access the report in its entirety, visit http://www.hpcswf.com/health-planning/health-planningprojects/. Demographic and Socioeconomic Characteristics Population Demographics has a
Baptist Health Beaches Community Health Needs Assessment Priorities Implementation Plans
 Baptist Health Beaches Community Health Needs Assessment Priorities Implementation Plans Health Disparities Heart Disease Stroke Hypertension Diabetes Adult Type II Preventive Health Care Smoking and Smokeless
New Mexico Department of Health. Racial and Ethnic Health Disparities Report Card
 New Mexico Department of Health Racial and Ethnic Health Disparities Report Card August 30, 2006 Acknowledgments Many individuals contributed to the production of this report card and the Office of Policy
WALWORTH COUNTY COMMUNITY HEALTH SURVEY 2016
 WALWORTH COUNTY COMMUNITY HEALTH SURVEY 2016 Commissioned by: Aurora Health Care Children s Hospital of Wisconsin Mercy Health System In Partnership with: Center for Urban Population Health Walworth County
Community Health Assessment. May 21, 2014
 Community Health Assessment May 21, 2014 1 Presenters Stacey Adams, MS Co-Leader Domain 1 Carol Heier, LCSW Accreditation Coordinator Dale Quinney, MPH Co-Leader Domain 1 2 Recording available There is
PROMEDICA MONROE REGIONAL HOSPITAL 2016 COMMUNITY HEALTH NEEDS ASSESSMENT IMPLEMENTATION PLAN
 PROMEDICA MONROE REGIONAL HOSPITAL 2016 COMMUNITY HEALTH NEEDS ASSESSMENT IMPLEMENTATION PLAN 2017-2019 Approved and Adopted on December 19, 2016 PROMEDICA MONROE REGIONAL HOSPITAL 2016 COMMUNITY HEALTH
Hales Corners Community Health Survey Summary
 Hales Corners Community Health Survey Summary This research provides valuable behavioral data, lifestyle habits, and the prevalence of risk factors and disease conditions of Hales Corners residents. This
Almost 1 in 10 adults have been diagnosed with diabetes. Alabama is ranked fifth in prevalence of diabetes in the United States and its territories.
 2008 FACT SHEET The Diabetes Branch addresses the impact of diabetes in Alabama by developing policies, recommendations, and programs about the disease and related issues. The program is funded through
KENOSHA COUNTY COMMUNITY HEALTH IMPROVEMENT PLAN MID-YEAR ( ) An Initiative Supported Through the Kenosha County Division of Health
 An Initiative Supported Through the Kenosha County Division of Health") KENOSHA COUNTY COMMUNITY HEALTH IMPROVEMENT PLAN MID-YEAR (2016-2020) An Initiative Supported Through the Kenosha County Division of Health Revised June 2016 TABLE OF CONTENTS Contents Steering Committee
KENOSHA COUNTY COMMUNITY HEALTH IMPROVEMENT PLAN MID-YEAR (2016-2020) An Initiative Supported Through the Kenosha County Division of Health Revised June 2016 TABLE OF CONTENTS Contents Steering Committee
Children in Household Year Because Trying to Quit 53% 55% 58% 66% Milwaukee 2012
 Men s Health (40 and Older) Alcohol Use in Past Month Milwaukee 2006 2009 2012 Milwaukee 2003 2006 2009 2012 Prostate Cancer Screening Binge Drinker 17% 20% 19% 32% Within Past 2 Years 61% 58% 45% Driver/Passenger
Waukesha County Community Health Survey Report June 2012
 Waukesha County Community Health Survey Report June 2012 Commissioned by: Aurora Health Care Children s Hospital of Wisconsin Froedtert Health ProHealth Care Wheaton Franciscan Healthcare In Partnership
CUDAHY COMMUNITY HEALTH SURVEY 2015
 CUDAHY COMMUNITY HEALTH SURVEY 2015 Commissioned by: Aurora Health Care Children s Hospital of Wisconsin Columbia St. Mary s Health System Froedtert Health Wheaton Franciscan Healthcare In Partnership
STUDENT VERSION. Community Health Assessment: Pitt County, North Carolina. Cases in Population-Oriented Prevention (C-POP)-based teaching
-based teaching") STUDENT VERSION This project has the objective to develop preventive medicine teaching cases that will motivate medical students, residents and faculty to improve clinical preventive competencies complemented
STUDENT VERSION This project has the objective to develop preventive medicine teaching cases that will motivate medical students, residents and faculty to improve clinical preventive competencies complemented
Status of Vietnamese Health
 Status of Vietnamese Health Santa Clara County, CALIFORNIA 2011 December 12, 2011 December 12, 2011 To Whom It May Concern: To the Residents of Santa Clara County: As part of my State of the County Address
Tobacco, Alcohol and Drug Use
 Tobacco, Alcohol and Drug Use Healthier Community Assessment 2005 101 Tobacco Use Why It Is Important Cigarette smoking is the most preventable cause of disease and death in the United States. 37 Lung
Santa Clara County Highlights
 Santa Clara County Highlights Data and Partnerships: Pivotal Elements to Create Healthy Communities November 6th, 2009 David Hill, PhD, MPH Cities of Santa Clara County 2 The pivotal elements Data evidence-based
Progress Tracker. Photo - https://www.healthypeople.gov/
 Progress Tracker Healthy People provides a framework for prevention for communities in the U.S. Healthy People 2020 is a comprehensive set of key disease prevention and health promotion objectives. The
2016 Community Health Needs Assessment
 2016 Community Health Needs Assessment, Florida Prepared for: Space Coast Health Foundation By: Professional Research Consultants, Inc. 11326 P Street Omaha, NE 68136-2316 www.prccustomresearch.com 2015-1061-02
Columbia St. Mary s Mission Mission Page 3. Community Health Improvement Program Philosophy Page 4
 1 COLUMBIA ST. MARY S COMMUNITY HEALTH IMPROVEMENT STRATEGY MILWAUKEE COUNTY CONTENTS Columbia St. Mary s Mission Mission Page 3 Community Health Improvement Program Philosophy Page 4 2016 Milwaukee Community
Walworth County Community Health Survey Summary
 Walworth County Community Health Survey Summary This research provides valuable behavioral data, lifestyle habits, and the prevalence of risk factors and disease conditions of Walworth County residents.
Alcohol Use and Related Behaviors
 Alcohol Use and Related Behaviors 1 8 6 4 2 21 23 25 27 Current Drinking 48.7 5.7 42.3 43.2 Binge Drinking First Drink of Alcohol Before Age 13 28.6 27.9 Figure 1 Trends in Alcohol Use, Grades 7 12, 21
Behavioral Risk Factor Surveillance System (BRFSS)
") Behavioral Risk Factor Surveillance System (BRFSS) LINA BALLUZ, MPH, Sc.D. Chief Proposed Office of Surveillance, Epidemiology and Laboratory Services Behavior Surveillance Division Overview Background
Behavioral Risk Factor Surveillance System (BRFSS) LINA BALLUZ, MPH, Sc.D. Chief Proposed Office of Surveillance, Epidemiology and Laboratory Services Behavior Surveillance Division Overview Background
KENOSHA COUNTY COMMUNITY HEALTH SURVEY 2014
 KENOSHA COUNTY COMMUNITY HEALTH SURVEY 2014 Commissioned by: Aurora Health Care Children s Hospital of Wisconsin In Partnership with: Center for Urban Population Health Kenosha County Division of Health
Washoe County Community Health Needs Assessment EXECUTIVE SUMMARY
 2018 2020 Washoe County Community Health Needs Assessment EXECUTIVE SUMMARY The 2018-2020 Washoe County Community Health Needs Assessment was sponsored in full by the Washoe County Health District and
71 Potential Leading Health Indicators for Healthy Alaskans 2020: Documenting Progress Towards 25 LHIs
 71 Potential Leading Health Indicators for Healthy Alaskans 2020: Documenting Progress Towards 25 LHIs : Documenting Progress Towards 25 LHIs The purpose of this report is to document the data and information
How Wheaton Franciscan is meeting the NEEDS of our community. NSWERING HE CALL
 ANSWERING THE CALL MEETING OUR COMMUNITY NEEDS S July 1, 2013 June 30, 2016 How Wheaton Franciscan is meeting the NEEDS of our community. NSWERING HE CALL COMMUNITY HEALTH NEEDS IMPLEMENTATION PLAN: ST.
Jackson Hospital Community Health Needs Assessment. Fiscal Year 2016
 Jackson Hospital Community Health Needs Assessment Fiscal Year 2016 JACKSON HOSPITAL AT A GLANCE Jackson Hospital, located in Montgomery, Alabama, is a not-for-profit organization committed to improving
2002 BEHAVIORAL RISK FACTORS OF ARIZONA ADULTS
 2002 BEHAVIORAL RISK FACTORS OF ARIZONA ADULTS SEPTEMBER 2003 Janet Napolitano, Governor State of Arizona Catherine R. Eden, Director Arizona Department of Health Services Rose Conner, Assistant Director
2010 Community Health Needs Assessment Final Report
 2010 Community Health Needs Assessment Final Report April 2011 TABLE OF CONTENTS A. BACKGROUND 3 B. DEMOGRAPHICS 4 C. GENERAL HEALTH STATUS 10 D. ACCESS TO CARE 11 E. DIABETES 12 F. HYPERTENSION AWARENESS
People 2010 Goal Agenda 2013 Objective 6.3 (5.0 HP 2010)
") Maternal Mortality rate per live births NYS Status / 2005-2007 1 2005 9 2005-2007 1 2010 Health People Ontario 0.0~ 15.1 16.7 3.3 Early prenatal care - % of live births 2004-2006 1 2003-2005 11 2004-2006
Maternal Mortality rate per live births NYS Status / 2005-2007 1 2005 9 2005-2007 1 2010 Health People Ontario 0.0~ 15.1 16.7 3.3 Early prenatal care - % of live births 2004-2006 1 2003-2005 11 2004-2006
Franklin County The Health of Our Communities
 Franklin County The Health of Our Communities Paul Smith s College May 1, 2013 1 Welcome and Introductions Meeting Agenda New York State s Health Improvement Plan (Prevention Agenda 2013-2017) Franklin
Children in Household Year Because Trying to Quit 47% 43% 47% 40% West Allis/West Milwaukee 2012
 Men s Health (40 and Older) Alcohol Use in Past Month West Allis/West Milwaukee 2006 2009 2012 West Allis/West Milwaukee 2003 2006 2009 2012 Prostate Cancer Screening Binge Drinker 18% 21% 24% 30% Within
Children in Household Year Because Trying to Quit 30% 68% 51% 69% Hales Corners 2012
 Men s Health (40 and Older) Alcohol Use in Past Month Hales Corners 2006 2009 2012 Hales Corners 2003 2006 2009 2012 Prostate Cancer Screening Binge Drinker 13% 20% 20% 24% Within Past 2 Years 63% 70%
Children in Household Year Because Trying to Quit 43% 52% 43% 57% South Milwaukee 2012
 Men s Health (40 and Older) Alcohol Use in Past Month South Milwaukee 2006 2009 2012 South Milwaukee 2003 2006 2009 2012 Prostate Cancer Screening Binge Drinker 16% 20% 23% 38% Within Past 2 Years 70%
Texas Chronic Disease Burden Report. April Publication #E
 Texas Chronic Disease Burden Report April 2010 Publication #E81-11194 Direction and Support Lauri Kalanges, MD, MPH Medical Director Health Promotion and Chronic Disease Prevention Section, Texas Department
Steps to a Healthier Cleveland Youth Risk Behavior Survey
 2007 Steps to a Healthier Cleveland Youth Risk Behavior Survey Center for Adolescent Health Case Western Reserve University Department of Family Medicine TABLE OF CONTENTS Acknowledgements... 3 Overview...
Children in Household Year Because Trying to Quit 45% 20% 45% 43% Greenfield 2012
 Men s Health (40 and Older) Alcohol Use in Past Month Greenfield 2006 2009 2012 Greenfield 2003 2006 2009 2012 Prostate Cancer Screening Binge Drinker 17% 25% 19% 28% Within Past 2 Years 59% 65% 68% Driver/Passenger
Korean CHRNA (Community Health Resources and Needs Assessment)
") Korean CHRNA (Community Health Resources and Needs Assessment) Between November 2013 and August 2014, the Center for the Study of Asian American Health (CSAAH) collected 161 surveys in the Korean community
Korean CHRNA (Community Health Resources and Needs Assessment) Between November 2013 and August 2014, the Center for the Study of Asian American Health (CSAAH) collected 161 surveys in the Korean community
The Health of the Santa Barbara County Community
 The Health of the Santa Barbara County Community WHAT IS OUR COMMUNITY S CURRENT HEALTH? WHAT ARE PRIORITY AREAS TO FOCUS FOR IMPROVEMENT? HOW CAN WE IMPROVE HEALTH IN OUR COMMUNITY? What is Health? Health
Behavioral Risk Factor Surveillance Survey
 Licking County Health Department Community Health Assessment Data Behavioral Risk Factor Surveillance Survey 28 A key strategic objective of the Licking County Health Department is to Monitor health status
Community Health Needs Assessment Centra Southside Medical Center
 Community Health Needs Assessment Centra Southside Medical Center 2017-2019 Healthy People 2020 Healthy People provides a framework for prevention for communities in the U.S. Healthy People 2020 is a comprehensive
FACT SHEET % 15.0% Percent 10.0%
 FACT SHEET The Branch addresses the impact of diabetes in Alabama by developing, policies, recommendations, and programs about the disease and related issues. The program is funded through a five-year
Indian CHRNA (Community Health Resources and Needs Assessment)
") (Community Health Resources and Needs Assessment) Between 2014 and 2015, the Center for the Study of Asian American Health collected 113 surveys in the Indian community in NYC in partnership with community
(Community Health Resources and Needs Assessment) Between 2014 and 2015, the Center for the Study of Asian American Health collected 113 surveys in the Indian community in NYC in partnership with community
Health Risk Behaviors in the State of Michigan Behavioral Risk Factor Survey. 19th Annual Report
 Health Risk Behaviors in the State of Michigan 2005 Behavioral Risk Factor Survey 19th Annual Report 2005 Behavioral Risk Factor Survey Health Risk Behaviors in the State of Michigan www.michigan.gov/brfs