Children in Household Year Because Trying to Quit 45% 20% 45% 43% Greenfield 2012
|
|
|
- Meghan Griffith
- 5 years ago
- Views:
Transcription
1
2 Men s Health (40 and Older) Alcohol Use in Past Month Greenfield Greenfield Prostate Cancer Screening Binge Drinker 17% 25% 19% 28% Within Past 2 Years 59% 65% 68% Driver/Passenger When Driver Perhaps Had Too Much to Drink 6% <1% 1% 3% Colorectal Cancer Screenings (50 and Older) Greenfield Other Research: (2010) WI U.S. Blood Stool Test (within past year) 34% 20% -- 14% Binge Drinker 22% 15% Sigmoidoscopy (within past 5 years) 11% 8% Colonoscopy (within past 10 years) 64% 69% Household Problems Associated With Screening in Recommended Time Frame 66% 72% Greenfield Alcohol 3% 1% 3% Cigarette Use Cocaine, Heroin or Other Street Drugs 1% Greenfield Misuse of Prescription or OTC Drugs <1% Current Smokers (past 30 days) 22% 17% 21% 11% Gambling <1% Other Tobacco Products (past 30 days) 4% Marijuana 0% Of Current Smokers Quit Smoking 1 Day or More in Past Children in Household Year Because Trying to Quit 45% 20% 45% 43% Greenfield 2012 Saw a Health Care Professional Past Year Personal Health Doctor/Nurse who And Advised to Quit Smoking 44% 59% 90% Knows Child Well and Familiar with History 83% Visited Personal Health Professional for Other Research: WI U.S. Preventive Care (past 12 months) 81% Current Smokers (2010) 19% 17% Did Not Receive Care Needed (past 12 months) Tried to Quit (2005) 49% 56% Dental Care 16% Medical Care 0% Exposure to Smoke Specialist 0% Greenfield Current Asthma 16% Smoking Policy at Home Safe in Community/Neighborhood (seldom/never) 0% Not allowed anywhere 72% 82% Children 5 to 17 Years Old Allowed in some places or at some times 8% 7% Fruit Intake (2+ servings/day) 73% Allowed anywhere 4% <1% Vegetable Intake (3+ servings/day) 15% No rules inside home 17% 11% Physical Activity (60 min/5 or more days) 65% Nonsmokers Second-Hand Smoke Children 8 to 17 Years Old Exposure in Past Seven Days 35% 15% Unhappy, Sad or Depressed Always/Nearly Always (past 6 months) 0% Other Research: (WI: 2003; US: ) WI U.S. Experienced Some Form of Bullying (past 12 months) 25% Smoking Prohibited at Home 75% 79% Verbally Bullied 21% Cyber Bullied 9% Mental Health Status Physically Bullied 8% Greenfield Felt Sad, Blue or Depressed Community Health Issues Always/Nearly Always (past 30 days) 6% 5% 10% 4% Greenfield 2012 Find Meaning and Purpose in Daily Life Alcohol or Drug Use 59% Seldom/Never 8% 6% 7% 6% Chronic Diseases 56% Considered Suicide (past year) <1% 4% 6% 2% Violence 51% Teen Pregnancy 41% Personal Safety in Past Year Infectious Diseases 26% Greenfield Infant Mortality 23% Afraid for Their Safety 4% 7% 9% 4% Mental Health or Depression 21% Pushed, Kicked, Slapped, or Hit 2% 2% 4% 2% Lead Poisoning 1% At Least One of the Safety Issues 5% 8% 9% 5% --Not asked in 2009 Greenfield Community Health Survey Summary
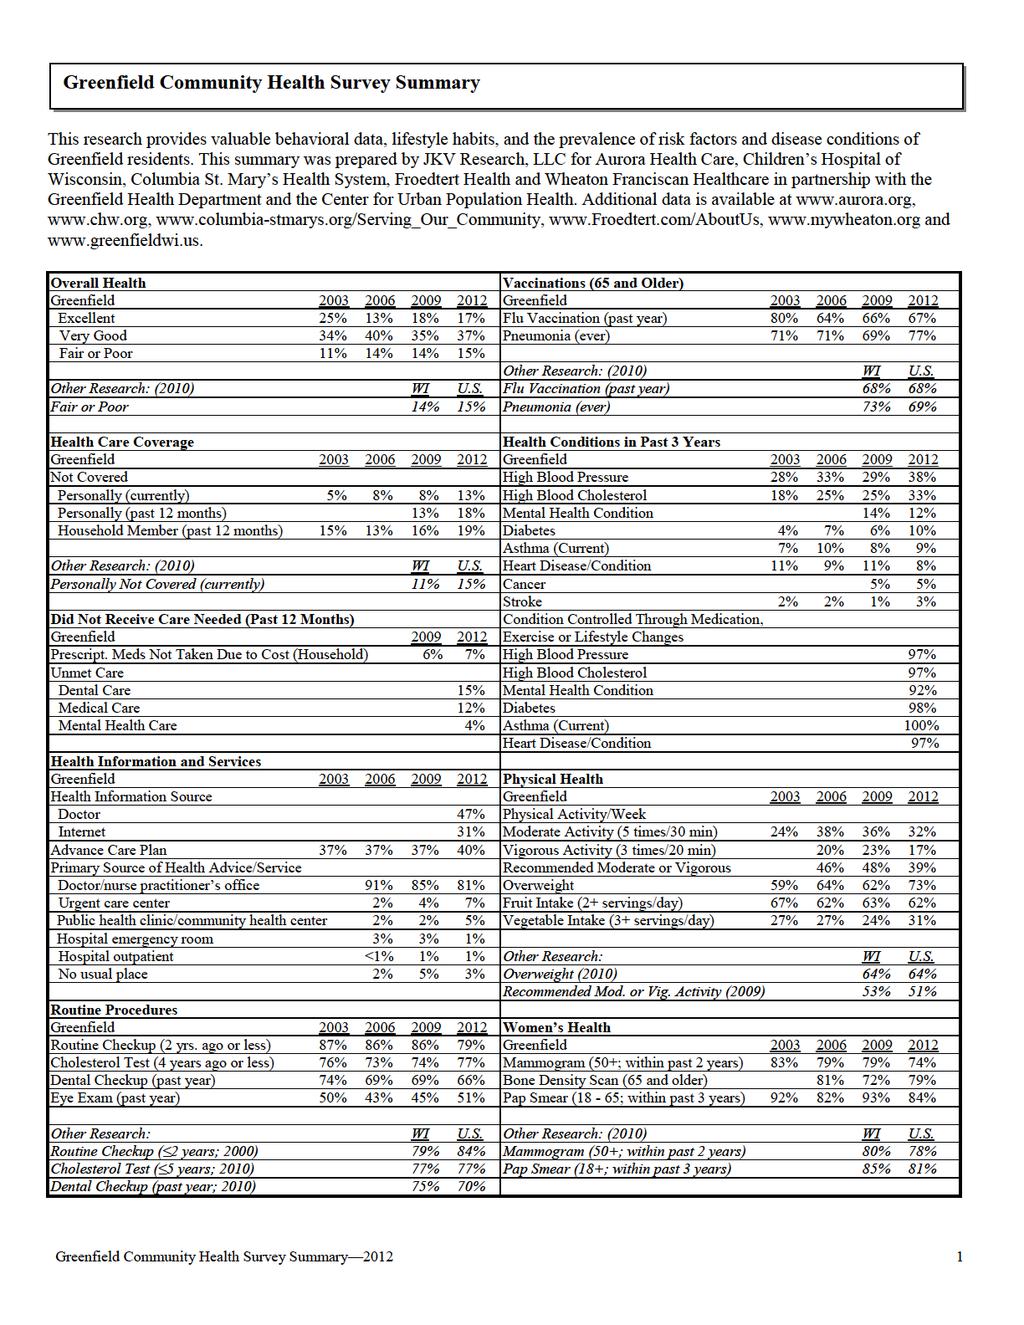
3 Overall Health and Health Care Key Findings In 2012, 54% of respondents reported their health as excellent or very good; 15% reported fair or poor. Respondents who were in the bottom 40 percent household income bracket, unmarried, inactive or smokers were more likely to report fair or poor conditions. From 2003 to 2012, there was no statistical change in the overall percent of respondents who reported their health as fair or poor. In 2012, 13% of respondents reported they were not currently covered by health care insurance; respondents who were 18 to 34 years old, with a high school education or less or who were unmarried were more likely to report this. Eighteen percent of respondents reported they personally did not have health care coverage at least part of the time in the past 12 months; respondents who were male, 18 to 44 years old, with a high school education or less or unmarried were more likely to report this. Nineteen percent of respondents reported someone in their household was not covered at least part of the time in the past 12 months; respondents who were in the bottom 40 percent household income bracket or unmarried were more likely to report this. From 2003 to 2012, the overall percent statistically increased for respondents 18 and older as well as for respondents 18 to 64 years old who reported no current personal health care insurance. From 2009 to 2012, the overall percent statistically remained the same for respondents who reported no personal health care insurance at least part of the time in the past 12 months. From 2003 to 2012, the overall percent statistically remained the same for respondents who reported someone in the household was not covered at least part of the time in the past 12 months. In 2012, 7% of respondents reported that someone in their household had not taken their prescribed medication due to prescription costs in the past 12 months; respondents in households with children were more likely to report this. Fifteen percent of respondents reported that they did not get the dental care they needed sometime in the last 12 months; respondents who were 18 to 34 years old, with some post high school education or married were more likely to report this. Twelve percent of respondents reported that they did not get the medical care they needed sometime in the last 12 months; respondents who were female or 45 to 54 years old were more likely to report this. Four percent of respondents reported that they did not get the mental health care they needed sometime in the last 12 months; respondents who were 45 to 54 years old, with some post high school education or in the bottom 60 percent household income bracket were more likely to report this. From 2003 to 2012, there was no statistical change in the overall percent of respondents reporting in the past 12 months someone in the household had not taken their prescribed medication due to prescriptions costs. In 2012, 47% of respondents reported they receive most of their health information from a doctor followed by 31% who reported the internet. Eighty-one percent of respondents reported their primary place for health services was from a doctor s or nurse practitioner s office; respondents who were female, 45 and older, in the middle 20 percent household income bracket or married were more likely to report this. Forty percent of respondents had an advance care plan; respondents 65 and older were more likely to report an advance care plan. From 2006 to 2012, there was a statistical decrease in the overall percent of respondents reporting their primary place for health services was from a doctor s or nurse practitioner s office. From 2003 to 2012, there was no statistical change in the overall percent of respondents having an advance care plan. In 2012, 79% of respondents reported a routine medical checkup two years ago or less while 77% reported a cholesterol test four years ago or less. Sixty-six percent of respondents reported a visit to the dentist in the past year while 51% reported an eye exam in the past year. Respondents who were female, 45 and older or with some post high school education were more likely to report a routine checkup two years ago or less. Respondents who were 45 and older, in the middle 20 percent household income bracket or married were more likely to report a cholesterol test four years ago or less. Respondents 45 to 54 years old, with some post high school education, in the top 40 percent household income bracket or who were married were more likely to report a dental checkup in the past year. Respondents 65 and older or with a high school education or less were more likely to report an eye exam in the past year. From 2003 to 2012, there was a statistical decrease in the overall percent of respondents reporting a routine checkup two years ago or less or a dental checkup in the past year. From 2003 to 2012, there was no statistical change in the overall percent of respondents reporting a cholesterol test four years ago or less or an eye exam in the past year. Greenfield Community Health Survey Summary
4 In 2012, 37% of respondents had a flu vaccination in the past year. Respondents who were female or 65 and older were more likely to report a flu vaccination. Seventy-seven percent of respondents 65 and older had a pneumonia vaccination in their lifetime. From 2003 to 2012, there was no statistical change in the overall percent of respondents 18 and older who reported a flu vaccination in the past 12 months. From 2003 to 2012, there was a statistical decrease in the overall percent of respondents 65 and older who reported a flu vaccination in the past 12 months. From 2003 to 2012, there was no statistical change in the overall percent of respondents 65 and older who had a pneumonia vaccination. Health Risk Factors Key Findings In 2012, out of eight health conditions listed, the two most often mentioned in the past three years were high blood pressure or high blood cholesterol (38% and 33%, respectively). Respondents who were female, 65 and older, with some post high school education or less, who were in the bottom 40 percent household income bracket, unmarried, overweight or inactive were more likely to report high blood pressure. Respondents who were male, 55 to 64 years old, with a high school education or less, who were in the middle 20 percent household income bracket or inactive were more likely to report high blood cholesterol. Respondents who were 65 and older, not overweight or inactive were more likely to report heart disease/condition. Respondents who were 45 to 64 years old, in the bottom 40 percent household income bracket or unmarried were more likely to report a mental health condition. Respondents who were 55 and older, overweight or inactive were more likely to report diabetes. Respondents who were female or unmarried were more likely to report current asthma. From 2003 to 2012, there was a statistical increase in the overall percent of respondents who reported high blood pressure, high blood cholesterol or diabetes. From 2003 to 2012, there was no statistical change in the overall percent of respondents who reported heart disease/condition, current asthma or stroke. From 2009 to 2012, there was no statistical change in the overall percent of respondents who reported a mental health condition or cancer. In 2012, 4% of respondents reported they always or nearly always felt sad, blue or depressed in the past 30 days; female respondents were more likely to report this. Two percent of respondents felt so overwhelmed they considered suicide in the past year. Six percent of respondents reported they seldom or never find meaning and purpose in daily life; respondents who were male, 55 to 64 years old, with a high school education or less, in the bottom 40 percent household income bracket or unmarried were more likely to report this. From 2003 to 2012, there was no statistical change in the overall percent of respondents who reported they always or nearly always felt sad, blue or depressed or they seldom/never find meaning and purpose in daily life. From 2003 to 2012, there was a statistical increase in the overall percent of respondents who reported they considered suicide. Behavioral Risk Factors Key Findings In 2012, 32% of respondents did moderate physical activity five times a week for 30 minutes while 17% did vigorous activity three times a week for 20 minutes. Combined, 39% met the recommended amount of physical activity; respondents with some post high school education, in the top 40 percent household income bracket or married respondents were more likely to report this. Seventy-three percent of respondents were classified as overweight. Respondents who were male, 45 to 64 years old, with a high school education or less, in the middle 20 percent household income bracket or inactive were more likely to be classified as overweight. From 2003 to 2012, there was a statistical increase in the overall percent of respondents who reported moderate physical activity five times a week for at least 30 minutes. From 2006 to 2012, there was no statistical change in the overall percent of respondents who reported vigorous physical activity three times a week for at least 20 minutes. From 2006 to 2012, there was a statistical decrease in the overall percent of respondents who met the recommended amount of physical activity. From 2003 to 2012, there was a statistical increase in the overall percent of respondents being overweight. In 2012, 62% of respondents reported two or more servings of fruit while 31% reported three or more servings of vegetables on an average day. Respondents who were female or did an insufficient amount of physical activity were more likely to report at least two servings of fruit. Respondents who were female, 45 to 54 years old, overweight or met the recommended amount of physical activity were more likely to report at least three servings of vegetables on an average Greenfield Community Health Survey Summary
5 day. From 2003 to 2012, there was no statistical change in the overall percent of respondents who reported at least two servings of fruit on an average day or at least three servings of vegetables on an average day. In 2012, 74% of female respondents 50 and older reported a mammogram within the past two years. Seventy-nine percent of female respondents 65 and older had a bone density scan. Eighty-four percent of female respondents 18 to 65 years old reported a pap smear within the past three years; respondents 35 to 44 years old or with some post high school education or less were more likely to report this. From 2003 to 2012, there was no statistical change in the overall percent of respondents 50 and older who reported having a mammogram within the past two years. From 2006 to 2012, there was no statistical change in the overall percent of respondents 65 and older who reported a bone density scan. From 2003 to 2012, there was a statistical decrease in the overall percent of respondents 18 to 65 years old who reported having a pap smear within the past three years. In 2012, 68% of male respondents 40 and older had a prostate cancer screening within the past two years with either a digital rectal exam (DRE) or a prostate-specific antigen (PSA) test. From 2006 to 2012, there was no statistical change in the overall percent of male respondents 40 and older who reported a prostate cancer screening within the past two years. In 2012, 14% of respondents 50 and older reported a blood stool test within the past year. Eight percent of respondents 50 and older reported a sigmoidoscopy within the past five years while 69% reported a colonoscopy within the past ten years. This results in 72% of respondents meeting current colorectal cancer screening recommendations. From 2003 to 2012, there was a statistical decrease in the overall percent of respondents who reported a blood stool test within the past year. From 2009 to 2012, there was no statistical change in the overall percent of respondents who reported a sigmoidoscopy within the past five years or a colonoscopy within the past ten years. From 2009 to 2012, there was no statistical change in the overall percent of respondents who reported at least one of these tests in the recommended time frame. In 2012, 11% of respondents were current smokers; respondents with some post high school education or less or in the bottom 40 percent household income bracket were more likely to be a smoker. Four percent reported other tobacco use such as cigars, pipes, chewing tobacco or snuff in the past 30 days; respondents who were male or with some post high school education were more likely to report this. In the past 12 months, 43% of current smokers quit smoking for one day or longer because they were trying to quit. Ninety percent of current smokers who saw a health professional in the past year reported the professional advised them to quit smoking. From 2003 to 2012, there was a statistical decrease in the overall percent of respondents who were current smokers. From 2003 to 2012, there was no statistical change in the overall percent of current smokers who reported they quit smoking for one day or longer in the past 12 months because they were trying to quit. From 2006 to 2012, there was a statistical increase in the overall percent of current smokers who reported their health professional advised them to quit smoking. In 2012, 82% of respondents reported smoking is not allowed anywhere inside the home. Respondents who were in the top 40 percent household income bracket or nonsmokers were more likely to report smoking is not allowed anywhere inside the home. Fifteen percent of nonsmoking respondents reported they were exposed to second-hand smoke in the past seven days; respondents who were male, 35 to 44 years old, in the bottom 40 percent household income bracket or unmarried were more likely to report this. From 2009 to 2012, there was a statistical increase in the overall percent of respondents who reported smoking is not allowed anywhere inside the home. From 2009 to 2012, there was a statistical decrease in the overall percent of respondents who reported they were exposed to second-hand smoke in the past seven days. In 2012, 28% of respondents were binge drinkers in the past month. Respondents 18 to 34 years old or with some post high school education were more likely to have binged at least once in the past month. Three percent reported they had been a driver or a passenger in the past month when the driver perhaps had too much to drink. From 2003 to 2012, there was a statistical increase in the overall percent of respondents who reported binge drinking in the past month. From 2003 to 2012, there was a statistical decrease in the overall percent of respondents who reported in the past month they were a driver or passenger when the driver perhaps had too much to drink. Greenfield Community Health Survey Summary
6 In 2012, 3% of respondents reported someone in their household experienced a legal, social, personal or physical problem in the past year in connection with drinking. One percent of respondents reported someone in their household experienced a problem in connection with cocaine/heroin/other street drugs while less than one percent of respondents each reported misuse of prescription drugs/over-the-counter drugs or gambling. Zero percent of respondents reported someone in their household experienced a problem in connection with marijuana use. From 2006 to 2012, there was no statistical change in the overall percent of respondents reporting they, or someone in their household, experienced some kind of problem, such as legal, social, personal or physical, in connection with drinking in the past year. In 2012, 4% of respondents reported someone made them afraid for their personal safety in the past year. Two percent of respondents reported they had been pushed, kicked, slapped or hit in the past year. A total of 5% reported at least one of these two situations; respondents 45 to 54 years old were more likely to report this. From 2003 to 2012, there was no statistical change in the overall percent of respondents reporting they were afraid for their personal safety or they were pushed, kicked, slapped or hit. From 2003 to 2012, there was no statistical change in the overall percent of respondents reporting at least one of the two personal safety issues. Children in Household In 2012, a random child was selected for the respondent to talk about the child s health issues. Eighty-three percent of respondents reported they have one or more persons they think of as their child s personal doctor or nurse, with 81% reporting their child visited their personal doctor or nurse for preventive care during the past 12 months. Sixteen percent of respondents reported there was a time in the last 12 months their child did not receive the dental care needed while 0% of respondents each reported their child did not receive the medical care needed or their child did not visit a specialist they needed to see. Seventy-three percent of respondents reported their 5 to 17 year old child ate two or more servings of fruit on an average day while 15% reported three or more servings of vegetables. Sixty-five percent of respondents reported their 5 to 17 year old child was physically active five times a week for 60 minutes. Sixteen percent of respondents reported their child currently had asthma. Zero percent of respondents reported their 8 to 17 year old child always or nearly always felt unhappy, sad or depressed in the past six months. Zero percent of respondents reported their child was seldom or never safe in their community or neighborhood. Twenty-five percent reported their 8 to 17 year old child experienced some form of bullying in the past 12 months. Twenty-one percent reported verbal bullying, 9% reported cyber bullying and 8% reported physical bullying. Community Health Issues In 2012, respondents were asked to pick the top three health issues in the area out of eight listed. The most often cited were alcohol or drug use (59%), chronic diseases (56%) and violence (51%). Respondents 55 to 64 years old were more likely to report alcohol or drug use. Respondents with a college education were more likely to report violence. Respondents who were 18 to 34 years old, with a high school education or less or in the middle 20 percent household income bracket were more likely to report teen pregnancy. Respondents with some post high school education or less were more likely to report infectious diseases. Respondents with a college education were more likely to report infant mortality. Respondents with at least some post high school education were more likely to report mental health or depression as one of the top health issues. Greenfield Community Health Survey Summary
Children in Household Year Because Trying to Quit 43% 52% 43% 57% South Milwaukee 2012
 Men s Health (40 and Older) Alcohol Use in Past Month South Milwaukee 2006 2009 2012 South Milwaukee 2003 2006 2009 2012 Prostate Cancer Screening Binge Drinker 16% 20% 23% 38% Within Past 2 Years 70%
Children in Household Year Because Trying to Quit 30% 68% 51% 69% Hales Corners 2012
 Men s Health (40 and Older) Alcohol Use in Past Month Hales Corners 2006 2009 2012 Hales Corners 2003 2006 2009 2012 Prostate Cancer Screening Binge Drinker 13% 20% 20% 24% Within Past 2 Years 63% 70%
Children in Household Year Because Trying to Quit 47% 43% 47% 40% West Allis/West Milwaukee 2012
 Men s Health (40 and Older) Alcohol Use in Past Month West Allis/West Milwaukee 2006 2009 2012 West Allis/West Milwaukee 2003 2006 2009 2012 Prostate Cancer Screening Binge Drinker 18% 21% 24% 30% Within
Children in Household Year Because Trying to Quit 53% 55% 58% 66% Milwaukee 2012
 Men s Health (40 and Older) Alcohol Use in Past Month Milwaukee 2006 2009 2012 Milwaukee 2003 2006 2009 2012 Prostate Cancer Screening Binge Drinker 17% 20% 19% 32% Within Past 2 Years 61% 58% 45% Driver/Passenger
Hales Corners Community Health Survey Summary
 Hales Corners Community Health Survey Summary This research provides valuable behavioral data, lifestyle habits, and the prevalence of risk factors and disease conditions of Hales Corners residents. This
North Shore Community Health Survey Summary
 North Shore Community Health Survey Summary This research provides valuable behavioral data, lifestyle habits, and the prevalence of risk factors and disease conditions of North Shore residents. This summary
Walworth County Community Health Survey Summary
 Walworth County Community Health Survey Summary This research provides valuable behavioral data, lifestyle habits, and the prevalence of risk factors and disease conditions of Walworth County residents.
Waukesha County Community Health Survey Report June 2012
 Waukesha County Community Health Survey Report June 2012 Commissioned by: Aurora Health Care Children s Hospital of Wisconsin Froedtert Health ProHealth Care Wheaton Franciscan Healthcare In Partnership
Washington County Community Health Survey Report 2014
 Washington County Community Health Survey Report 2014 Commissioned by: Aurora Health Care Children s Hospital of Wisconsin Froedtert & Medical College of Wisconsin In Partnership with: Center for Urban
MILWAUKEE COUNTY COMMUNITY HEALTH SURVEY 2015
 MILWAUKEE COUNTY COMMUNITY HEALTH SURVEY 2015 Commissioned by: Aurora Health Care Children s Hospital of Wisconsin Columbia St. Mary s Health System Froedtert Health Wheaton Franciscan Healthcare In Partnership
CUDAHY COMMUNITY HEALTH SURVEY 2015
 CUDAHY COMMUNITY HEALTH SURVEY 2015 Commissioned by: Aurora Health Care Children s Hospital of Wisconsin Columbia St. Mary s Health System Froedtert Health Wheaton Franciscan Healthcare In Partnership
WASHINGTON COUNTY COMMUNITY HEALTH SURVEY 2016
 WASHINGTON COUNTY COMMUNITY HEALTH SURVEY 2016 Commissioned by: Aurora Health Care Children s Hospital of Wisconsin Froedtert & Medical College In Partnership with: Center for Urban Population Health Washington
WAUWATOSA COMMUNITY HEALTH SURVEY 2015
 WAUWATOSA COMMUNITY HEALTH SURVEY 2015 Commissioned by: Aurora Health Care Children s Hospital of Wisconsin Columbia St. Mary s Health System Froedtert Health Wheaton Franciscan Healthcare In Partnership
OZAUKEE COUNTY COMMUNITY HEALTH SURVEY 2016
 OZAUKEE COUNTY COMMUNITY HEALTH SURVEY 2016 Commissioned by: Aurora Health Care Children s Hospital of Wisconsin Columbia St. Mary s Health System In Partnership with: Center for Urban Population Health
WAUKESHA COUNTY COMMUNITY HEALTH SURVEY 2017
 WAUKESHA COUNTY COMMUNITY HEALTH SURVEY 2017 Commissioned By: Aurora Health Care Children s Hospital of Wisconsin Froedtert & the Medical College of Wisconsin ProHealth Care Wheaton Franciscan Healthcare
KENOSHA COUNTY COMMUNITY HEALTH SURVEY 2016
 KENOSHA COUNTY COMMUNITY HEALTH SURVEY 2016 Commissioned by: Aurora Health Care Children s Hospital of Wisconsin United Hospital Systems In Partnership with: Center for Urban Population Health Kenosha
KENOSHA COUNTY COMMUNITY HEALTH SURVEY 2014
 KENOSHA COUNTY COMMUNITY HEALTH SURVEY 2014 Commissioned by: Aurora Health Care Children s Hospital of Wisconsin In Partnership with: Center for Urban Population Health Kenosha County Division of Health
WALWORTH COUNTY COMMUNITY HEALTH SURVEY 2016
 WALWORTH COUNTY COMMUNITY HEALTH SURVEY 2016 Commissioned by: Aurora Health Care Children s Hospital of Wisconsin Mercy Health System In Partnership with: Center for Urban Population Health Walworth County
GREENDALE COMMUNITY HEALTH SURVEY 2015
 GREENDALE COMMUNITY HEALTH SURVEY 2015 Commissioned by: Aurora Health Care Children s Hospital of Wisconsin Columbia St. Mary s Health System Froedtert Health Wheaton Franciscan Healthcare In Partnership
GREENDALE COMMUNITY HEALTH SURVEY December 2012
 GREENDALE COMMUNITY HEALTH SURVEY December 2012 Commissioned by: Aurora Health Care Children s Hospital of Wisconsin Columbia St. Mary s Health System Froedtert Health Wheaton Franciscan Healthcare In
SOUTH MILWAUKEE COMMUNITY HEALTH SURVEY 2012
 SOUTH MILWAUKEE COMMUNITY HEALTH SURVEY 2012 Commissioned by: Aurora Health Care Children s Hospital of Wisconsin Columbia St. Mary s Health System Froedtert Health Wheaton Franciscan Healthcare In Partnership
CENTRAL RACINE COUNTY COMMUNITY HEALTH SURVEY July 2012
 CENTRAL RACINE COUNTY COMMUNITY HEALTH SURVEY July 2012 Commissioned by: Aurora Health Care Children s Hospital of Wisconsin Wheaton Franciscan Healthcare In Partnership with: Central Racine County Health
WEST ALLIS/WEST MILWAUKEE COMMUNITY HEALTH SURVEY December 2012
 WEST ALLIS/WEST MILWAUKEE COMMUNITY HEALTH SURVEY December 2012 Commissioned by: Aurora Health Care Children s Hospital of Wisconsin Columbia St. Mary s Health System Froedtert Health Wheaton Franciscan
Winnebago County Community Health Survey Report 2018
 Winnebago County Community Health Survey Report 2018 Commissioned By: Fox Valley Community Health Improvement Coalition Sponsored By: Ascension Aurora Health Care Children s Hospital of Wisconsin ThedaCare
SHEBOYGAN COUNTY COMMUNITY HEALTH SURVEY 2014
 SHEBOYGAN COUNTY COMMUNITY HEALTH SURVEY 2014 Commissioned by: Aurora Health Care Lakeshore Community Health Center St. Nicholas Hospital Sheboygan County Health and Human Services Division of Public Health
Community Health Assessment DRAFT. Implemented Date: Revised Date:
 Implemented Date: Revised Date: FOREWARD Dear Community: Public health is all around us, working to protect the health of entire populations. As our mission statement reads, the Greenfield Health Department
Results of Lahey Health Community Health Needs Assessment Survey: Wenham October, 2012
 Results of Lahey Health Community Health Needs Assessment Survey: October, 2012 Table 1: Number of respondents and response rates by town. Also, reporting average age, gender and household income based
Results of Lahey Health Community Health Needs Assessment Survey: Gloucester October, 2012
 Results of Lahey Health Community Health Needs Assessment Survey: October, 2012 Table 1: Number of respondents and response rates by town. Also, reporting average age, gender, and household income based
Colorado Health Disparities Profiles
 Health Disparities Profiles includes: Larimer County Population Total Population Source: CDC/NCHS 2007-based, bridged-race population estimates, 2007. Social Determinants of Health 287,574 248,312 26,629
Factual Information Contained in this Report: PURPOSE. Health Perceptions. Health Insurance Coverage. Health Care Access. Preventive Health Care
 Factual Information Contained in this Report: Health Perceptions Health Insurance Coverage Health Care Access Preventive Health Care Maternal and Child Health Alcohol, Tobacco, and Other Drug Use PURPOSE
Colorado Health Disparities Profiles
 Health Disparities Profiles County includes: Jackson, Moffat, Rio Blanco, and Counties Population Total Population 22,382 43,638 4,861,515 21,015 39,473 3,508,736 904 3,224 909,833 140 263 228,718 210
Pennsylvania Department of Health 2006 Behavioral Risks of Chester County Adults Page 1
 2006 Behavioral Health Risks Of Adults Healthy Communities Partnership Department of Health 2006 Behavioral Risks of Adults Page 1 Introduction The Centers for Disease Control and Prevention (CDC) and
The Cecil County Community Health Survey 2009 Report
 The Cecil County Community Health Survey 2009 Report May 2010 Cecil County Health Department 401 Bow Street Elkton, Maryland 21921 410-996-5113 www.cecilcountyhealth.org Acknowledgement Thank you again
2010 Community Health Needs Assessment Final Report
 2010 Community Health Needs Assessment Final Report April 2011 TABLE OF CONTENTS A. BACKGROUND 3 B. DEMOGRAPHICS 4 C. GENERAL HEALTH STATUS 10 D. ACCESS TO CARE 11 E. DIABETES 12 F. HYPERTENSION AWARENESS
These are more than words. They are the principles and philosophy that drive every decision that ProMedica makes as an organization.
 Foreword Mission-driven. Community-based. Not-for-profit. These are more than words. They are the principles and philosophy that drive every decision that ProMedica makes as an organization. With people
71 Potential Leading Health Indicators for Healthy Alaskans 2020: Documenting Progress Towards 25 LHIs
 71 Potential Leading Health Indicators for Healthy Alaskans 2020: Documenting Progress Towards 25 LHIs : Documenting Progress Towards 25 LHIs The purpose of this report is to document the data and information
North Mississippi Medical Center
 North Mississippi Medical Center h e a l t h a s s e s s m e n t 2 0 1 3 Lee County Lee County Health Assessment, 2013 August 2013 Preface This health assessment is a source of health information for
2016 Collier County Florida Health Assessment Executive Summary
 2016 Florida Health Assessment Executive Summary Prepared by: The Health Planning Council of Southwest Florida, Inc. www.hpcswf.com Executive Summary To access the report in its entirety, visit http://www.hpcswf.com/health-planning/health-planningprojects/.
Indian CHRNA (Community Health Resources and Needs Assessment)
") (Community Health Resources and Needs Assessment) Between 2014 and 2015, the Center for the Study of Asian American Health collected 113 surveys in the Indian community in NYC in partnership with community
(Community Health Resources and Needs Assessment) Between 2014 and 2015, the Center for the Study of Asian American Health collected 113 surveys in the Indian community in NYC in partnership with community
Do you currently have a family physician?: If not, where have you been getting health care?:
 Adult Intake Form Preferred Location: Cambridge Kitchener Apply Patient Label here First Name: Last Name: Gender: Address: Phone number: Date of Birth: Health Card Number:_ Do you currently have a family
Primary Care Demographic and Medical History Form
 Primary Care Demographic and Medical History Form PATIENT DEMOGRAPHIC INFORMATION: Patient Name: Date of Birth: / / Street Address: City: State: Zip: Home Phone #: Work #: Cell #: Email: Preferred Method
Health Profile Chartbook 2016 Kalkaska County
 Health Profile Chartbook 2016 Kalkaska County 2016 Chartbooks The 2016 Chartbooks provide a snapshot of the health status of the District Health Department #10 jurisdiction. Information is presented by
Health Profile Chartbook 2016 Mecosta County
 Health Profile Chartbook 2016 Mecosta County 2016 Chartbooks The 2016 Chartbooks provide a snapshot of the health status of the District Health Department #10 jurisdiction. Information is presented by
Health System Members of the Milwaukee Health Care Partnership
 Health System Members of the Milwaukee Health Care Partnership Aurora Health Care Children s Hospital of Wisconsin Columbia St. Mary s Health System Froedtert Health Wheaton Franciscan Healthcare In Collaboration
WELLNESS PROGRAM NEEDS & INTEREST SURVEY:
 What is a Wellness Program? Simply put, it is a program designed to help employees stay well. It is the employer providing the tools and resources to allow their employees to lead a healthier life. NEEDS
Bullying Percent of students who have ever been bullied on school property in the past 12 months 28% 22*% 19*% 22.7*% 20.1*% Percent of students who h
 Safety Percent of students who rarely or never wore a helmet when riding a bicycle in the past 12 months 61.80% 64.00% 69*% 87.5*% Percent of students who rarely or never wore a seatbelt when riding in
Korean CHRNA (Community Health Resources and Needs Assessment)
") Korean CHRNA (Community Health Resources and Needs Assessment) Between November 2013 and August 2014, the Center for the Study of Asian American Health (CSAAH) collected 161 surveys in the Korean community
Korean CHRNA (Community Health Resources and Needs Assessment) Between November 2013 and August 2014, the Center for the Study of Asian American Health (CSAAH) collected 161 surveys in the Korean community
Summary of Findings. Significant Health Needs of the Community. Areas of Opportunity Identified Through This Assessment. Healthy Lifestyles
 Summary of Findings Significant Health Needs of the Community The following areas of opportunity represent the significant health needs of the community, based on the information gathered through this
Community Health Status Assessment 2015
 Community Health Status Assessment 2015 Examining the Health of FOREWORD Once again on behalf of the POWER Coalition, I am pleased to present the 2015 Community Health Assessment Report. This report is
Vietnamese CHRNA (Community Health Resources and Needs Assessment)
") Vietnamese CHRNA (Community Health Resources and Needs Assessment) Between 2013 and 2015, the Center for the Study of Asian American Health (CSAAH) and Mekong NYC collected 103 surveys in the Vietnamese
Vietnamese CHRNA (Community Health Resources and Needs Assessment) Between 2013 and 2015, the Center for the Study of Asian American Health (CSAAH) and Mekong NYC collected 103 surveys in the Vietnamese
Executive Summary To access the report in its entirety, visit
 Executive Summary To access the report in its entirety, visit http://www.hpcswf.com/health-planning/health-planningprojects/. Demographic and Socioeconomic Characteristics Population Demographics has a
Community Health Needs Assessment
 Community Health Needs Assessment Scott County, Missouri This assessment will identify the health needs of the residents of Scott County, Missouri, and those needs will be prioritized and recommendations
Community Health Needs Assessment
 Community Health Needs Assessment Gratiot County Community Health Assessment Community Health Assessment Data Sources Primary Data (new data collected first-hand) Community Opinion Survey Provider Opinion
Behavioral Risk Factor Surveillance Survey
 Licking County Health Department Community Health Assessment Data Behavioral Risk Factor Surveillance Survey 28 A key strategic objective of the Licking County Health Department is to Monitor health status
Wellness Along the Cancer Journey: Healthy Habits and Cancer Screening Revised October 2015 Chapter 7: Cancer Screening and Early Detection of Cancer
 Wellness Along the Cancer Journey: Healthy Habits and Cancer Screening Revised October 2015 Chapter 7: Cancer Screening and Early Detection of Cancer Healthy Habits and Cancer Screening Rev 10.20.15 Page
Preventive Services Explained
 Preventive Services Explained Medicare covers many preventive care services without charge. Most of these services have been recommended by the U.S. Preventive Services Task Force. However, which beneficiaries
Cambodian CHRNA (Community Health Resources and Needs Assessment)
") Cambodian CHRNA (Community Health Resources and Needs Assessment) Between 2013 and 2015, the Center for the Study of Asian American Health (CSAAH) and Mekong NYC collected 100 surveys in the Cambodian
Cambodian CHRNA (Community Health Resources and Needs Assessment) Between 2013 and 2015, the Center for the Study of Asian American Health (CSAAH) and Mekong NYC collected 100 surveys in the Cambodian
HOLLERAN Community Health Research & Strategic Planning Burlington County Department of Health
 HOLLERAN Community Health Research & Strategic Planning Burlington County Department of Health Behavioral Risk Factor Surveillance System (BRFSS) Study September 8, 2006 BACKGROUND & METHODOLOGY The Burlington
Himalayan CHRNA (Community Health Resources and Needs Assessment)
") Himalayan CHRNA (Community Health Resources and Needs Assessment) Between November 2013 and August 2014, the Center for the Study of Asian American Health (CSAAH) collected 156 surveys in the Himalayan
Himalayan CHRNA (Community Health Resources and Needs Assessment) Between November 2013 and August 2014, the Center for the Study of Asian American Health (CSAAH) collected 156 surveys in the Himalayan
Community Health Priority: Alcohol & Other Drug Misuse and Abuse
 Alcohol & Other Drug Misuse and Abuse Melissa Dotter, MS Drug Free Communities Coordinator 715.261.1962 melissa.dotter@co.marathon.wi.us Creating a culture in communities where alcohol is used responsibly
2010 Community Health Assessment Yellowstone County, Montana
 2010 Community Health Assessment, Montana EXECUTIVE SUMMARY Sponsored By The Alliance Billings Clinic RiverStone Health St. Vincent Healthcare Prepared by Professional Research Consultants, Inc. (PRC)
Alcohol and Drug Use Among Middle School Students In West Virginia
 Alcohol and Drug Use Among Middle School Students In The 2015 Youth Risk Behavior Survey revealed that the following alcohol and drug use behaviors occurred Alcohol Use 25.7% ever drank alcohol (other
CSR Greater Fargo-Moorhead Community Health Needs Assessment of Residents. August 2015
 2015 Greater Fargo-Moorhead Community Health Needs Assessment of Residents August 2015 Results from a March 2015 generalizable survey of community residents in the Greater Fargo-Moorhead Metropolitan Area
F S. Behavioral Risk Factor Surveillance System 2009/2010. Turning Information into Health
 TARRANT COUNTY B R F S S Behavioral Risk Factor Surveillance System 2009/2010 Turning Information into Health Tarrant County Public Health Safeguarding our community s health Tarrant County Behavioral
Foreword. Sincerely, Health Commissioner
 Foreword We appreciate your interest in the data presented in this publication. It is the result of the 2012 health assessment of adults and youth in. The information collected is reported along with health
A MEASURE OF STUDENT HEALTH IN FORT WORTH ISD
 A MEASURE OF STUDENT HEALTH IN FORT WORTH ISD RESULTS FROM THE AND YOUTH RISK BEHAVIOR SURVEYS AND OUR WORK TO ADDRESS STUDENT HEALTH INDEPENDENT SCHOOL DISTRICT SURVEY SCOPE AND PURPOSE YOUTH RISK BEHAVIOR
Issaquah School District. Highlights from the Healthy Youth Survey (March 1, 2015)
") Highlights from the Healthy Youth Survey (March 1, 2015) 1 Student Participation Blank Space 1356 (90%) of Grade 6 students 1236 (86%) of Grade 8 students 1018 (75%) of Grade 10 students 784 (59%) of Grade
Highlights from the Healthy Youth Survey (March 1, 2015) 1 Student Participation Blank Space 1356 (90%) of Grade 6 students 1236 (86%) of Grade 8 students 1018 (75%) of Grade 10 students 784 (59%) of Grade
Community Health Needs Assessment PREPARED BY
 Community Health Needs Assessment PREPARED BY DEAR COMMUNITY PARTNERS We all know that good health is essential for a productive and thriving community. Furthermore, we understand that conditions in the
Adult Health History for NEW Patients
 Adult Health History for NEW Patients Your answers on this form will help your health care provider get an accurate history of your medical concerns and conditions. If you are a current patient there is
MetroWest Adolescent Health Survey
 MetroWest Adolescent Health Survey Informing data driven school and community health policies and practices 2016 High School Report GRADES 9-12 Spring 2017 Funded by: MetroWest Health Foundation Submitted
Cancer Facts for Men FOR REVIEW ONLY
 Cancer Facts for Men Prostate cancer The chance of getting prostate cancer goes up as a man gets older. Most prostate cancers are found in men over the age of 65. For reasons that are still unknown, African
An affiliate of Saint Mary's Health System FRANKLIN MEDICAL GROUP, PC. NEW PATIENT INTAKE FORM. Last Name: First Name: DOB: Age:
 FRANKLIN MEDICAL GROUP, PC. NEW PATIENT INTAKE FORM Last Name: First Name: DOB: Age: Date of Service: Present Occupation: Marital Status: Married Divorced Single Widowed Partnered List household Members
Medicare Health Risk Assessment/Questionnaire
 Medicare Health Risk Assessment/Questionnaire (Welcome to Medicare and Wellness Visits) Please complete the questions below. Your responses will help you receive the best health care possible. Check the
Key Informant Meeting JULY 27 TH 2018
 Key Informant Meeting JULY 27 TH 2018 WHAT IS A COMMUNITY HEALTH NEEDS ASSESSMENT (CHNA)? Completed every 3 years, a key component of the Affordable Care Act Required of tax exempt hospitals to get an
2018 Union County Youth Risk Behavior Survey Results
 2018 Union County Youth Risk Behavior Survey Results METHODS The Union County Youth Risk Behavior Survey (YRBS) was previously conducted in 2009,* 2010, 2012, 2014, and 2016. Information gathered from
HealtheCNY Indicator List by Data Source
 American Community Survey 23 Adults with Health Insurance Children Living Below Poverty Level Children with Health Insurance Families Living Below Poverty Level Homeowner Vacancy Rate Homeownership Households
Guidelines for the Early Detection of Cancer
 Guidelines for the Early Detection of Cancer The American Cancer Society recommends these cancer screening guidelines for most adults. Screening tests are used to find cancer before a person has any symptoms.
Tacoma School District. Highlights from the Healthy Youth Survey (March 1, 2017)
") Highlights from the Healthy Youth Survey (March 1, 2017) 1 Student Participation 1,572 (79%) of Grade 6 students 1,522 (77%) of Grade 8 students 885 (45%) of Grade 10 students 625 (33%) of Grade 12 students
Highlights from the Healthy Youth Survey (March 1, 2017) 1 Student Participation 1,572 (79%) of Grade 6 students 1,522 (77%) of Grade 8 students 885 (45%) of Grade 10 students 625 (33%) of Grade 12 students
Sample. Do Not Reproduce
 Table of Contents Section One Staying Well 1. You and Your Health Care Provider...3. Tell & Ask Your Provider Checklists... 3 3. Health Tests & Exams...5 4. Immunization Schedule & Record...6 5. Alcohol
PRE-VISIT QUESTIONNAIRE FOR NEW PATIENTS
 UF Health Senior Care PO Box 100383 Gainesville, FL 32608 352-265-0615 Fax 352-294-5803 PRE-VISIT QUESTIONNAIRE FOR NEW PATIENTS Please complete this questionnaire at home and bring it with you to the
York Region. Student Drug Use and Health
 Student Drug Use and Health Report 13-15 2 An accessible version of this document is available upon request. Contents About the data... 4 A snapshot of health in secondary students... 5 Background and
Leeds, Grenville & Lanark Community Health Profile: Healthy Living, Chronic Diseases and Injury
 Leeds, Grenville & Lanark Community Health Profile: Healthy Living, Chronic Diseases and Injury Executive Summary Contents: Defining income 2 Defining the data 3 Indicator summary 4 Glossary of indicators
PHACS County Profile Report for Searcy County. Presented by: Arkansas Center for Health Disparities and Arkansas Prevention Research Center
 PHACS County Profile Report for Searcy County Presented by: Arkansas Center for Health Disparities and Arkansas Prevention Research Center Contents Introduction... Page 2 Demographics...Page 3 Social Environment
Ottawa County Community Health Assessment
 2017 Community Health Assessment Examining the health of Released on 08.30.2017 Foreword The members of the Health Partners are pleased to present the 2017 health assessment of our community. This comprehensive
Behavioral Risk Factors in Adults
 Behavioral Risk Factors in Adults Behavioral risk factors are behaviors that increase the possibility of disease, such as smoking, alcohol use, bad eating habits, and not getting enough exercise. Because
We look forward to seeing you. Please feel free to call us with any questions.
 1227 E. 9th Street Edmond, OK 73034 Phone: (405) 475-0100 Fax: (405) 475-9275 https://susandimickmd.com Welcome to Dr. Dimick s Office. We appreciate the opportunity to provide your health care needs.
2016 PRC Community Health Needs Assessment
 2016 PRC Community Health Needs Assessment Staunton City, Waynesboro City, and Augusta County, Virginia Prepared for: Augusta Health By Professional Research Consultants, Inc. The PRC Community Health
EXECUTIVE SUMMARY West Virginia Youth Risk Behavior Survey Results of High School Students. By Chad Morrison, January Male Female.
 Grade Sex EXECUTIVE SUMMARY 2013 West Virginia Youth Risk Behavior Survey Results of High School Students By Chad Morrison, January 2015 The Youth Risk Behavior Surveillance System was developed by the
Patient Intake Form. Male Female Employment Status Employer Employer Address Employed
 Thank you for choosing Community Hospital-Fairfax Family Medicine Clinics. We are delighted to provide your care. If you are a patient of the Rock Port, Tarkio or Fairfax Clinics, please complete this
2016 Union County Youth Risk Behavior Survey Results. April 20, 2016
 2016 Union County Youth Risk Behavior Survey Results April 20, 2016 Methods The Union County Youth Risk Behavior Survey (YRBS) was previously conducted in 2009,* 2010, 2012, and 2014. Information gathered
2014 School Trend Report Hinsdale Middle School Hinsdale
 2014 School Trend Report Hinsdale Middle School Hinsdale 2014 Trend Report for Hinsdale Middle School Page 1 of 53 Introduction Your IYS Trend Report provides information for selected IYS indicators that
Nutrition and Physical Activity
 Nutrition and Physical Activity Lifestyle choices made early in life have a significant impact on the patterns of chronic disease developed in adulthood. In the U.S., poor diet and physical inactivity
Youth Risk Behavior Survey
 Youth Risk Behavior Survey 2011 For more information regarding this report, contact: David Jones Wright State University 3640 Colonel Glenn Hwy. Dayton OH 45435-0001 Phone: (937) 775-2941 Fax: (937) 775-2422
Wellness Preventive Health Guide
 Wellness Preventive Health Guide Protect Your Health with Good Preventive Care Plan Now for Better Health One of the best ways to maintain good health and lower the risk of future health concerns for you
2014 District Trend Report Hinsdale CCSD 181
 2014 District Trend Report Hinsdale CCSD 181 2014 Trend Report for Hinsdale CCSD 181 Page 1 of 54 Introduction Your IYS Trend Report provides information for selected IYS indicators that reflect changes
Steps to a Healthier Cleveland Youth Risk Behavior Survey
 2007 Steps to a Healthier Cleveland Youth Risk Behavior Survey Center for Adolescent Health Case Western Reserve University Department of Family Medicine TABLE OF CONTENTS Acknowledgements... 3 Overview...
El Paso County Health Indicators 2012 Report
 El Paso County Health Indicators 2012 Report El Paso County Health Indicators 2012 Report The print report is available on El Paso County Public Health s website: www.elpasocountyhealth.org These slides