An Evaluation of Data from Drivers Arrested for Driving Under the Influence in Relation to Per se Limits for Cannabis
|
|
|
- Gertrude Holt
- 6 years ago
- Views:
Transcription

1 Saving lives through research and education An Evaluation of Data from Drivers Arrested for Driving Under the Influence in Relation to Per se Limits for Cannabis May th Street, NW, Suite 201 Washington, DC AAAFoundation.org
2 Title An Evaluation of Data from Drivers Arrested for Driving Under the Influence in Relation to Per se Limits for Cannabis. (May 2016) Authors Barry Logan, Ph.D., F-ABFT 1, Sherri L. Kacinko, Ph.D., F-ABFT 1, Douglas J. Beirness, Ph.D. 2 1Center for Forensic Science Research and Education 2Beirness and Associates, Inc. About the Sponsor AAA Foundation for Traffic Safety th Street, NW, Suite 201 Washington, DC Founded in 1947, the AAA Foundation in Washington, D.C. is a not-for-profit, publicly supported charitable research and education organization dedicated to saving lives by preventing traffic crashes and reducing injuries when crashes occur. Funding for this report was provided by voluntary contributions from AAA/CAA and their affiliated motor clubs, from individual members, from AAA-affiliated insurance companies, as well as from other organizations or sources. This publication is distributed by the AAA Foundation for Traffic Safety at no charge, as a public service. It may not be resold or used for commercial purposes without the explicit permission of the Foundation. It may, however, be copied in whole or in part and distributed for free via any medium, provided the AAA Foundation is given appropriate credit as the source of the material. The AAA Foundation for Traffic Safety assumes no liability for the use or misuse of any information, opinions, findings, conclusions, or recommendations contained in this report. If trade or manufacturer s names are mentioned, it is only because they are considered essential to the object of this report and their mention should not be construed as an endorsement. The AAA Foundation for Traffic Safety does not endorse products or manufacturers. 2016, AAA Foundation for Traffic Safety
3 Executive Summary Cannabis is in the spotlight in the United States due to increased levels of acceptance of its use for medical treatment, and for recreational use. Increasingly, states are proposing changes to their laws through legislative action or voter initiative to decriminalize and legalize its use. One of the major concerns shared by both opponents and proponents of greater access to cannabis is its impact on driver performance and relationship to adverse effects on traffic safety. While the exact relationship between cannabis use and increased risk for crash involvement remains unclear, both sides recognize that the cognitive and psychomotor effects of cannabis use in the period immediately after use can impact vehicle control and judgment and present some risk for deterioration in driving performance. These concerns have led to a strong desire among lawmakers and traffic safety advocates to consider laws that criminalize cannabis-involved driving including laws that set a quantitative threshold for concentration of delta-9-tetrahydrocannabinol (THC), the primary active component of cannabis, in a person s blood. This threshold would constitute an offense per se in an effort to discourage cannabis-impaired driving. What that threshold should be is a subject of much debate, and this study was undertaken to determine whether data from the Drug Recognition Expert (DRE) program consisting of physiological indicators of drug use, and performance in roadside cognitive and psychomotor tests, supported any particular quantitative threshold for a per se law for THC. Data from two sources were evaluated: 602 drivers arrested for impaired driving in which only THC was present, along with a sample of 349 drug-free controls, in which full records of the subjects performance in the DRE exam were available; and 4,799 drivers arrested for impaired driving who tested positive for one or more cannabinoids (THC, hydroxy-thc, and carboxy-thc), and for which demographic information and comprehensive toxicology testing results were available. DRE Data Evaluation of indicators from the DRE arrestees compared to drug free controls indicated poorer performance in the psychophysical tests for impairment (walk-and-turn test, oneleg-stand test, and finger-to-nose test). On the walk-and-turn test, 55.5 percent of drug free subjects were able to complete the test without errors while only 6.0 percent of the cannabis-positive subjects were able to do so. In the one-leg-stand test, 67.2 percent of drugfree subjects were able to complete the test with no errors, while only 24 percent of the cannabis-positive drivers were able to do so. On the finger-to-nose test 49.2 percent of the drug-free subjects performed the test without errors, compared to only 5.2 percent of the cannabis-positive subjects. Indicators of red, bloodshot and watery eyes, eyelid tremor, lack of convergence and rebound dilation all showed significantly greater (p<0.001) incidence in the cannabis-positive subjects. Cannabis-positive subjects were also more likely to have higher systolic blood pressure and higher pulse rates. Having established differences in these parameters between cannabis-positive and negative subjects, we evaluated the relationship between blood THC concentration and performance on tests for impairment. We performed a bivariate correlation analysis of the indicators as a function of blood THC concentration. Neither the walk-and-turn, nor one-leg-stand tests showed increasing rates of error as a function of THC concentration across the range 1 to 47 1
4 ng/ml. Only the finger-to-nose test showed that subjects with higher THC concentrations made a greater number of misses than the subjects with lower THC concentrations. A chi-squared analysis of the same data was conducted considering whether indicators of impairment differed between subjects with blood THC concentrations above or below 5 ng/ml, the threshold for per se driving under the influence of cannabis adopted in Colorado, Washington, and Montana. No differences were found in performance in the walk-and-turn, or one-leg-stand tests, according to whether subjects were in the higher (>5 ng/ml), or lower (<5 ng/ml) THC groups. The number of misses on the finger-to-nose test was higher in the elevated THC group. We evaluated through logistic regression analysis whether the physiological, cognitive and psychomotor indicators from the DRE exam could predict THC concentration above or below a 5 ng/ml threshold and they could not. Additionally, assuming the validity of a 5 ng/ml threshold as defining impaired versus non-impaired subjects, we evaluated whether performance on any of the physiological, cognitive or psychomotor indicators correctly assigned the subject to the impaired or non-impaired group. None of the indicators met the 80 percent sensitivity threshold for correctly predicting impairment status. Analysis of the sensitivity, specificity, and accuracy of various THC concentration threshold suggested the concentration threshold associated with the best sensitivity (80.4%) and accuracy (77.0%) was 1 ng/ml, which also had the lowest specificity (70.2%). Higher THC concentration values reduced sensitivity but increased specificity. DUI Arrests The distribution of THC concentrations in this large arrest population (4,799 subjects), indicated a median THC concentration of 4.0 ng/ml, which was telling in itself indicating that 50 percent of these subjects placed under arrest based on evidence of suspected impaired driving had blood THC concentrations of 4.0 ng/ml or below, significantly below the proposed or enacted THC per se threshold in some states. The population showed considerable combined alcohol and other drug and cannabis use, with only 23 percent of these DUI drivers being positive only for cannabinoids. Alcohol was present in 59 percent, and other drugs in 33 percent, of these cannabinoid-positive subjects. Of the subjects positive only for cannabis (N=1,117), the median THC concentration was 7.8 ng/ml, and the mean was 5.6 ng/ml. Applying different proposed per se thresholds to this group of drivers positive only for cannabis, 49 percent of drivers would be 5 ng/ml or greater, while 79 percent would be 2 ng/ml or greater, and 91 percent would be 1 ng/ml or greater. Considering the larger population of all subjects arrested for DUI with evidence of cannabis use, only 30 percent would have THC concentrations above a 5 ng/ml threshold. Conclusions There is no evidence from the data collected, particularly from the subjects assessed through the DRE exam, that any objective threshold exists that established impairment, based on THC concentrations measured in specimens collected from cannabis-positive subjects placed under arrest for impaired driving. An association between the presence and degree of indicators of impairment or effect from cannabis use were evident when comparing data from cannabis-positive and cannabis-negative subjects. However, when examining differences in performance in these parameters between subjects with high (>5 2
5 ng/ml) and low (<5 ng/ml) THC concentrations, minimal differences were found. There was no correlation between blood THC concentration and scores on the individual indicators, and performance on the indicators could not reliably assign a subject to the high or low blood THC categories. Analysis of the sensitivity, specificity, and accuracy of various per se thresholds suggested the highest sensitivity was found at 1 ng/ml: 80 percent of drivers who demonstrated impairment on the SFST had THC concentrations of 1 ng/ml or greater. However, 30 percent of drivers who did not demonstrate impairment on the SFST also had THC concentrations of 1 ng/ml or greater. Finally, among both samples of drivers who came into contact with law enforcement and were subsequently placed under arrest for DUI, only percent would have been considered impaired under a per se standard set at 5 ng/ml, depending on whether alcohol or other drugs are detected and taken into consideration. Based on this analysis, a quantitative threshold for per se laws for THC following cannabis use cannot be scientifically supported. 3
6 Introduction Objective The objective of this study was to assess available data from law enforcement agencies regarding their observations of behavioral clues related to cannabis use, and whether there was any correlation between the results of a subsequent quantitative chemical test of the individual s blood specimen, and the presence and degree of the observed effects. Ultimately the goal of the assessment was to determine if the data supported a concentration of delta- 9-tetrahydrocannabinol (THC, the primary active component in the cannabis plant) at which observed impairment becomes more likely. The justification for performing the assessment is the increased interest among traffic safety professionals, forensic toxicologists and legislators regarding the relationship between THC concentration, impairment and crash involvement and how it impacts enforcement practices, expert testimony, and legislation designed to prevent or reduce cannabis-impaired driving. Background Cannabis is a very popular recreational drug, second only to ethanol in its self-reported frequency of use in the United States [1]. It is also the second most frequently encountered drug after alcohol in various driving populations, including randomly surveyed drivers, arrested drivers, trauma patients, and fatally injured drivers [2] [4]. Marijuana is the dried flowers and leaves of the plant cannabis sativa and other related strains, and is typically smoked or vaporized for its psychoactive effects. The plant material itself, or extracts from it, can be concentrated in the form of resin or oil which can also be ingested orally either directly or after being processed into various edible products, including brownies, or candy. We refer in this report to cannabis to mean all products, including plant material, oils, waxes, edibles, and plant extracts derived from the cannabis plant. THC is the major psychoactive component in the cannabis plant. Once ingested, whether through the oral or smoked route, it is distributed through the blood and eventually to the brain, where it exerts its psychoactive effects. THC is a highly lipophilic compound and concentrates readily in fatty tissues including the brain. The body metabolizes or breaks down THC into two principle metabolites; 11-hydroxy-THC (hydroxy-thc) and 11-carboxy- THC (carboxy-thc). The former compound, formed principally in the liver, has psychoactive effects equal to or greater than THC, due to its increased ability to cross the blood-brain barrier. Carboxy-THC is an inactive metabolite [5]. Access to cannabis for medical or recreational purposes has become an increasingly contentious issue throughout North America. Although at the Federal level in the United States, the production, possession, sale and distribution of cannabis is illegal and subject to strict controls and sanctions, its use has become extremely widespread and even normalized in certain segments of the population. Many, particularly youth, view cannabis as a safe substance and a natural medicine used to treat disease and/or relieve the symptoms of a wide variety of medical conditions [6]. As of November 2015, many jurisdictions, including 23 US states and the District of Columbia, have approved the 4
7 possession and use of cannabis for medical purposes 1, and four states (Washington, Colorado, Alaska and Oregon) and the District of Columbia have passed laws or voter initiatives legalizing the possession of small amounts of cannabis for personal use. This situation has created confusion and controversy about the status and safety of cannabis, including its use in relation to driving. There is evidence that cannabis use may be increasing in the driving population. The 2007 National Roadside Survey reported 4.5 and 8.6 percent of daytime and nighttime drivers, respectively, tested positive for cannabis [4]. The survey indicated an increase in nighttime drivers testing positive (12.6%) [7]. Currently, laws governing the use of a motor vehicle following the use of cannabis fall into one of three categories: 1) effect-based laws, 2) per se driving under the influence of drugs (DUID) laws and 3) zero tolerance laws. Effect-based laws require evidence of impairment to be presented in order to convict someone of driving under the influence. Under per se laws, a person is assumed to have committed a violation if the drug concentration exceeds a defined concentration (typically in the blood) and there is no requirement to obtain evidence of impairment beyond that required for the probable cause to obtain the specimen. Under zero tolerance laws, any detectable amount of the proscribed substance in the blood constitutes the offense. From a legislative point of view, per se or zero tolerance laws have some appeal, as they send a message that there is a public safety concern about the practice of drug use and driving, and set an objective standard for what constitutes the offense. This approach potentially makes disposition of cases through the legal system more efficient, since the more qualitative consideration of whether a subject appears impaired is replaced by a numerical cut-off or threshold. The approach however creates other obstacles, such as greater litigation over the laboratory uncertainty or error in making the THC measurement, and the requirement for additional technical or expert testimony at trial. Critically, it also means that a numerical threshold has to be established in the law, and there is by no means consensus among the forensic toxicology, behavioral pharmacology, medical cannabis lobby, and legalization advocates on what the appropriate numerical threshold should be, which compounds should be proscribed under the law, or even which types of specimens (blood, urine or oral fluid) should be permitted. As discussed later, there is no generally agreed upon threshold concentration of THC, as measured at the time of the test which reflects a person s degree of impairment at the time of driving. Setting the threshold too high means that many intoxicated individuals who are arrested, evaluated, and chemically tested end up with drug concentrations below the per se threshold. Setting the threshold too low creates the risk that individuals with a history of regular cannabis use could have THC concentrations in excess of the per se standard, even when they have not recently consumed cannabis. In the case of decriminalization or legalization of cannabis use, a desire to address the potential for driving impairment has led to proposals or adoption of laws with non-evidencebased numerical thresholds ranging from 1 ng/ml to as high as 25 ng/ml in different body fluids. 1 The issue of the medical benefits of marijuana for treating various conditions from seizures and neuropathic pain, to depression is itself contentious and is not the subject of this review. 5
8 The alternative to per se thresholds is the use of an impairment standard, where a person s guilt or innocence is determined by the judge or jury, based on observations of signs and symptoms of being under the influence of a drug. In the United States and Canada, suspected drug-impaired drivers may be assessed using the Drug Evaluation and Classification (DEC) Program. The DEC program is supported by the National Highway Traffic Safety Administration (NHTSA) and coordinated by the Highway Safety Committee of the International Association of Chiefs of Police (IACP). In 1992, a set of minimum standards were adopted specifying the requirement for certification and re-certification of DREs and DRE instructors, standards for decertification and reinstatement of DREs, and standards for agency participation [8]. A technical advisory panel meets regularly to examine potential improvements to techniques and procedures. As more states and local jurisdictions move towards expanded medical use cannabis, and decriminalization or legalization of recreational cannabis use, there is a need for better information about the relationship between cannabis use and its effects on driving, assessment of approaches for recognizing cannabis-related impairment in drivers, and determining whether there is a scientific basis for per se laws regarding thresholds above which driving is criminalized. Reviews of laboratory-based research, driving simulator studies and on-road driving models show that cannabis has the potential to produce adverse effects on driving; however, outcomes-based on studies of crash risk have reported mixed results based on the models and the quality of the data used [9]. For example, two recent systematic reviews came to different conclusions about the risk of crash risk associated with cannabis use [10], [11]. Asbridge et al. concluded that acute cannabis consumption is associated with increased risk of serious injury or fatal motor vehicle crash, while Elvik et al. found an increased risk of non-injury crash. Furthermore, while Elvik et al. noted there was a tendency for the estimated effects of drug use on accident risk to be smaller in well-controlled studies than in poorly controlled studies, Asbridge et al. noted greater risk estimates for higher quality studies. A study by NHTSA, completed after the publication of the systematic reviews cited previously, estimated that drivers who tested positive for THC had slightly higher crash risk than cannabis-negative drivers (odds ratio 1.25, p=0.01), but that adjustment for demographic characteristics associated with both cannabis use and crash involvement reduced the adjusted odds ratio to 1.01 (p=0.65), thus providing no evidence of a causal relationship between having detectable levels of THC and risk of crash involvement [12]. The purpose of this assessment was to examine a population of drivers placed under arrest for impaired driving, and to identify whether indicators of impairment or physiological indicators of recent drug use were correlated with the measured THC concentrations in subsequently collected blood specimens. Ultimately, the goal was to determine whether data supports existing or proposed illegal per se limits for cannabis. An additional goal was to use the data to determine what an appropriate per se limit might be, and discuss how it could be implemented and enforced. 6
9 Methods Data Sources The project examined existing data on the blood THC and metabolite concentrations among two study populations: Study Population 1 (Arrested Drivers with DRE assessments) These were drivers arrested for suspected drug-impaired driving and subjected to a DRE assessment including an assessment of clinical indicators and behavioral tests, and for which THC was the only drug detected in blood. As described below, this pool also contains data from a group of individuals who were free of drugs; Study Population 2 (Arrested Drivers without DRE assessments) These were drivers arrested for DUI, and subjected to comprehensive drug and alcohol testing who subsequently tested positive for cannabinoids, but for whom there were no DRE field sobriety test or performance data provided; Study Population 1 - Impaired Drivers with DRE Assessments Drivers who have been arrested for drug-impaired driving may be subject to an evaluation conducted by a specially trained and certified Drug Recognition Expert (DRE) officer using the protocol defined in the Drug Evaluation and Classification (DEC) Program. The DEC program is a systematic and standardized 12-step procedure in which DREs recognize, evaluate, and document behaviors and physiological indicators associated with seven drug categories: central nervous system (CNS) depressants; inhalants; dissociative anesthetics; cannabis; CNS stimulants; hallucinogens; and narcotic analgesics [13]. The DEC evaluation includes an assessment of psychophysical and physiological indicators. The psychophysical indicators allow officers to assess impairment of motor function (e.g. balance and coordination) and divided attention. These consist of the Walk-and-Turn Test and the One-Leg Stand Test, both of which are components of the Standardized Field Sobriety Test battery. In addition, a Finger-to-nose Test (the modified Romberg balance test) is also part of the DEC protocol and is used to assess coordination and divided attention. The details of the tests are provided in Appendix B. The physiological indicators evaluated represent involuntary autonomic (e.g. heart rate, blood pressure, pupil size) responses to drug use that are used to assess which class or classes of drugs might be responsible for any observed impairment. This portion of the assessment includes a check of the eyes for signs of drug use. Horizontal gaze nystagmus (HGN) and vertical gaze nystagmus (VGN) is a distinct jerkiness of the eyes when moved to the extreme horizontal or vertical position, respectively. Nystagmus becomes apparent in the presence of many drugs with central nervous system depressant effects. THC, however, does not produce HGN or VGN under typical use [13]. HGN was seen in 15 percent of subjects receiving only cannabis in an assessment of standardized field sobriety tests [14]. In addition, dilated pupils are a common indicator of cannabis use 7
10 (as well as use of stimulants and hallucinogens). In our data, cannabis-positive drivers were also more likely than controls to display red and/or bloodshot eyes, droopy eyelids, lack of convergence (LOC), eyelid tremors, or rebound dilation. With the exception of depressants and narcotic analgesics, most other psychoactive drugs (including cannabis) increase heart rate. Increased heart rate is frequently associated with elevated blood pressure. The purpose of the DEC procedure is to provide the officer with the necessary evidence to determine whether or not the subject is impaired, and whether the observed impairment is due to drugs or a medical condition. If impairment is present, the constellation of symptoms (the DRE Matrix, see Appendix C) helps the officer assess which category (or categories) of drugs might be responsible for the impairment. According to the DEC student manual, the process is systematic because it is based on a complete set of observable signs and symptoms that are known to be reliable indicators of drug impairment [15]. The process is standardized because it is conducted in exactly the same way by every DRE for every subject, whenever possible. The results of the 12-step protocol, when corroborated by toxicological evidence of drug use, provide sufficient evidence to proceed with drug-impaired driving charges. The examination concludes with the collection of a specimen of urine, blood or oral fluid to be analyzed for drug content. Data was provided by DRE Coordinators in Pennsylvania, Washington and Minnesota, and an aggregated data set of approximately 300 cases was provided by the International Association of Chiefs of Police (IACP), also including cases from the following states: Arizona, California, Colorado, Montana, Texas, and Wisconsin. Toxicology data was provided for all cases that were included in the analysis. Coordinators also provided the DEC evaluation face sheets or abstracted data provided in an excel spreadsheet. The face sheet is the cover sheet used to record the officer s observations of the subjects statements about drug and alcohol use, medical conditions that could impact performance, times and nature recent drug or alcohol use, performance in field sobriety tests, physiological indicators (pulse, blood pressure, muscle tone, pupil diameter, etc.). Information collected and noted on the face sheet becomes the basis for the officer s opinion about the presence of impairment and the drug or drugs responsible for it. An example of the DEC face sheet is shown in Appendix A. Coordinators also provided related documentation (narrative reports, toxicology reports) on cases where the subject was suspected of being under the influence of only cannabis based on the DRE officer s opinion. Only cases with a blood specimen that had been subject to a comprehensive panel of drug testing aligned with the DRE categories, including confirmatory testing and quantitative THC analysis, were retained. Working with the toxicology labs and the police departments that submitted the blood specimens for analysis, we collected and reconciled the drug influence evaluation face sheet and the officer s narrative report describing the driving behavior and arrest, to the toxicology results. Cases in which cannabis was used in combination with other substances were excluded. Due to inconsistencies in the way in which states collect, manage, and report data, of approximately 1000 cases collected, only 602 met the criteria for inclusion and were entered into a database for analysis. The primary reason for exclusion was lack of quantitative toxicological confirmation, along with incomplete evaluations, and additional drugs or alcohol being present. 8
11 In addition to the field sobriety test performance indicators listed in Appendix B, for each of these cases we recorded demographic, clinical, and behavioral indicators from the evaluation face sheet and the officer s narrative report which were abstracted, coded, and entered into a database (SPSS for Windows version 22.0). Specific parameters captured included pupil size; presence of horizontal and vertical gaze nystagmus; lack of convergence; reddened conjunctiva; reaction to light; rebound dilation; body temperature; pulse; blood concentration of THC; elapsed time between the time of arrest, the start and end of the evaluation, and the time of specimen collection; and the reason for the traffic stop. The toxicology data were also entered, including the concentration of THC and other cannabinoids. As a control population, we used a sample of 349 drug-free DEC evaluations for comparison with the sample of cannabis-positive drivers. Most of these drug-free subjects were volunteers who agreed to undergo a DEC evaluation for training purposes or for their own interest. Volunteers were asked about the use of drugs and medications and were excluded if they indicated any use, but were generally not drug-tested. In some cases, an oral fluid specimen was collected and found to be free of drugs. A small number of cases involved drivers who had been arrested and were subjected to a drug influence evaluation but were deemed not to be impaired, had no measurable blood THC and were free from other drugs. Study Population 2 - Arrested Drivers without DRE Assessments Results from a cohort of drivers who had provided blood specimens subsequent to their arrest under suspicion of impaired driving were provided (NMS Labs, Willow Grove, PA), which originated from the following states: Alaska, Arizona, California, Colorado, Florida, Iowa, Idaho, Illinois, Kansas, Kentucky, Louisiana, Maryland, Maine, Michigan, Minnesota, Missouri, North Carolina, North Dakota, New Jersey, New Mexico, Nevada, New York, Ohio, Oklahoma, Oregon, Pennsylvania, South Dakota, Tennessee, Texas, Utah, Virginia, Vermont, Washington, West Virginia, and Wyoming. The specimens had been subjected to comprehensive drug and alcohol testing in suspected impaired drivers and surviving drivers in motor vehicle fatality investigations. The scope of testing in these cases was designed based on the National Safety Council s Committee on Alcohol and Other Drugs (CAOD) 2007 and 2013 recommendations [16], [17] and the laboratory has used consistent cut-offs for drug screening and confirmation since the introduction of the test in This rich data set has information on age, gender, and test results for alcohol and other drugs, but lacks behavioral or crash data. The laboratory compiled data from the blood specimens submitted from suspected drugimpaired drivers placed under arrest by police agencies, comprising 36,037 cases between August 2009 and December Screening for cannabis use by Enzyme Linked Immunosorbent Assay (ELISA) with a cutoff of 5 ng/ml returned presumptive positive results for 17,612 (48.8%) of these specimens. Of these 13,988 (79.4%) confirmed positive for THC (1 ng/ml), carboxy-thc, (5 ng/ml), and/or hydroxy-thc (5 ng/ml). A subset of these data, all of which had all of age, gender, and alcohol/other drug data (4,799 cases or 34 percent of confirmed cannabinoid-positive cases, from January 2009 to June 2013) were further evaluated to examine variations in THC concentrations with comorbid drug use and the distribution of cases based on varying per se thresholds for driving under the influence of cannabis. 9
12 Analysis In recognition of the fact that we were relying on secondary data collected by a number of different agencies for purposes other than research, every effort was made to ensure the cases selected for inclusion were as complete as possible and contained the data elements required, and that data were coded consistently with only equivalent fields being included. In many cases, toxicology reports and/or narrative reports were not included with DEC program case files, and were unavailable from the agency. These cases were excluded. Some agencies (or officers) record data on the face sheets in slightly different ways (e.g., recording the number of times a clue was observed or simply noting its presence if it occurred). Hence, for consistency, the lowest level of data reported was used in data coding. Results Arrested Drivers Study Population 1 - Impaired Drivers with DRE Assessments The sample of arrested drivers consisted of 602 individuals who were subjected to a complete DEC program assessment by a certified DRE, and were subsequently found to have a blood THC concentration of at least 1 ng/ml. The distribution of THC concentrations among these drivers are presented in Figure 1. THC concentrations ranged from 1 ng/ml to 47 ng/ml with a mean of 7.04 (SD=6.10). The median of 5.05 ng/ml indicates that half of all arrested drivers in the sample had a THC concentration below this value. Percent Median = 5.05 Mean = 7.04 SD = 6.10 Range N= THC Concentration (ng/ml) Figure 1: THC concentration distribution in 602 Cases with DRE Evaluations 10
13 A key consideration in evaluating this data is the fact that the THC concentrations measured are taken from blood specimens collected some finite time after driving and following the subject s evaluation, arrest, and transportation for a blood draw. Wood et al. reported in 2015 that in Colorado the average time from law enforcement dispatch to blood draw in cases of vehicular homicide and vehicular assault was 2.32 hours (SD ± 1.31 hours), with a range of 0.83 to 8.0 hours, and a median of 2.0 hours [18]. As a result of the rapid distribution of THC out of the blood, which is discussed in more detail below, the THC concentration measured in a blood specimen collected hours after driving will not reflect the concentration in the blood at the time of driving, and in many cases will have fallen below the limits of detection used by the laboratories performing the testing. It is important to keep in mind that all these drivers had been placed under arrest presumably based on appropriate probable cause including the circumstances of driving, or crash involvement. From cases in our data set where the information was available, the mean lag between arrest and blood draw was 74 minutes. The median value was 61 minutes and the maximum time delay was three hours and 45 minutes. The correlation between THC concentration and the time lag between arrest and blood draw was , indicating that longer intervals were associated with lower THC concentrations. The strength of the relationship, however, is not large with the time interval between arrest and blood draw accounting for about 3 percent of the variance in THC concentrations. We assessed the proportion of cases with THC concentrations above or below certain proposed statutory thresholds for THC per se legislation. Of the 602 cases included, almost half (48.0%) the subjects had THC concentrations below 5 ng/ml, the per se threshold adopted in Washington, and Montana, and the threshold for a rebuttable presumption in Colorado; only 9.0 percent were below 2 ng/ml, the per se threshold in Ohio, and Nevada, and 90 percent had a THC concentration less than 15 ng/ml, the per se threshold proposed in Illinois in Comparison of cannabis-positive drivers and drug-negative controls Comparisons were made between the arrested drivers and the drug-free control sample (i.e. subjects not using drugs who completed the DRE evaluation) based on a number of physiological (e.g., pupil size, blood pressure, pulse) and psychophysical (walk-and-turn, one-leg-stand) indicators that are included as part the DEC evaluation. The comparison of the arrested drivers (i.e. THC-positive) with the control sample provides a means to assess the extent to which cannabis has an effect on the various indicators. Table 1 shows the percentage of arrested and control samples that displayed each of eight eye indicators examined during the DEC evaluation. Arrested cannabis-positive drivers were more likely than controls to display red, watery, and bloodshot eyes, droopy eyelids, lack of convergence (LOC), eyelid tremors, and rebound dilation. HGN was rarely observed among either arrested or control samples. Natural HGN is present in a small proportion of the general population; however, it is not induced by cannabis under typical conditions of use, which is borne out by the data referenced in Table 1. Indicators present in many of the cannabis-positive drivers were bloodshot eyes, droopy eyelids, eyelid tremors, lack of convergence, and rebound dilation. 11
14 Table 1: Eye Indicators among arrested drivers (THC-positive) and controls (THC-negative) THC Negative Eyes Normal N (%) 230 (65.9) Red Conjunctiva N (%) 37 (10.6) Bloodshot N (%) 70 (20.1) Eye Indicators Watery N (%) 40 (11.5) Eyelids Droopy N (%) 43 (12.3) HGN N (%) 20 (5.8) LOC N (%) 103 (34.9) Eyelid Tremor N (%) 80 (22.9) Rebound Dilation N (%) 26 (7.6) THC Positive 30 (5.0) 225 (37.4) 462 (76.7) 245 (40.7) 256 (42.5) 50 (8.3) 257 (55.2) 418 (69.4) 339 (57.1) p< p< p< p< p< p= p< p< p<.001 In room light, average pupil size ranges between mm. Dilated pupils are a common indicator of cannabis use (as well as stimulants and hallucinogens). Cannabis-positive drivers were had significantly larger pupil sizes in room light (M=5.4mm) than the control group of drivers who had not used cannabis (M=4.3mm) (t(940)=13.41, p<.001). Whereas 54.5 percent of cannabis-positive drivers had a pupil diameter greater than 5 mm, only 13.6 percent of cannabis-negative drivers had pupil diameters of this magnitude. With the exception of depressants and narcotic analgesics, most other psychoactive drugs (including cannabis) increase heart rate. Average pulse for the US population is generally between beats per minute. The average pulse rate of cannabis-positive drivers (M=92.7) was significantly higher than that of cannabis-negative drivers (M=78.5, t(925)=12.96, p<.001). Over half (54.3%) of cannabis-positive arrested drivers had a pulse rate over 90 compared to just 14.7 percent of cannabis-negative drivers. Increased heart rate is frequently associated with elevated blood pressure. Cannabispositive drivers had significantly higher systolic blood pressure (M=137mmHg) than those who were cannabis-negative (M=130mmHg, t=(937)=5.93, p<.001). Whereas 23.6 percent of cannabis-negative drivers were found to have a systolic blood pressure above the average range (i.e., mmhg), 49 percent of cannabis-positive drivers had a systolic pressure in excess of this range. Differences in the number of clues evidenced during performance of the Walk-and-turn test are displayed in Figure. Two or more of these clues are deemed by the DEC program to represent impaired performance. Most cannabis-negative subjects (55.5%) were able to perform the test with no more than one clue. In contrast, only 21.9 percent of cannabispositive drivers displayed less than 2 clues (χ 2 (6,N=951)=304.1, p<.001). 12
15 THC Positive THC Negative Percent Number of walk and turn clues Figure 2: Total Walk and Turn Clues among THC-positive and THC-negative subjects Figure 3 presents the number of clues on the one-leg-stand separately for THC-positive and THC-negative subjects. Two or more clues are deemed to be indicative of impaired performance. Whereas 67.2 percent of cannabis-negative displayed no clues, only 24.0 percent of THC-positive drivers were able to perform the test without errors (χ 2 (4,N=939)=167.1, p<.001). 13
16 THC Positive THC Negative Percent Number of One Leg Stand Clues Figure 3: Total One Leg Stand Clues among THC-positive and THC-negative subjects The Finger-to-Nose test is a classic field test of psychomotor performance that also forms part of the DEC assessment. Figure 4 shows clear differences in the number of times THCpositive and THC-negative drivers were unable to touch their nose over six attempts. Whereas almost half (49.2%) of THC-negative drivers touched their nose on all six attempts, only 5.2 percent of cannabis-positive drivers were successful on all six attempts. One-third of cannabis-positive drivers missed their nose on all six attempts (χ 2 (6,N=938)=264.4, p<.001). 14
17 THC Positive THC Negative Percent Number of Finger to nose "misses" Figure 4: Total Finger-to-Nose Misses among THC-positive and THC-negative subjects Relationship between THC Concentration and Impairment Having established that drivers who have used cannabis differ on a variety of clinical and behavioral measures compared to those who are drug-negative, the question then becomes whether higher concentrations of THC are associated with greater numbers of the various clinical and behavioral indicators. A series of bivariate correlation coefficients were calculated between blood THC level and the indicators. The coefficients are presented in Table 2. 15
18 Table 2: Correlation between blood THC concentration and indicators of drug influence Systolic BP Diastolic BP Walkand turn Clues One legstand Clues Finger to nose Misses Pupils Room Light Pupils Direct Light Pulse r= n=599 r= 0.109* n=599 r= n=602 r=0.005 n=599 r=0.082* n=597 r= n=600 r= n=444 r=0.036 n=592 Odor of cannabis Eyes Red Eyelids Droopy Eyelid Tremors Body Tremors Lack of Convergence Rebound Dilation r=0.178* n=602 r= n=602 r= n=602 r= n=602 r=0.057 n=602 r=0.166* n=466 r=0.008 n=594 * p<.05 Of the 15 indicators, only 4 revealed a statistically significant correlation with blood THC concentration. Higher concentrations of THC were associated with lower diastolic blood pressure, more misses on the finger-to-nose test, a greater likelihood of the presence of an odor of cannabis, and a greater likelihood of displaying lack of convergence. Although statistically significant, it is important to note, the magnitude of the coefficients is small, with THC concentration accounting for (at best) only 3 percent of the variance in the indicator. Sensitivity and Specificity of THC Thresholds Chi-Squared Analysis As a means of assessing the validity of a numerical THC threshold value above which impairment is more likely, and which thus might be a candidate for an impairment based per se law, we selected a concentration of 5 ng/ml and performed a chi-squared analysis. The rationale for this was to select a threshold that has been adopted by three states (Washington, Montana and Colorado), and proposed in several others, and is the concentration cited in a frequently cited meta-analysis of published experimental work as a putative threshold for impairment based per se thresholds [19]. Finally, and most importantly, as noted above, the median concentration in this population was 5.0 ng/ml, so a threshold of 5 ng/ml provided comparative groups of equal size. Using lower and higher thresholds resulted in comparison groups of dramatically different sizes, limiting the statistical power and increasing the risk of type-1 errors, and finding a significant difference as a result of chance. The first analysis described below, compared the distribution of various clinical and psychophysical indicators from the DEC assessments for arrested drivers with THC concentrations below 5 ng/ml (n=271) and 5 ng/ml and over (n=308). This approach serves to show the extent to which there may be differences in the distribution of the indicators between the two groups. 16
19 The second approach used to cross check these findings involved selecting a known or established cut point on an indicator that defined impairment, and using that point to determine the sensitivity and specificity of a 5 ng/ml threshold in identifying impairment. The following parameters in the DEC evaluation were evaluated for differences between the subjects at, and above and below 5 ng/ml: pupil size; total number of eye clues; systolic and diastolic blood pressure; pulse; number of walk-and-turn clues; number of one-leg stand clues; and number of finger-to-nose misses. These results are presented in Appendix D, and the results of the Chi-squared test or t-test are noted in each figure. In all cases but one (the number of misses on the finger-to-nose test, discussed above) there was no difference between the distributions according to THC group. In the case of the number of misses on the finger-to-nose test, the higher THC group had a higher proportion of cases that missed on all six attempts (39.9 percent in the high THC group and 29.0 in the low THC group). Finally, a logistic regression analysis was performed to test whether a group of clinical and behavioral indicators could predict THC concentration above and below 5 ng/ml. Results from the overall logistic regression (shown in Table 3) indicated that these indicators from the DEC evaluation as well as age and sex failed to distinguish between those with THC concentrations above and below 5 ng/ml (χ 2 (10,N=534)=8.993, p=.533). Table 3: Results of logistic regression analysis of DEC indicators and THC concentrations above and below 5 ng/ml Signs & Symptoms ß Wald χ 2 Odds ratio 95% CI for Odds ratio Systolic BP Diastolic BP Pupil Size (Room light) Walk and turn Clues One leg stand Clues Finger to nose Miss Romberg Sway Age Sex Performance Around a Defined Limit for Impairment The second part of this analysis involved splitting the group of drivers with DRE assessments (including the drug-negative controls) into two groups -- 5 ng/ml or greater, and 0 to 4.9 ng/ml THC. This was selected as a cut-point to reflect proposed or enacted per 17
20 se laws for cannabis use and driving. In essence, a per se law for THC set at 5 ng/ml would operate in a manner similar to how 0.08 g/dl is used as a limit to define alcohol-impaired driving. Individuals with a THC concentration of 5 ng/ml or greater would be deemed to have committed the offence of driving under the influence. It was then necessary to establish a threshold or cut point that would be used to define impaired performance for each indicator. This threshold then served as the criterion by which to assess the extent to which the two groups (i.e., 5 ng/ml or greater, and 0 to 4.9 ng/ml) would be deemed impaired or not impaired. Most of these threshold values were taken from the DEC program training manuals, and were established through research validating the indicator (e.g., for the SFST), taken from medical text books (e.g., pulse, blood pressure), or were simple dichotomies (i.e., presence or absence) based on known drug effects. A final threshold for impairment was calculated as at least one test of the SFST meeting the threshold of impairment i.e., HGN, walk-and-turn, one-leg-stand. The number of cases in the two groups were then cross-tabulated according to whether or not they met the threshold or cut off value that defined impairment on each measure. An example of these tables is presented in Table. The tables were used to calculate sensitivity and specificity for each of the indicators and well as a measure of overall accuracy. Table 4: Cross Tabulation of THC +/- 5 ng/ml and Performance Indicators Performance Indicator THC Level Not Impaired Impaired ng/ml (not impaired) 5+ ng/ml (Impaired) True Negatives (TN) False Positives (FP) False Negatives (FN) True Positives (TP) In this case, sensitivity (sensitivity = TP/(FN+TP)) reflects the extent to which a THC concentration of at least 5 ng/ml will correctly predict impairment on the performance indicator. As indicated in the table, sensitivity is calculated as the number of true positive (TP) cases divided by the total number of cases identified by the performance indicator as impaired (TP+FN). Specificity (specificity = TN/(FP+TN)) reflects the extent to which a THC concentration of 0 to 4.9 ng/ml will correctly identify the absence of impairment on the performance indicator. As indicated in the table, specificity is calculated as the number of true negatives (TN) divided by the total number of cases identified by the performance indicator as not impaired (TN+FP). Accuracy (accuracy = (TN+TP)/(TN+TP+FN+FP)) is the proportion of all cases that are correctly identified by the 5 ng/ml THC threshold as impaired or not impaired. If the 5 ng/ml threshold provides a good surrogate of impairment, it should have high sensitivity (i.e., >80%) and high specificity (i.e., >80%) 18
21 Table 5 presents a summary of the results of these cross tabulations for a number of indicators. For each indicator, the table lists the criterion score for impairment, the percentage of all cases with DRE assessments that met the criterion, and the sensitivity, specificity, and accuracy. Table 5: Assessment of 5 ng/ml THC as a Threshold Defining Driving Impairment among Drivers with DRE Assessments Indicator/Measure Criterion Score % of Cases Positive Sensitivity % Specificity % Accuracy % Eyelid Tremors Present HGN Present Systolic BP Pupil Size (Room Light) Pulse Walk and turn Clues Finger to nose Misses One leg stand Clues SFST Impairment None of the indicators had sensitivity greater than 80 percent, and only eyelid tremors, finger-to-nose misses, walk-and-turn clues, and overall SFST impairment had specificity greater than 80 percent. Overall accuracy ranged between 51 and 64 percent. This reinforces the finding discussed later while THC-positive drivers were more likely than THC-negative drivers to have each of the classical DEC program indicators of cannabis use present, within the group of drivers with DRE assessments, 5 ng/ml did not serve as a good discriminating threshold between those who showed impairment and those who did not. Parallel analyses were performed for THC concentration thresholds of 1, 2, 3, 7 and 10 ng/ml, as shown in Table 6. Using a THC concentration of 1 ng/ml as a cutoff value produces a sensitivity of 80.4 percent and specificity of 70.2 percent. Higher THC cutoff values reduce sensitivity but increase specificity. For example, a THC cutoff value of 3 ng/ml produces a sensitivity of 60.1 percent and specificity of 78.0 percent. 19
22 Table 6: Sensitivity, Specificity, and Accuracy of Various THC Concentration Thresholds for SFST Impairment THC Concentration Threshold Sensitivity % Specificity % Accuracy % 1 ng/ml ng/ml ng/ml ng/ml ng/ml ng/ml Study Population 2 Suspected Impaired Drivers without DRE Assessments The secondary dataset had only demographic and THC concentration data comprising DUI arrests between Aug 2009 and Dec Of the 17,612 cases, 13,988 (79.4%) confirmed positive for one of THC (1 ng/ml), carboxy-thc, (5 ng/ml), or hydroxy-thc (5 ng/ml). This reflects cannabis use at some time in the recent past for occasional users. Since all cases had some indicator of cannabis usage, cases with THC = none detected (THC concentrations <1 ng/ml) were included in the series, because their exclusion would assume that the subjects were not impaired at the time of the arrest. A key consideration in evaluating this data is the fact that the THC concentrations measured are taken from blood specimens collected some finite time after driving and following the subject s evaluation, arrest, and transportation for a blood draw. Wood et al. reported in 2015 that in Colorado the average time from law enforcement dispatch to blood draw in cases of vehicular homicide and vehicular assault was 2.32 hours (SD ± 1.31 hours), with a range of 0.83 to 8.0 hours, and a median of 2.0 hours [18]. As a result of the rapid distribution of THC out of the blood, which is discussed in more detail below, the THC concentration measured in a blood specimen collected hours after driving will not reflect the concentration in the blood at the time of driving, and in many cases will have fallen below the limits of detection used by the laboratories performing the testing. It is important to keep in mind that all these drivers had been placed under arrest presumably based on appropriate probable cause including the circumstances of driving, or crash involvement. From cases in our data set where the information was available, the mean lag between arrest and blood draw was one hour and 13 minutes. The median value was 60 minutes and the maximum time delay was three hours and 45 minutes. The correlation between THC concentration and the time lag between arrest and blood draw was , indicating that longer intervals were associated with lower THC concentrations. The strength of the relationship, however, is weak, with the time interval between arrest and blood draw accounting for less than 5 percent of the variance in THC concentrations. 20
23 Figure 5 depicts the distribution of THC in the 11,328 cases which had THC concentrations greater than or equal to 1 ng/ml. In this subset, 58.3 percent of drivers had THC concentrations less than 5 ng/ml (the Colorado, Washington and Montana per se thresholds), 21.3 percent had concentrations less than 2 ng/ml (the Ohio and Nevada thresholds) and 92.0 percent were less than 15 ng/ml. In cases of individuals aged 21 and older (N=7,233), THC was greater than or equal to 5 ng/ml in 40.4 percent of cases, compared to 47.0 percent in cases where the individuals were younger than 21 years old (N=2,688). 25 Percent Median = 4.0 Mean = 6.1 SD = 6.49 Range N=11, THC Concentration (ng/ml) Figure 5: THC concentration distribution among arrested drivers without DRE assessments who were positive for THC ( 1 ng/ml) Alcohol and Other Drugs Subset The subset of this data which had alcohol/other drug data (4,799 cases from Jan 2009 to June 2013) and demographic information (age and gender) were evaluated to examine variations in THC concentrations with comorbid drug and alcohol use and the distribution of cases based on varying proposed per se thresholds for driving under the influence of cannabis. The demographics of this subset were similar to the larger data set percent of all the cases were positive for both alcohol and cannabinoids percent of cases were positive only for cannabinoids (Table 7). Over three quarters (76.5%) of cases were positive for alcohol and/or other drugs, and about half the drivers positive for both cannabinoids and other drugs were positive for alcohol. 21
24 Table 7: Confirmed Cannabinoid-Positive Cases with Alcohol and Other Drug Data(n=4,799) Other Drugs (+) Other Drugs ( ) Total Alcohol (+) 777 (16.1%) 2,075 (43.2%) 2,852 (59.4%) Alcohol ( ) 830 (17.2%) 1,117 (23.2%) 1,947 (40.6%) Total 1,607 (33.4%) 3,192 (66.5%) 4,799 (100%) Table 8 summarizes the frequency of positivity for other drug classes found in conjunction with cannabinoids. After alcohol, the sedating drug categories i.e., the opiates (18.8%) and benzodiazepines (15.5%) -- were the most commonly encountered, followed by two stimulant categories, cocaine and amphetamines. Table 8: Rates of other drug- and alcohol-positives among cannabinoid-positive cases Drug Class Cannabinoid cases positive by other drug class (%) Alcohol 59.4% Opiates 18.8% Benzodiazepines 15.5% Cocaine 8.6% Amphetamines 5.0% Methadone 3.6% Phencyclidine 1.2% Barbiturates 0.72% Propoxyphene 0.16% Any Other Drug 33.4% The highest median THC concentration (5.6 ng/ml) was observed in cases in which no other drugs or alcohol were present, and these cases also had the greatest percentage with THC concentrations above 1 ng/ml (90.5%; Table 9). This is in contrast to cases with cannabinoids and alcohol present in combination, where the median concentration was almost half this (3.1 ng/ml), and THC was detected in 78.3 percent of the cases. 22
25 Table 9: Distribution of THC concentrations by co-morbid drug and alcohol use n % positive for THC Mean, Median and Range of THC Concentration (ng/ml) + Cannabinoid 4, % 5.6; 3.6; Cannabinoid + Alcohol + Other Drug % 4.4; 2.8; Cannabinoid + Alcohol Other Drug 2, % 4.6; 3.1; Cannabinoid Alcohol + Other Drug % 5.8; 3.7; Cannabinoid Alcohol Other Drug 1, % 7.8; 5.6;1 84 Cases were categorized as to whether they were positive for cannabinoids only, cannabinoids plus alcohol, cannabinoids plus other drugs, and cannabinoids plus alcohol and other drugs (Table 10). For the group of cannabinoid-positive drivers as a whole, a lower administrative or statutory threshold (1 ng/ml) would have categorized 79.5 percent of the cannabis-positive arrested drivers as per se under the influence, a 2 ng/ml threshold would have categorized 60.3 percent as per se under the influence, and the recently adopted thresholds in Washington, Colorado and Montana of 5 ng/ml would have categorized only 29.6 percent of these arrested drivers as per se under the influence. The proposed threshold in Illinois in 2015 of 15 ng/ml would have designated only 3 percent of these drivers as per se under the influence, in spite of the fact that they had all been determined by the arresting officer to be impaired and placed under arrest. Breaking this cohort down into subsets with concomitant drug and or alcohol use, in every case lowered the percentage of subjects with THC concentrations above the relevant per se statutory thresholds, with only 19.0 percent of the subjects with alcohol and other drugs present exceeding the 5 ng/ml threshold. Table10: Cases with THC concentrations above various statutory thresholds(1 ng/ml(pa); 2 ng/ml (OH, NV); 5 ng/ml (WA, CO, MT) (N=4,799) Subjects with THC >1 ng/ml Subjects with THC >2 ng/ml Subjects with THC >5 ng/ml + Cannabinoid 79.5% 60.3% 29.6% + Cannabinoid Alcohol Other Drug + Cannabinoid + Alcohol Other Drug + Cannabinoid Alcohol + Other Drug + Cannabinoid + Alcohol + Other Drug 90.5% 78.9% 49.3% 79.4% 56.8% 23.5% 74.6% 55.5% 28.6% 71.9% 47.8% 19.0% 23
26 Discussion In response to the growing liberalization of laws governing the use of cannabis for medical and recreational purposes, both proponents and opponents of this trend have expressed concern about the potential for increased traffic crashes involving drivers whose ability to operate their vehicle has been compromised by the use of cannabis. In response, several states have implemented per se limits that define the offense of driving while impaired by cannabis, and others are actively considering such limits. However, legislators and scientists struggle with the question of determining an appropriate science-based limit for cannabis use by drivers. Unlike in the case of alcohol, where substantial experimental and epidemiological evidence was available to guide and support the setting of an evidencebased per se limit, the relevant research data relating to cannabis is limited and the findings are often inconclusive. The purpose of the present study was to provide guidance in determining an appropriate response to the issue of driving after cannabis use through a detailed examination of data available from cannabis-positive drivers arrested for suspected driving under the influence. We acknowledge that the number of cases we were able to consolidate which had the necessary comprehensive data to meet our criteria for inclusion limits the statistical power of our assessment. Following cannabis use, THC concentrations decrease rapidly as a result of metabolism and distribution into tissues including the brain, and blood THC concentrations drop rapidly. In occasional marijuana users, the maximum THC blood concentration was achieved an average of 0.5 hours after smoking and the THC concentration dropped below 5 ng/ml in 1-2 hours [20]. In frequent smokers the drop below 5 ng/ml occurred 3-4 hours after smoking. This time lag is therefore a critical factor in determining how much THC remains in the subject s venous blood at the time the specimen is collected. Blood specimens are generally taken following the DEC evaluation. In many cases this requires the driver to be taken to a health facility to have the specimen drawn by a qualified phlebotomist, all of which takes time, and contributes to a gap between the measured blood THC concentration and that present at the time of driving. In our study population I (DRE tested drivers) this time lag was 74.5 min (mean) and 61 minutes (median). The DRE symptomatology matrix (Appendix C) indicates the following symptoms can be indicative of cannabinoid exposure: lack of convergence, dilated pupils, increased pulse rate and increased blood pressure [13]. The data we acquired regarding cannabis-positive drivers subjected to the DEC exam and arrested for suspected impaired driving provides supporting evidence that cannabis-positive suspected impaired drivers are more likely to present signs and symptoms associated with cannabis use than drug-negative subjects. Drivers positive for THC in blood were significantly more likely than cannabis-negative subjects to display bloodshot eyes, reddened conjunctivae, droopy eyelids, inability to cross one s eyes, eyelid tremors, dilated pupils, rebound dilation, as well as elevated blood pressure and pulse. Cannabis-positive drivers also demonstrated more indicators of impairment on the walk-and-turn and one-leg-stand tests, more misses on the finger-tonose test and greater sway on the Romberg balance test. Three previous controlled administration studies have reported diminished performance on the one-leg-stand test following cannabis use, but reported conflicting results for the walk-and-turn and HGN [14], [21], [22]. The findings of this study support generally poorer performance in the field sobriety tests among cannabis-positive subjects. 24
27 Blood THC concentrations in arrested drivers were quite variable and ranged from 1-47 ng/ml, which could reflect both different doses and different times since last use. Approximately half of all cases had a THC level of less than 5 ng/ml, the per se threshold for impaired driving in Montana and Washington, and the presumptive concentration in Colorado. The only indicator found to discriminate between drivers above and below this threshold was the number of misses on the finger-to-nose test. Drivers with THC concentrations of at least 5 ng/ml evidenced more misses. In particular, they were more likely to miss on all 6 attempts. These data indicate that drivers with THC concentrations below 5 ng/ml are just as likely as those with higher THC concentrations to show signs and symptoms consistent with cannabis use and impairment. Can a science-based blood THC concentration per se threshold be established? A key issue in this study is the utility and validity of establishing a threshold concentration that could be used to establish evidence of driver impairment. In particular, because Washington, Montana and Colorado have established 5 ng/ml THC in blood as a per se or presumptive limit for cannabis in drivers, attention has focused on this value. A variety of measures from the DEC program evaluations were examined to determine if there were differences in the rates of occurrence of indicators of drug influence and/or impairment between drivers with blood THC concentrations above and below 5 ng/ml. The evidence was very clear that 5 ng/ml was not a good discriminator of impairment. There are reasonable pharmacokinetic characteristics of this drug that would make that finding unsurprising. For water-soluble drugs that have a long half-life of the order of several hours or days, the drug profile in the blood roughly mirrors the kinetics of the drugs distribution into the central nervous system, so the blood concentration is a good surrogate for the concentration in the brain, or at least the course of the effect from onset through peak effect to recovery. For drugs like THC that are lipid-soluble and have a short distribution half-life, the drug is taken up rapidly into the brain and other fatty tissues where it concentrates while the concentration in the blood declines rapidly. Consequently, the blood concentration is not a useful surrogate for the effect experienced by the subject, especially as the time between ingestion and specimen collection increases beyond a few minutes. The practical reality of identifying evaluating, arresting, and sampling suspected impaired drivers means that the THC concentration measured in the blood specimen reflects neither the concentration in the subject s blood at the time of arrest, nor the concentration of active drug in the brain. Based on the THC concentration distribution in the larger population 2 data set of arrested drivers and similar observations by other groups, indiscriminate selection of a 5 ng/ml threshold for per se laws virtually guarantees that approximately 70 percent of all cannabis using drivers, whose actions led to them being arrested, will escape prosecution under a 5 ng/ml per se standard. The results of the analysis of various per se thresholds provided insight into the selection of the THC concentration that would best distinguish between drivers who were impaired and those who were not (as determined by performance on the SFST). Overall, THC concentration was only a fair indicator of impairment. As THC concentration used as a criterion score increased, sensitivity decreased. This means that the ability to accurately identify impaired drivers diminished as the concentration of THC used as a cutoff score (or 25
28 possible per se threshold) increased. The THC concentration which had the highest sensitivity (80.4%) for impaired performance on the SFST was 1 ng/ml. Even a small increase in the THC threshold to 3 ng/ml reduced sensitivity to 60.1 percent. It can be argued that even with an ineffective per se standard in place, the statutory framework still allows for prosecution on an affected by standard. This is the case with alcohol, a legal substance where an impairment standard exists side-by-side with a quantitative per se standard. However, a distinguishing feature is that the alcohol per se standard is evidence based and based on scientific evidence of impairment in virtually all drivers at 0.08 g/dl [23]. Furthermore, experience has taught us that establishing a per se standard for impairment becomes viewed in the mind of much of the public as an illegal limit, and there are in our experience few prosecutions of drivers with blood alcohol concentrations below the 0.08 per se limit, which as our data illustrates in the case of THC, would be the majority of arrests. Jurisdictions choosing to adopt a per se standard for THC of 5 ng/ml would need to be prepared to educate the public that it is not necessarily safe to drive with a THC level between 0 and 5 ng/ml, and prosecutors would have to be prepared to prosecute these low THC cases when the objective evidence of impairment is present, irrespective of the THC concentration. Considering a lower per se threshold starts to encompass individual heavy users of cannabis with residual THC concentrations long after use, or passive inhalation of THC from sidestream smoke under some extreme circumstances [24]. Higher concentrations, for example, 5ng/mL, result in increasingly smaller percentages of arrested, impaired drivers being over this arbitrary limit, to the point where the law becomes meaningless, and as discussed below runs the risk of diluting the message about the risks of cannabis-impaired driving. An additional consideration that undermines the effectiveness and fairness of a per se standard for THC is that the cannabis user has no meaningful way of knowing what their blood THC concentration is either at the time of a driving event, such as an offense or crash, or predicting what it might be at the time of sampling, so can t make an informed and responsible decision about whether to drive based on their concentration. In addition, the time between the event and collection of a blood specimen will affect the blood concentration observed in the test. Thus a subject arrested near a hospital will likely have a specimen with a higher concentration than a subject arrested in a rural area where transport time will be longer. Since this time factor is outside of the control of the subject, it makes at least a component of the per se law s impact on the driver, arbitrary. Certainly the greater amount of time a cannabis user waits after their last inhalation of smoked cannabis, reduces their risk of being over the per se threshold. Experimental studies have demonstrated under one smoking scenario in occasional and frequent cannabis users that effects such as feeling stoned, high, sedated, and restless persisted for up to three and a half hours after smoking, while studies of oral ingestion of THC suggest a longer window of self-perceived effect and demonstrable impairment of up to eight hours [25], [26]. Consequently, cannabis users could be counseled through public education campaigns to observe a time-based restriction on their driving of perhaps four to six hours following smoking, or six to eight hours following oral ingestion. This would significantly reduce the risk of them driving impaired, but would not eliminate it, due to factors such as the highly variable THC content of botanical cannabis and edible products, and influence of smoking pattern and physiology on THC concentrations. These factors 26
29 would render this responsible use timeframe advice as more general guidance, and wouldn t necessarily prevent all impaired drivers from driving, depending on their individual physiology, tolerance, and circumstances/manner of use. Part of the value of alcohol per se laws is the general deterrent impact. Research has demonstrated the impact of per se laws for alcohol [27], [28]. Drinkers know there is a limit so most at least attempt to control their consumption when driving. A cannabis per se law would be difficult to explain to the public but would likely have at least a small deterrent effect. In the absence of a scientifically based cannabis per se law, there are several options. One is to train officers to detect the signs and symptoms of cannabis use in drivers stopped at roadside. Initial suspicion of cannabis use would lead to a field sobriety test (SFST). This process could be coupled with rapid, on-site oral fluid screening for evidence of drug use. The technology to detect certain drugs (including cannabis) in a specimen of oral fluid quickly at roadside is improving and could be used in a manner comparable to preliminary breath testing devices currently used to test for alcohol. The suspect would then be taken for a complete drug evaluation by a DRE. This approach requires enhancing the complement of DRE officers available to conduct assessments for impairment. The DEC approach, however, does have limitations, including the availability of DRE certified officers to attend and evaluate subjects in a timely manner. The IACP 2014 DRE Section report indicates that in 2014, there were 26,471 enforcement evaluations performed in the United States by 5,098 DRE officers representing 2,176 police agencies or locations [29]. Agency policy of when DREs respond, interagency collaborations in providing DRE officers to cover each other s cases, and DRE availability late at night when many of these arrests are made, all may limit the availability of a DRE to respond. In addition, the DEC program requires recertification every two years, and not all officers recertify. This is not a rejection of the principle of the per se approach to illegal drugs other than cannabis that have slower elimination rates and for which a blood concentration taken at a later time reasonably reflects the amount of drug in the driver s blood at the time of driving. However, there is no evidence we have been able to identify about how drug per se laws impact rates of prosecution or outcomes, in terms of arrests, convictions or fatalities. Another approach based on that in place in Colorado would be to adopt a rebuttable presumption of impairment at a low blood THC concentration (i.e.1 or 2 ng/ml) and provide offenders with the opportunity to show they are not impaired. However, this approach can be cumbersome and lead to lengthy trials. It also raises inevitable objections that such laws are shifting the burden to the defendant to prove their innocence. Consideration should also be given to a zero limit for THC for young drivers as is done under the Washington law, and for new and novice drivers. This approach has been found to be effective to some degree for alcohol [30], [31]. Given that a high proportion of cannabis users and of DUI arrestees are under the age of 24, the deterrent impact could be substantial. This is feasible because even states with recreational cannabis use prohibit its use by individuals under the age of 21. A limitation of this approach to assessing impairment is that all our subjects have been identified as a result of being arrested for impaired driving, with exception of the drug- 27
30 negative controls in population 1. We have no information, therefore, on the extent of impairment or concentrations of THC among drivers who have not been arrested, and to what extent they overlap with this population. It could be argued that the lack of impairment among this latter group might have precluded their inclusion in one or the other of our study samples. Nevertheless, our study provides valuable information about the THC concentrations among cannabis-positive individuals who have been arrested for impaired driving. The data do not support science-based per se limits for THC. 28
31 References [1] Results from the 2013 National Survey on Drug Use and Health: Summary of National Findings, Substance Abuse and Mental Hea lth Services Administration, NSDUH Series H-48, HHS Publication No. (SMA) , [2] A. W. Jones, F. C. Kugelberg, A. Holmgren, and J. Ahlner, Five-year update on the occurrence of alcohol and other drugs in blood samples from drivers killed in roadtraffic crashes in Sweden, Forensic Sci. Int., vol. 186, no. 1 3, pp , Apr [3] The 2013 Annual Report of the Drug Recognition Expert Section, International Association of Chiefs of Police, Alexandria, VA, [4] Lacey, J.H, Kelley-Baker, T., Furr-Holden, D., Voas, R.B., Romano, Ed. Ramirez, A., Brainard, K., Moore, C, 2007 National Roadside Survey of Alcohol and Drug Use by Drivers: Drug Results, NHTSA s Office of Behavioral Safety Research, [5] A. Orens, M. Light, J. Rowberry, J. Matsen, and B. Lewandowski, Marijuana Equivalency in Portion and Dosage, Colorado Department of Revenue, [6] A. J. Porath-Waller, R. Notarandrea, and F. J. Vaccarino, Young brains on cannabis: It s time to clear the smoke, Clin. Pharmacol. Ther., vol. 97, no. 6, pp , Jun [7] Berning A., Compton, R., Wochinger, K., National Roadside Survey of Alcohol and Drug Use by Drivers, NHTSA s Office of Behavioral Safety Research, [8] The DEC Standards Revision Subcommittee of the Technical Advisory Panel of the IACP Highway Safety Committee, International Association of Chiefs of Police (IACP), Alexandria, VA, [9] M. Asbridge, Driving after marijuana use: the changing face of impaired driving, JAMA Pediatr., vol. 168, no. 7, pp , Jul [10] M. Asbridge, J. A. Hayden, and J. L. Cartwright, Acute cannabis consumption and motor vehicle collision risk: systematic review of observational studies and metaanalysis, BMJ, vol. 344, p. e536, [11] R. Elvik, Risk of road accident associated with the use of drugs: a systematic review and meta-analysis of evidence from epidemiological studies, Accid. Anal. Prev., vol. 60, pp , Nov [12] R. P. Compton and A. Berning, Drug and alcohol crash risk, National Highway Traffic Safety Administration, Washington, DC, Research Note DOT HS , Feb
32 [13] E. M. Kosnoski, R. L. Yolton, K. Citek, C. E. Hayes, and R. B. Evans, The Drug Evaluation Classification Program: using ocular and other signs to detect drug intoxication, J. Am. Optom. Assoc., vol. 69, no. 4, pp , Apr [14] W. M. Bosker, E. L. Theunissen, S. Conen, K. P. C. Kuypers, W. K. Jeffery, H. C. Walls, G. F. Kauert, S. W. Toennes, M. R. Moeller, and J. G. Ramaekers, A placebocontrolled study to assess Standardized Field Sobriety Tests performance during alcohol and cannabis intoxication in heavy cannabis users and accuracy of point of collection testing devices for detecting THC in oral fluid, Psychopharmacology (Berl.), vol. 223, no. 4, pp , Oct [15] Drug Evaluation and Classification Training: The Drug Recognition Expert School, Student Manual, National Highway Traffic Safety Administration, HS 172 R01/11, Jan [16] L. J. Farrell, S. Kerrigan, and B. K. Logan, Recommendations for toxicological investigation of drug impaired driving, J. Forensic Sci., vol. 52, no. 5, pp , Sep [17] B. K. Logan, K. J. Lowrie, J. L. Turri, J. K. Yeakel, J. F. Limoges, A. K. Miles, C. E. Scarneo, S. Kerrigan, and L. J. Farrell, Recommendations for toxicological investigation of drug-impaired driving and motor vehicle fatalities, J. Anal. Toxicol., vol. 37, no. 8, pp , Oct [18] E. Wood, A. Brooks-Russell, and P. Drum, Delays in DUI blood testing: Impact on cannabis DUI assessments, Traffic Inj. Prev., p. 0, Jun [19] F. Grotenhermen, G. Leson, G. Berghaus, O. H. Drummer, H.-P. Krüger, M. Longo, H. Moskowitz, B. Perrine, J. G. Ramaekers, A. Smiley, and R. Tunbridge, Developing limits for driving under cannabis, Addict. Abingdon Engl., vol. 102, no. 12, pp , Dec [20] N. A. Desrosiers, S. K. Himes, K. B. Scheidweiler, M. Concheiro-Guisan, D. A. Gorelick, and M. A. Huestis, Phase I and II cannabinoid disposition in blood and plasma of occasional and frequent smokers following controlled smoked cannabis, Clin. Chem., vol. 60, no. 4, pp , Apr [21] K. Papafotiou, J. D. Carter, and C. Stough, An evaluation of the sensitivity of the Standardised Field Sobriety Tests (SFSTs) to detect impairment due to marijuana intoxication, Psychopharmacology (Berl.), vol. 180, no. 1, pp , Jun [22] A. J. Porath-Waller and D. J. Beirness, An Examination of the Validity of the Standardized Field Sobriety Test in Detecting Drug Impairment Using Data from the Drug Evaluation and Classification Program, Traffic Inj. Prev., vol. 15, no. 2, pp , Feb
33 [23] H. Moskowit and D. Fiorentino, A Review of the Literature on the Effects of Low Doses of Alcohol on Driving-Related Skills, U.S. Department of Transportation National Highway Traffic Safety Administration, Washington, DC, [24] E. J. Cone, G. E. Bigelow, E. S. Herrmann, J. M. Mitchell, C. LoDico, R. Flegel, and R. Vandrey, Nonsmoker Exposure to Secondhand Cannabis Smoke. III. Oral Fluid and Blood Drug Concentrations and Corresponding Subjective Effects, J. Anal. Toxicol., vol. 39, no. 7, pp , Sep [25] N. A. Desrosiers, J. G. Ramaekers, E. Chauchard, D. A. Gorelick, and M. A. Huestis, Smoked cannabis psychomotor and neurocognitive effects in occasional and frequent smokers, J. Anal. Toxicol., vol. 39, no. 4, pp , May [26] H. V. Curran, C. Brignell, S. Fletcher, P. Middleton, and J. Henry, Cognitive and subjective dose-response effects of acute oral Delta 9-tetrahydrocannabinol (THC) in infrequent cannabis users, Psychopharmacology (Berl.), vol. 164, no. 1, pp , Oct [27] A. S. Tippetts, R. B. Voas, J. C. Fell, and J. L. Nichols, A meta-analysis of.08 BAC laws in 19 jurisdictions in the United States, Accid. Anal. Prev., vol. 37, no. 1, pp , Jan [28] A. Villaveces, P. Cummings, T. D. Koepsell, F. P. Rivara, T. Lumley, and J. Moffat, Association of alcohol-related laws with deaths due to motor vehicle and motorcycle crashes in the United States, , Am. J. Epidemiol., vol. 157, no. 2, pp , Jan [29] The 2014 Annual Report of the Drug Recognition Expert Section, International Association of Chiefs of Police, Alexandria, VA, Oct [30] R. A. Shults, R. W. Elder, D. A. Sleet, J. L. Nichols, M. O. Alao, V. G. Carande-Kulis, S. Zaza, D. M. Sosin, R. S. Thompson, and Task Force on Community Preventive Services, Reviews of evidence regarding interventions to reduce alcohol-impaired driving, Am. J. Prev. Med., vol. 21, no. 4 Suppl, pp , Nov [31] Blomberg, RD, Lower BAC limits for youth: evaluation of the Maryland.02 law., National Highway Traffic Safety Administration, Washington, DC, DOT HS , [32] E. Chamberlain, R. Solomon, and A. Kus, Drug-Impaired Driving in Canada: Moving Beyond American Enforcement Models, Crim. LAW Q., vol. 60, no. 2, pp , [33] E. Chamberlain, R. Solomon, and A. Murie, Reforming Canada s new drug-impaired driving law: the need for per se limits and random roadside screening, presented at the International Conference on Alcohol, Drugs and Traffic Safety (T2013), 20th, 2013, Brisbane, Queensland, Australia,

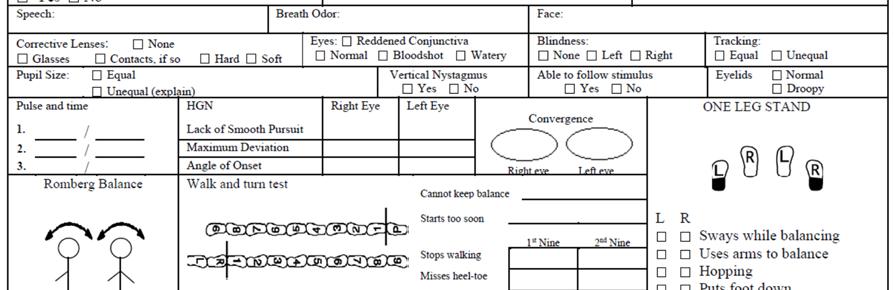
34 Appendices Appendix A: DRE Facesheet 32
35 Appendix B: Psychophysical Tests The Walk-and-Turn test involves taking nine heel-to-toe steps along a line, turning, and taking nine steps back according to instructions. There are eight validated clues that are scored: Cannot keep balance Starts too soon Stops walking Misses heel to toe Steps off line Raises arms Incorrect number of steps Improper turn Two or more of these clues are deemed by the DEC program to represent impaired performance. The One-Leg Stand test requires the individual to stand on one foot while holding the other foot six inches above the ground for 30 seconds. There are four validated clues that are scored: Sways while balancing Uses arms to balance Hopping Puts foot down Two or more clues are deemed to be indicative of impaired performance. The Finger-to-Nose test (Modified Romberg Balance Test) is a classic field test of psychomotor performance and forms part of the DEC assessment. The test requires the individual to stand with feet together, head tilted slightly back, hands at sides, with eyes closed, and on instruction touch the tip of the finger to the tip of the nose on six occasions. 33
36 Appendix C: DRE Matrix 2 CNS Depressants CNS Stimulants Hallucinogens Dissociative Anesthetics Narcotic Analgesics Inhalants Cannabis HGN Present None None Present None Present None Vertical Nystagmus Lack of Convergence Present (High Dose) None None Present None Present (High Dose) Present None None Present None Present Present Pupil Size Normal (1) Dilated Dilated Normal Constricted Normal (4) Dilated (6) None Reaction to Light Slow Slow Normal (3) Normal Little or None Visible Slow Normal Pulse Rate Down (2) Up Up Up Down Up Up Blood Pressure Down Up Up Up Down Up/Down (5) Up Body Temperature Normal Up Up Up Down Normal Up/Down Normal Muscle Tone Flaccid Rigid Rigid Rigid Flaccid Normal/Flaccid Normal Footnotes: 1) SOMA, Quaaludes and some anti-depressants usually dilate pupils. 2) Quaaludes, alcohol and possibly some anti-depressants may elevate 3) Certain psychedelic amphetamines causing slowing 4) Normal, but may be dilated 5) Up - volatile solvents and aerosols; Down - anesthetic gases 6) Pupil size possibly normal 2 International Association of Chiefs of Police (IACP). (1999). The international standards of the Drug Evaluation and Classification program. Arlington, VA: The DEC Standards Revision Subcommittee of the Technical Advisory Panel of the IACP Highway Safety Committee. 34


37 Appendix D: Supplemental Figures Figure D. 1: Pupil Size of Drivers with THC Conc. of <5 ng/ml & 5+ ng/ml Figure D. 2: Eye Clues among Drivers with THC Conc. of <5 & 5+ ng/ml 35


38 Figure D.3: Systolic BP of Drivers with THC Conc. of <5 ng/ml & 5+ ng/ml Figure D. 4: Diastolic Blood Pressure of Drivers with THC Conc. of <5 & 5+ ng/ml 36


39 Figure D. 5: Pulse Among Drivers with THC Conc. of <5 & 5+ ng/ml Figure D. 6: Walk-and-turn Clues of Drivers with THC Conc. of <5 and 5+ ng/ml 37


40 Figure D. 7: One-leg-stand Clues among Drivers with THC Conc. of <5 & 5+ ng/ml Figure D. 8: Finger-to-Nose Misses of Drivers with THC Conc. of <5 & 5+ ng/ml 38
41 Appendix E: Literature Review Introduction The psychoactive effects of delta-9-tetrahydrocannabinol (THC) including relaxation, changes in perception, euphoria, feelings of well-being, reduced stress, and mild sedation have been cited as possible contributors to the documented rates of arrest and crash involvement in various driving populations. As there is an accelerating trend in the U.S. towards liberalization of laws around the cultivation, possession, and use of cannabis, either for medical purposes or more recently for recreational use, the question of the link between cannabis use and driver impairment has come to the forefront. Increasing attention is being paid by the public, legislators, and the criminal justice system, to the issue of drug impaired driving in the United States. This can be attributed to many factors including: increased training of police officers in recognizing signs of drug impairment, increased interest in prevalence, demographic and relative risk studies, and increasing (if uneven) resources being applied to drug testing suspected impaired drivers. Groups on both sides of the debate around liberalization of cannabis laws recognize the need for a better understanding of the risks and means by which to educate users about safe use of the drug as well as the need to control, regulate, legislate and subsequently enforce laws designed to reduce the risk of impairment, and associated injuries and deaths in motor vehicle crashes. The purpose of this review is to collect and summarize the current state of knowledge about the issue including information on the legal status of cannabis and state statutes which address driving under the influence of cannabis (DUIC), the prevalence of cannabis use in driving populations, the role of Drug Recognition Experts (DREs) in identifying drivers under the influence of cannabis, and the research on the potentially impairing effects of cannabis. Legal Issues Cannabis Possession Laws While there has been no change to the legal status of cannabis at the federal level since the 1970 s, state laws for possession of small amounts (varies by state) continue to evolve and can loosely be divided into four groups: legalized for recreational use; decriminalized (civil offense) for recreational use; legalized for medical use; and illegal (Figure E.1). The National Organization for the Reform of Marijuana Laws (NORML) provides a thorough and regularly updated list of laws by state [1]. Legalization for recreational use in Colorado and Washington became effective in 2013 and in 2014, respectively; ballot initiatives legalizing recreational use passed in Oregon, Alaska and the District of Columbia in 2014, although implementation is still pending [1]. Some states such as Arizona and Montana have approved medical use of cannabis; however, possession without a proper prescription is punishable by incarceration. North Carolina, along with several cities and municipalities in other states, has decriminalized possession making it a civil instead of criminal offense. Decriminalization of drug possession on a municipal basis is complex, because while a city may decide not to prosecute possession as a criminal offense, the state may still do so. In addition, cannabis remains a Schedule I substance on the Federal Schedule, and the Federal Government can still prosecute possession or distribution of cannabis, arguably in 39

42 cases where the state fails to act, and if the alleged crime involves more than one state. Figure E. 1: Legal status of cannabis by state. In states where cannabis is legal or decriminalized, the maximum weight that can be possessed without possible incarceration is indicated. In all other states, possession of any amount of cannabis is punishable by incarceration. *Statute lists weight in grams listed; weight in ounces is approximate. All data extracted from in February 2016 Driving Under the Influence of Cannabis (DUIC) Laws Every state has laws governing the use of a motor vehicle following the use of cannabis, which fall into three categories: 1) effect-based laws, 2) per se driving under the influence of drugs (DUID) laws and 3) zero tolerance laws [2]. Under zero tolerance, driving a car with the presence of any detectable amount of a listed drug or drug metabolite in blood and/or urine is illegal. Under per se laws, a person is assumed to be impaired if the drug concentration exceeds a defined concentration and there is no requirement to provide evidence of impairment, beyond that required for probable cause to obtain the specimen. Finally, effect-based laws require evidence of impairment to be presented in order to convict someone of DUID. Table E.1 summarizes the DUIC laws in states which have per se or zero tolerance laws. South Dakota is not included in the table however it should be noted that it does have a zero tolerance policy for individuals under the age of 21 [3]. Blood is an acceptable biological testing matrix in all states which require evidence of impairment; 15 40
Introduction to the Drug Evaluation and Classification Program
 Introduction to the Drug Evaluation and Classification Program Presented by: Detective Peter Sweet Cumberland Police Department Drug Recognition Expert Instructor April 12, 2017 About me Police Officer
The Drug Evaluation and Classification Program
 The Drug Evaluation and Classification Program International Association of Chiefs of Police Drug Evaluation and Classification (DEC) Program The Drug Evaluation and Classification (DEC) Program is a transportation
Advancing Drugged Driving Data at the State Level: State-by-State Assessment
 Advancing Drugged Driving Data at the State Level: State-by-State Assessment April 2018 607 14th Street, NW, Suite 201 Washington, DC 20005 202-638-5944 Title Advancing Drugged Driving Data at the State
Medical Marijuana Responsible for Traffic Fatalities Alfred Crancer, B.S., M.A.; Phillip Drum, Pharm.D.
 Medical Marijuana Responsible for Traffic Fatalities Alfred Crancer, B.S., M.A.; Phillip Drum, Pharm.D. Abstract In California, where only 25% of the drivers in fatal crashes are tested for drugs, 252
Update on Marijuana Research. Source:
 Update on Marijuana Research Source: http://www.hightimes.com/read/radical-rant-truth-about-marijuana-and-driving Today: Drugged driving (DD) has received national attention, because of state legalization
The Drug Recognition Expert Officer: Signs Of Drug Impairment At Roadside
 The Drug Recognition Expert Officer: Signs Of Drug Impairment At Roadside T. E. Page P.O. Box 50332 Pasadena, California 91115-0332 USA Los Angeles Police Department, retired Keywords Drugs, DRE, Drug
Drug Evaluation. and Classification in Nova Scotia AND THE IMPACT OF THE LEGALIZATION OF CANNABIS. Item No
 Drug Evaluation Item No. 7.3.2 and Classification in Nova Scotia AND THE IMPACT OF THE LEGALIZATION OF CANNABIS Constable Chad Morrison Provincial DRE Coordinator H Division Overview Began in LA early
Medical Advisory Board. reviews medical issues for licensure regarding individual drivers. medical conditions. not specified. reporting encouraged,
 State Reporting Regulations for Physicians Adapted from the Physician s Guide to Assessing and Counseling Older Drivers 44 and Madd.org 45 State Physician/Medical Reporting (NOTE MERGED CELLS) Mandatory,
Drug Impaired Driving Update. Chuck Hayes International Association of Chiefs of Police
 Drug Impaired Driving Update Chuck Hayes International Association of Chiefs of Police Drugged Driving For many years an under-recognized highway safety problem Exact impact on highway safety not exactly
Any substance that, when taken into the human body, can impair the ability of the person to operate a vehicle safely.
 How do we define the term drug for DRE purposes? Any substance that, when taken into the human body, can impair the ability of the person to operate a vehicle safely. Review-2 Basic Drug Statistics What
HIGHway to Hell: The Science Behind Drugged Driving
 HIGHway to Hell: The Science Behind Drugged Driving Facilitator: Brian Ursino, Director, Law Enforcement, AAMVA Presenters: John Lacey, Center Director, Pacific Institute for Research and Evaluation Mike
Standardized Field Sobriety Testing Refresher
 Standardized Field Sobriety Testing Refresher Location Date Instructor needs to put in Location and Date. SESSION I: INTRODUCTION AND OVERVIEW Upon successfully completing this session, the participant
North Carolina Drug Evaluation & Classification (DEC) Program
 Program") State of North Carolina Forensic Tests for Alcohol Branch Division of Public Health Department of Health & Human Services North Carolina Drug Evaluation & Classification (DEC) Program Drug Recognition
State of North Carolina Forensic Tests for Alcohol Branch Division of Public Health Department of Health & Human Services North Carolina Drug Evaluation & Classification (DEC) Program Drug Recognition
4/27/2016. About CCSA. Impaired Driving Research at CCSA. Background. Presentation Overview. Lessons Learned
 About CCSA Drug-Impaired Driving i in Canada: Lessons Learned International Conference on Urban Traffic Safety Amy Porath-Waller, Ph.D. April 26, 2016 CCSA is Canada s only agency with a legislated national
Drug-Impaired Driving in the United States
 Drug-Impaired Driving in the United States What is the Drug-Impaired Driving Learning Centre (DIDLC)? The Drug Impaired Driving Learning Centre (DIDLC) is a fully bilingual, web-based educational resource
ROAD SAFETY MONITOR. ALCOHOL-IMPAIRED DRIVING IN THE UNITED STATES Results from the 2017 TIRF USA Road Safety Monitor
 Background What is the context of alcohol-impaired driving in the U.S.? According to the National Highway Traffic Safety Administration (NHTSA), alcohol-impaired driving fatalities involving a driver with
States with Authority to Require Nonresident Pharmacies to Report to PMP
 States with Authority to Require Nonresident Pharmacies to Report to PMP Research current through May 2016. This project was supported by Grant No. G1599ONDCP03A, awarded by the Office of National Drug
Per Se BLOOD ALCOHOL CONCENTRATION AND MOTOR VEHICLE SAFETY
 CASE STUDY PHYSICIANS GUIDE TO STATE LEGISLATION Per Se BLOOD ALCOHOL CONCENTRATION AND MOTOR VEHICLE SAFETY Issue Enacting and enforcing state legislation to prohibit alcohol-impaired driving by mandating
Drug and Alcohol Impairment. Alabama DRE / SFST Program
 Drug and Alcohol Impairment Alabama DRE / SFST Program WHAT IS A DRUG? Working Definition of Drug : Any substance that, when taken into the human body, can impair the ability of the person to operate a
Ending Marijuana Prohibition/ The Effects on Impaired Driving. Colorado Highway Safety Office
 Ending Marijuana Prohibition/ The Effects on Impaired Driving Colorado Highway Safety Office Glenn Davis: Littleton Police, Littleton Colorado: 1979-2004 Agent South Metro Drug Task Force Detective DRE
ANNUAL REPORT. of the IACP DRUG EVALUATION & CLASSIFICATION PROGRAM
 2016 ANNUAL REPORT of the IACP DRUG EVALUATION & CLASSIFICATION PROGRAM (Page left blank intentionally) 1 Contents DESCRIPTION OF THE DRUG RECOGNITION EXPERT INSIGNIA 4 2016 DEC PROGRAM NOTABLE ACCOMPLISHMENTS
ADDRESSING THE PROBLEM OF MARIJUANA- IMPAIRED DRIVING By Teri Moore May 2018
 Cannabis Policy Policy Cannabis Series ADDRESSING THE PROBLEM OF MARIJUANA- IMPAIRED DRIVING By Teri Moore May 2018 States that have decriminalized or plan to decriminalize marijuana use are grappling
Safeguarding Our High ways Combating Drugged Driving
 Safeguarding Our High ways Combating Drugged Driving Minnesota Towards Zero Deaths Chuck Hayes, IACP DEC Program Impaired Driving Through the Years 1910-1 st "drunk driving" arrest (NYC) 1930 s - CHP recognizes
What is a DRE. Introduction to Drugged Driving
 Introduction to Drugged Driving What is a DRE DRE Training & Certification For a list of classes scheduled in 2016, click here. The DEC Program trains police officers and other approved public safety officials
Strategies for Impaired Driving Enforcement. Detective John Cullen Jacksonville (Florida) Sheriff s Office
 Sheriff s Office") Strategies for Impaired Driving Enforcement Detective John Cullen Jacksonville (Florida) Sheriff s Office Our S.I.D.E. Objectives Review 3 phases of DUI investigation Transition to ARIDE ARIDE to DRE Vehicle
Strategies for Impaired Driving Enforcement Detective John Cullen Jacksonville (Florida) Sheriff s Office Our S.I.D.E. Objectives Review 3 phases of DUI investigation Transition to ARIDE ARIDE to DRE Vehicle
Drug recognition expert evaluations made using limited data
 Forensic Science International 130 (2002) 167 173 Drug recognition expert evaluations made using limited data John A. Smith a, Charles E. Hayes b, Robert L. Yolton a,*, Dale A. Rutledge c, Karl Citek a
Report on Drugged Driving in Louisiana. Quantification of its Impact on Public Health and Implications for Legislation, Enforcement and Prosecution
 Report on Drugged Driving in Louisiana Quantification of its Impact on Public Health and Implications for Legislation, Enforcement and Prosecution Objectives Objective 1: Evaluate laws and policies about
Marijuana and driving in the United States: prevalence, risks, and laws
 Marijuana and driving in the United States: prevalence, risks, and laws Lifesavers National Conference 2016 Long Beach, California April 4, 2016 Anne T. McCartt iihs.org IIHS is an independent, nonprofit
2018 HPV Legislative Report Card
 2018 HPV Legislative Report Card This report card is a snapshot of each state s documented efforts to enact or introduce HPV vaccine legislation to improve education and awareness, or provide access to
Lessons Learned from Colorado. Jen Knudsen Colorado Traffic Safety Resource Prosecutor
 Lessons Learned from Colorado Jen Knudsen Colorado Traffic Safety Resource Prosecutor Traffic Safety Resource Prosecutor Work with national experts on traffic safety issues; Present training including
Nebraska LB605: This bill is designed to reduce prison overcrowding and allows for alternatives to incarceration like CAM.
 State Legislative Summary SCRAM CAM and 24/7 Sobriety Programs 2015 Legislation Arkansas SB472: Known as the Criminal Justice Reform Act of 2015 this bill implements measures designed to enhance public
2012 Medicaid and Partnership Chart
 2012 Medicaid and Chart or Alabama $525,000.00 $4,800.00 Minimum: 25,000.00 Alaska $525,000.00 Depends on area of state; Minimum: $113,640 $10,000 in Anchorage $1,656 Minimum:$1838.75 Maximum:$2,841 Minimum:
DRE, SFST & Oral Fluid Devices working together to keep our roads safe
 DRE, SFST & Oral Fluid Devices working together to keep our roads safe Cpl. Dave Botham Drug Evaluation and Classification Program National Traffic Services Our New World Government set to legalize cannabis
ACEP National H1N1 Preparedness Survey Results
 1) On a scale from 1 to 10 (10 being totally prepared and 1 being totally unprepared), do you think your hospital is prepared to manage a surge of H1N1 flu patients this fall and winter? (totally prepared)
Instant Drug Testing State Law Guide
 Instant Drug Testing State Law Guide State Alabama Alaska Arizona POCT / Instant Testing Status Comment outside this voluntary law but not by companies that wish to qualify for the WC discount. FDA-cleared
Prevalence of Self-Reported Obesity Among U.S. Adults by State and Territory. Definitions Obesity: Body Mass Index (BMI) of 30 or higher.
 of 30 or higher.") Prevalence of Self-Reported Obesity Among U.S. Adults by State and Territory Definitions Obesity: Body Mass Index (BMI) of 30 or higher. Body Mass Index (BMI): A measure of an adult s weight in relation
Prevalence of Self-Reported Obesity Among U.S. Adults by State and Territory Definitions Obesity: Body Mass Index (BMI) of 30 or higher. Body Mass Index (BMI): A measure of an adult s weight in relation
3/15/2018. Drug Impaired Driving: Trends, Technology, and Innovation. Erin Holmes. TMCEC Traffic Safety Initiatives Conference March 26, 2018
 Drug Impaired Driving: Trends, Technology, and Innovation Erin Holmes TMCEC Traffic Safety Initiatives Conference March 26, 2018 2 1 3 Overview Magnitude of the DUID problem DUID enforcement DUID testing
Thomas Reagan. Law Enforcement Liaison Maine Bureau of Highway Safety Retired DRE
 Thomas Reagan Law Enforcement Liaison Maine Bureau of Highway Safety Retired DRE Maine Marijuana (cannabis) was prohibited in 1913 2.5 ounces decriminalized in 1976 (civil) Medical Marijuana law was passed
Jack Reed, MA Statistical Analyst, Office of Research and Statistics, Colorado Division of Criminal Justice, Department of Public Safety
 1 Lauren Dutra, PhD Research Public Health Analyst, Center for Health Policy Science & Tobacco Research, RTI International Jack Reed, MA Statistical Analyst, Office of Research and Statistics, Colorado
Review of Drug Impaired Driving Legislation (Victoria Dec 2000) and New Random Drug Driving Legislation Based on Oral Fluid Testing
 and New Random Drug Driving Legislation Based on Oral Fluid Testing") Review of Drug Impaired Driving Legislation (Victoria Dec 2000) and New Random Drug Driving Legislation Based on Oral Fluid Testing P D Swann MC Boorman JJ Potter VicRoads Road Safety Department 60 Denmark
Review of Drug Impaired Driving Legislation (Victoria Dec 2000) and New Random Drug Driving Legislation Based on Oral Fluid Testing P D Swann MC Boorman JJ Potter VicRoads Road Safety Department 60 Denmark
The British Columbia Coroners Service is committed to conducting a thorough, independent examination of the factors contributing to death in order to
 The British Columbia Coroners Service is committed to conducting a thorough, independent examination of the factors contributing to death in order to improve community safety and quality of life in the
Jim Hedlund Highway Safety North. GHSA Webinar May 3, :00 3:00 pm EDT
 Jim Hedlund Highway Safety North GHSA Webinar May 3, 2017 2:00 3:00 pm EDT 2 Drug-impaired driving: very brief background What s new since 2015 Data Laws Research Programs Questions 3 Definition: what
A Colorado Validation Study. of the. Standardized Field Sobriety Test (SFST) Battery
 Battery") A Colorado Validation Study of the Standardized Field Sobriety Test (SFST) Battery Final Report Submitted to Colorado Department of Transportation November 1995 Marcelline Burns, Ph.D. Southern California
A Colorado Validation Study of the Standardized Field Sobriety Test (SFST) Battery Final Report Submitted to Colorado Department of Transportation November 1995 Marcelline Burns, Ph.D. Southern California
You Don t Know Spit.but you will soon!
 You Don t Know Spit.but you will soon! Karen C. Wittman Deputy District Attorney Mark Dupree-District Attorney Wyandotte County District Attorney s Office If you spit you must convict. Spit happens! Roadside
Forensic Patients in State Hospitals:
 Forensic Patients in State Hospitals: 1999-2016 Vera Hollen, M.A. Senior Director of Research & Consulting Director, Mental Health/Criminal Justice Research Center National Association of State Mental
TECHNICAL NOTE TOXICOLOGY. Kari Declues, 1 M.S.; Shelli Perez, 1 M.S.; and Ariana Figueroa, 1 M.S.
 TECHNICAL NOTE J Forensic Sci, 2017 doi: 10.1111/1556-4029.13550 Available online at: onlinelibrary.wiley.com TOXICOLOGY Kari Declues, 1 M.S.; Shelli Perez, 1 M.S.; and Ariana Figueroa, 1 M.S. A Two-Year
Methamphetamines: A National and State Crisis. Research Brief. Prepared by
 Methamphetamines: A National and State Crisis Research Brief Prepared by P. Allison Minugh, Ph.D. Nicoletta A. Lomuto, M.S. Kelly R. Breeden, M.S. Dennis Embry, Ph.D. Headquarters Two Richmond Square Providence,
DRIVING UNDER THE INFLUENCE
 AOM CHAPTER O 302 DRIVING UNDER THE INFLUENCE [61.1.11] Table of Contents I. INTRODUCTORY DISCUSSION II. ALCOHOL ENFORCEMENT TRAINING PROGRAM [61.1.10] III. SPECIALIZED DETAILS & ASSIGNMENTS [61.1.10]
Drug-Impaired Driving Investigation
 Drug-Impaired Driving Investigation Michel Pilon, Expert Advisor in Highway Safety and Provincial Advisor for the Drug Evaluation and Classification Program (DECP) École nationale de police du Québec CARSP
Research Memo. 4. What are the sanctions for DUI accidents resulting in serious injury and/or death?
 6/9/2009 09 RM 017 Date: June 4, 2009 Research Memo Author: Kelley Shepp, Associate Research Analyst Re: Driving Under the Influence Laws and Penalties QUESTION 1. In Wyoming and other states, how many
PETITION FOR DUAL MEMBERSHIP
 PLEASE PRINT: PETITION FOR DUAL MEMBERSHIP Bradenton, Florida this day of, AD. To the Master, Wardens and Members of Manatee Lodge No. 31, F&AM: (The Petitioner will answer the following questions) What
NM Coalition of Sexual Assault Programs, Inc.
 NM Coalition of Sexual Assault Programs, Inc. PREVALENCE OF SEXUAL VIOLENCE AMONG WOMEN IN NEW MEXICO: A SUMMARY OF THE FINDINGS FROM THE NATIONAL INTIMATE PARTNER AND SEXUAL VIOLENCE SURVEY 2010 2012
Drug-Impaired Driving in Europe
 Drug-Impaired Driving in Europe What is the Drug-Impaired Driving Learning Centre (DIDLC)? The Drug Impaired Driving Learning Centre (DIDLC) is a fully bilingual, web-based educational resource that was
Cirrhosis and Liver Cancer Mortality in the United States : An Observational Study Supplementary Material
 Cirrhosis and Liver Cancer Mortality in the United States 1999-2016: An Observational Study Supplementary Material Elliot B. Tapper MD (1,2) and Neehar D Parikh MD MS (1,2) 1. Division of Gastroenterology
Marijuana and DWI. Using Science to Cut Through the Smoke
 Marijuana and DWI Using Science to Cut Through the Smoke Hello Mary Jane Marijuana and Public Policy Between 25% and 60% of cartel profits come from Marijuana RAND Corporation study vs. White House Office
Marijuana and DWI 1/31/2017. Smoking Vaporizing Ingestion of edibles. Hello Mary Jane. Summary. Marijuana and Public Policy
 Hello Mary Jane Marijuana and DWI Using Science to Cut Through the Smoke Marijuana and Public Policy Summary Between 25% and 60% of cartel profits come from Marijuana RAND Corporation study vs. White House
Peer Specialist Workforce. State-by-state information on key indicators, and links to each state s peer certification program web site.
 Peer Specialist Workforce State-by-state information on key indicators, and links to each state s peer certification program web site. Alabama Peer support not Medicaid-reimbursable 204 peer specialists
Opioid Deaths Quadruple Since 1999
 THE COUNCIL OF STATE GOVERNMENTS CAPITOL RESEARCH AUGUST 2017 HEALTH POLICY Opioid Deaths Quadruple Since 1999 Since 1999, the number of overdose deaths involving opioids (including prescription opioids
MARIJUANA USE AMONG DRIVERS IN CANADA,
 T R A F F I C I N J U R Y R E S E A R C H F O U N D A T I O N MARIJUANA USE AMONG DRIVERS IN CANADA, 2000-2014 Traffic Injury Research Foundation, December 2017 Introduction Public concern about drug-impaired
Driving Under the Influence of Alcohol and Marijuana: Beliefs and Behaviors, United States,
 Car crashes rank among the leading causes of death in the United States. Driving Under the Influence of Alcohol and Marijuana: Beliefs and Behaviors, United States, 2013-2015 May 2016 607 14th Street,
If you suspect Fido's owner is diverting prescription pain meds meant for the pet, checking your state's drug monitoring database may not help
 Prescriptions If you suspect Fido's owner is diverting prescription pain meds meant for the pet, checking your state's drug monitoring database may not help by Ann M. Philbrick, PharmD, BCPS The Centers
Effects of Cannabis on Driving
 Effects of Cannabis on Driving What is the Drug-Impaired Driving Learning Centre (DIDLC)? The Drug Impaired Driving Learning Centre (DIDLC) is a fully bilingual, web-based educational resource that was
Overview of the Drug Evaluation and Classification Program April 28, 2015
 Overview of the Drug Evaluation and Classification Program April 28, 2015 Sergeant Paul Batcheller Iowa City Police Department Senior Police Officer Mike Dixson Des Moines Police Department Maurice Curry
The Legalization of Marijuana in Colorado: The Impact Vol. 3 Preview 2015
 THIS PAGE INTENTIONALLY LEFT BLANK Table of Contents Introduction Purpose...1 Preface...1 SECTION 1: Impaired Driving Definitions...3 Findings...3 Data...4 Colorado State Patrol Number of DUIDs, 2014...
Cessation and Cessation Measures
 Cessation and Cessation Measures among Adult Daily Smokers: National and State-Specific Data David M. Burns, Christy M. Anderson, Michael Johnson, Jacqueline M. Major, Lois Biener, Jerry Vaughn, Thomas
AUL s 2014 Life List
 AUL s 2014 Life List 1. Louisiana tops the Life List list for the fifth year in a row. Louisiana tops the list because of its decades-long history of enacting common-sense limitations on abortion; it also
SAFETY SERVICES NOVA SCOTIA The Human Factor Evolving Health & Safety
 Drug Recognition Expert Program SAFETY SERVICES NOVA SCOTIA The Human Factor Evolving Health & Safety March 23 th 2011 Goal The goal of the IACP Drug Recognition Expert Program is to help prevent ent collisions
Obesity Trends:
 Obesity Trends: 1985-2014 Compiled by the Centers for Disease Control and Prevention Retrieved from http://www.cdc.gov/obesity/data/prevalencemaps.html Organized into two groupings due to methodological
Percent of U.S. State Populations Covered by 100% Smokefree Air Laws April 1, 2018
 Defending your right to breathe smokefree air since 1976 Percent U.S. State Populations Covered by 100% Smokefree Air April 1, 2018 This table lists the percent each state s population covered by air laws
The Healthy Indiana Plan
 The Healthy Indiana Plan House Enrolled Act 1678 A Pragmatic Approach Governor Mitch Daniels July 16, 2007 Indiana s Fiscal Health is Good First Back-to-Back Balanced Budget in Eight Years $1,000.0 Revenue
Hepatitis C: The State of Medicaid Access. Preliminary Findings: National Summary Report
 Hepatitis C: The State of Medicaid Access Preliminary Findings: National Summary Report November 14, 2016 Table of Contents Introduction...... 3 Methods... 4 Findings.... 5 Discussion.. 13 Conclusion...
Using Policy, Programs, and Partnerships to Stamp Out Breast and Cervical Cancers
 Using Policy, Programs, and Partnerships to Stamp Out Breast and Cervical Cancers National Conference of State Legislatures Annual Meeting J August 2006 Christy Schmidt Senior Director of Policy National
Medical Marijuana
 Medical Marijuana 1999-2001 June 2003 Codebook ImpacTeen is part of the Bridging the Gap Initiative: Research Informing Practice for Healthy Youth Behavior, supported by The Robert Wood Johnson Foundation
The Drug Recognition Expert and Impaired Driving Enforcement. by Sgt. Jamie Boothe
 The Drug Recognition Expert and Impaired Driving Enforcement by Sgt. Jamie Boothe School of Law Enforcement Supervision (SLES) Session XXXIV Criminal Justice Institute November 20, 2009 The Drug Recognition
MAKING WAVES WITH STATE WATER POLICIES. Washington State Department of Health
 MAKING WAVES WITH STATE WATER POLICIES Washington State Department of Health Lead poisoning is a public health problem. Health Effects of Lead Lead Exposures and Pathways HOME Paint Lead pipes Lead solder
Hawai i to Zero. Timothy McCormick Harm Reduction Services Branch Hawai i Department of Health. January 16, 2018
 HIV Prevention Efforts in Hawai i Hawai i to Zero Timothy McCormick Harm Reduction Services Branch Hawai i Department of Health January 16, 2018 People living with HIV who take HIV medicine as prescribed
Decriminalization of Marijuana and Potential Impact on CMV Drivers
 Decriminalization of Marijuana and Potential Impact on CMV Drivers Darrin T. Grondel, Director Washington Traffic Safety Commission November 29, 2018 Denver, Colorado Global Perspective Source: https://www.lexology.com/library/detail.aspx?g=021f280d-718f-469f-88b6-262d94237e35
International Association of Chiefs of Police
 International Association of Chiefs of Police Drug Evaluation and Classification Program 7-Day DRE School Quiz #5 Answer Key (2 points per question) NAME AGENCY DATE For each question, circle the letters
How Safe Are Our Roads? 2016 Checkpoint Strikeforce campaign poster celebrating real area cab drivers as being Beautiful designated sober drivers.
 How Safe Are Our Roads? 2016 Checkpoint Strikeforce campaign poster celebrating real area cab drivers as being Beautiful designated sober drivers. Annual Data Report on the Impact of Drunk Driving on Road
Welcome to: DRUG IMPAIRMENT TRAINING for EDUCATIONAL PROFESSIONALS (DITEP) Day One
 Day One") Welcome to: DRUG IMPAIRMENT TRAINING for EDUCATIONAL PROFESSIONALS (DITEP) Day One Goal Of This Program To enable education professionals to identify chemically impaired individuals and types of drugs
Welcome to: DRUG IMPAIRMENT TRAINING for EDUCATIONAL PROFESSIONALS (DITEP) Day One Goal Of This Program To enable education professionals to identify chemically impaired individuals and types of drugs
National Deaf Center on Postsecondary Outcomes. Data Interpretation Guide for State Reports: FAQ
 National Deaf Center on Postsecondary Outcomes Data Interpretation Guide for State Reports: FAQ This document was developed under a grant from the U.S. Department of Education, OSEP #HD326D160001. However,
Responses to a 2017 Survey on State Policies Regarding Community Health Workers: Home Visiting to Improve the Home Environment
 Responses to a 2017 Survey on State Policies Regarding Community Health Workers: Home Visiting to Improve the Home Environment The National Academy for State Health Policy (NASHP), with support from the
Recommendations for Re-Occupancy of Buildings Previously Used to Manufacture Methamphetamine
 Report to The Vermont Legislature for Re-Occupancy of Buildings Previously Used to Manufacture Methamphetamine In Accordance with Act 75 (2013), Strengthening Vermont s Response to Opiod Addiction and
Recreational marijuana and collision claim frequencies
 Highway Loss Data Institute Bulletin Vol. 35, No. 8 : April 2018 Recreational marijuana and collision claim frequencies Summary Colorado was the first state to legalize recreational marijuana for adults
Decriminalization of Marijuana and Potential Impact on CMV Drivers
 Decriminalization of Marijuana and Potential Impact on CMV Drivers Darrin T. Grondel, Director Washington Traffic Safety Commission April 2, 2018 UMassSafe CV-STAC GLOBAL PERSPECTIVE Source: https://www.lexology.com/library/detail.aspx?g=021f280d-718f-469f-88b6-262d94237e35
Public Health Federal Funding Request to Address the Opioid Epidemic
 Public Health Federal Funding Request to Address the Opioid Epidemic On December 4, 2017, in response to the President s recent declaration of the opioid epidemic as a public health emergency and the final
IMPAIRED DRIVING ISSUES DAVID ANDRASCIK PA DUI ASSOCIATION DRUG EVALUATION AND CLASSIFICATION PROGRAM STATE COORDINATOR
 IMPAIRED DRIVING ISSUES DAVID ANDRASCIK PA DUI ASSOCIATION DRUG EVALUATION AND CLASSIFICATION PROGRAM STATE COORDINATOR OVER 10,000 IMPAIRED DRIVING CRASHES ON OUR HIGHWAYS EACH YEAR (27+EACH DAY) NEARLY
Peer Specialist Workforce. State-by-state information on key indicators, and links to each state s peer certification program web site.
 Peer Specialist Workforce State-by-state information on key indicators, and links to each state s peer certification program web site. Alabama Peer support not Medicaid-reimbursable 204 peer specialists
SUMMARY OF SYNTHETIC CANNABINOID BILLS
 SUMMARY OF SYNTHETIC CANNABINOID BILLS Alabama: H.B. 163, S.B. 235, S.B. 283 indefinitely postponed as of 6/1/2011 - amends existing statute regarding chemical compounds to add JWH-200 and CP 47,497 Alaska:
The Effectiveness of Drinking-and-Driving Policies in the American States: A Cross-Sectional Time Series Analysis for
 The Effectiveness of Drinking-and-Driving Policies in the American States: A Cross-Sectional Time Series Analysis for 1984-2000 LE Richardson DJ Houston 105 Middlebush Hall, University of Missouri, Columbia,
Drugs and Driving: Detection and Deterrence
 Drugs and Driving: Detection and Deterrence Advisory Group on Drugs in Traffic Report prepared by : Douglas J. Beirness, Ph.D., Barry K. Logan, Ph.D., Philip Swann, Ph.D. Key Messages Drugs are as serious
AN OVERVIEW OF FEDERAL DRUG-IMPAIRED DRIVING ENFORCEMENT AND PROVINCIAL LICENCE SUSPENSIONS IN CANADA
 0 AN OVERVIEW OF FEDERAL DRUG-IMPAIRED DRIVING ENFORCEMENT AND PROVINCIAL LICENCE SUSPENSIONS IN CANADA R. Solomon & E. Chamberlain Professors, Faculty of Law Western University September 12 1 INTRODUCTION
Drug Per Se Laws. Key Considerations. The Issue. April Policy Brief
 www.ccsa.ca www.ccdus.ca April 2018 Policy Brief Drug Per Se Laws Key Considerations Despite the inherent difficulties associated with establishing per se drug laws, there is sufficient evidence to move
Colorado s Cannabis Experience Doug Friednash
 Colorado s Cannabis Experience Doug Friednash (dfriednash@bhfs.com) Brownstein Hyatt Farber Schreck, LLP Denver, Colorado 1 Marijuana in the US 62% of Americans say the use of marijuana should be legal.
Geographical Accuracy of Cell Phone Samples and the Effect on Telephone Survey Bias, Variance, and Cost
 Geographical Accuracy of Cell Phone Samples and the Effect on Telephone Survey Bias, Variance, and Cost Abstract Benjamin Skalland, NORC at the University of Chicago Meena Khare, National Center for Health
STATE RANKINGS REPORT NOVEMBER mississippi tobacco data
 STATE RANKINGS REPORT NOVEMBER 2017 mississippi tobacco data METHODS information about the data sources the youth risk behavior surveillance system The Youth Risk Behavior Surveillance System (YRBSS)
THE STEPPING UP INITIATIVE
 THE STEPPING UP INITIATIVE The Problem Each year, there are an estimated 2 million people with serious mental illnesses admitted to jail across the nation. Almost three quarters of these adults also have
It's tick time again! Recognizing black-legged (deer ticks) and measuring the spread of Lyme disease
 and measuring the spread of Lyme disease") It's tick time again! Recognizing black-legged (deer ticks) and measuring the spread of Lyme disease Actual sizes: These guys below (Ixodes scapularis) spread Lyme and other tick born diseases. Ixodes
It's tick time again! Recognizing black-legged (deer ticks) and measuring the spread of Lyme disease Actual sizes: These guys below (Ixodes scapularis) spread Lyme and other tick born diseases. Ixodes
Re: Implementation of the Federal Tamper-Resistant Prescription Pad Mandate
 January 2, 2008 Ms. Carol Herrmann-Steckel Commissioner Alabama Medicaid Agency PO Box 5624 501 Dexter Avenue Montgomery, AL 36103-5624 Re: Implementation of the Federal Tamper-Resistant Prescription Pad
Health Care Reform: Colorectal Cancer Screening Expansion, Before and After the Affordable Care Act (ACA)
") University of Arkansas for Medical Sciences From the SelectedWorks of Michael Preston April 9, 2014 Health Care Reform: Colorectal Cancer Screening Expansion, Before and After the Affordable Care Act (ACA)
University of Arkansas for Medical Sciences From the SelectedWorks of Michael Preston April 9, 2014 Health Care Reform: Colorectal Cancer Screening Expansion, Before and After the Affordable Care Act (ACA)