Donna L. Coffman Joint Prevention Methodology Seminar
|
|
|
- Coleen Booth
- 5 years ago
- Views:
Transcription

1 Donna L. Coffman Joint Prevention Methodology Seminar

2 The purpose of this talk is to illustrate how to obtain propensity scores in multilevel data and use these to strengthen causal inferences about mediation.
3 Many prevention programs randomly assigned at school level and hypothesized to affect mediators at individual level. Although intervention is randomly assigned, the mediator is not. Need to take into account confounders of the mediator and outcome. e.g., poverty, individual s prior delinquency

4 One solution is to use propensity scores, which is based on potential outcomes framework. One assumption of this framework is that there is no interference, such that one individual s assignment to treatment level does not influence another individual s outcome.
5 No-interference is different from a nested data structure. Nested data does not necessarily mean that we need propensity scores at both the school and individual level. Our motivating problem is what is sometimes referred to as or lower level mediation.

6 Three-level treatment: control, usual intervention, intervention adapted for rural Cluster-randomized at the school level Outcome- Alcohol use: Binary because highly skewed. 0 = no use and 1 = any use

7 Wave 2 refusal confidence about drinking Wave 2 peer alcohol use norms Wave 2 positive expectancies about drinking Scores of 1 are good - indicate greater refusal confidence, less positive expectancies, and lower substance use norms.
8 Demographics: age, gender, race/ethnicity Lifetime and wave 1 measures of recent substance use (including alcohol) Also age at first use Wave 1 measures of mediators Wave 1 measures of delinquency Stealing, destroying property, school expulsion Coping, anxiety, rebelliousness, family relationships & rules, parental knowledge & monitoring
9 Imputation model included a lot of variables due to all the confounders in the propensity score model. Many of the variables were not normally distributed so joint model (e.g., NORM) would not work. We used chained equations. Even then, this step was computationally intensive and we decided to impute only one data set for illustration purposes.


10 Propensity score model for treatment Multinomial logistic regression with fixed effects for school Differences are not that large initially but we wanted to reduce variance. Computed stabilized weights Predicted probability from intercept-only model divided by predicted probability from model of treatment regressed on all confounders. Helps to reduce variability of weights and extreme weights.

11
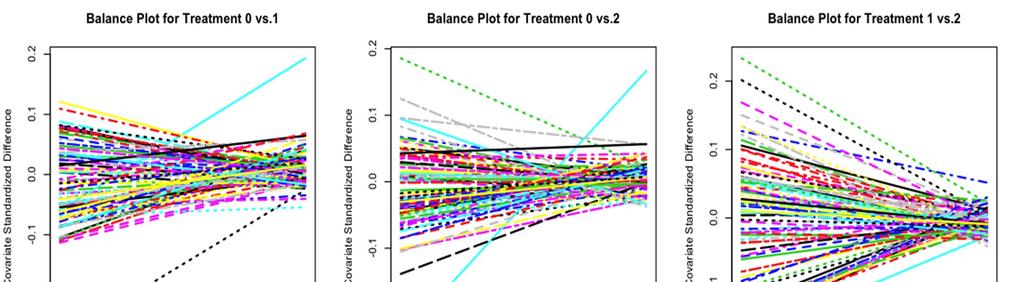
12

13 Propensity score model for each mediator Logistic regression of each mediator on all confounders and fixed effects for school and treatment level Computed weights Numerator of weights was predicted probability from a logistic regression of each mediator on the treatment level
14

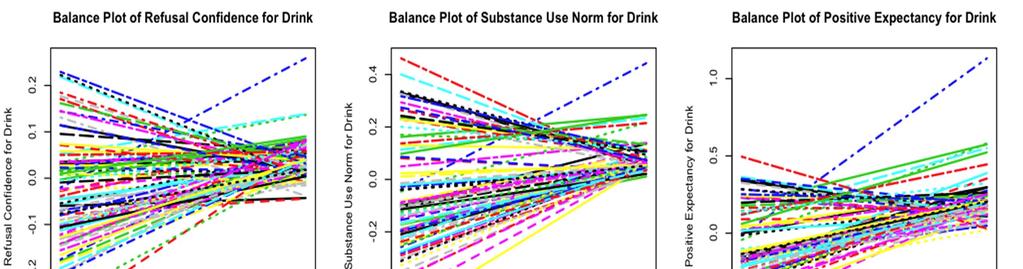
15


16 Assess effect of intervention on mediators Logistic regression for each mediator Use only weights for intervention

17 Assess effect of intervention and mediators on alcohol use. Logistic regression models for each mediator Using product of intervention and mediator weights.


18 Intervention did not have statistically significant effect on refusal confidence or positive expectancies. Mediators did have statistically significant effect on alcohol use. Intervention did not have a statistically significant direct effect on alcohol use. Intervention did not have a statistically significant total effect on alcohol use.
19 Refusal Confidence Not statistically significant when either weighted or unweighted Peer Alcohol Use Norms Significant effect: For the usual DRS intervention there is a 19% reduction in lower norms (-.214, odds ratio =.807) when unweighted and a 20% reduction in lower norms (-.228, odds ratio =.796) when weighted. p =.025 and.035 for unweighted and weighted Positive Expectancies Not statistically significant when either weighted or unweighted
20 Refusal Confidence Statistically significant effect: -.363, p =.038 When refusal confidence is high, alcohol use decreases there is a 30% reduction in alcohol use. Odds Ratio =.696 Peer Alcohol Use Norms Statistically significant effect: -1.10, p <.001 When norms are low, alcohol use decreases there is a 67% reduction in alcohol use. Odds Ratio =.333 Positive Expectancies Statistically significant effect: -1.07, p <.001 When positive expectancies are low, alcohol use decreases there is a 66% reduction in alcohol use. Odd Ratio =.343


21 Effect of treatment on alcohol use using logistic regression without the mediators in the model. No significant effect either with or without the weights.

22 We recognize that the mediators may not be independent. We performed an analysis that took this into consideration but results were not different. We did not multiply coefficients together for the effect of the intervention on the mediators and the effect of mediators on alcohol use because with binary mediators and outcomes, this value is not interpretable as an indirect effect although the indirect effect can be tested for significance (Coffman & Zhong, 2012).


23 It is important to proceed with mediation analysis even in the absence of a total effect. It is important to look at the effects separately. We learned that the mediators do indeed have strong effects on alcohol use, even when controlling for many confounders. But the intervention did not have statistically significant effects on the mediators, perhaps due to implementation issues.
24 Mediation analyses should consider that individuals and/or groups are not randomly assigned to levels of the mediator(s) and there may be confounders of the mediator and outcome even if the intervention is randomly assigned. This is an active area of research and future work when examine under what conditions propensity score models should include random effects, when propensity scores are needed at each level of nested data, and how to handle multiple mediators simultaneously.
25 Bethany Bray Wanghuan Chu Michael Hecht and John Graham NIH NIDA P50 DA10075
Objective: To describe a new approach to neighborhood effects studies based on residential mobility and demonstrate this approach in the context of
 Objective: To describe a new approach to neighborhood effects studies based on residential mobility and demonstrate this approach in the context of neighborhood deprivation and preterm birth. Key Points:
Propensity Score Methods for Estimating Causality in the Absence of Random Assignment: Applications for Child Care Policy Research
 2012 CCPRC Meeting Methodology Presession Workshop October 23, 2012, 2:00-5:00 p.m. Propensity Score Methods for Estimating Causality in the Absence of Random Assignment: Applications for Child Care Policy
How should the propensity score be estimated when some confounders are partially observed?
 How should the propensity score be estimated when some confounders are partially observed? Clémence Leyrat 1, James Carpenter 1,2, Elizabeth Williamson 1,3, Helen Blake 1 1 Department of Medical statistics,
Current Directions in Mediation Analysis David P. MacKinnon 1 and Amanda J. Fairchild 2
 CURRENT DIRECTIONS IN PSYCHOLOGICAL SCIENCE Current Directions in Mediation Analysis David P. MacKinnon 1 and Amanda J. Fairchild 2 1 Arizona State University and 2 University of South Carolina ABSTRACT
Multiple Mediation Analysis For General Models -with Application to Explore Racial Disparity in Breast Cancer Survival Analysis
 Multiple For General Models -with Application to Explore Racial Disparity in Breast Cancer Survival Qingzhao Yu Joint Work with Ms. Ying Fan and Dr. Xiaocheng Wu Louisiana Tumor Registry, LSUHSC June 5th,
A Bayesian Perspective on Unmeasured Confounding in Large Administrative Databases
 A Bayesian Perspective on Unmeasured Confounding in Large Administrative Databases Lawrence McCandless lmccandl@sfu.ca Faculty of Health Sciences, Simon Fraser University, Vancouver Canada Summer 2014
Data Analysis in Practice-Based Research. Stephen Zyzanski, PhD Department of Family Medicine Case Western Reserve University School of Medicine
 Data Analysis in Practice-Based Research Stephen Zyzanski, PhD Department of Family Medicine Case Western Reserve University School of Medicine Multilevel Data Statistical analyses that fail to recognize
COMMUNITY-LEVEL EFFECTS OF INDIVIDUAL AND PEER RISK AND PROTECTIVE FACTORS ON ADOLESCENT SUBSTANCE USE
 A R T I C L E COMMUNITY-LEVEL EFFECTS OF INDIVIDUAL AND PEER RISK AND PROTECTIVE FACTORS ON ADOLESCENT SUBSTANCE USE Kathryn Monahan and Elizabeth A. Egan University of Washington M. Lee Van Horn University
Propensity Score Methods with Multilevel Data. March 19, 2014
 Propensity Score Methods with Multilevel Data March 19, 2014 Multilevel data Data in medical care, health policy research and many other fields are often multilevel. Subjects are grouped in natural clusters,
Weight Adjustment Methods using Multilevel Propensity Models and Random Forests
 Weight Adjustment Methods using Multilevel Propensity Models and Random Forests Ronaldo Iachan 1, Maria Prosviryakova 1, Kurt Peters 2, Lauren Restivo 1 1 ICF International, 530 Gaither Road Suite 500,
Introduction to Multilevel Models for Longitudinal and Repeated Measures Data
 Introduction to Multilevel Models for Longitudinal and Repeated Measures Data Today s Class: Features of longitudinal data Features of longitudinal models What can MLM do for you? What to expect in this
Centre for Analysis of Youth AYT
 Centre for Analysis of Youth Transitions AYT STUDY REFERENCE: REP06 Programme name: European Drug Abuse Prevention (EU-DAP) trial Contact details/links for further details: http://www.eudap.net Contact
REPEATED MEASURES DESIGNS
 Repeated Measures Designs The SAGE Encyclopedia of Educational Research, Measurement and Evaluation Markus Brauer (University of Wisconsin-Madison) Target word count: 1000 - Actual word count: 1071 REPEATED
Introduction to Multilevel Models for Longitudinal and Repeated Measures Data
 Introduction to Multilevel Models for Longitudinal and Repeated Measures Data Today s Class: Features of longitudinal data Features of longitudinal models What can MLM do for you? What to expect in this
Design and Analysis Plan Quantitative Synthesis of Federally-Funded Teen Pregnancy Prevention Programs HHS Contract #HHSP I 5/2/2016
 Design and Analysis Plan Quantitative Synthesis of Federally-Funded Teen Pregnancy Prevention Programs HHS Contract #HHSP233201500069I 5/2/2016 Overview The goal of the meta-analysis is to assess the effects
Demonstrating multilevel structural equation modeling for testing mediation: Effects of self-critical perfectionism on daily affect
 Demonstrating multilevel structural equation modeling for testing mediation: Effects of self-critical perfectionism on daily affect Kristopher J. Preacher University of Kansas David M. Dunkley and David
investigate. educate. inform.
 investigate. educate. inform. Research Design What drives your research design? The battle between Qualitative and Quantitative is over Think before you leap What SHOULD drive your research design. Advanced
Bayesian methods for combining multiple Individual and Aggregate data Sources in observational studies
 Bayesian methods for combining multiple Individual and Aggregate data Sources in observational studies Sara Geneletti Department of Epidemiology and Public Health Imperial College, London s.geneletti@imperial.ac.uk
Joseph W Hogan Brown University & AMPATH February 16, 2010
 Joseph W Hogan Brown University & AMPATH February 16, 2010 Drinking and lung cancer Gender bias and graduate admissions AMPATH nutrition study Stratification and regression drinking and lung cancer graduate
Data Analysis Using Regression and Multilevel/Hierarchical Models
 Data Analysis Using Regression and Multilevel/Hierarchical Models ANDREW GELMAN Columbia University JENNIFER HILL Columbia University CAMBRIDGE UNIVERSITY PRESS Contents List of examples V a 9 e xv " Preface
Addendum: Multiple Regression Analysis (DRAFT 8/2/07)
") Addendum: Multiple Regression Analysis (DRAFT 8/2/07) When conducting a rapid ethnographic assessment, program staff may: Want to assess the relative degree to which a number of possible predictive variables
Addendum: Multiple Regression Analysis (DRAFT 8/2/07) When conducting a rapid ethnographic assessment, program staff may: Want to assess the relative degree to which a number of possible predictive variables
Do Your Online Friends Make You Pay? A Randomized Field Experiment on Peer Influence in Online Social Networks Online Appendix
 Forthcoming in Management Science 2014 Do Your Online Friends Make You Pay? A Randomized Field Experiment on Peer Influence in Online Social Networks Online Appendix Ravi Bapna University of Minnesota,
J. Michael Brick Westat and JPSM December 9, 2005
 Nonresponse in the American Time Use Survey: Who is Missing from the Data and How Much Does It Matter by Abraham, Maitland, and Bianchi J. Michael Brick Westat and JPSM December 9, 2005 Philosophy A sensible
Co-Variation in Sexual and Non-Sexual Risk Behaviors Over Time Among U.S. High School Students:
 Co-Variation in Sexual and Non-Sexual Risk Behaviors Over Time Among U.S. High School Students: 1991-2005 John Santelli, MD, MPH, Marion Carter, PhD, Patricia Dittus, PhD, Mark Orr, PhD APHA 135 th Annual
Analysis of TB prevalence surveys
 Workshop and training course on TB prevalence surveys with a focus on field operations Analysis of TB prevalence surveys Day 8 Thursday, 4 August 2011 Phnom Penh Babis Sismanidis with acknowledgements
Evaluation of Strategies to Improve the Utility of Estimates from a Non-Probability Based Survey
 Evaluation of Strategies to Improve the Utility of Estimates from a Non-Probability Based Survey Presenter: Benmei Liu, National Cancer Institute, NIH liub2@mail.nih.gov Authors: (Next Slide) 2015 FCSM
TRIPLL Webinar: Propensity score methods in chronic pain research
 TRIPLL Webinar: Propensity score methods in chronic pain research Felix Thoemmes, PhD Support provided by IES grant Matching Strategies for Observational Studies with Multilevel Data in Educational Research
A COMPARISON OF IMPUTATION METHODS FOR MISSING DATA IN A MULTI-CENTER RANDOMIZED CLINICAL TRIAL: THE IMPACT STUDY
 A COMPARISON OF IMPUTATION METHODS FOR MISSING DATA IN A MULTI-CENTER RANDOMIZED CLINICAL TRIAL: THE IMPACT STUDY Lingqi Tang 1, Thomas R. Belin 2, and Juwon Song 2 1 Center for Health Services Research,
Approaches to Improving Causal Inference from Mediation Analysis
 Approaches to Improving Causal Inference from Mediation Analysis David P. MacKinnon, Arizona State University Pennsylvania State University February 27, 2013 Background Traditional Mediation Methods Modern
Small-area estimation of prevalence of serious emotional disturbance (SED) in schools. Alan Zaslavsky Harvard Medical School
 in schools. Alan Zaslavsky Harvard Medical School") Small-area estimation of prevalence of serious emotional disturbance (SED) in schools Alan Zaslavsky Harvard Medical School 1 Overview Detailed domain data from short scale Limited amount of data from
Small-area estimation of prevalence of serious emotional disturbance (SED) in schools Alan Zaslavsky Harvard Medical School 1 Overview Detailed domain data from short scale Limited amount of data from
Table. A [a] Multiply imputed. Outpu
![Table. A [a] Multiply imputed. Outpu](/thumbs/92/109193102.jpg "Table. A [a] Multiply imputed. Outpu") Appendix 7 (as supplied by the authors): Full regression model outputs from sub- and analysis of the Terres-Cries-de-la-Baies-James adultss from both multiply imputed complete-case analysis models. Table
Appendix 7 (as supplied by the authors): Full regression model outputs from sub- and analysis of the Terres-Cries-de-la-Baies-James adultss from both multiply imputed complete-case analysis models. Table
Moving beyond regression toward causality:
 Moving beyond regression toward causality: INTRODUCING ADVANCED STATISTICAL METHODS TO ADVANCE SEXUAL VIOLENCE RESEARCH Regine Haardörfer, Ph.D. Emory University rhaardo@emory.edu OR Regine.Haardoerfer@Emory.edu
Technical appendix Strengthening accountability through media in Bangladesh: final evaluation
 Technical appendix Strengthening accountability through media in Bangladesh: final evaluation July 2017 Research and Learning Contents Introduction... 3 1. Survey sampling methodology... 4 2. Regression
Social determinants of mental health among Inuit youth in Nunavik: a multilevel analysis
 Social determinants of mental health among Inuit youth in Nunavik: a multilevel analysis Andrew Gray CPHA conference June 26, 2015 occupied Coast Salish territory (Vancouver) Image: Angela Larose 2009
Challenges of Observational and Retrospective Studies
 Challenges of Observational and Retrospective Studies Kyoungmi Kim, Ph.D. March 8, 2017 This seminar is jointly supported by the following NIH-funded centers: Background There are several methods in which
How to analyze correlated and longitudinal data?
 How to analyze correlated and longitudinal data? Niloofar Ramezani, University of Northern Colorado, Greeley, Colorado ABSTRACT Longitudinal and correlated data are extensively used across disciplines
Why Does Sampling Matter? Answers From the Gender Norms and Labour Supply Project
 Briefing Paper 1 July 2015 Why Does Sampling Matter? Answers From the Gender Norms and Labour Supply Project In this briefing paper you will find out how to: understand and explain different sampling designs
George B. Ploubidis. The role of sensitivity analysis in the estimation of causal pathways from observational data. Improving health worldwide
 George B. Ploubidis The role of sensitivity analysis in the estimation of causal pathways from observational data Improving health worldwide www.lshtm.ac.uk Outline Sensitivity analysis Causal Mediation
Design of Experiments & Introduction to Research
 Design of Experiments & Introduction to Research 1 Design of Experiments Introduction to Research Definition and Purpose Scientific Method Research Project Paradigm Structure of a Research Project Types
The Use of Propensity Scores for Nonrandomized Designs With Clustered Data
 This article was downloaded by: [Cornell University Library] On: 23 February 2015, At: 11:03 Publisher: Routledge Informa Ltd Registered in England and Wales Registered Number: 1072954 Registered office:
Glossary From Running Randomized Evaluations: A Practical Guide, by Rachel Glennerster and Kudzai Takavarasha
 Glossary From Running Randomized Evaluations: A Practical Guide, by Rachel Glennerster and Kudzai Takavarasha attrition: When data are missing because we are unable to measure the outcomes of some of the
What is Multilevel Modelling Vs Fixed Effects. Will Cook Social Statistics
 What is Multilevel Modelling Vs Fixed Effects Will Cook Social Statistics Intro Multilevel models are commonly employed in the social sciences with data that is hierarchically structured Estimated effects
Survey of Smoking, Drinking and Drug Use (SDD) among young people in England, Andrew Bryant
 among young people in England, Andrew Bryant") Survey of Smoking, Drinking and Drug Use (SDD) among young people in England, 2010 Andrew Bryant Newcastle University Institute of Health and Society Background Background Young people s drinking behaviour
Survey of Smoking, Drinking and Drug Use (SDD) among young people in England, 2010 Andrew Bryant Newcastle University Institute of Health and Society Background Background Young people s drinking behaviour
Index. Springer International Publishing Switzerland 2017 T.J. Cleophas, A.H. Zwinderman, Modern Meta-Analysis, DOI /
 Index A Adjusted Heterogeneity without Overdispersion, 63 Agenda-driven bias, 40 Agenda-Driven Meta-Analyses, 306 307 Alternative Methods for diagnostic meta-analyses, 133 Antihypertensive effect of potassium,
PEER REVIEW HISTORY ARTICLE DETAILS VERSION 1 - REVIEW. Ball State University
 PEER REVIEW HISTORY BMJ Open publishes all reviews undertaken for accepted manuscripts. Reviewers are asked to complete a checklist review form (see an example) and are provided with free text boxes to
Introduction to Path Analysis
 Introduction to Path Analysis Review of Multivariate research & an Additional model Structure of Regression Models & Path Models Direct & Indirect effects Mediation analyses When & some words of caution
Introduction to Observational Studies. Jane Pinelis
 Introduction to Observational Studies Jane Pinelis 22 March 2018 Outline Motivating example Observational studies vs. randomized experiments Observational studies: basics Some adjustment strategies Matching
Class 7 Everything is Related
 Class 7 Everything is Related Correlational Designs l 1 Topics Types of Correlational Designs Understanding Correlation Reporting Correlational Statistics Quantitative Designs l 2 Types of Correlational
Analytic Strategies for the OAI Data
 Analytic Strategies for the OAI Data Charles E. McCulloch, Division of Biostatistics, Dept of Epidemiology and Biostatistics, UCSF ACR October 2008 Outline 1. Introduction and examples. 2. General analysis
BIOSTATISTICAL METHODS
 BIOSTATISTICAL METHODS FOR TRANSLATIONAL & CLINICAL RESEARCH PROPENSITY SCORE Confounding Definition: A situation in which the effect or association between an exposure (a predictor or risk factor) and
PubH 7405: REGRESSION ANALYSIS. Propensity Score
 PubH 7405: REGRESSION ANALYSIS Propensity Score INTRODUCTION: There is a growing interest in using observational (or nonrandomized) studies to estimate the effects of treatments on outcomes. In observational
Individual Participant Data (IPD) Meta-analysis of prediction modelling studies
 Meta-analysis of prediction modelling studies") Individual Participant Data (IPD) Meta-analysis of prediction modelling studies Thomas Debray, PhD Julius Center for Health Sciences and Primary Care Utrecht, The Netherlands March 7, 2016 Prediction
Individual Participant Data (IPD) Meta-analysis of prediction modelling studies Thomas Debray, PhD Julius Center for Health Sciences and Primary Care Utrecht, The Netherlands March 7, 2016 Prediction
EC352 Econometric Methods: Week 07
 EC352 Econometric Methods: Week 07 Gordon Kemp Department of Economics, University of Essex 1 / 25 Outline Panel Data (continued) Random Eects Estimation and Clustering Dynamic Models Validity & Threats
STATISTICS AND RESEARCH DESIGN
 Statistics 1 STATISTICS AND RESEARCH DESIGN These are subjects that are frequently confused. Both subjects often evoke student anxiety and avoidance. To further complicate matters, both areas appear have
Selection and Combination of Markers for Prediction
 Selection and Combination of Markers for Prediction NACC Data and Methods Meeting September, 2010 Baojiang Chen, PhD Sarah Monsell, MS Xiao-Hua Andrew Zhou, PhD Overview 1. Research motivation 2. Describe
Propensity Score Methods for Causal Inference with the PSMATCH Procedure
 Paper SAS332-2017 Propensity Score Methods for Causal Inference with the PSMATCH Procedure Yang Yuan, Yiu-Fai Yung, and Maura Stokes, SAS Institute Inc. Abstract In a randomized study, subjects are randomly
Daniel Boduszek University of Huddersfield
 Daniel Boduszek University of Huddersfield d.boduszek@hud.ac.uk Introduction to Logistic Regression SPSS procedure of LR Interpretation of SPSS output Presenting results from LR Logistic regression is
Political Science 15, Winter 2014 Final Review
 Political Science 15, Winter 2014 Final Review The major topics covered in class are listed below. You should also take a look at the readings listed on the class website. Studying Politics Scientifically
THE GOOD, THE BAD, & THE UGLY: WHAT WE KNOW TODAY ABOUT LCA WITH DISTAL OUTCOMES. Bethany C. Bray, Ph.D.
 THE GOOD, THE BAD, & THE UGLY: WHAT WE KNOW TODAY ABOUT LCA WITH DISTAL OUTCOMES Bethany C. Bray, Ph.D. bcbray@psu.edu WHAT ARE WE HERE TO TALK ABOUT TODAY? Behavioral scientists increasingly are using
Bayesian and Frequentist Approaches
 Bayesian and Frequentist Approaches G. Jogesh Babu Penn State University http://sites.stat.psu.edu/ babu http://astrostatistics.psu.edu All models are wrong But some are useful George E. P. Box (son-in-law
multilevel modeling for social and personality psychology
 1 Introduction Once you know that hierarchies exist, you see them everywhere. I have used this quote by Kreft and de Leeuw (1998) frequently when writing about why, when, and how to use multilevel models
Evaluating Risk Assessment: Finding a Methodology that Supports your Agenda There are few issues facing criminal justice decision makers generating
 Evaluating Risk Assessment: Finding a Methodology that Supports your Agenda There are few issues facing criminal justice decision makers generating more interest than fairness and bias with risk assessments.
Great Expectations: Changing Mode of Survey Data Collection in Military Populations
 Great Expectations: Changing Mode of Survey Data Collection in Military Populations Ronald Z. Szoc, PhD Jacqueline Pflieger, PhD Frances M. Barlas, PhD Randall K. Thomas Federal Committee on Statistical
Understanding and Applying Multilevel Models in Maternal and Child Health Epidemiology and Public Health
 Understanding and Applying Multilevel Models in Maternal and Child Health Epidemiology and Public Health Adam C. Carle, M.A., Ph.D. adam.carle@cchmc.org Division of Health Policy and Clinical Effectiveness
Epidemiologic Methods I & II Epidem 201AB Winter & Spring 2002
 DETAILED COURSE OUTLINE Epidemiologic Methods I & II Epidem 201AB Winter & Spring 2002 Hal Morgenstern, Ph.D. Department of Epidemiology UCLA School of Public Health Page 1 I. THE NATURE OF EPIDEMIOLOGIC
D. Paul Moberg University of Wisconsin
 D. Paul Moberg University of Wisconsin Andrew J. Finch and Emily Tanner-Smith Vanderbilt University Presented at the 30 th Annual Research & Policy Conference on Child, Adolescent and Young Adult Behavioral
IMPACTS OF SOCIAL NETWORKS AND SPACE ON OBESITY. The Rights and Wrongs of Social Network Analysis
 IMPACTS OF SOCIAL NETWORKS AND SPACE ON OBESITY The Rights and Wrongs of Social Network Analysis THE SPREAD OF OBESITY IN A LARGE SOCIAL NETWORK OVER 32 YEARS Nicholas A. Christakis James D. Fowler Published:
Longitudinal and Hierarchical Analytic Strategies for OAI Data
 Longitudinal and Hierarchical Analytic Strategies for OAI Data Charles E. McCulloch, Division of Biostatistics, Dept of Epidemiology and Biostatistics, UCSF OARSI Montreal September 10, 2009 Outline 1.
Panel: Using Structural Equation Modeling (SEM) Using Partial Least Squares (SmartPLS)
 Using Partial Least Squares (SmartPLS)") Panel: Using Structural Equation Modeling (SEM) Using Partial Least Squares (SmartPLS) Presenters: Dr. Faizan Ali, Assistant Professor Dr. Cihan Cobanoglu, McKibbon Endowed Chair Professor University of
Panel: Using Structural Equation Modeling (SEM) Using Partial Least Squares (SmartPLS) Presenters: Dr. Faizan Ali, Assistant Professor Dr. Cihan Cobanoglu, McKibbon Endowed Chair Professor University of
Version No. 7 Date: July Please send comments or suggestions on this glossary to
 Impact Evaluation Glossary Version No. 7 Date: July 2012 Please send comments or suggestions on this glossary to 3ie@3ieimpact.org. Recommended citation: 3ie (2012) 3ie impact evaluation glossary. International
Detection of Unknown Confounders. by Bayesian Confirmatory Factor Analysis
 Advanced Studies in Medical Sciences, Vol. 1, 2013, no. 3, 143-156 HIKARI Ltd, www.m-hikari.com Detection of Unknown Confounders by Bayesian Confirmatory Factor Analysis Emil Kupek Department of Public
Accounting for treatment switching/discontinuation in comparative effectiveness studies
 Global Medical Affairs RWE and Digital Accounting for treatment switching/discontinuation in comparative effectiveness studies Melvin Skip Olson, PhD Global Head, Real World Data Strategy and Innovation
Mediation designs for tobacco prevention research
 Drug and Alcohol Dependence 68 (2002) S69/S83 www.elsevier.com/locate/drugalcdep Mediation designs for tobacco prevention research David P. MacKinnon *, Marcia P. Taborga, Antonio A. Morgan-Lopez Department
11/18/2013. Correlational Research. Correlational Designs. Why Use a Correlational Design? CORRELATIONAL RESEARCH STUDIES
 Correlational Research Correlational Designs Correlational research is used to describe the relationship between two or more naturally occurring variables. Is age related to political conservativism? Are
Part 8 Logistic Regression
 1 Quantitative Methods for Health Research A Practical Interactive Guide to Epidemiology and Statistics Practical Course in Quantitative Data Handling SPSS (Statistical Package for the Social Sciences)
Modeling Binary outcome
 Statistics April 4, 2013 Debdeep Pati Modeling Binary outcome Test of hypothesis 1. Is the effect observed statistically significant or attributable to chance? 2. Three types of hypothesis: a) tests of
1.4 - Linear Regression and MS Excel
 1.4 - Linear Regression and MS Excel Regression is an analytic technique for determining the relationship between a dependent variable and an independent variable. When the two variables have a linear
Regression and causal analysis. Harry Ganzeboom Research Skills, December Lecture #5
 Regression and causal analysis Harry Ganzeboom Research Skills, December 4 2008 Lecture #5 Regression analysis is about partial associations Note that Berry & Feldman do not give any causal interpretation
Cross-Lagged Panel Analysis
 Cross-Lagged Panel Analysis Michael W. Kearney Cross-lagged panel analysis is an analytical strategy used to describe reciprocal relationships, or directional influences, between variables over time. Cross-lagged
Using follow-up data to adjust for selective non-participation in cross-sectional setting
 Using follow-up data to adjust for selective non-participation in cross-sectional setting Juho Kopra University of Jyväskylä Department of Mathematics and Statistics NoPaHES-project 30th August 2017 1
Society for Prevention Research 2018 Call for Papers Author Abstract Submission Questions. Research Foci
 Society for Prevention Research 2018 Call for Papers Author Abstract Submission Questions Research Foci Please select your Research Foci. (Select all that apply) Academic Achievement ADHD Addiction Aging
Effects of School-Level Norms on Student Substance Use
 Prevention Science, Vol. 3, No. 2, June 2002 ( C 2002) Effects of School-Level Norms on Student Substance Use Revathy Kumar, 1,2,4 Patrick M. O Malley, 1 Lloyd D. Johnston, 1 John E. Schulenberg, 1,3 and
Available from Deakin Research Online:
 This is the published version: Richardson, Ben and Fuller Tyszkiewicz, Matthew 2014, The application of non linear multilevel models to experience sampling data, European health psychologist, vol. 16,
Self Perceived Oral Health Status, Untreated Decay, and Utilization of Dental Services Among Dentate Adults in the United States: NHANES
 Self Perceived Oral Health Status, Untreated Decay, and Utilization of Dental Services Among Dentate Adults in the United States: NHANES 2011 2012 Sayo Adunola, D.D.S., M.P.H. Dental Public Health Resident
Data and Statistics 101: Key Concepts in the Collection, Analysis, and Application of Child Welfare Data
 TECHNICAL REPORT Data and Statistics 101: Key Concepts in the Collection, Analysis, and Application of Child Welfare Data CONTENTS Executive Summary...1 Introduction...2 Overview of Data Analysis Concepts...2
Applied Medical. Statistics Using SAS. Geoff Der. Brian S. Everitt. CRC Press. Taylor Si Francis Croup. Taylor & Francis Croup, an informa business
 Applied Medical Statistics Using SAS Geoff Der Brian S. Everitt CRC Press Taylor Si Francis Croup Boca Raton London New York CRC Press is an imprint of the Taylor & Francis Croup, an informa business A
Community Assessment Training
 Community Assessment Training Using the Communities That Care Youth Survey Participant s Guide Module 2 Module 2 Table of Contents Page Module 2... 2 4 We are here.... 2 5 Module 2 goal... 2 6 Objectives...
Ray Franke, PhD Assistant Professor Higher Education Administration University of Massachusetts Boston
 Drinking, Smoking, Partying And Still Graduate On Time? Examining the Impact of Adverse Study Behavior on 4-Year Degree Completion in the United States Ray Franke, PhD Assistant Professor Higher Education
Media, Discussion and Attitudes Technical Appendix. 6 October 2015 BBC Media Action Andrea Scavo and Hana Rohan
 Media, Discussion and Attitudes Technical Appendix 6 October 2015 BBC Media Action Andrea Scavo and Hana Rohan 1 Contents 1 BBC Media Action Programming and Conflict-Related Attitudes (Part 5a: Media and
Alternative indicators for the risk of non-response bias
 Alternative indicators for the risk of non-response bias Federal Committee on Statistical Methodology 2018 Research and Policy Conference Raphael Nishimura, Abt Associates James Wagner and Michael Elliott,
Assessing the impact of unmeasured confounding: confounding functions for causal inference
 Assessing the impact of unmeasured confounding: confounding functions for causal inference Jessica Kasza jessica.kasza@monash.edu Department of Epidemiology and Preventive Medicine, Monash University Victorian
Supplementary Appendix
 Supplementary Appendix This appendix has been provided by the authors to give readers additional information about their work. Supplement to: Weintraub WS, Grau-Sepulveda MV, Weiss JM, et al. Comparative
Nonresponse Rates and Nonresponse Bias In Household Surveys
 Nonresponse Rates and Nonresponse Bias In Household Surveys Robert M. Groves University of Michigan and Joint Program in Survey Methodology Funding from the Methodology, Measurement, and Statistics Program
Recent advances in non-experimental comparison group designs
 Recent advances in non-experimental comparison group designs Elizabeth Stuart Johns Hopkins Bloomberg School of Public Health Department of Mental Health Department of Biostatistics Department of Health
arxiv: v2 [stat.ap] 7 Dec 2016
![arxiv: v2 [stat.ap] 7 Dec 2016](/thumbs/77/75339937.jpg "arxiv: v2 [stat.ap] 7 Dec 2016") A Bayesian Approach to Predicting Disengaged Youth arxiv:62.52v2 [stat.ap] 7 Dec 26 David Kohn New South Wales 26 david.kohn@sydney.edu.au Nick Glozier Brain Mind Centre New South Wales 26 Sally Cripps
A Bayesian Approach to Predicting Disengaged Youth arxiv:62.52v2 [stat.ap] 7 Dec 26 David Kohn New South Wales 26 david.kohn@sydney.edu.au Nick Glozier Brain Mind Centre New South Wales 26 Sally Cripps
User Experience: Findings from Patient Telehealth Survey
 User Experience: Findings from Patient Telehealth Survey Sarah Gorst University of Sheffield NIHR CLAHRC for South Yorkshire MALT WS3: User experience Overcoming the Barriers to Mainstreaming Assisted
Business Statistics Probability
 Business Statistics The following was provided by Dr. Suzanne Delaney, and is a comprehensive review of Business Statistics. The workshop instructor will provide relevant examples during the Skills Assessment
Bayesian approaches to handling missing data: Practical Exercises
 Bayesian approaches to handling missing data: Practical Exercises 1 Practical A Thanks to James Carpenter and Jonathan Bartlett who developed the exercise on which this practical is based (funded by ESRC).
MULTIPLE LINEAR REGRESSION 24.1 INTRODUCTION AND OBJECTIVES OBJECTIVES
 24 MULTIPLE LINEAR REGRESSION 24.1 INTRODUCTION AND OBJECTIVES In the previous chapter, simple linear regression was used when you have one independent variable and one dependent variable. This chapter
Identifying Peer Influence Effects in Observational Social Network Data: An Evaluation of Propensity Score Methods
 Identifying Peer Influence Effects in Observational Social Network Data: An Evaluation of Propensity Score Methods Dean Eckles Department of Communication Stanford University dean@deaneckles.com Abstract