Moving beyond regression toward causality:
|
|
|
- Alban Matthews
- 5 years ago
- Views:
Transcription
1 Moving beyond regression toward causality: INTRODUCING ADVANCED STATISTICAL METHODS TO ADVANCE SEXUAL VIOLENCE RESEARCH Regine Haardörfer, Ph.D. Emory University OR
2 Overview Introduction Regression Advanced techniques Propensity score analysis Latent class analysis 10 min BIO-BREAK Path models Cross-lagged models
3 Welcome!
4 By show of hands - How familiar are you with Propensity Score Analysis? Latent Class Analysis Path Analysis Cross-lagged Models Qualitative Data Analysis Answer choices: A. Not at all/i have read about it (e.g. in papers) B. I have collaborated with others who have used it/i have used it myself
5 Steps in quantitative analysis Univariates Bivariates Regression What s next?
6 Let s use the c-word: CAUSATION To show causation, i.e. X causes Y, 3 conditions need to be satisfied 1) time precedence 2) relationship (implies that X and Y are variables) 3) non-spuriousness
7 The Gold Standard - RCT Randomized controlled trial Researchers manipulate the condition (i.e. the intervention) and control as much of the environment as possible Biggest benefit: if the sample size is large enough, it will balance participants on all measured AND unmeasured characteristics. Many times we do not have the luxury of conducting an RCT.
8 Propensity Score Analysis When randomization is not an option.
9 What do you think? Two heart surgeons walk into a room. The first surgeon says, Man, I just finished my 100 th surgery!. heart The second surgeon replies, Oh yeah, I finished my 100 th heart surgery last week. I bet I'm a better surgeon than you. How many of your patients died within 3 months of surgery? Only 10 of my patients died. First surgeon smugly responds, Only 5 of mine died, so I must be the better surgeon.

10 Comparing Apples and Oranges There may be important differences in patient/participant characteristics. We want to show that the difference in outcome is due to our variable of interest and not due to other factors.
11 What examples can you think of? Where can you not assign people into groups that you would like to compare but cannot randomize? Take 5 minutes to discuss with those around you and be prepared to share.
12 Propensity Score Analysis offers a solution
13 What is propensity score analysis? Propensity score analysis is a class of statistical methods that has proven useful for evaluating treatment effects when using nonexperimental or observational data. It is used when treatment assignment is non-ignorable. It adjusts for selection bias, but does not solve the problem completely. It can be used to reduce multidimensional covariates to a onedimensional score called a propensity score. (Guo & Fraser, 2010).
14 What is propensity score analysis? Historically, propensity score analysis was developed for intervention research. However, the concept can be easily expanded to any group membership. This is especially of interest when group membership cannot be assigned for practical or ethical reasons.
15 What is a propensity score? The propensity score is the conditional probability of assignment to a particular treatment given a vector of observed covariates. The propensity score is a balancing score. Rosenbaum & Rubin (1983)
16 2500 PubMed results for Propensity Score
17 Example
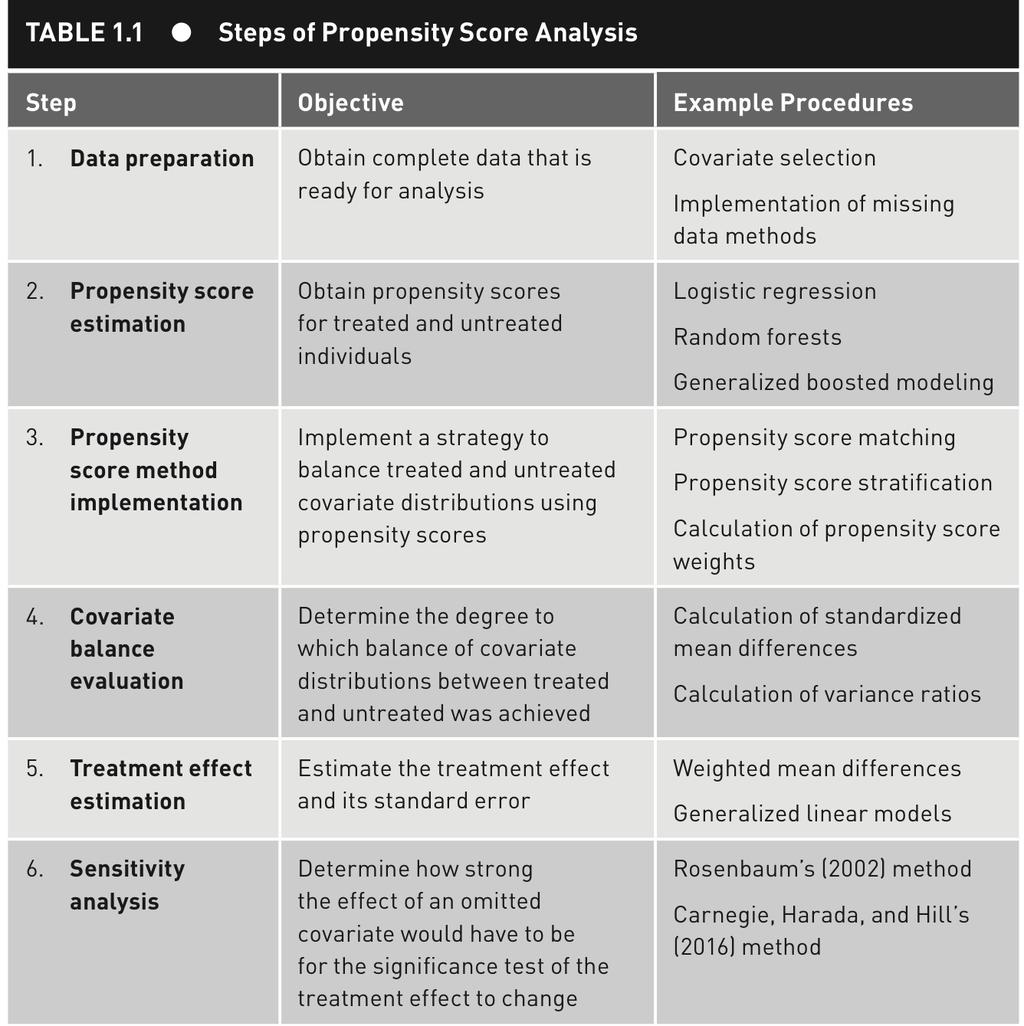

18 Steps
19 Step 2: Propensity Score Estimation 1. Define treatment and control group. 2. Identify potential confounders. Current convention: if uncertain whether a covariate is a confounder, include it into the model Do NOT include your outcome into your model! 3. Estimate propensity score (PS) using logistic regression (binary assignment) OR a multinomial logit model for more than 2 arms/multiple doses of treatment. ln PS 1 PS = β 0 + β 1 X 1 + β 2 X β p X p
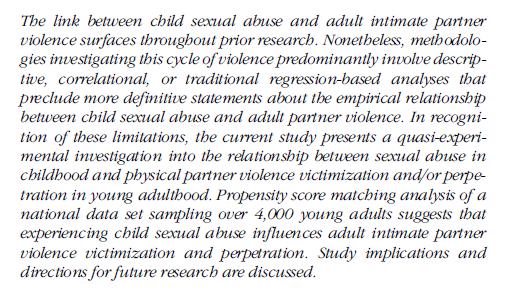
20 How did Jennings et al. do this? Defining the groups: Experienced sexual abuse in childhood OR not Choosing propensity score covariates Based on prior research
21 Propensity score graphs
22 Now you have a propensity score What next? 1. Propensity score matching 2. Inverse probability weighting using the propensity score 3. Stratification on the propensity score - historic 4. Covariate adjustment using the propensity score
23 Approach 1: Matching General ides: Create a new sample of cases that share similar likelihoods of being assigned to the treatment condition Necessary condition: sufficient overlap in propensity scores There are MANY types of matching. Software packages can do this. Some simple ones are: Nearest Neighbor Matching Caliper & Radius Matching
24 What to do after matching? CHECK your matching It can happen (when you don t have/choose the right covariates) that the procedure creates more differences in the groups. Check your sample size: how much has it been reduced? Conduct your analyses on your matched data set just as you always do. Report results the same way. Emphasize in the discussion that estimates are adjusted for bias due to the covariates you included in your propensity score analysis. Consider sensitivity analyses
25
26
27 Mantra 1: Conduct Sensitivity Analyses
28 Sensitivity analysis A sensitivity analysis asks specifically: How would inferences about treatment effects change by hidden biases of various magnitudes? How large would these differences have to be to change the conclusion of the study? From a statistical point of view: How robust are the results of the model? Sensitivity analysis cannot indicate what biases may be present; It can only indicate the magnitude needed to alter the conclusion.

29 Another example Lancet abstract
30 Approach 2: Inverse Probability Weights Each participant gets a weight assigned based on their probability of being in the treatment group Calculate the inverse of the propensity score Use as a weight in subsequent analyses as you would when using complex data If you have already weights in your dataset, multiply existing weights by propensity score weights
31 Approach 3: Stratification using propensity scores First approach proposed by Rosenbaum & Rubin (1984) Analyzing in quintiles eliminates 90% of bias Calculate effects for each quintile Calculate weighted averages and pooled estimates for variances
32 Approach 4: Covariate adjustment using the propensity score Is as simple as it sounds: Take the propensity score and use it as a covariate Very little literature exists on how well this works I would not do this even if it seems to be the easiest way.

33 Ideas? TAKE SOME TIME AND DISCUSS WITH THOSE AROUND YOU WHAT IDEAS THIS PART OF THE WORKSHOP HAS SPARKED. REPORT BACK TO THE WHOLE GROUP
34 Software You can use any software package to determine the propensity scores using logistic regression Need to save those results If using propensity scores as weights, you need to use routines that allow you to do that but most packages can do this now Matching packages are available for most software packages Google is your friend
35 Literature Austin, P. C. (2011). An introduction to propensity score methods for reducing the effects of confounding in observational studies. Multivariate behavioral research, 46(3), Guo, S., & Fraser, M. W. (2014). Propensity score analysis (Vol. 12). Sage.
36 Latent Class Analysis Going beyond demographics etc. to identify groups

37 What if we have a distribution like this?
38 Bimodal and multimodal distributions Fancy speak for: different sub-groups are different on the construct we are interested in. Two scenarios: 1. We know how to categorize participants, e.g. a) Gender b) Place, e.g. country c) Mental health status, e.g. depressed/not depressed 2. We don t know how to group people, but we do have a hunch a) E.g. that certain behavior patterns show up, e.g. IPV domains b) E.g. that certain characteristics show up together, e.g. Intersectionality dimensions Scenario 2 offers the possibility to do Latent Class Analysis (LCA)
39 What is LCA? LCA is a statistical method used to identify unmeasured class membership using categorical and/or continuous observed indicator variables. LCA is an example of mixture modeling.
40 PubMed results for Latent Class Analysis
41 Example
42 The model is selected using fit indices and likelihood ratio tests.

43
44 Post LCA research aims - Choi How are psychosocial factors related to class membership? How does class membership relate to distal outcomes (anxiety, depressive symptoms, hostility)? What role does class membership play as a moderator between psychosocial factors and distal outcomes?

45 How are psychosocial factors related to class membership?

46 Ideas for using LCA GENERATE AND DISCUSS POSSIBLE APPLICATIONS OF LATENT CLASS ANALYSIS WITH OTHERS AROUND YOU FOR 10 MINUTES AND BE PREPARED TO SHARE AT THE END.

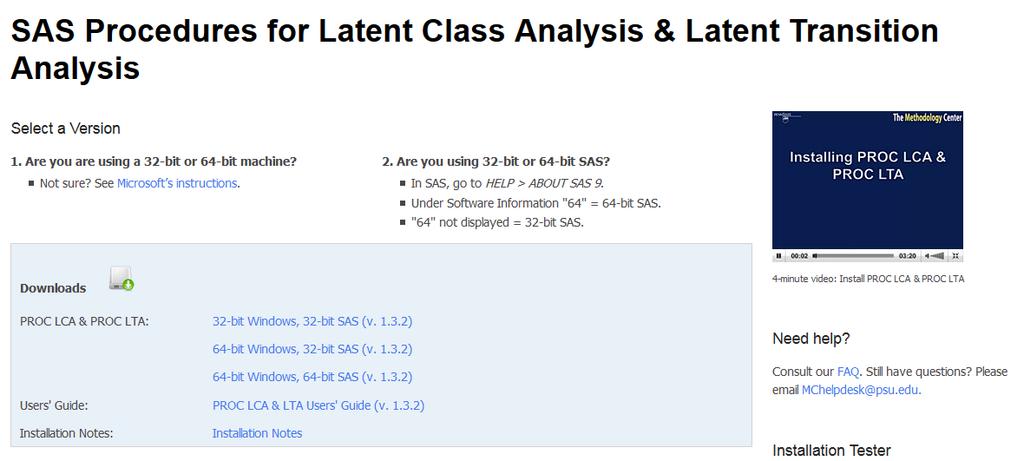
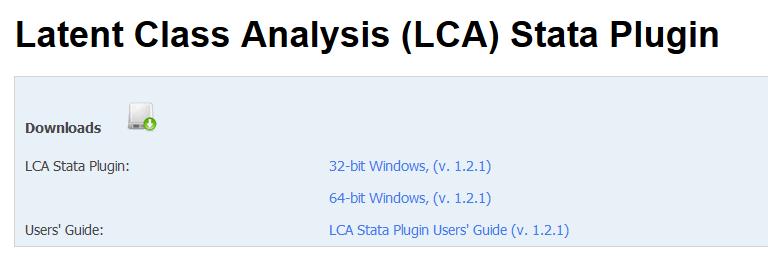
47 Resources: The Methodology Center
48 A bit of How-To SAS macro Stata Plugin SPSS has no capability R has several packages Mplus has the most extensive capabilities Sample size depends on the number of indicators Starting with good hypotheses is very helpful. The patterns don t always emerge cleanly. The Methodology Center at Penn State is a great resource: A few hundred is usually enough
49 Mantra 2: Advanced Data Analysis is an Art Advanced Data Analysis needs to be Theory-Driven

50 Time for a quick bio-break Please be back in 10 min.
51 Path models Mediation on Steroids
52 What is Structural Equation Modeling (SEM)? Structural Equation Modeling (SEM) is a family of statistical techniques that builds upon multiple regression as an extension of the General Linear Model. Goals of SEM: To understand the patterns of correlation (variance-covariance) among a set of variables, and To explain as much variance in these correlations and variables in the theory as specified.
53 What is SEM? Types of SEM: Measured variable path analysis OUR FOCUS TODAY Confirmatory factor analysis (incl. MIMIC models) Latent variable path analysis, aka structured regression models Latent growth models Multilevel SEM With much more being added almost by the day
54 Path analysis vs. SEM Path analysis is a special case of SEM Path analysis contains only observed variables Path analysis assumes that all variables are measured without error (as does regression) SEM uses latent variables to account for measurement error Path analysis has a more restrictive set of assumptions than SEM (e.g. no correlation between the error terms)
55 The Origin of SEM Swell Wright, a geneticist in 1920s, attempted to solve simultaneous equations to disentangle genetic influences across generations ( path analysis ) Gained popularity in 1960, when Blalock, Duncan, and others introduced them to social science (e.g. status attainment processes) The development of general linear models by Joreskog and others in 1970s ( LISREL models, i.e. linear structural relations) Computational advances (e.g. missing data and different distributions) and implementation in standard software packages have allowed for more researchers to use SEM in the past 5-10 years
56 Some general words about SEM SEM can be seen as an antidote against the over-reliance on statistical tests of individual hypotheses Correct use of SEM requires strong knowledge about measurement Less of that is needed for path analysis SEM has become quite popular but many published manuscripts lack quality (McCallum & Austin, 2000, Shah & Goldstein, 2006)
57 Let s look at some path diagrams
58 Path diagram for a multiple regression model X 1 b 1 X 2 b 2 b 3 b 4 Y 1 e y X 3 X 4 Y = b 0 + b 1 X 1 + b 2 X 2 + b 3 X 3 + b 4 X 4 + e y
59 Mediation a given variable may be said to function as a mediator to the extent that it accounts for the relation between the predictor and the criterion. Mediators explain (Baron & Kenny, 1986, p. 1176) a Mediator b Independent Variable c Outcome Variable In a mediation model there is a causal chain. Within this chain is the direct effect (between the predictor and outcome), as well as the indirect effect (through the mediator from the predictor to the outcome).
60 Useful Terminology Exogenous variable: a variable that is not caused by another variable within the model Endogenous variable: a variable that is caused by one or more variables in the model Standardized variable: a variable whose mean is zero and variance is one Structural model: a set of structural equations Path diagram: pictorial representation of a structural model Structural coefficient: the measure of the amount of change the in effect variable expected given a one unit change in the causal variable (holding all other variables constant) Disturbance: set of unspecified causes of the effect variable (analogous to error or residual); each endogenous variable has a disturbance
61 But that s not how the world works USUALLY, THERE ARE MULTIPLE PROCESSES AT WORK

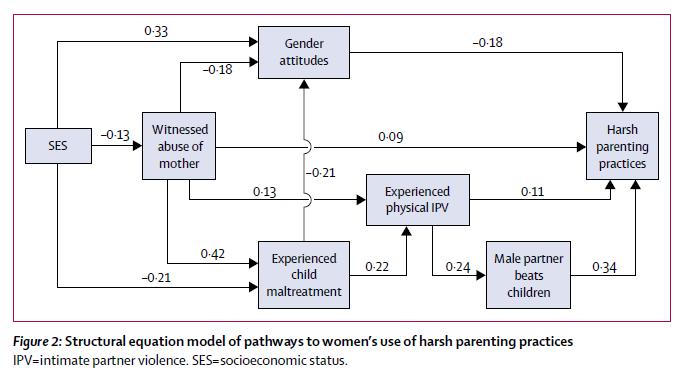
62
63
64
65

66 Thoughts? Questions? Comments?

67
68
69 Some how-to of path analysis
70 Time for Another Mantra (#3) DATA QUALITY TRUMPS QUANTITY
71 Software SAS is fairly useless/painful SPSS has an add-on package AMOS that is capable of simple analyses Stata is getting better with each version demonstration coming up R is getting much better Mplus is the gold standard There are other specialty packages (e.g. LISREL) that I have not used in years. All are expanding capabilities quickly.
72 3. Select measures, collect data yes 1. Model specification 2. Model identified? no Steps in SEM 4a. Model fit adequate? no 5. Model respecification yes 4b. Interpret estimates 4c. Consider equivalent models or near-equivalent models 6. Report results
73 Overview model fit indices Fit index Chi-squared (model vs. saturated) Good fit p >.05 RMSEA <.08 reasonable fit <.05 good fit CFI >.90 or >.95 TLI >.95 SRMR <.08

74 In groups, discuss ideas for path analyses in your research. Share with everybody.
75 Cross-lagged models Tackling the chicken and egg problems
76 What are examples of chicken & egg problems in violence research? From my research: Do people who eat healthier buy more fruit OR do those who buy more fruit eat healthier? Are people who quit smoking more likely to have a smokefree home OR are those who have a smoke-free home more likely to quit smoking?
77 IPV Victimization and Suicidality: What Comes First?
78
79 Why cross-lagged models? Focus on Temporality!!! Models account for auto-correlation: many processes are fairly stable across time Allows to investigate chicken and egg problems
80 250 PubMed Search for Cross-Lagged
81 Questions to ask yourself What is a meaningful lapse in time? What are co-occurring processes? Do you expect the same changes/processes for all participants?
82 Last Mantra for Today (#4) GOOD SOCIAL SCIENCE IS TEAM SCIENCE
83
84
85 Some how-to Any software that can handle path models can also handle crosslagged models Many cross-lagged models are saturate (i.e. no degrees of freedom) which makes traditional model fit indices useless Assess standardized coefficients Keep sample sizes in mind when interpreting the coefficients; what is a meaningful amount of impact

86 Ideas? TAKE SOME TIME AND DISCUSS WITH THOSE AROUND YOU WHAT IDEAS THIS PART OF THE WORKSHOP HAS SPARKED. SHARE WITH THE WHOLE GROUP

87 Stay in touch!
TRIPLL Webinar: Propensity score methods in chronic pain research
 TRIPLL Webinar: Propensity score methods in chronic pain research Felix Thoemmes, PhD Support provided by IES grant Matching Strategies for Observational Studies with Multilevel Data in Educational Research
Doing Quantitative Research 26E02900, 6 ECTS Lecture 6: Structural Equations Modeling. Olli-Pekka Kauppila Daria Kautto
 Doing Quantitative Research 26E02900, 6 ECTS Lecture 6: Structural Equations Modeling Olli-Pekka Kauppila Daria Kautto Session VI, September 20 2017 Learning objectives 1. Get familiar with the basic idea
Introduction to Multilevel Models for Longitudinal and Repeated Measures Data
 Introduction to Multilevel Models for Longitudinal and Repeated Measures Data Today s Class: Features of longitudinal data Features of longitudinal models What can MLM do for you? What to expect in this
Impact and adjustment of selection bias. in the assessment of measurement equivalence
 Impact and adjustment of selection bias in the assessment of measurement equivalence Thomas Klausch, Joop Hox,& Barry Schouten Working Paper, Utrecht, December 2012 Corresponding author: Thomas Klausch,
Propensity Score Methods for Causal Inference with the PSMATCH Procedure
 Paper SAS332-2017 Propensity Score Methods for Causal Inference with the PSMATCH Procedure Yang Yuan, Yiu-Fai Yung, and Maura Stokes, SAS Institute Inc. Abstract In a randomized study, subjects are randomly
Introduction to Observational Studies. Jane Pinelis
 Introduction to Observational Studies Jane Pinelis 22 March 2018 Outline Motivating example Observational studies vs. randomized experiments Observational studies: basics Some adjustment strategies Matching
Methods for Addressing Selection Bias in Observational Studies
 Methods for Addressing Selection Bias in Observational Studies Susan L. Ettner, Ph.D. Professor Division of General Internal Medicine and Health Services Research, UCLA What is Selection Bias? In the regression
11/18/2013. Correlational Research. Correlational Designs. Why Use a Correlational Design? CORRELATIONAL RESEARCH STUDIES
 Correlational Research Correlational Designs Correlational research is used to describe the relationship between two or more naturally occurring variables. Is age related to political conservativism? Are
Propensity Score Methods for Estimating Causality in the Absence of Random Assignment: Applications for Child Care Policy Research
 2012 CCPRC Meeting Methodology Presession Workshop October 23, 2012, 2:00-5:00 p.m. Propensity Score Methods for Estimating Causality in the Absence of Random Assignment: Applications for Child Care Policy
Supplement 2. Use of Directed Acyclic Graphs (DAGs)
") Supplement 2. Use of Directed Acyclic Graphs (DAGs) Abstract This supplement describes how counterfactual theory is used to define causal effects and the conditions in which observed data can be used to
Supplement 2. Use of Directed Acyclic Graphs (DAGs) Abstract This supplement describes how counterfactual theory is used to define causal effects and the conditions in which observed data can be used to
BIOSTATISTICAL METHODS
 BIOSTATISTICAL METHODS FOR TRANSLATIONAL & CLINICAL RESEARCH PROPENSITY SCORE Confounding Definition: A situation in which the effect or association between an exposure (a predictor or risk factor) and
Chapter 21 Multilevel Propensity Score Methods for Estimating Causal Effects: A Latent Class Modeling Strategy
 Chapter 21 Multilevel Propensity Score Methods for Estimating Causal Effects: A Latent Class Modeling Strategy Jee-Seon Kim and Peter M. Steiner Abstract Despite their appeal, randomized experiments cannot
Propensity Score Analysis Shenyang Guo, Ph.D.
 Propensity Score Analysis Shenyang Guo, Ph.D. Upcoming Seminar: April 7-8, 2017, Philadelphia, Pennsylvania Propensity Score Analysis 1. Overview 1.1 Observational studies and challenges 1.2 Why and when
Introduction to Multilevel Models for Longitudinal and Repeated Measures Data
 Introduction to Multilevel Models for Longitudinal and Repeated Measures Data Today s Class: Features of longitudinal data Features of longitudinal models What can MLM do for you? What to expect in this
Use of Structural Equation Modeling in Social Science Research
 Asian Social Science; Vol. 11, No. 4; 2015 ISSN 1911-2017 E-ISSN 1911-2025 Published by Canadian Center of Science and Education Use of Structural Equation Modeling in Social Science Research Wali Rahman
Business Statistics Probability
 Business Statistics The following was provided by Dr. Suzanne Delaney, and is a comprehensive review of Business Statistics. The workshop instructor will provide relevant examples during the Skills Assessment
11/24/2017. Do not imply a cause-and-effect relationship
 Correlational research is used to describe the relationship between two or more naturally occurring variables. Is age related to political conservativism? Are highly extraverted people less afraid of rejection
Propensity Score Methods to Adjust for Bias in Observational Data SAS HEALTH USERS GROUP APRIL 6, 2018
 Propensity Score Methods to Adjust for Bias in Observational Data SAS HEALTH USERS GROUP APRIL 6, 2018 Institute Institute for Clinical for Clinical Evaluative Evaluative Sciences Sciences Overview 1.
Mediation Analysis With Principal Stratification
 University of Pennsylvania ScholarlyCommons Statistics Papers Wharton Faculty Research 3-30-009 Mediation Analysis With Principal Stratification Robert Gallop Dylan S. Small University of Pennsylvania
Propensity score analysis with the latest SAS/STAT procedures PSMATCH and CAUSALTRT
 Propensity score analysis with the latest SAS/STAT procedures PSMATCH and CAUSALTRT Yuriy Chechulin, Statistician Modeling, Advanced Analytics What is SAS Global Forum One of the largest global analytical
Structural Equation Modeling (SEM)
") Structural Equation Modeling (SEM) Today s topics The Big Picture of SEM What to do (and what NOT to do) when SEM breaks for you Single indicator (ASU) models Parceling indicators Using single factor scores
Structural Equation Modeling (SEM) Today s topics The Big Picture of SEM What to do (and what NOT to do) when SEM breaks for you Single indicator (ASU) models Parceling indicators Using single factor scores
Methods to control for confounding - Introduction & Overview - Nicolle M Gatto 18 February 2015
 Methods to control for confounding - Introduction & Overview - Nicolle M Gatto 18 February 2015 Learning Objectives At the end of this confounding control overview, you will be able to: Understand how
Recent advances in non-experimental comparison group designs
 Recent advances in non-experimental comparison group designs Elizabeth Stuart Johns Hopkins Bloomberg School of Public Health Department of Mental Health Department of Biostatistics Department of Health
A Structural Equation Modeling: An Alternate Technique in Predicting Medical Appointment Adherence
 A Structural Equation Modeling: An Alternate Technique in Predicting Medical Appointment Adherence Yeow Chye Ng, PhD, FNP-BC, NP-C, AAHIVE Assistant Professor Need to use CON template 27th International
MS&E 226: Small Data
 MS&E 226: Small Data Lecture 10: Introduction to inference (v2) Ramesh Johari ramesh.johari@stanford.edu 1 / 17 What is inference? 2 / 17 Where did our data come from? Recall our sample is: Y, the vector
Alternative Methods for Assessing the Fit of Structural Equation Models in Developmental Research
 Alternative Methods for Assessing the Fit of Structural Equation Models in Developmental Research Michael T. Willoughby, B.S. & Patrick J. Curran, Ph.D. Duke University Abstract Structural Equation Modeling
investigate. educate. inform.
 investigate. educate. inform. Research Design What drives your research design? The battle between Qualitative and Quantitative is over Think before you leap What SHOULD drive your research design. Advanced
PubH 7405: REGRESSION ANALYSIS. Propensity Score
 PubH 7405: REGRESSION ANALYSIS Propensity Score INTRODUCTION: There is a growing interest in using observational (or nonrandomized) studies to estimate the effects of treatments on outcomes. In observational
Cutting-Edge Statistical Methods for a Life-Course Approach 1,2
 REVIEWS FROM ASN EB 2013 SYMPOSIA Cutting-Edge Statistical Methods for a Life-Course Approach 1,2 Kristen L. Bub* and Larissa K. Ferretti Auburn University, Auburn, AL ABSTRACT Advances in research methods,
Donna L. Coffman Joint Prevention Methodology Seminar
 Donna L. Coffman Joint Prevention Methodology Seminar The purpose of this talk is to illustrate how to obtain propensity scores in multilevel data and use these to strengthen causal inferences about mediation.
What is Multilevel Modelling Vs Fixed Effects. Will Cook Social Statistics
 What is Multilevel Modelling Vs Fixed Effects Will Cook Social Statistics Intro Multilevel models are commonly employed in the social sciences with data that is hierarchically structured Estimated effects
George B. Ploubidis. The role of sensitivity analysis in the estimation of causal pathways from observational data. Improving health worldwide
 George B. Ploubidis The role of sensitivity analysis in the estimation of causal pathways from observational data Improving health worldwide www.lshtm.ac.uk Outline Sensitivity analysis Causal Mediation
Logistic regression: Why we often can do what we think we can do 1.
 Logistic regression: Why we often can do what we think we can do 1. Augst 8 th 2015 Maarten L. Buis, University of Konstanz, Department of History and Sociology maarten.buis@uni.konstanz.de All propositions
Methodology for Non-Randomized Clinical Trials: Propensity Score Analysis Dan Conroy, Ph.D., inventiv Health, Burlington, MA
 PharmaSUG 2014 - Paper SP08 Methodology for Non-Randomized Clinical Trials: Propensity Score Analysis Dan Conroy, Ph.D., inventiv Health, Burlington, MA ABSTRACT Randomized clinical trials serve as the
The Logic of Causal Inference
 The Logic of Causal Inference Judea Pearl University of California, Los Angeles Computer Science Department Los Angeles, CA, 90095-1596, USA judea@cs.ucla.edu September 13, 2010 1 Introduction The role
Citation for published version (APA): Ebbes, P. (2004). Latent instrumental variables: a new approach to solve for endogeneity s.n.
: Ebbes, P. (2004). Latent instrumental variables: a new approach to solve for endogeneity s.n.") University of Groningen Latent instrumental variables Ebbes, P. IMPORTANT NOTE: You are advised to consult the publisher's version (publisher's PDF) if you wish to cite from it. Please check the document
University of Groningen Latent instrumental variables Ebbes, P. IMPORTANT NOTE: You are advised to consult the publisher's version (publisher's PDF) if you wish to cite from it. Please check the document
Approaches to Improving Causal Inference from Mediation Analysis
 Approaches to Improving Causal Inference from Mediation Analysis David P. MacKinnon, Arizona State University Pennsylvania State University February 27, 2013 Background Traditional Mediation Methods Modern
Simultaneous Equation and Instrumental Variable Models for Sexiness and Power/Status
 Simultaneous Equation and Instrumental Variable Models for Seiness and Power/Status We would like ideally to determine whether power is indeed sey, or whether seiness is powerful. We here describe the
Describe what is meant by a placebo Contrast the double-blind procedure with the single-blind procedure Review the structure for organizing a memo
 Business Statistics The following was provided by Dr. Suzanne Delaney, and is a comprehensive review of Business Statistics. The workshop instructor will provide relevant examples during the Skills Assessment
Index. Springer International Publishing Switzerland 2017 T.J. Cleophas, A.H. Zwinderman, Modern Meta-Analysis, DOI /
 Index A Adjusted Heterogeneity without Overdispersion, 63 Agenda-driven bias, 40 Agenda-Driven Meta-Analyses, 306 307 Alternative Methods for diagnostic meta-analyses, 133 Antihypertensive effect of potassium,
Panel: Using Structural Equation Modeling (SEM) Using Partial Least Squares (SmartPLS)
 Using Partial Least Squares (SmartPLS)") Panel: Using Structural Equation Modeling (SEM) Using Partial Least Squares (SmartPLS) Presenters: Dr. Faizan Ali, Assistant Professor Dr. Cihan Cobanoglu, McKibbon Endowed Chair Professor University of
Panel: Using Structural Equation Modeling (SEM) Using Partial Least Squares (SmartPLS) Presenters: Dr. Faizan Ali, Assistant Professor Dr. Cihan Cobanoglu, McKibbon Endowed Chair Professor University of
Current Directions in Mediation Analysis David P. MacKinnon 1 and Amanda J. Fairchild 2
 CURRENT DIRECTIONS IN PSYCHOLOGICAL SCIENCE Current Directions in Mediation Analysis David P. MacKinnon 1 and Amanda J. Fairchild 2 1 Arizona State University and 2 University of South Carolina ABSTRACT
Part 8 Logistic Regression
 1 Quantitative Methods for Health Research A Practical Interactive Guide to Epidemiology and Statistics Practical Course in Quantitative Data Handling SPSS (Statistical Package for the Social Sciences)
Cross-Lagged Panel Analysis
 Cross-Lagged Panel Analysis Michael W. Kearney Cross-lagged panel analysis is an analytical strategy used to describe reciprocal relationships, or directional influences, between variables over time. Cross-lagged
Confounding by indication developments in matching, and instrumental variable methods. Richard Grieve London School of Hygiene and Tropical Medicine
 Confounding by indication developments in matching, and instrumental variable methods Richard Grieve London School of Hygiene and Tropical Medicine 1 Outline 1. Causal inference and confounding 2. Genetic
Module 14: Missing Data Concepts
 Module 14: Missing Data Concepts Jonathan Bartlett & James Carpenter London School of Hygiene & Tropical Medicine Supported by ESRC grant RES 189-25-0103 and MRC grant G0900724 Pre-requisites Module 3
Modeling the Influential Factors of 8 th Grades Student s Mathematics Achievement in Malaysia by Using Structural Equation Modeling (SEM)
") International Journal of Advances in Applied Sciences (IJAAS) Vol. 3, No. 4, December 2014, pp. 172~177 ISSN: 2252-8814 172 Modeling the Influential Factors of 8 th Grades Student s Mathematics Achievement
International Journal of Advances in Applied Sciences (IJAAS) Vol. 3, No. 4, December 2014, pp. 172~177 ISSN: 2252-8814 172 Modeling the Influential Factors of 8 th Grades Student s Mathematics Achievement
Lecture II: Difference in Difference and Regression Discontinuity
 Review Lecture II: Difference in Difference and Regression Discontinuity it From Lecture I Causality is difficult to Show from cross sectional observational studies What caused what? X caused Y, Y caused
Addendum: Multiple Regression Analysis (DRAFT 8/2/07)
") Addendum: Multiple Regression Analysis (DRAFT 8/2/07) When conducting a rapid ethnographic assessment, program staff may: Want to assess the relative degree to which a number of possible predictive variables
Addendum: Multiple Regression Analysis (DRAFT 8/2/07) When conducting a rapid ethnographic assessment, program staff may: Want to assess the relative degree to which a number of possible predictive variables
Data and Statistics 101: Key Concepts in the Collection, Analysis, and Application of Child Welfare Data
 TECHNICAL REPORT Data and Statistics 101: Key Concepts in the Collection, Analysis, and Application of Child Welfare Data CONTENTS Executive Summary...1 Introduction...2 Overview of Data Analysis Concepts...2
How should the propensity score be estimated when some confounders are partially observed?
 How should the propensity score be estimated when some confounders are partially observed? Clémence Leyrat 1, James Carpenter 1,2, Elizabeth Williamson 1,3, Helen Blake 1 1 Department of Medical statistics,
existing statistical techniques. However, even with some statistical background, reading and
 STRUCTURAL EQUATION MODELING (SEM): A STEP BY STEP APPROACH (PART 1) By: Zuraidah Zainol (PhD) Faculty of Management & Economics, Universiti Pendidikan Sultan Idris zuraidah@fpe.upsi.edu.my 2016 INTRODUCTION
Estimating indirect and direct effects of a Cancer of Unknown Primary (CUP) diagnosis on survival for a 6 month-period after diagnosis.
 diagnosis on survival for a 6 month-period after diagnosis.") Estimating indirect and direct effects of a Cancer of Unknown Primary (CUP) diagnosis on survival for a 6 month-period after diagnosis. A Manuscript prepared in Fulfillment of a B.S Honors Thesis in Statistics
Estimating indirect and direct effects of a Cancer of Unknown Primary (CUP) diagnosis on survival for a 6 month-period after diagnosis. A Manuscript prepared in Fulfillment of a B.S Honors Thesis in Statistics
Glossary From Running Randomized Evaluations: A Practical Guide, by Rachel Glennerster and Kudzai Takavarasha
 Glossary From Running Randomized Evaluations: A Practical Guide, by Rachel Glennerster and Kudzai Takavarasha attrition: When data are missing because we are unable to measure the outcomes of some of the
NORTH SOUTH UNIVERSITY TUTORIAL 2
 NORTH SOUTH UNIVERSITY TUTORIAL 2 AHMED HOSSAIN,PhD Data Management and Analysis AHMED HOSSAIN,PhD - Data Management and Analysis 1 Correlation Analysis INTRODUCTION In correlation analysis, we estimate
Identifying Peer Influence Effects in Observational Social Network Data: An Evaluation of Propensity Score Methods
 Identifying Peer Influence Effects in Observational Social Network Data: An Evaluation of Propensity Score Methods Dean Eckles Department of Communication Stanford University dean@deaneckles.com Abstract
Multifactor Confirmatory Factor Analysis
 Multifactor Confirmatory Factor Analysis Latent Trait Measurement and Structural Equation Models Lecture #9 March 13, 2013 PSYC 948: Lecture #9 Today s Class Confirmatory Factor Analysis with more than
12/30/2017. PSY 5102: Advanced Statistics for Psychological and Behavioral Research 2
 PSY 5102: Advanced Statistics for Psychological and Behavioral Research 2 Selecting a statistical test Relationships among major statistical methods General Linear Model and multiple regression Special
Title: The Theory of Planned Behavior (TPB) and Texting While Driving Behavior in College Students MS # Manuscript ID GCPI
 and Texting While Driving Behavior in College Students MS # Manuscript ID GCPI") Title: The Theory of Planned Behavior (TPB) and Texting While Driving Behavior in College Students MS # Manuscript ID GCPI-2015-02298 Appendix 1 Role of TPB in changing other behaviors TPB has been applied
Title: The Theory of Planned Behavior (TPB) and Texting While Driving Behavior in College Students MS # Manuscript ID GCPI-2015-02298 Appendix 1 Role of TPB in changing other behaviors TPB has been applied
Objective: To describe a new approach to neighborhood effects studies based on residential mobility and demonstrate this approach in the context of
 Objective: To describe a new approach to neighborhood effects studies based on residential mobility and demonstrate this approach in the context of neighborhood deprivation and preterm birth. Key Points:
Assessing Measurement Invariance in the Attitude to Marriage Scale across East Asian Societies. Xiaowen Zhu. Xi an Jiaotong University.
 Running head: ASSESS MEASUREMENT INVARIANCE Assessing Measurement Invariance in the Attitude to Marriage Scale across East Asian Societies Xiaowen Zhu Xi an Jiaotong University Yanjie Bian Xi an Jiaotong
Detection of Unknown Confounders. by Bayesian Confirmatory Factor Analysis
 Advanced Studies in Medical Sciences, Vol. 1, 2013, no. 3, 143-156 HIKARI Ltd, www.m-hikari.com Detection of Unknown Confounders by Bayesian Confirmatory Factor Analysis Emil Kupek Department of Public
Causal Mediation Analysis with the CAUSALMED Procedure
 Paper SAS1991-2018 Causal Mediation Analysis with the CAUSALMED Procedure Yiu-Fai Yung, Michael Lamm, and Wei Zhang, SAS Institute Inc. Abstract Important policy and health care decisions often depend
THE INDIRECT EFFECT IN MULTIPLE MEDIATORS MODEL BY STRUCTURAL EQUATION MODELING ABSTRACT
 European Journal of Business, Economics and Accountancy Vol. 4, No. 3, 016 ISSN 056-6018 THE INDIRECT EFFECT IN MULTIPLE MEDIATORS MODEL BY STRUCTURAL EQUATION MODELING Li-Ju Chen Department of Business
Readings: Textbook readings: OpenStax - Chapters 1 11 Online readings: Appendix D, E & F Plous Chapters 10, 11, 12 and 14
 Readings: Textbook readings: OpenStax - Chapters 1 11 Online readings: Appendix D, E & F Plous Chapters 10, 11, 12 and 14 Still important ideas Contrast the measurement of observable actions (and/or characteristics)
Lecture II: Difference in Difference. Causality is difficult to Show from cross
 Review Lecture II: Regression Discontinuity and Difference in Difference From Lecture I Causality is difficult to Show from cross sectional observational studies What caused what? X caused Y, Y caused
Certificate Courses in Biostatistics
 Certificate Courses in Biostatistics Term I : September December 2015 Term II : Term III : January March 2016 April June 2016 Course Code Module Unit Term BIOS5001 Introduction to Biostatistics 3 I BIOS5005
Still important ideas
 Readings: OpenStax - Chapters 1 13 & Appendix D & E (online) Plous Chapters 17 & 18 - Chapter 17: Social Influences - Chapter 18: Group Judgments and Decisions Still important ideas Contrast the measurement
Describe what is meant by a placebo Contrast the double-blind procedure with the single-blind procedure Review the structure for organizing a memo
 Please note the page numbers listed for the Lind book may vary by a page or two depending on which version of the textbook you have. Readings: Lind 1 11 (with emphasis on chapters 10, 11) Please note chapter
On the Performance of Maximum Likelihood Versus Means and Variance Adjusted Weighted Least Squares Estimation in CFA
 STRUCTURAL EQUATION MODELING, 13(2), 186 203 Copyright 2006, Lawrence Erlbaum Associates, Inc. On the Performance of Maximum Likelihood Versus Means and Variance Adjusted Weighted Least Squares Estimation
Instrumental Variables Estimation: An Introduction
 Instrumental Variables Estimation: An Introduction Susan L. Ettner, Ph.D. Professor Division of General Internal Medicine and Health Services Research, UCLA The Problem The Problem Suppose you wish to
Review of Veterinary Epidemiologic Research by Dohoo, Martin, and Stryhn
 The Stata Journal (2004) 4, Number 1, pp. 89 92 Review of Veterinary Epidemiologic Research by Dohoo, Martin, and Stryhn Laurent Audigé AO Foundation laurent.audige@aofoundation.org Abstract. The new book
You can use this app to build a causal Bayesian network and experiment with inferences. We hope you ll find it interesting and helpful.
 icausalbayes USER MANUAL INTRODUCTION You can use this app to build a causal Bayesian network and experiment with inferences. We hope you ll find it interesting and helpful. We expect most of our users
CLASSIFICATION TREE ANALYSIS:
 CLASSIFICATION TREE ANALYSIS: A USEFUL STATISTICAL TOOL FOR PROGRAM EVALUATORS Meredith L. Philyaw, MS Jennifer Lyons, MSW(c) Why This Session? Stand up if you... Consider yourself to be a data analyst,
THE GOOD, THE BAD, & THE UGLY: WHAT WE KNOW TODAY ABOUT LCA WITH DISTAL OUTCOMES. Bethany C. Bray, Ph.D.
 THE GOOD, THE BAD, & THE UGLY: WHAT WE KNOW TODAY ABOUT LCA WITH DISTAL OUTCOMES Bethany C. Bray, Ph.D. bcbray@psu.edu WHAT ARE WE HERE TO TALK ABOUT TODAY? Behavioral scientists increasingly are using
Deanna Schreiber-Gregory Henry M Jackson Foundation for the Advancement of Military Medicine. PharmaSUG 2016 Paper #SP07
 Deanna Schreiber-Gregory Henry M Jackson Foundation for the Advancement of Military Medicine PharmaSUG 2016 Paper #SP07 Introduction to Latent Analyses Review of 4 Latent Analysis Procedures ADD Health
(CORRELATIONAL DESIGN AND COMPARATIVE DESIGN)
") UNIT 4 OTHER DESIGNS (CORRELATIONAL DESIGN AND COMPARATIVE DESIGN) Quasi Experimental Design Structure 4.0 Introduction 4.1 Objectives 4.2 Definition of Correlational Research Design 4.3 Types of Correlational
UNIT 4 OTHER DESIGNS (CORRELATIONAL DESIGN AND COMPARATIVE DESIGN) Quasi Experimental Design Structure 4.0 Introduction 4.1 Objectives 4.2 Definition of Correlational Research Design 4.3 Types of Correlational
A critical look at the use of SEM in international business research
 sdss A critical look at the use of SEM in international business research Nicole F. Richter University of Southern Denmark Rudolf R. Sinkovics The University of Manchester Christian M. Ringle Hamburg University
Intro to SPSS. Using SPSS through WebFAS
 Intro to SPSS Using SPSS through WebFAS http://www.yorku.ca/computing/students/labs/webfas/ Try it early (make sure it works from your computer) If you need help contact UIT Client Services Voice: 416-736-5800
Scale Building with Confirmatory Factor Analysis
 Scale Building with Confirmatory Factor Analysis Latent Trait Measurement and Structural Equation Models Lecture #7 February 27, 2013 PSYC 948: Lecture #7 Today s Class Scale building with confirmatory
Statistics is the science of collecting, organizing, presenting, analyzing, and interpreting data to assist in making effective decisions
 Readings: OpenStax Textbook - Chapters 1 5 (online) Appendix D & E (online) Plous - Chapters 1, 5, 6, 13 (online) Introductory comments Describe how familiarity with statistical methods can - be associated
Generalized Estimating Equations for Depression Dose Regimes
 Generalized Estimating Equations for Depression Dose Regimes Karen Walker, Walker Consulting LLC, Menifee CA Generalized Estimating Equations on the average produce consistent estimates of the regression
Psychology Research Process
 Psychology Research Process Logical Processes Induction Observation/Association/Using Correlation Trying to assess, through observation of a large group/sample, what is associated with what? Examples:
Applications of Structural Equation Modeling (SEM) in Humanities and Science Researches
 in Humanities and Science Researches") Applications of Structural Equation Modeling (SEM) in Humanities and Science Researches Dr. Ayed Al Muala Department of Marketing, Applied Science University aied_muala@yahoo.com Dr. Mamdouh AL Ziadat
Applications of Structural Equation Modeling (SEM) in Humanities and Science Researches Dr. Ayed Al Muala Department of Marketing, Applied Science University aied_muala@yahoo.com Dr. Mamdouh AL Ziadat
Bayes Linear Statistics. Theory and Methods
 Bayes Linear Statistics Theory and Methods Michael Goldstein and David Wooff Durham University, UK BICENTENNI AL BICENTENNIAL Contents r Preface xvii 1 The Bayes linear approach 1 1.1 Combining beliefs
An Introduction to Propensity Score Methods for Reducing the Effects of Confounding in Observational Studies
 Multivariate Behavioral Research, 46:399 424, 2011 Copyright Taylor & Francis Group, LLC ISSN: 0027-3171 print/1532-7906 online DOI: 10.1080/00273171.2011.568786 An Introduction to Propensity Score Methods
CHAPTER III RESEARCH METHODOLOGY
 CHAPTER III RESEARCH METHODOLOGY In this chapter, the researcher will elaborate the methodology of the measurements. This chapter emphasize about the research methodology, data source, population and sampling,
Readings: Textbook readings: OpenStax - Chapters 1 13 (emphasis on Chapter 12) Online readings: Appendix D, E & F
 Online readings: Appendix D, E & F") Readings: Textbook readings: OpenStax - Chapters 1 13 (emphasis on Chapter 12) Online readings: Appendix D, E & F Plous Chapters 17 & 18 Chapter 17: Social Influences Chapter 18: Group Judgments and Decisions
Readings: Textbook readings: OpenStax - Chapters 1 13 (emphasis on Chapter 12) Online readings: Appendix D, E & F Plous Chapters 17 & 18 Chapter 17: Social Influences Chapter 18: Group Judgments and Decisions
One-Way Independent ANOVA
 One-Way Independent ANOVA Analysis of Variance (ANOVA) is a common and robust statistical test that you can use to compare the mean scores collected from different conditions or groups in an experiment.
Propensity scores: what, why and why not?
 Propensity scores: what, why and why not? Rhian Daniel, Cardiff University @statnav Joint workshop S3RI & Wessex Institute University of Southampton, 22nd March 2018 Rhian Daniel @statnav/propensity scores:
Chapter 11: Advanced Remedial Measures. Weighted Least Squares (WLS)
") Chapter : Advanced Remedial Measures Weighted Least Squares (WLS) When the error variance appears nonconstant, a transformation (of Y and/or X) is a quick remedy. But it may not solve the problem, or it
Chapter : Advanced Remedial Measures Weighted Least Squares (WLS) When the error variance appears nonconstant, a transformation (of Y and/or X) is a quick remedy. But it may not solve the problem, or it
A Practical Guide to Getting Started with Propensity Scores
 Paper 689-2017 A Practical Guide to Getting Started with Propensity Scores Thomas Gant, Keith Crowland Data & Information Management Enhancement (DIME) Kaiser Permanente ABSTRACT This paper gives tools
Write your identification number on each paper and cover sheet (the number stated in the upper right hand corner on your exam cover).
.") STOCKHOLM UNIVERSITY Department of Economics Course name: Empirical methods 2 Course code: EC2402 Examiner: Per Pettersson-Lidbom Number of credits: 7,5 credits Date of exam: Sunday 21 February 2010 Examination
STOCKHOLM UNIVERSITY Department of Economics Course name: Empirical methods 2 Course code: EC2402 Examiner: Per Pettersson-Lidbom Number of credits: 7,5 credits Date of exam: Sunday 21 February 2010 Examination
Chapter 1: Explaining Behavior
 Chapter 1: Explaining Behavior GOAL OF SCIENCE is to generate explanations for various puzzling natural phenomenon. - Generate general laws of behavior (psychology) RESEARCH: principle method for acquiring
Score Tests of Normality in Bivariate Probit Models
 Score Tests of Normality in Bivariate Probit Models Anthony Murphy Nuffield College, Oxford OX1 1NF, UK Abstract: A relatively simple and convenient score test of normality in the bivariate probit model
The Effect of Attitude toward Television Advertising on Materialistic Attitudes and Behavioral Intention
 The Effect of Attitude toward Television Advertising on Materialistic Attitudes and Behavioral Intention Nunuk Herawati*, Nur Qumariyah**& Irwan Christanto Edy***, *Lecturer in Faculty of Management, STIE
11/15/2011. Predictors of Sexual Victimization and Revictimization Among U.S. Navy Recruits: Comparison of Child Sexual Abuse Victims and Nonvictims
 Predictors of Sexual Victimization and Revictimization Among U.S. Navy Recruits: Comparison of Child Sexual Victims and Nonvictims Mandy M. Rabenhorst, Ph.D. Center for the Study of Family Violence and
Finland and Sweden and UK GP-HOSP datasets
 Web appendix: Supplementary material Table 1 Specific diagnosis codes used to identify bladder cancer cases in each dataset Finland and Sweden and UK GP-HOSP datasets Netherlands hospital and cancer registry
G , G , G MHRN
 Estimation of treatment-effects from randomized controlled trials in the presence non-compliance with randomized treatment allocation Graham Dunn University of Manchester Research funded by: MRC Methodology