Dr Cheryl Brunton, Dr Greg Hamilton, Chris Ambrose & Ted Mita Te Hae Community and Public Health
|
|
|
- Lester Wade
- 6 years ago
- Views:
Transcription


1
2 This health profile was prepared for the West Coast District Health Board by Community and Public Health, Canterbury District Health Board. Lead author: Dr Annabel Begg With assistance from: Dr Cheryl Brunton, Dr Greg Hamilton, Chris Ambrose & Ted Mita Te Hae Community and Public Health Dr Ricci Harris Eru Pomare Centre Dr Elisabeth Wells and Dr Patrick Graham University of Otago, Christchurch 2
3 He Kupu Whakataki Tatai Whetu ki te Rangi tu tonu, tu tonu. Tätai tangata ki te whenua ngaro noa,ngaro noa E mihi ana ki nga mate huhua,e hinga mai ra, e okioki mai ra. Whakataa, tïraha, e moe. Waiho ko o koutou tapuwae hei tohutohu te huarahi mo matou haere, haere, haere Te Tai o Poutini, koutou raurangatira ma nga kaitiaki o nga taonga o te Ao Kohatu, o te Ao tuawhakarere. Tena koutou, tënä koutou. He mihi matakuikui tënei mo to koutou tautoko mai i tënei purongo me ona hua hauora kua wharikihia ki mua i to koutou aroaro. Ko te inoi, he taonga kei roto i enei mahi kua tukua nei kia koutou hei whakaora i te iwi. Mehemea e whakäe ana koutou he hua enei, tikina mai whakamahia hei oranga mo koutou a,mo tätou katoa. Kei aku rangatira o te tatau o te pounamu, tënä koutou tënä koutou. Ma te rungarawa koutou, tätou katoa, e manaki e tiaki iroto i nga Tïni putanga ke tanga o tënei Ao matemate. A formation of stars, endures forever. A formation of men recedes, wanes and disappears. I acknowledge the many who have passed on you who now recline in sleep. Let your footprints be our guide to salvation and posterity. go forth in your myriads and rest. To the esteemed people of Te Tai Poutini the guardians of the treasures from the ancients and from the world of our distant past greetings to you all. We congratulate and commend you for your support and endorsement of this project report, and the positive benefits that may accrue from it. The hope is that the information presented will assist in some way in achieving healthy outcomes for the people. If the consensus is that there is much knowledge and benefit to be gained from the report grasp it and use it for the betterment of the community. Finally, once again, to the guardians of the gateway to the greenstone paths greetings and salutations. May the blessings and the protection of the creator be upon us all in this world of uncertainty and conflict. 3
4 Table of Contents Executive Summary Introduction Health needs assessment Scope of this document Data sources Statistical analysis Structure of this document Demographic Profile West Coast population West Coast Māori Births Social Indicators Deprivation The New Zealand Deprivation Index Employment and work status Rurality All-Cause Mortality Communicable Disease Notifiable communicable disease Immunisation coverage Cardiovascular Disease Cardiovascular disease hospitalisations and mortality Cancer Cancer registrations Screening Injury Injury mortality Injury morbidity Childhood injury Violence Child and Youth Health Mortality and morbidity Pre-term birth and low birthweight Breastfeeding Nutrition Hearing Asthma Tobacco Smoking prevalence Youth smoking Adult respiratory disease Diabetes Diabetes hospitalisations Local Diabetes Team data Mental Health Access to services Mental health hospitalisations Suicide Deliberate self-harm Oral Health Oral health status Child hospitalisations for dental extractions
5 14 Sexual and Reproductive Health Hospitalisations for pregnancy-related conditions Termination of pregnancy Sexually transmitted infections Alcohol and Other Drugs Self-report data Alcohol and other drug hospitalisations The New Zealand Health Survey Avoidable Hospitalisations Avoidable and Amenable Mortality Primary Health Care Introduction West Coast PHO programmes Youth health programmes Other clinical programmes Appendix I. Statistical Methods Appendix II. ICD Codes References
6 List of Tables Table 2.1 Number and proportion of people indicating each ethnic group West Coast and New Zealand, Table 2.2 Number and proportion of Māori in the West Coast DHB and Territorial Local Authorities, 2001 and Table 2.3 West Coast DHB Iwi, Table 2.4 West Coast hospital births by NZDep area of mother s usual residence, Table 2.5 Total births by maternal ethnicity, West Coast Table 2.6 Total number of teenage births to women in West Coast region, Table Census: Income, education, access to telephone, access to car, and home ownership by ethnicity Table 3.2 Status in employment West Coast DHB and New Zealand, Table 3.3 Work status West Coast DHB and New Zealand, Table 4.1 All-cause mortality Table 5.1 WCDHB Communicable Disease Notifications, 1 st January st December Table 5.2 Regular childhood immunisation coverage, West Coast Table 6.1 Cardiovascular disease indicators Table 6.2 Ischaemic heart disease indicators Table 7.1 Cancer registrations by site for West Coast DHB, Table 7.2 Cancer registrations and mortality Table 7.3 Cervical Screening Programme mean monthly coverage and participation rates for West Coast DHB, January 2006-May Table 7.4 Breast Screen Aotearoa coverage rates , inclusive Table 8.1 External cause of fatal injury by ethnicity, for West Coast DHB and New Zealand, Table 8.2 External cause of injury by ethnicity, for West Coast DHB and New Zealand, Table 8.3 Childhood injury: Discharge rate per 1,000 for injuries, Table 9.1 Child and youth hospitalisations Table 9.2 Pre-term birth and low birthweight West Coast DHB, Table 9.3 Discharge rate per 1,000 hospital births for low birthweight, Table 9.4 Plunket-enrolled babies breastfeeding at 6 weeks and 6 months, Table 9.5 Plunket-enrolled babies breastfeeding at 6 weeks and 6 months, July 2005 to June Table 9.6 Plunket enrolments by NZDep of domicile, July 2005 to June Table 9.7 Hearing screening: Coverage and failure rates, Table 9.8 Asthma hospitalisations Table 9.9 Childhood asthma: Readmission rate per 100 discharges by DHB region for asthma (within 30 days) Table 10.1 Smoking status 1996 and 2006 Census Table 10.2 Distribution of year 10 students by smoking category, 1999 and 2005 (all ethnicities) Table 10.3 Distribution of West Coast year 10 students by smoking category, Table 10.4 Chronic obstructive pulmonary disease hospitalisations Table 11.1 Diabetes hospitalisations Table 11.2 Local Diabetes Team data
7 Table 11.3 Local Diabetes Team data: Aggregated data from free annual reviews, 1st January 2006 to 31st December Table 12.1 Access to mental health services: West Coast DHB Māori utilisation of mental health services, Table 12.2 Mental Health Collection , West Coast DHB mean annual number and rate per 1,000 population for bednights and contacts Table 12.3 Mental health hospitalisations Table 12.4 Deliberate self harm hospitalisations Table 13.1 Oral health status by ethnic group, West Coast and New Zealand, Table 13.2 Hospitalisations for dental extractions, 0 to 9 years Table 14.1 Pregnancy-related hospitalisations Table 14.2 Sexually transmitted infection rates (confirmed cases only) Greymouth Sexual Health Clinic, Table 15.1 Alcohol and other drug hospitalisations Table Self report of chronic disease Table 16.1 (continued) Self report of chronic disease Table 16.1 (continued) Self report of chronic disease Table 16.2 Self report of risk and protective factors Table 16.2 (continued) Self report of risk and protective factors Table 16.2 (continued) Self report of risk and protective factors Table 17.1 Ambulatory sensitive hospitalisations, Table 17.2 Ambulatory sensitive hospitalisations: Discharge rate per 1,000 ages 5 to 14, 15 to 24 and 65 to 74, Table 17.3 Population preventable hospitalisations: Discharge Rate per 1,000, Table 18.1 Age-standardised avoidable mortality (number of deaths per 100,000 population) for ages 0 to 74, Table 19.1 Characteristics of West Coast PHO enrolled population Table I. ICD-9 codes used for hospitalisations data Table II. ICD-9 and ICD-10 codes used for mortality data
8 List of Figures Figure 2.1 West Coast 2001 population pyramid Figure 2.2 New Zealand 2001 population pyramid Figure 2.3 West Coast 2006 population pyramid Figure 2.4 New Zealand 2006 population pyramid Figure 2.5 Fertility rates by ethnicity, West Coast vs New Zealand, Figure 2.6 Fertility rates by ethnicity and age for West Coast women, Figure 2.7 Teenage birth rates by ethnicity, West Coast vs New Zealand, Figure 3.1 Deprivation profile for West Coast Māori, Figure 3.2 Deprivation profile for West Coast all ethnicities, Figure 3.3 Deprivation profile for New Zealand Māori, Figure 3.4 Deprivation profile for New Zealand all ethnicities, Figure 3.5 Distance to health services 10 km distance bands (along roads) to service providers Figure 3.6 Māori population counts Buller and Grey Districts, Figure 3.7 Māori population counts Westland District, Figure 8.1 Mechanism of injury for West Coast Māori, all ages Figure 8.2 Mechanism of injury for West Coast all ethnicities, all ages
9 Executive Summary The West Coast Te Tai O Poutini Māori Health Profile is a document to inform the subsequent stages of a health needs assessment for Māori in the West Coast DHB. Data have been accessed from a variety of sources, and Māori and Non-Māori/All ethnicities data are presented on a range of indicators. The choice of indicators was guided by the New Zealand Health Strategy (Minister of Health, 2000) and He Korowai Oranga The Māori Health Strategy (Minister of Health and Associate Minister of Health, 2002). Age-standardised and age-specific rates are presented where possible and it has been important to present 95% confidence intervals, because the small numbers of Māori on the West Coast reduce the precision of rate estimates. The document presents demographic and social data first, followed by health data. Key points are summarised in each section for quick reference. Demographic and social data Māori make up 9.3% of the West Coast population. Like the national Māori population, the West Coast Māori population has a younger age structure than the Non-Māori population. West Coast Māori fertility rates are higher than West Coast European rates, but lower than the New Zealand Māori average. The West Coast population is relatively deprived overall, as defined by the New Zealand Deprivation Index West Coast Māori have a similar deprivation profile to the total West Coast population, and this is in contrast to the national picture, in which Māori have a more deprived profile. However, data from the 2006 Census indicate that West Coast Māori have higher levels of deprivation than the total West Coast population on a number of Census measures, including income, education, access to a car and telephone, and home ownership. Health data All-cause mortality is significantly higher for West Coast Māori than Non-Māori, and this is consistent with the national picture. Māori are under-represented among communicable disease notifications on the West Coast, although this may be due to a number of factors, including lower rates of presentation to General Practitioners. Early data from the National Immunisation Register indicate lower coverage for West Coast Māori children. West Coast Māori have a higher burden of cardiovascular disease than West Coast Non- Māori. This includes higher mortality rates for all cardiovascular disease, and higher mortality and hospitalisation rates for stroke. In contrast, comparison of cardiovascular and ischaemic heart disease hospitalisation rates (no difference in rates for the former, and lower rates for the latter) suggest that cardiovascular disease is an important area of unmet need for West Coast Māori. West Coast Māori have similar cancer registration rates but significantly higher cancer mortality than West Coast Non-Māori. This suggests a similar incidence of disease but poorer overall outcomes for West Coast Māori. Adequacy of screening is especially important in light of these results. While cervical screening data indicate lower 9
10 participation and coverage rates for West Coast Māori women, breast screening data indicate that coverage rates for West Coast Māori women are comparable to those for Non-Māori, Non-Pacific women. Māori are largely under-represented in injury mortality and morbidity data on the West Coast, whereas nationally Māori are over-represented among injury data. There are no significant differences in Māori and Non-Māori hospitalisation rates for children and youth on the West Coast, and no significant differences in rates of low birthweight and pre-term birth. Recent West Coast Plunket data suggest an increase in the proportion of breastfeeding for Māori babies. Hearing screening coverage is lower for West Coast Māori children than for West Coast children overall at 3 years, but similar at school entry. Asthma hospitalisations are not significantly different between West Coast Māori and Non-Māori, and West Coast Māori rates are significantly lower than Māori rates nationally. The smoking prevalence remains substantially higher for West Māori than for West Coast Non-Māori at the 2006 Census. Year 10 survey data indicate that Māori girls have the highest rates of daily smoking. West Coast Māori have significantly higher rates of hospitalisation for chronic obstructive airways disease than West Coast Māori and New Zealand Māori and Non-Māori. Diabetes hospitalisations are significantly higher for Māori both on the West Coast and nationally, and Local Diabetes Team data indicate that West Coast Māori with diabetes are less likely to have an annual review. West Coast Māori have similar rates of mental health hospitalisations to West Coast Non-Māori and there are also no significant differences in rates of deliberate self-harm hospitalisations. West Coast Māori children have poorer oral health than West Coast children overall, and than Māori children living in areas with fluoridated water supplies. West Coast children (both Māori and Non-Māori) have higher rates of hospitalisation for dental extractions than children nationally. Drug and alcohol hospitalisation rates are significantly higher for both Māori and Non- Māori on the West Coast than nationally. There are no differences between West Coast Māori and Non-Māori. Preventable disease and death (as represented by ambulatory sensitive hospitalisations and avoidable mortality) do not differ significantly between West Coast Māori and Non- Māori, however comparisons for these indicators are limited by small numbers. Māori are under-represented in enrolment and utilisation data for the West Coast PHO and its clinical programmes. 10
11 Summary West Coast Māori have a similar social profile to the West Coast Non-Māori population, unlike the Māori and Non-Māori populations nationally. However, a number of indicators from the 2006 Census suggest a higher level of need in some areas. In terms of health, West Coast Māori have poorer overall health status than West Coast Non-Māori, as demonstrated by a range of indicators, including cardiovascular disease, cancer, diabetes and respiratory disease indicators. In many instances, West Coast Māori mortality and morbidity rates are significantly lower than those for Māori nationally, however there are a few notable exceptions to this. Underlying the poorer health status for West Coast Māori are under-representation among primary care utilisation data, and higher rates of smoking, which is a key risk factor for a range of morbidities, including cancer, and cardiovascular and respiratory disease. In addition, discrepancies between hospitalisation and mortality rates for cardiovascular disease, and registration and mortality rates for cancer, point to these being important areas of unmet need for West Coast Māori. 11
12 1 Introduction 1.1 Health needs assessment Health needs assessment is a process of assessing the health and disability needs of a population, including those who do not access services. It is defined by Coster (2000) as: assessment of the population s capacity to benefit from health care services prioritised according to effectiveness, including cost-effectiveness, and funded within available resources. There are a number of approaches to health needs assessment. More comprehensive approaches usually involve, in the initial stages, description of the population and of its health and disability status. Subsequent stages include the assessment of the current health and disability service providers, including utilisation data, and the seeking of community and provider views on services. 1.2 Scope of this document This document is a health profile compiled to inform the subsequent stages of health needs assessment for Māori in the West Coast District Health Board. The document includes demographic and health and disability status data sourced from various routinely collected data sets. A small amount of service or provider information is presented, for example in relation to primary care, but this is not the focus of this document. 1.3 Data sources The data used in this document have been accessed from a range of sources, both from existing data sets and through special requests. The data sources include the following: Statistics New Zealand (Census data 2001 and 2006) New Zealand Health Information Service (hospitalisations, cancer registry, mortality, and mental health collections both special request and National Minimum Data Set reports sent routinely to the West Coast DHB) Injury Prevention Research Unit (morbidity and mortality data) Action on Smoking and Health (Year 10 smoking survey results) West Coast Primary Health Organisation (quarterly and annual report data) West Coast Plunket (annual report data) Environmental Science and Research (ESR) (sexual health clinic surveillance data and EPISURV notifiable disease surveillance data). 1.4 Statistical analysis Because of the small numbers of Māori in the West Coast DHB, it was necessary to aggregate data over several years. In general, data are presented either for Māori and Non-Māori or for Māori and all ethnicities, depending on the format in which the data were available from the data source. Hospitalisations, cancer registry and mortality data are presented as age-standardised rates, with the 2001 Census New Zealand Māori population used as the standard. Agespecific rates are also presented where appropriate, and 95% confidence intervals are 12
13 presented throughout. Due to important methodological differences, the rates presented are generally not comparable outside of this document. However, some broad comparisons may be made with the age standardised rates presented in the Māori Health Chart Book (Ministry of Health, 2006). The above, and other aspects of the statistical analysis, are discussed further in Appendix I. 1.5 Structure of this document Broadly, this document presents demographic and social data first, followed by health and disability data. Health and disability data are organised according to thirteen priority population health objectives identified in the New Zealand Health Strategy (Minister of Health, 2000) and the Māori health gain areas identified in He Korowai Oranga The Māori Health Strategy (Minister of Health and Associate Minister of Health, 2002). Later sections also cover avoidable morbidity and mortality, primary care, and self report of disease and risk and protective factors from the New Zealand Health Survey. In each section, key points are summarised in bullet form for quick reference. New Zealand Health Strategy, priority population health objectives reduce smoking improve nutrition reduce obesity increase the level of physical activity reduce the rate of suicides and suicide attempts minimise harm caused by alcohol and illicit and other drug use to both individuals and the community reduce the incidence and impact of cancer reduce the incidence and impact of cardiovascular disease reduce the incidence and impact of diabetes improve oral health reduce violence in interpersonal relationships, families, schools and communities improve the health status of people with severe mental illness ensure access to appropriate child health care services including well child and family health care and immunisation. He Korowai Oranga, Māori health-gain priority areas Immunisation Injury Prevention Hearing Asthma Smoking Diabetes Mental Health Oral Health Disability Support Services Rangatahi Health Sexual and Reproductive Health Alcohol and Drug Use 13
14 2 Demographic Profile Key points Māori made up 9.3% of the overall West Coast population at the 2006 Census. The highest proportion of Māori (12.1%) live in the Westland District. Like the national Māori population, the West Coast Māori population has a younger age structure than the Non-Māori population. Fewer Māori on the West Coast indicate that they speak Te Reo than nationally (12.4% versus 23.3%). Ngai Tahu, Ngapuhi and Ngati Porou remain the most common iwi affiliations for West Coast Māori. The proportion of West Coast births to Māori women ranged from 9.1% to 13.9% over the period 1996 to Similar proportions of West Coast Māori and Non-Māori women giving birth are from the most deprived deciles (deciles 8, 9, and 10). West Coast Māori fertility rates are higher than West Coast European rates, lower than the New Zealand Māori average, and peak at a younger age than West Coast European rates. 2.1 West Coast population The West Coast DHB total population was 31,326 at the 2006 Census, having increased from 30,303 at the 2001 Census. The Grey District had the largest population, with a total of 13,221 in 2006, followed by the Buller and Westland Districts, with 9,702 and 8,403 respectively. The populations of all three territorial local authorities have grown since the last Census, with the largest increase of 8% occurring in the Westland District, compared to 2.6% in the Grey District and 0.8% in the Buller District (Statistics New Zealand website, accessed March 2007). Table 2.1 presents ethnicity data for the West Coast and New Zealand in The West Coast population continues to have low proportions indicating Non-Māori, Non- European ethnicities although the high numbers in the other category in 2006 reflect the inclusion of New Zealander in that group. 14
15 Table 2.1 Number and proportion of people indicating each ethnic group West Coast and New Zealand, 2006* (Source: Statistics New Zealand) Ethnicity Area Buller Grey Westland West Coast New Zealand European 7,575 10,284 6,162 24,021 2,609, % 77.8% 73.3% 76.7% 64.8% Māori 804 1,098 1,014 2, , % 8.3% 12.1% 9.3% 14.0% Pacific , % 1.1% 0.8% 0.9% 6.6% Asian , % 1.1% 1.4% 1.1% 8.8% Other** 1,482 2,241 1,386 5, , % 17.0% 16.5% 16.3% 11.6% Total Number of People 9,702 13,221 8,403 31,326 4,027,947 * Note these are level 1 grouped responses. Hence Māori includes all people who stated Māori as an ethnic group, whether as their sole ethnic group or as one of several ethnic groups. The number of responses is divided by the total population to obtain the proportion of each population indicating a given ethnicity. Because one person can be counted in more than one category, totals will add to more than 100%. **Other includes New Zealander (and Middle Eastern, Latin American and African ethnicities). In 2006, the numbers of New Zealander responses were as follows: Buller 1,458; Grey 2,214; Westland 1, West Coast Māori Overall, 9.3% of the West Coast population indicated Māori ethnicity in the 2006 Census (Table 2.2). This compares to the national figure of 14.0% of the population indicating Māori ethnicity. The proportion of the population indicating Māori ethnicity has increased across all three territorial local authorities at the 2006 Census, and is highest, at 12.1%, in the Westland District, compared to 8.3% in both the Buller and Grey Districts. It is important to note both the potential for undercounting in Census data and the impact of any changes to the ethnicity question. For example, the introduction of the New Zealander option in 2006 may have affected the likelihood of individuals indicating other ethnicities. 15
16 Table 2.2 Number and proportion of Māori* in the West Coast DHB and Territorial Local Authorities, 2001 and 2006 (Source: Statistics New Zealand) 2001 Census 2006 Census Number of Māori Percentage of total population Number of Māori Percentage of total population Buller District % Total 9,624 Grey District % Total 12,891 Westland District % Total 7, % Total 9,702 1, % Total 13,221 1, % Total 8,403 Total West Coast DHB 2, % Total 30,303 2, % Total 31,326 Total New Zealand 526, % Total 3,737, , % Total 4,027,947 * Includes all people who stated Māori as an ethnic group, whether as their sole ethnic group or as one of several ethnic groups. Figures 2.1 to 2.4 illustrate the age distribution of the West Coast and New Zealand Māori and Non-Māori populations in 2001 and ethnicity data were not available by 5-year age groups at the time of writing. Both the New Zealand and West Coast Māori populations show a younger age distribution than the Non-Māori populations. This is due to a combination of higher fertility, a greater proportion of women of childbearing age, and lower life expectancy for the Māori population. Both the Māori and Non-Māori populations on the West Coast have a small proportion of people in the 20 to 40 year age groups, possibly reflecting net out-migration of people in these age groups. 16
17 Figure 2.1 West Coast 2001 population pyramid (Source: Statistics New Zealand) Age Group 85y y 75-79y 70-74y 65-69y 60-64y 55-59y 50-54y 45-49y 40-44y 35-39y 30-34y 25-29y 20-24y 15-19y 10-14y 5-9y 0-4y 1.30% 1.93% 3.04% 3.77% 4.34% 5.09% 5.96% 7.38% 7.57% 8.57% 8.16% 6.94% 5.28% 4.41% 5.42% 7.43% 7.55% 5.86% 0.24% 0.24% West Coast Maori 0.59% West Coast Non Maori 0.95% 1.77% 2.36% 2.84% 4.37% 4.61% 6.50% 7.92% 6.38% 6.15% 5.91% 8.75% 13.24% 14.89% 12.29% 15.00% 10.00% 5.00% 0.00% 5.00% 10.00% 15.00% Percentage Figure 2.2 New Zealand 2001 population pyramid (Source: Statistics New Zealand) Age Group 85y y 75-79y 70-74y 65-69y 60-64y 55-59y 50-54y 45-49y 40-44y 35-39y 30-34y 25-29y 20-24y 15-19y 10-14y 5-9y 0-4y 1.49% 1.87% 2.86% 3.53% 3.74% 4.45% 5.24% 6.75% 7.06% 7.87% 8.07% 7.47% 6.44% 6.16% 6.72% 7.10% 6.85% 6.33% 0.14% 0.23% Maori 0.51% Non Maori 0.96% 1.51% 2.19% 2.63% 3.70% 4.77% 6.24% 7.28% 7.46% 7.63% 8.00% 9.41% 11.93% 12.56% 12.84% 15.00% 10.00% 5.00% 0.00% 5.00% 10.00% 15.00% Percentage 17
18 Figure 2.3 West Coast 2006 population pyramid (Source: Statistics New Zealand) 80y % 0.41% West Coast Maori 70-79y 6.49% 1.75% West Coast Non Maori 60-69y 10.38% 4.42% Age Group 50-59y 40-49y 30-39y 17.20% 14.85% 13.54% 7.92% 13.27% 12.35% 20-29y 9.27% 12.04% 10-19y 0-9y 13.07% 11.47% 24.79% 23.05% 30.00% 20.00% 10.00% 0.00% 10.00% 20.00% 30.00% Percentage Figure 2.4 New Zealand 2006 population pyramid (Source: Statistics New Zealand) 80y % 0.47% Maori 70-79y 6.00% 1.82% Non Maori 60-69y 8.81% 4.06% Age Group 50-59y 40-49y 30-39y 12.81% 15.54% 14.44% 7.57% 12.24% 13.81% 20-29y 12.49% 14.31% 10-19y 0-9y 13.89% 12.37% 22.16% 23.56% 30.00% 20.00% 10.00% 0.00% 10.00% 20.00% 30.00% Percentage 18
19 In 2006, 12.4% (n=363) of West Coast Māori indicated that they spoke Te Reo. This compares to a national percentage of 23.3% (n= 131,610) in Ngai Tahu was the most common iwi affiliation indicated in the 2006 Census, followed by Ngapuhi and Ngati Porou (Table 2.3). Table 2.3 West Coast DHB Iwi, 2006 (Source: Statistics New Zealand*) Iwi** WCDHB New Zealand Ngai Tahu/ Kai Tahu 1,101 49,185 Ngapuhi ,214 Ngati Porou ,910 Ngati Tuwharetoa ,674 Ngati Maniapoto 81 33,627 Tuhoe 81 32,670 Kati Mamoe 72 2,877 Waikato 66 33,429 Ngati Kahungunu, region unspecified 63 18,459 Te Arawa 63 23,316 Ngati Kahungunu ki te Wairoa 60 20,982 Ngati Apa ki Te Ra To Ngaiterangi 51 12,201 * 2006 Census: Iwi (total responses) for the Māori descent Census usually resident population count ** Includes all Iwi for which there were 50 or more responses on the West Coast at the 2006 Census. 19
20 2.3 Births Ethnicity and NZDep In 2004, 79% of births to women usually resident on the West Coast occurred in West Coast hospitals and, of these, 7.7% of children born were identified as Māori. Nine per cent of women delivering babies at home identified as Māori (WCDHB Midwifery Review draft report, 2007). In 2004, 53% of births in West Coast DHB hospitals were to women usually resident in NZDep 8, 9, and 10 areas. Fifty-three per cent (10 out of 19) of Māori women giving birth lived in deciles 8-10, compared to 52% of NZ European women (Table 2.4). Home birth data on the West Coast are dominated by births to women at the decile 7 Gloriavale Christian Community, which limits comparison between home and hospital births with respect to socioeconomic status (WCDHB Midwifery Review draft report, 2007). Table 2.5 shows total births by ethnicity for the period The proportion of births to Māori women ranges from 9.1% in 1996 to 13.9% in The most recent figure is 11.7% in Table 2.4 West Coast hospital births by NZDep area of mother s usual residence, 2004 (Source: WCDHB Midwifery Review draft report, 2007) Ethnicity Number of Births Number living in NZDep 8,9,10 areas % living in NZDep 8,9,10 areas NZ European % Māori % Other % Total % 20
21 Table 2.5 Total births by maternal ethnicity, West Coast (Source: West Coast DHB 2007, Fertility Rates draft document) Year Ethnicity European Māori Other Pacific Total Table 2.5 uses information from the birth registration dataset and is based on the usual area of residence of women at the time of delivery, rather than the region in which they gave birth. This ensures any births to West Coast resident women that occur in other centres are captured. When looking at the numbers of deliveries it is important to consider both the total numbers in each ethnic group and the age structure of each group. As the population pyramids in section 2.2 demonstrate, the West Coast Māori population is younger than the Non-Māori population, with a greater proportion of women of reproductive age. Fertility Figure 2.5 presents the fertility rates by ethnicity for 15- to 44-year old women on the West Coast and in New Zealand in Fertility rates for Māori women were higher than for Non-Māori women in the West Coast in While rates for West Coast European women were similar to the New Zealand average, rates for Māori were lower than the New Zealand Māori average. Note that these rates are not age standardised and they therefore do not take into account any differences in the distribution of women within the 15 to 44 year age group (West Coast DHB 2007, Fertility Rates draft document). Figure 2.6 compares the age-group-specific fertility rates for West Coast Māori and European women during For Māori, fertility peaked at live births per 1,000 women in the year age group, compared to the peak of live births per 1,000 women for European women, which occurs in the 25- to 29-year age group (West Coast DHB 2007, Fertility Rates draft document). 21
22 Figure 2.5 Fertility rates by ethnicity, West Coast vs New Zealand, 2002 (Source: West Coast DHB 2007, Fertility Rates draft document) Live Births per 1000 women years West Coast NZ Maori European Total * Numerator birth registration data New Zealand Health Information Service; denominator Statistics New Zealand Figure 2.6 Fertility rates by ethnicity and age for West Coast women, (Source: West Coast DHB 2007, Fertility Rates draft document) Live Births per 1000 women per year West Coast Maori West Coast European to to to to to to to to 49 Maternal Age *Numerator birth registration data New Zealand Health Information Service; denominator Statistics New Zealand 22
23 Teenage births Teenage pregnancy rates are made up of three components: births, terminations and miscarriages. Information on births is available from the birth registration dataset held by the New Zealand Health Information Service; information on terminations of pregnancy is held by the Abortion Supervisory Committee; and rates of spontaneous miscarriage are estimated (as being 10% of induced abortions and 20% of live births). Total numbers of teenage births on the West Coast are presented below in Table 2.6. These numbers suggest that the number of teenage births is dropping, but as crude numbers they are not adjusted for any changes in the age and ethnicity distribution of the West Coast population over this time period. Abortion Supervisory Committee data for the West Coast were not available. Table 2.6 Total number of teenage births to women in West Coast region, (Source: West Coast DHB 2007, Fertility Rates draft document) Year Births Figure 2.7 compares teenage birth rates for West Coast women with national averages. Small numbers make comparison of West Coast Māori teenage birth rates with national rates unreliable. West Coast European teenage birth rates are higher than the national European average. 23
24 Figure 2.7 Teenage birth rates by ethnicity, West Coast vs New Zealand, (Source: West Coast DHB 2007, Fertility Rates draft document) Teenage Birth Rate per 1000 Women years NZ Maori West Coast Maori West Coast European NZ European Year of Birth *Numerator birth registration data New Zealand Health Information Service; denominator Statistics New Zealand 24
25 3 Social Indicators Key points The West Coast population is relatively deprived overall when compared to the total New Zealand population. West Coast Māori have a similar deprivation profile to West Coast all ethnicities. This is in contrast to the national picture where Māori have a more deprived profile than all ethnicities. West Coast Māori, when compared to the total West Coast population: have lower incomes and fewer tertiary qualifications are less likely to have access to a car or telephone, or to own their own home are less likely to be employers or to be self employed are more likely to be unemployed have a greater proportion of the population aged 15 and above in the labour force. Deprivation The New Zealand Deprivation Index The New Zealand Deprivation Index (NZDep) is a measure used to describe the deprivation experienced by groups of people (Salmond and Crampton, 2002). NZDep is created from Census data, with the most recent NZDep data available being that based on the 2006 Census. Nine different Census indicators are used to calculate the index. These represent eight deprivation factors: income, employment, communication, transport, social support, education, living space and home ownership. A weighted sum of these variables is calculated for the whole of New Zealand and the deprivation of different populations (for example, ethnic groups and geographical populations) can then be compared to national figures. NZDep data from 2006 (Figures 3.1 to 3.4) indicate that the West Coast population is relatively deprived overall, with a high proportion in the four most deprived deciles. West Coast Māori have a similar deprivation profile to all ethnicities on the West Coast, whereas nationally Māori have a more deprived profile than all ethnicities. Table 3.1 considers the NZDep components using 2006 Census data. These data indicate that West Coast Māori have lower incomes and fewer tertiary qualifications than the overall West Coast population. In addition, West Coast Māori are less likely than the overall West Coast population to have access to a telephone or a car, or to own their own home. When compared to the New Zealand Māori population, the West Coast Māori population has lower income, fewer tertiary qualifications and lower levels of home ownership. 25
26 Figure 3.1 Deprivation profile for West Coast Māori, % 22.4% 20% Percentage 15% 10% 14.4% 12.1% 8.8% 9.0% 15.8% 6.8% 5% 2.1% 4.9% 3.8% 0% NZDep decile Figure 3.2 Deprivation profile for West Coast all ethnicities*, % 21.1% Percentage 20% 15% 10% 5% 2.6% 6.5% 16.3% 14.3% 9.7% 10.2% 3.5% 10.9% 4.8% 0% NZDep decile Figure 3.3 Deprivation profile for New Zealand Māori, % 25% 24.2% Percentage 20% 15% 10% 5% 3.4% 4.4% 5.2% 5.9% 7.1% 13.0% 8.9% 10.4% 17.5% 0% NZ Dep decile Figure 3.4 Deprivation profile for New Zealand all ethnicities*, % 25% Percentage 20% 15% 10% 10.3% 10.2% 10.2% 10.0% 9.9% 9.9% 9.9% 9.8% 10.0% 9.8% 5% 0% NZ Dep decile *Note: All ethnicities here is based on level 1 grouped responses, hence an individual is counted once for each ethnicity that they have indicated. 26
27 Table Census: Income, education, access to telephone, access to car, and home ownership by ethnicity (Source: Statistics New Zealand, 2006 Census data) Characteristic WCDHB Māori WCDHB All ethnicities NZ Māori NZ All ethnicities Income more than $50,000* Income less than $20,000* Degree or higher qualification* No qualification* No access to telephone** *** No access to a car** Home not owned by residents** 4.6% 9.1% 5.9% 12.7% 29.3% 35.2% 27.7% 30.4% 1.9% 5.3% 4.1% 11.1% 23.4% 25.5% 23.0% 17.6% 20.7% 12.1% 23.3% 10.9% 8.0% 4.6% 8.2% 4.7% 39.5% 23.9% 49.0% 29.9% * For population aged 15 years and over. Total people (i.e., all ages) is used as the denominator hence percentages are of the total population. ** Note that this is a dwelling characteristic rather than an individual characteristic. The dwelling characteristic is cross tabulated against the personal characteristics. This data excludes those who were absent from the dwelling on census night i.e. is different from usually resident population. *** Includes no and not stated responses. 3.1 Employment and work status Data from the 2006 Census (Table 3.2) indicate that West Coast Māori are less likely to be employers or to be self employed than the total West Coast population. A similar picture is seen for Māori nationally. Māori have higher rates of unemployment both on the West Coast and nationally (Table 3.3). However, the proportion of population aged 15 years and over in the labour force is greater for Māori both on the West Coast and nationally, which may reflect the younger age profile of the Māori population. 27
28 Table 3.2 Status in employment West Coast DHB and New Zealand, 2006 (Source: Statistics New Zealand, 2006 Census data*) WCDHB Māori (% of total) WCDHB All ethnicities (% of total) NZ Māori (% of total) NZ All ethnicities (% of total) Paid employee , ,483 1,511,250 (80.0%) (72.8%) (84.1%) (76.1%) Employer 45 1,347 7, ,881 (3.7%) (8.3%) (3.1%) (7.2%) Self-employed, no employees 90 (7.4%) 1,839 (11.3%) 14,007 (6.2%) 234,954 (11.8%) Unpaid family worker 30 (2.5%) 459 (2.8%) 4,008 (1.8%) 39,567 (2.0%) Total stated 1,143 15, ,560 1,928,652 Not elsewhere included 75 (6.1%) 765 (4.7%) 10,797 (4.8%) 57,126 (2.9%) Total 1,221 16, ,357 1,985,775 * Usually resident population 15 years and over. 28
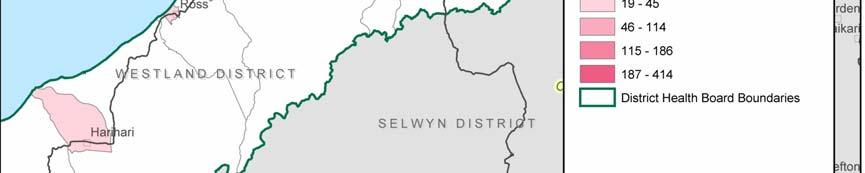
29 Table 3.3 Work status West Coast DHB and New Zealand, 2006 (Source: Statistics New Zealand, 2006 Census data*) WCDHB Māori (% of total) WCDHB All ethnicities (% of total) NZ Māori (% of total) NZ All ethnicities (% of total) Employed fulltime 906 (49.8%) 12,282 (49.3%) 175,545 (48.0%) 1,531,017 (48.4%) Employed parttime 312 (17.1%) 3,957 (15.9%) 49,812 (13.6%) 454,758 (14.4%) Unemployed , ,497 (5.1%) (2.2%) (7.6%) (3.4%) In labour force 1,311 16, ,233 2,092,275 (72.0%) (67.4 %) (69.3%) (66.2%) Not in labour force 510 (28.0%) 7,398 (29.7%) 112,176 (30.7%) 961,788 (30.4%) Total 1,821 24, ,406 3,160,374 * Usually resident population 15 years and over. 3.2 Rurality Rurality and ease of access to services are important issues for all West Coast residents, as illustrated in Figure 3.1. Rurality data are not available by ethnicity, however Figures 3.6 and 3.7 represent the distribution of Māori in the Buller, Grey and Westland Districts at the 2001 Census. These maps indicate that the largest numbers of West Coast Māori resided in 2001 in Hokitika, Cobden, Blaketown and Westport. 29
 to service")
30 Figure 3.5 Distance to health services 10 km distance bands (along roads) to service providers (Source: Public Health Intelligence, Ministry of Health) 30


31 Figure 3.6 Māori population counts Buller and Grey Districts, 2001 (Source: Community and Public Health) 31


32 Figure 3.7 Māori population counts Westland District, 2001 (Source: Community and Public Health) 32
33 4 All-Cause Mortality Key point All-cause mortality is significantly higher for Māori than Non-Māori both on the West Coast and nationally. Table 4.1 presents age standardised all-cause mortality rates per 100,000 for the New Zealand and West Coast populations. All-cause mortality is higher for Māori both on the West Coast and in New Zealand as a whole. Table 4.1 Indicator All-cause mortality (Source: New Zealand Health Information Service) West Coast New Zealand Māori Non-Māori Māori Non-Māori All ages allcause mortality, , mean annual rate per 100,000* ( ) ( ) ( ) ( ) * Age standardised to 2001 Census New Zealand Māori population. 33
34 5 Communicable Disease Key points Māori are under-represented among communicable disease notifications on the West Coast. This may be explained by any combination of: the different age structure of the Māori population, a lower incidence of disease among Māori, undercounting of Māori among disease notifications, and lower rates of presentation to health services for Māori. Early National Immunisation Register (NIR) data indicate lower coverage for Māori than Non-Māori children on the West Coast at the 6-week timepoint, although small numbers for Māori necessitate caution when comparing these figures. 5.1 Notifiable communicable disease Table 5.1 presents crude aggregate data for communicable disease notifications over the seven-year period These data indicate that Māori are under-represented in giardiasis, pertussis and campylobacter notifications, in that they make up a smaller proportion of notified cases of these diseases than they do of the population. This crude comparison does not take into account the different age structures of the Māori and Non-Māori populations. The lower-than-expected rates of notifications among Māori may be explained by any combination of: the different age structure of the Māori population, a lower incidence of disease among Māori, under-counting of Māori among notifications (for example, ethnicity incorrectly classified as Non-Māori) and lower rates of presentation for Māori (for example, Māori may be less likely to present to General Practitioners and be notified as a case). It is not possible to identify which of these possible explanations is correct. 34
35 Table 5.1 WCDHB Communicable Disease Notifications, 1 st January st December 2006 (Source: ESR, Episurv database) Disease European Cases (% of total cases) West Coast DHB Māori Cases (% of total cases) Total Cases* Campylobacter 513 (91.8%) 19 (3.4%) 559 Cryptosporidiosis 83 (94.3%) 88 Gastroenteritis 20 (87.0%) 23 Gastroenteritis -foodborne 5 (100%) 5 Giardiasis 81 (82.7%) 7 (7.1%) 98 Hepatitis A 1 Hepatitis B 2 Hepatitis C 8 (72.7%) 11 Legionellosis 5 Leptospirosis 18 (100%) 18 Malaria 2 Measles 20 (95.2%) 21 Meningococcal disease 14 (87.5%) 16 Mumps 3 Pertussis** 323 (85.2%) 26 (6.9%) 379 Rubella 8 (100%) 8 Salmonellosis 61 (89.7%) 68 Shigellosis 2 Tuberculosis disease new case 7 Tuberculosis disease on prevention 1 VTEC/STEC Infection 2 Yersiniosis 80 (94.1%) 85 Indicates cell count of 0, 1 2, 3 or 4. *Note Total cases also includes Non-European Non-Māori ethnicities. ** Note that the majority of pertussis notifications were made during a 1-year period. 35
36 5.2 Immunisation coverage Table 5.2 presents data from the National Immunisation Register, which was established in These data indicate lower rates of immunisation for West Coast Māori children than for West Coast children as a whole at the 6-week timepoint. Table 5.2 Regular childhood immunisation coverage, West Coast 2007 (Source: National Immunisation Register) Immunisation Event Number eligible WC Māori % vaccinated Number eligible WC Total % vaccinated 6 Week 39 49% % 12 Months 36 78% % 18 Months 28 68% % 36
37 6 Cardiovascular Disease Key points Cardiovascular disease hospitalisation rates are no different for Māori and Non- Māori on the West Coast, which contrasts with the national picture. Cardiovascular mortality rates are significantly higher for Māori than Non-Māori both on the West Coast and nationally. Both stroke mortality and hospitalisation rates are higher for Māori than Non- Māori on the West Coast and nationally. In contrast, West Coast Māori have lower rates of hospitalisation for ischaemic heart disease than Non-Māori. This suggests an important area of unmet need for West Coast Māori. Overall, West Coast Māori carry a greater burden of cardiovascular disease morbidity and mortality than Non-Māori. 6.1 Cardiovascular disease hospitalisations and mortality Table 6.1 presents cardiovascular disease morbidity and mortality data for the West Coast and all of New Zealand. Cardiovascular mortality is significantly higher for Māori both on the West Coast and nationally. Cardiovascular disease hospitalisation rates are no different for Māori and Non-Māori on the West Coast, in contrast to the national picture, in which Māori hospitalisation rates are higher. The stroke mortality rate for West Coast Māori is more than twice that for Non-Māori, and is higher than for Māori nationally. West Coast hospitalisation rates for stroke are higher than national rates, overall, and West Coast Māori rates are significantly higher than Non-Māori rates. These data indicate a greater burden of cardiovascular disease on the West Coast overall, and that this is carried disproportionately by Māori. This higher need appears not to be reflected in hospitalisation rates for West Coast Māori. Table 6.2 presents ischaemic heart disease indicators for the West Coast and all of New Zealand. Ischaemic heart disease is a subset of total cardiovascular disease, and so has smaller numbers and wider 95% confidence intervals. There is no significant difference between West Coast Māori and Non-Māori ischaemic heart disease mortality rates. Hospitalisation rates are, however, lower for Māori than for Non-Māori on the West Coast, and this is in contrast to the national data where Māori have significantly higher rates of hospitalisation for ischaemic heart disease. This appears to represent an area of unmet need for West Coast Māori. 37
38 Table 6.1 Indicator Cardiovascular disease indicators (Source: New Zealand Health Information Service) West Coast New Zealand Māori Non-Māori Māori Non-Māori Total cardiovascular disease mortality, 35+ years, , mean annual rate per 100,000* ( ) ( ) ( ) ( ) Total cardiovascular disease hospitalisation, 35+ years, , mean annual rate per 100,000* 2,689.8 (2, ,067.5) 2,764.2 (2, ,838.6) 3,576.7 (3, ,606.3) 2,100.5 (2, ,106.7) Stroke mortality, 35+ years, , mean annual rate per 100,000* ( ) 47.7 ( ) 80.6 ( ) 46.1 ( ) Stroke hospitalisations, 35+ years, , mean annual rate per 100,000* ( ) ( ) ( ) ( ) * Age standardised to 2001 Census New Zealand Māori population. Table 6.2 Indicator Ischaemic heart disease indicators (Source: New Zealand Health Information Service) West Coast New Zealand Māori Non-Māori Māori Non-Māori Ischaemic heart disease mortality, 35+ years, , mean annual rate per 100,000* ( ) ( ) ( ) ( ) Ischaemic heart disease hospitalisations, 35+ years, , mean annual rate per 100,000* ( ) 1,096.7 (1, ,143.6) 1,145.6 (1, ,162.3) ( ) * Age standardised to 2001 Census New Zealand Māori population. 38
Health Needs Assessment
 Health Needs Assessment District Health Board For the Ministry of Health Contact Person: Associate Professor Barry Borman Centre for Public Health Research Massey University, Wellington Campus PO Box 76,
The Health of Pacific Peoples
 The Health of Pacific Peoples i Citation: Ministry of Health. 2005.. Wellington: Ministry of Health. Published in April 2005 by the Ministry of Health PO Box 5013, Wellington, New Zealand ISBN 0-478-28327-X
Otago Māori Health Profile
 Māori Health Profile 2011 Table of Contents 1 Executive Summary... 2 Section 1 Population Health... 7 2 Introduction... 7 3 Demographic Profile... 9 4 Socioeconomic Determinants of Health... 15 5 Risk
Southland Māori Health Profile 2011
 Health Profile 2011 Table of Contents 1 Executive Summary... 3 Section 1 Population Health... 9 2 Introduction... 9 3 Demographic Profile... 11 4 Socioeconomic Determinants of Health... 17 5 Risk and Protective
AMBULATORY SENSITIVE HOSPITALISATIONS
 AMBULATORY SENSITIVE HOSPITALISATIONS Introduction Ambulatory sensitive hospitalisations (ASH) are often used as a measure for assessing the performance of primary health care [97]. From 2007, the Ministry
The authors of this report were Leonie McCormack, Li-Chia Yeh, Beverley Braybrook and Laila Clyne from the Ministry of Health.
 Tupu Ola Moui Pacific Health Chart Book 212 Acknowledgements The authors of this report were Leonie McCormack, Li-Chia Yeh, Beverley Braybrook and Laila Clyne from the Ministry of Health. The authors would
Tatau Kahukura. Mäori Health Chart Book. Public Health Intelligence Monitoring Report No.5
 Tatau Kahukura Mäori Health Chart Book 2006 Public Health Intelligence Monitoring Report No.5 The title of this publication, Tatau Kahukura, refers to valuable, high-quality information that has been woven
Māori Health Profile 2015
 BAY OF PLENTY DISTRICT HEALTH BOARD TE HAUORA A TOI Māori Health Profile 2015 Te taupori Population In 2013, 53,700 Māori lived in the Bay of Plenty District Health Board region, 25% of the District s
Māori Health Profile 2015
 WHANGANUI DISTRICT HEALTH BOARD TE POARI HAUORA O WHANGANUI Māori Health Profile 2015 Te taupori Population In 2013, 15,850 Māori lived in the Whanganui District Health Board (DHB) region, 25% of the District
Māori Health Profile 2015
 SOUTHERN DISTRICT HEALTH BOARD TE POARI HAUORA Ā-ROHE O ŌTĀKOU-MURIHIKU Māori Health Profile 2015 Te taupori Population In 2013, 29,200 Māori lived in the Southern District Health Board region, 10% of
Māori Health Profile 2015
 HUTT VALLEY DISTRICT HEALTH BOARD TE POARI HAUORA O TE AWAKAIRANGI Māori Health Profile 2015 Te taupori Population In 2013, 23,800 Māori lived in the Hutt District Health Board region, 17% of the District
MidCentral District Health Board Rheumatic Fever Prevention Plan. October 2013
 MidCentral District Health Board Rheumatic Fever Prevention Plan October 2013 Contents Section 1: Introduction... 3 1.1 Executive summary... 3 1.2 Purpose... 5 Section 2: Overview of acute rheumatic fever
Universal Newborn Hearing Screening and Early Intervention Programme (UNHSEIP) Monitoring Report
 Monitoring Report") Universal ewborn Hearing Screening and Early Intervention Programme (UHSEIP) Monitoring Report January to December 2015 Released 2016 health.govt.nz Copyright The copyright owner of this publication is
Universal ewborn Hearing Screening and Early Intervention Programme (UHSEIP) Monitoring Report January to December 2015 Released 2016 health.govt.nz Copyright The copyright owner of this publication is
Suicide Facts. Deaths and intentional self-harm hospitalisations
 Suicide Facts Deaths and intentional self-harm hospitalisations 2012 Citation: Ministry of Health. 2015. Suicide Facts: Deaths and intentional self-harm hospitalisations 2012. Wellington: Ministry of Health.
PERTUSSIS REPORT. November 2013
 PERTUSSIS REPORT Data contained within this monthly report is based on information recorded on EpiSurv by public health service staff as at 12 December 213. Changes made to EpiSurv data after this date
MONTHLY NOTIFIABLE DISEASE SURVEILLANCE REPORT
 ISSN 2324-254X April 2018 MONTHLY NOTIFIABLE DISEASE SURVEILLANCE REPORT Data contained within this monthly report is based on information recorded on EpiSurv by Public Health Service (PHS) staff at 11
Alcohol use in advanced age: Findings from LiLACS NZ
 Alcohol use in advanced age: Findings from LiLACS NZ Te Puāwaitanga O Ngā Tapuwae Kia Ora Tonu This report presents key findings about alcohol use in advanced age including patterns of use and the relationship
The impact of respiratory disease in New Zealand: 2018 update
 The impact of respiratory disease in New Zealand: 2018 update Dr Lucy Telfar Barnard Jane Zhang This report was prepared for the Asthma and Respiratory Foundation NZ Contents 1. List of Figures... 5 2.
MONTHLY NOTIFIABLE DISEASE SURVEILLANCE REPORT
 ISSN 2324-254X January 2016 MONTHLY NOTIFIABLE DISEASE SURVEILLANCE REPORT Data contained within this monthly report is based on information recorded on EpiSurv by Public Health Service (PHS) staff as
Infectious Disease Surveillance in NZ. Michael Baker Department of Public Health, University of Otago, Wellington
 Infectious Disease Surveillance in NZ Michael Baker Department of Public Health, University of Otago, Wellington michael.baker@otago.ac.nz Outline Current best practice High quality surveillance of specific
BSA New Zealand Hawkes Bay District Health Board Coverage Report
 BSA New Zealand Hawkes Bay District Health Board Coverage Report For the period ending 31 December 2016 Citation: Ministry of Health. February 2017. BSA New Zealand District Health Board Coverage Report:
Population health profile of the. Mornington Peninsula. Division of General Practice: supplement
 Population health profile of the Peninsula Division of General Practice: supplement Population Profile Series: No. 5a PHIDU March 007 Copyright Commonwealth of Australia 007 This work may be reproduced
MONTHLY NOTIFIABLE DISEASE SURVEILLANCE REPORT
 ISSN 2324-254X October 2016 MONTHLY NOTIFIABLE DISEASE SURVEILLANCE REPORT Data contained within this monthly report is based on information recorded on EpiSurv by Public Health Service (PHS) staff at
Brant County Community Health Status Report: 2001 OVERVIEW
 Brant County Community Health Status Report: 2001 OVERVIEW Brantford County of Brant Brant County Health Unit and Grand River District Health Council April 2001 Brant County Community Health Status Report:
Population health profile of the. Western Melbourne. Division of General Practice: supplement
 Population health profile of the Melbourne Division of General Practice: supplement Population Profile Series: No. 43a PHIDU December 006 Copyright Commonwealth of Australia 006 This work may be reproduced
Cancer in the South Island of New Zealand Health Needs Assessment
 Cancer in the South Island of New Zealand Health Needs Assessment - 21 Southern Cancer Network July 21 Prepared by: Tony Macdonald, Claire Worsfold, Robert Weir Disclaimer Information within the report
2018 Community Health Assessment
 2018 Community Health Assessment Community Health Status Assessment Linn County, IA Prepared by Amy Hockett, PhD, MPH, CHES Epidemiologist Linn County Public Health August 9, 2018 Community Health Status
Māori Health Profile 2015
 Whanganui District Health Board Health Profile 2015 By Te Rōpū Rangahau Hauora a Eru Pōmare, University of Otago, Wellington For the Ministry of Health Whanganui DHB Māor Te Rei Puta The cover design represents
Māori Health Profile 2015
 Southern District Health Board Health Profile 2015 By Te Rōpū Rangahau Hauora a Eru Pōmare, University of Otago, Wellington For the Ministry of Health Southern DHB Health Profile 2015 (Draft - not for
Chapter 6: Combined Cardiovascular Risk Factors
 Chapter 6: Combined Cardiovascular Risk Factors Key points Cardiovascular diseases such as coronary heart disease and stroke cause 44% of all deaths in New Zealand. The 1996/97 Health Survey provides information
Section 3: Health and Independence Report 2013
 Section 3: Health and Independence Report 2013 Purpose of this report The Health and Independence Report (the Report) gives an overview of the current state of public health in New Zealand. It has three
Population health profile of the. Adelaide Central and Eastern. Division of General Practice: supplement
 Population health profile of the Adelaide Central and Eastern Division of General Practice: supplement Population Profile Series: No. 89a PHIDU March 2007 Copyright Commonwealth of 2007 This work may be
Hazardous drinking in 2011/12: Findings from the New Zealand Health Survey
 Hazardous drinking in 11/12: Findings from the New Zealand Health Survey This report presents key findings about alcohol use and hazardous drinking among adults aged 15 years and over, which come from
Appendix B System Level Measures Improvement Plans
 Appendix B System Level Improvement Plans This plan has been endorsed by: Donovan Clarke Chief Executive Manaia Health PHO Jensen Webber Chief Executive Te Tai Tokerau PHO Dr Nick Chamberlain Chief Executive
Māori Health Profile 2015
 Waikato District Health Board Health Profile 2015 By Te Rōpū Rangahau Hauora a Eru Pōmare, University of Otago, Wellington For the Ministry of Health Waikato DHB Health Profile 2015 (Draft - not for circulation)
THE NEW ZEALAND MEDICAL JOURNAL
 THE NEW ZEALAND MEDICAL JOURNAL Journal of the New Zealand Medical Association Sociodemographic characteristics of New Zealand adult smokers, ex-smokers, and non-smokers: results from the 2006 Census Sharon
MONTHLY NOTIFIABLE DISEASE SURVEILLANCE REPORT
 ISSN 2324-254X November 2017 MONTHLY NOTIFIABLE DISEASE SURVEILLANCE REPORT Data contained within this monthly report is based on information recorded on EpiSurv by Public Health Service (PHS) staff at
National Cancer Programme. Work Plan 2015/16
 National Cancer Programme Work Plan 2015/16 Citation: Ministry of Health. 2015. National Cancer Programme: Work plan 2015/16. Wellington: Ministry of Health. Published in October 2015 by the Ministry of
Chapter 7: Diabetes. Diabetes mellitus is a major and increasing health problem in New Zealand.
 Key points Chapter 7: mellitus is a major and increasing health problem in New Zealand. Around 1 in 27 adults (3.7%) in the 1996/97 Health Survey reported that they had been diagnosed with diabetes. Mäori
MONTHLY NOTIFIABLE DISEASE SURVEILLANCE REPORT
 ISSN 2324-254X May 2016 MONTHLY NOTIFIABLE DISEASE SURVEILLANCE REPORT Data contained within this monthly report is based on information recorded on EpiSurv by Public Health Service (PHS) staff as at 20
Hull s Joint Strategic Needs Assessment: Analysis of Public Health Outcomes Framework Data Children and Young People
 s Joint Strategic Needs Assessment: Analysis of Public Health Outcomes Framework Data Children and Young People A summary of the data for each of the Public Health Outcomes Framework (PHOF) indicators
APPENDIX: NATIONAL SURVEILLANCE DATA AND TRENDS
 2008 Annual Surveillance Report Notifiable and Other s in New Zealand 49 APPENDIX: NATIONAL SURVEILLANCE DATA AND TRENDS COMPARISON OF NOTIFIABLE DISEASE CASES AND RATES FOR 2007 AND 2008 Table 37. Number
Unequal Impact: Māori and Non-Māori Cancer Statistics
 Unequal Impact: Māori and Non-Māori Cancer Statistics 1996 2001 Te Rōpū Rangahau Hauora a Eru Pōmare Wellington School of Medical and Health Sciences Wellington Suggested citation: Robson B, Purdie G,
The Epidemiology of Pertussis and Timeliness of Pertussis Immunisation in New Zealand
 The Epidemiology of Pertussis and Timeliness of Pertussis Immunisation in New Zealand A thesis submitted in fulfilment of the requirements for the degree of Master of Public Health Georgia Deane University
Mātātuhi Arahi Service Plan for Māori. Cancer Society New Zealand Wellington Division
 Mātātuhi Arahi Service Plan for Māori Cancer Society New Zealand Wellington Division July 2009 Contents Mihi...3 Acknowledgements...4 1. Background...5 2. Kōkiri Marae Seaview and the Wellington Division
PERTUSSIS. Introduction
 PERTUSSIS Introduction Pertussis (whooping cough) is a highly contagious acute respiratory tract infection caused by the bacterium Bordetella pertussis. It is spread by aerosol droplets. Neither vaccination
WOMEN IN THE CITY OF BRIMBANK
 WOMEN IN THE CITY OF BRIMBANK WHY WOMEN S HEALTH MATTERS Women comprise approximately half the population in Brimbank and have different health and wellbeing needs from men. It would appear that women
Population health profile of the. North West Melbourne. Division of General Practice: supplement
 Population health profile of the Melbourne Division of General Practice: supplement Population Profile Series: No. 44a PHIDU March 2007 Copyright Commonwealth of Australia 2007 This work may be reproduced
Māori Health Profile 2015
 Lakes District Health Board Health Profile 2015 By Te Rōpū Rangahau Hauora a Eru Pōmare, University of Otago, Wellington For the Ministry of Health Lakes DHB Health Profile 2015 (Draft - not for circulation)
Hawke s Bay District Health Board. Tobacco Control Plan
 Hawke s Bay District Health Board Tobacco Control Plan 2015-2018 Introduction In 2010 the New Zealand government set an ambitious target of achieving smoking prevalence of less than 5% by 2025. There has
TARGETS To reduce the age-standardised mortality rate from cervical cancer in all New Zealand women to 3.5 per or less by the year 2005.
 Cervical Cancer Key points Annually, around 85 women die from, and 230 women are registered with, cervical cancer. The decline in both incidence and mortality rates for cervical cancer has accelerated
Neighbourhood HEALTH PROFILE A PEEL HEALTH STATUS REPORT BRAMPTON. S. Fennell, Brampton Mayor
 Neighbourhood HEALTH PROFILE 2005 A PEEL HEALTH STATUS REPORT BRAMPTON S. Fennell, Mayor This report provides an overview of the health status of residents of, including: Socio-demographic facts Reported
The impact of respiratory disease in New Zealand: 2014 update RAL I A T A F O U N D AT I SENS ITIVE CHOICE
 The impact of respiratory disease in New Zealand: 2014 update IL ST AL MA COUNC RAL I A NATION TH AU AS T M (N Z) AS H A F ON O U N D AT I SENS ITIVE CHOICE This report was prepared for the The Asthma
Invasive Pneumococcal Disease Quarterly Report
 Invasive Pneumococcal Disease Quarterly Report April June 2018 Prepared as part of a Ministry of Health contract for scientific services by Liza Lopez Helen Heffernan July 2018 Acknowledgements This report
Measles Elimination in NZ. Dr Tom Kiedrzynski Principal Adviser, Communicable diseases, Ministry of Health
 Measles Elimination in NZ Dr Tom Kiedrzynski Principal Adviser, Communicable diseases, Ministry of Health Presentation Outline International background WHO requirements Overview of the measles situation
Urban Rural Health Comparisons Key results of the 2002/03 New Zealand Health Survey
 Urban Health Comparisons Key results of the 22/3 New Zealand Health Survey Public Health Intelligence Occasional Bulletin No. 41 Citation: Ministry of Health. 27. Urban Health Comparisons: Key results
WOMEN IN THE CITY OF MARIBYRNONG
 WOMEN IN THE CITY OF MARIBYRNONG WHY WOMEN S HEALTH MATTERS Women comprise approximately half the population in Maribyrnong and have different health and wellbeing needs from men. It would appear that
3. Queensland Closing the Health Gap Accountability Framework. COAG national targets and indicators
 3. Queensland Closing the Health Gap Accountability Framework The accountability framework articulated in this section is designed to measure progress against the health targets and indicators included
Revitalising the National HPV Immunisation Programme. with agreed outcomes from the August 2014 workshop
 Revitalising the National HPV Immunisation Programme with agreed outcomes from the August 2014 workshop Citation: Ministry of Health. 2015. Revitalising the National HPV Immunisation Programme with Agreed
WOMEN IN THE CITY OF WYNDHAM
 WOMEN IN THE CITY OF WYNDHAM WHY WOMEN S HEALTH MATTERS Women comprise approximately half the population in Wyndham and have different health and wellbeing needs from men. It would appear that women and
Infectious Diseases At A Glance in Durham Region
 Infectious Diseases At A Glance in Durham Region Last Updated: November 2017 Highlights The rates of all reported infectious diseases combined are highest among youth and young adults aged 15 to 29 and
Laboratory Surveillance of Chlamydia and Gonorrhoea in New Zealand. October to December 2010
 ISSN 1176-7316 Laboratory Surveillance of Chlamydia and Gonorrhoea in New Zealand October to December 2010 Prepared as part of a Ministry of Health contract for scientific services by Health Intelligence
TABLE OF CONTENTS TABLE OF FIGURES... 7 FOREWARD EXECUTIVE SUMMARY CHAPTER 1: DEMOGRAPHIC PROFILE Population structure...
 Page 1 of 264 TABLE OF CONTENTS TABLE OF FIGURES... 7 FOREWARD... 28 EXECUTIVE SUMMARY... 29 CHAPTER 1: DEMOGRAPHIC PROFILE... 31 1.1 Population structure... 31 1.2 Population projections by local authority
The Health of Children and Young People with Chronic Conditions and Disabilities in the Hutt Valley and Capital & Coast DHBs
 The Health of Children and Young People with Chronic Conditions and Disabilities in the Hutt Valley and Capital & Coast DHBs This Report was prepared for the Hutt Valley and Capital & Coast DHBs by Elizabeth
Population health profile of the. Sunshine Coast. Division of General Practice: supplement
 Population health profile of the Sunshine Coast Division of General Practice: supplement Population Profile Series: No. 83a PHIDU March 2007 Copyright Commonwealth of 2007 This work may be reproduced and
An APA Report: Executive Summary of The Behavioral Health Care Needs of Rural Women
 1 Executive Summary Of The Behavioral Health Care Needs of Rural Women The Report Of The Rural Women s Work Group and the Committee on Rural Health Of the American Psychological Association Full Report
Te Ohonga Ake The Health Status of Māori Children and Young People in New Zealand Series Two
 1 2 iii IN NEW ZEALAND Te Ohonga Ake The Health Status of Māori Children and Young People in New Zealand Series Two Jean Simpson, Mavis Duncanson, Glenda Oben, Judith Adams, Andrew Wicken, Melanie Pierson,
Invasive Pneumococcal Disease Quarterly Report
 Invasive Pneumococcal Disease Quarterly Report January March 2018 Prepared as part of a Ministry of Health contract for scientific services by Rebekah Roos Helen Heffernan June 2018 Acknowledgements This
Unequal Impact II: Māori and Non-Māori Cancer Statistics by Deprivation and Rural Urban Status
 Unequal Impact II: and Non- Cancer Statistics by Deprivation and Urban Status 2002 2006 Te Rōpū Rangahau Hauora a Eru Pōmare University of Otago, Wellington Citation: Robson B, Purdie G, Cormack, D. 2010.
Goldfields population and health snapshot
 Goldfields population and health snapshot The Goldfields region is located in the south east corner of Western Australia and incorporates eight local government areas. It is the largest health region in
National Cancer Programme. Work Plan 2014/15
 National Cancer Programme Work Plan 2014/15 Citation: Ministry of Health. 2014. National Cancer Programme: Work Plan 2014/15. Wellington: Ministry of Health. Published in December 2014 by the Ministry
Tautoko I Rerenga a Tupeka Kore Taranaki Supporting the Journey to a Tobacco Free Taranaki. Tobacco Control Strategic Plan and Action Plan
 Tautoko I Rerenga a Tupeka Kore Taranaki Supporting the Journey to a Tobacco Free Taranaki Tobacco Control Strategic Plan and Action Plan 2015-2016 Taranaki Tobacco Strategic Plan and Action Plan 2015-2016
Tobacco Trends 2007 A brief update on monitoring indicators
 Tobacco Trends 2007 A brief update on monitoring indicators Citation: Ministry of Health. 2008. Tobacco Trends 2007: A brief update on monitoring indicators. Wellington: Ministry of Health. Published in
Ngā Poutama Oranga Hinengaro: Quality in Context survey of mental health and addiction services. National report. December 2018
 Ngā Poutama Oranga Hinengaro: Quality in Context survey of mental health and addiction services National report December 2018 Ngā Poutama Oranga Hinengaro: Quality in Context survey of mental health and
NOTIFIABLE DISEASES IN NEW ZEALAND 2014
 SURVEILLANCE REPORT NOTIFIABLE DISEASES IN NEW ZEALAND 2014 Prepared as part of a Ministry of Health contract for scientific services by the Health Intelligence Team, Institute of Environmental Science
Competencies for Cervical Screening Education and Training
 Competencies for Cervical Screening Education and Training Released 2017 health.govt.nz Citation: Ministry of Health. 2017. Competencies for Cervical Screening Education and Training. Wellington: Ministry
Midland Region All Boards Development Days. Midland Cancer Network. 15, 16 October, 2015
 Midland Region All Boards Development Days Midland Cancer Network 15, 16 October, 2015 NZ cancer incidence 1948-2011 Source: NZ Cancer 0.0 50.0 100.0 150.0 200.0 250.0 300.0 350.0 400.0 0 5000 10000 15000
8.0 North Shore. 8.1 Introduction
 8.0 North Shore 8.1 Introduction The North Shore ward is made up of two local boards, Devonport-Takapuna and Kaipatiki. The ward includes the residential suburbs of Devonport, Belmont, Beach Haven, Takapuna,
Ministry of Health. Refresh of rheumatic fever prevention plans: Guiding information for high incidence District Health Boards June 2015
 Ministry of Health Refresh of rheumatic fever prevention plans: Guiding information for high incidence District Health Boards June 2015 Contents Introduction... 1 Guidance for update of Rheumatic Fever
BRONCHIOLITIS. Introduction
 BRONCHIOLITIS Introduction Bronchiolitis is the most common lower respiratory infection in infants and a leading cause of hospital admission in this age group. It is a viral infection and is most commonly
PORCUPINE HEALTH UNIT INFECTIOUS DISEASE STATUS REPORT
 PORCUPINE HEALTH UNIT INFECTIOUS DISEASE STATUS REPORT 2006-2012 JUNE 2014 i MESSAGE FROM THE MEDICAL OFFICER OF HEALTH Public health units in Ontario are mandated to prevent or reduce the burden of infectious
Cancer in Pacific people in New Zealand: a descriptive study
 Cancer in Pacific people in New Zealand: a descriptive study Abstract: Non-Mâori Pacific people constitute a significant and rapidly growing population in New Zealand. An accompanying change in lifestyle
Copyright is owned by the Author of the thesis. Permission is given for a copy to be downloaded by an individual for the purpose of research and
 Copyright is owned by the Author of the thesis. Permission is given for a copy to be downloaded by an individual for the purpose of research and private study only. The thesis may not be reproduced elsewhere
Factors influencing women s decisions about having the pertussis-containing vaccine during pregnancy
 Factors influencing women s decisions about having the pertussis-containing vaccine during pregnancy Linda Hill RNCp, MHealSc; 1 Beverley Burrell BA, Ma, Dip.TTchg, RN; 1 Tony Walls MBChB, FRACP, MD 2
T-iffilEl HF..LTR OF PEOPLE
 T-iffilEl HF..LTR OF PEOPLE TI XT( QJ( Tii1( S? ALA I P, S 'V I A S 'A ACKNOWLEDGEMENTS The- current Locality Profile Working Group (Carolyn Wilson, Ginia Gouman, Alexius Pepper, Ryan Thompson, Clare Pascoe,
Tuia te rangi e tū nei. Tuia te papa e takoto nei. Tuia tātou ngā whakarerenga iho o rātou mā.
 Tena koutou katoa e te whanau Tuia te rangi e tū nei. Tuia te papa e takoto nei. Tuia tātou ngā whakarerenga iho o rātou mā. Whanau, today our Wharekura was informed that we have one reported case of measles
INFECTIOUS DISEASES IN NEW ZEALAND: 2002 ANNUAL
 INFECTIOUS DISEASES IN NEW ZEALAND: 22 ANNUAL SURVEILLANCE SUMMARY Prepared as part of the Ministry of Health contract for scientific services by Elizabeth Sneyd, Michael Baker May 23 Client Report FW
Asthma Disparities: A Global View
 Asthma Disparities: A Global View Professor Innes Asher Department of Paediatrics: Child and Youth Health, The University of Auckland, Auckland, New Zealand. mi.asher@auckland.ac.nz Invited lecture, Scientific
INVASIVE PNEUMOCOCCAL DISEASE IN NEW ZEALAND, 2015
 INVASIVE PNEUMOCOCCAL DISEASE IN NEW ZEALAND, 2015 Prepared as part of a Ministry of Health contract for scientific services by Health Group Institute of Environmental Science and Research Limited June
Health Inequalities. Additional tables to accompany the 2016 Director of Public Health Annual Report
 Health Inequalities Additional tables to accompany the 2016 Director of Public Health Annual Report June 2017 Director of Public Health, Annual Report 2016 Supplementary Data Table no. OVERVIEW 1.1 Life
Tracking the Obesity Epidemic: New Zealand Public Health Intelligence Occasional Bulletin No 24
 Tracking the Obesity Epidemic: New Zealand 1977 2003 Public Health Intelligence Occasional Bulletin No 24 Citation: Ministry of Health. 2004. Tracking the Obesity Epidemic: New Zealand 1977 2003. Wellington:
TERMS OF REFERENCE. MIDLAND MH&A MĀORI LEADERSHIP NETWORK: Te Huinga o Ngā Pou Hauora. Ate - Raukawa
 Ate - Raukawa This Terms of Reference should be read in conjunction with the Midland Mental Health & Addiction Strategic Plan and the Midland Regional Services Implementation Plan. Whakatōngia te aroha
OUTCOME AND IMPACT LEVEL INTERVENTION LOGIC & INDICATORS HEALTH SECTOR WORKING PAPER: DRAFT - OCTOBER 2009
 EC EXTERNAL SERVICES EVALUATION UNIT OUTCOME AND IMPACT LEVEL INTERVENTION LOGIC & INDICATORS HEALTH SECTOR WORKING PAPER: DRAFT - OCTOBER 2009 This working paper outlines a set of indicators at the outcome
NOTIFIABLE DISEASES IN NEW ZEALAND 2015
 SURVEILLANCE REPORT NOTIFIABLE DISEASES IN NEW ZEALAND 2015 Prepared as part of a Ministry of Health contract for scientific services by the Health Intelligence Team, Institute of Environmental Science
The Aboriginal Maternal and Infant Health Service: a decade of achievement in the health of women and babies in NSW
 The Aboriginal Maternal and Infant Health Service: a decade of achievement in the health of women and babies in NSW Elisabeth Murphy A,B and Elizabeth Best A A Maternity, Children and Young People s Health
Kimberley population and health snapshot
 Kimberley population and health snapshot The Kimberley is the State s most northern region and forms one sixth of Western Australia s total landmass. The Kimberley is remote from metropolitan areas with
Factors Influencing Women s Decisions about Having the Pertussis Containing (Tdap) Vaccine during Pregnancy
 Vaccine during Pregnancy") Factors Influencing Women s Decisions about Having the Pertussis Containing (Tdap) Vaccine during Pregnancy Linda Hill Clinical Nurse Consultant, Royal New Zealand Plunket Society; University of Otago,
Factors Influencing Women s Decisions about Having the Pertussis Containing (Tdap) Vaccine during Pregnancy Linda Hill Clinical Nurse Consultant, Royal New Zealand Plunket Society; University of Otago,
SmartVA Analyze Outputs Interpretation Sheet
 SmartVA Analyze Outputs Interpretation Sheet SmartVA-Analyze uses an algorithm called Tariff 2.0 to assign the cause of death based on the details of the verbal autopsy (VA) interview. The output from
INVASIVE GROUP A STREPTOCOCCAL INFECTION IN NEW ZEALAND, 2014 AND 2015
 INVASIVE GROUP A STREPTOCOCCAL INFECTION IN NEW ZEALAND, 2014 AND 2015 Authors: Tammy Hambling Yvonne Galloway Susan Jack Julie Morgan PREPARED FOR: CLIENT REPORT No: PREPARED BY: Ministry of Health FW15036
The incidence of acute rheumatic fever in New Zealand ( )
") The incidence of acute rheumatic fever in New Zealand (2010-2013) Citation: Jason Gurney, James Stanley and Diana Sarfati (2015). The incidence of acute rheumatic fever in New Zealand, 2010-2013. Wellington:
The incidence of acute rheumatic fever in New Zealand (2010-2013) Citation: Jason Gurney, James Stanley and Diana Sarfati (2015). The incidence of acute rheumatic fever in New Zealand, 2010-2013. Wellington: