Chapter 5 & 6 Review. Producing Data Probability & Simulation
|
|
|
- Ross Clarke
- 5 years ago
- Views:
Transcription
1 Chapter 5 & 6 Review Producing Data Probability & Simulation
2 M&M s Given a bag of M&M s: What s my population? How can I take a simple random sample (SRS) from the bag? How could you introduce bias?
3 Population We are almost always interested in knowledge about a population. We would have little interest in samples if we could always ask everyone what they think about any particular issue that is, we would conduct a census. The reality is that we can t, so we need to get a sample that is representative of the population (I.e., shares characteristics of the population!)
4 Bias Sampling Why are these bad? Voluntary Response Sample Surveying people on customer satisfaction who come out of the DMV Convenience Sampling A survey on utilization of the cafeteria a CCA basketball game because it is convenient A survey about political views at a mall

5 Simple Random Sample

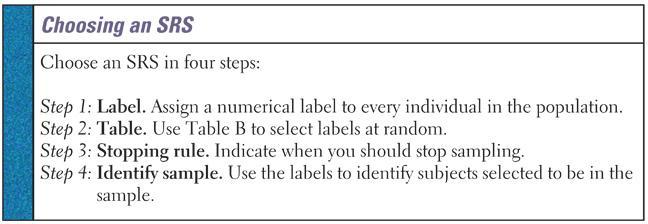
6
7 Technology Tip Example 5.5 demonstrates the use of the random number table to select an SRS of size 5 from a population of size 30. To do the same thing on your calcuator, select MATH PRB randint(1,30) and press ENTER five times to get your sample. Ignore repeats. Or: randint(1,30,5) (works fine as long as there are no repeats).
8 Sampling Techniques Bad sampling techniques that do not produce good data: Convenience Sampling and Voluntary response sampling. Good sampling techniques that do produce good data: Probability sampling; it is a sample chosen by chance. We must know what samples are possible and what probability each possible sample has.
9 Types of bias Never say biased Name the bias! Response Bias (respondents lie, behavior of respondent or of the interviewer influences results, voluntary response bias) Wording of Questions Undercoverage Nonresponse

10

11 Statistical Significance
 Simulate many repetitions. 5) State your conclusions. Ex: Toss a coin 10 times.")
12 Simulation Steps 1) State the problem or describe the random phenomenon. 2) State the assumptions. 3) Assign digits to represent outcomes. 4) Simulate many repetitions. 5) State your conclusions. Ex: Toss a coin 10 times. What s the likelihood of a run of at least 3 consecutive heads or 3 consecutive tails?
13 Ex: Toss a coin 10 times. What s the likelihood of a run of at least 3 consecutive heads or 3 consecutive tails? Line 101 in Table B: Let: odds = heads; evens = tails If you repeat 25 times 23 of them have a run of 3 or more heads or tails => Estimated probability = 23/25 =.92
14 6.2 Probability Models Chance behavior is unpredictable in the short run but has a regular and predictable pattern in the long run! Random is not the same as haphazard! It s a description of a kind of order that emerges in the long run. The idea of probability is empirical. It is based on observation rather than theorizing = you must observe trials in order to pin down a probability! The relative frequencies of random phenomena seem to settle down to fixed values in the long run. Ex: Coin tosses; relative frequency of heads is erratic in 2 or 10 tosses, but gets stable after several thousand tosses!
 The idea of probability is empirical (need to observe real-world examples) 3) Computer simulations are useful (to get")
15 Exploring Randomness 1) You must have a long series of independent trials. 2) The idea of probability is empirical (need to observe real-world examples) 3) Computer simulations are useful (to get several thousand of trials in order to pin down probability)

16 Sample space for trails involving flipping a coin =? Sample space for rolling a die =? Probability distribution for flipping a coin =? Probability distribution for rolling a die =?
17 Event 1: Flipping a coin Event 2: Rolling a die 1) How many outcomes are there? List the sample space. Tree diagram: * Rule 2) Find the probability of flipping a head and rolling a 3. Find the probability of flipping a tail and rolling a 6. 3) # of outcomes?
 =")
18 Example: P(H and 3) = 1/2 * 1/6 = 1/12 P(T and 6) =
19 Sampling with replacement: If you draw from the original sample and put back whatever you draw out Sampling without replacement: If you draw from the original sample and do not put back whatever you drew out! EXAMPLE: 1) Find the probability of getting one ace, then another ace without replacement. 2) Find the probability of getting one ace, then another ace with replacement.


20 Disjoint/Complement Mutually exclusive No outcomes in common Can t happen simultaneously The probability that an event does not occur
21 Probability Rules: P(A U B) = P(A) + P(B) => A or B A union B is the set of all outcomes that are either in A or in B.
22 Venn Diagram: Union ( Or /Addition Rule) Find: 1) P(A U B) =getting an even number or a number greater than or equal to 5 or both 2) P(A or C) =getting an even number or a number less than or equal to 3 or both 3) P(B U C)=getting a number that is at most 3 or at least 5 or both.


23 The probability that BOTH events A and B occur A and B are the overlapping area common to both A and B Only for INDEPENDENT events Independent: knowing that one occurs does not change the probability that the other occurs
24 Venn Diagram: Intersection ( And /* Rule) Find: 1) P(A U B) =getting an even number that is at least 5 U 2) P(A and C) =getting an even number that is at most 3 3) P(B C)=getting a number that is at most 3 and at least 5. U
25 The Big Picture + Rule holds if A and B are disjoint/mutually exclusive * Rule holds if A and B are independent * Disjoint events cannot be independent! Mutual exclusivity implies that if event A happens, event B CANNOT happen.
26 Conditional probability: Pre-set condition ( given ) Find: 1) P(A given C) =getting an even number GIVEN that the number is at most 3. 2) P(A B) =getting an even number GIVEN that the number is at least 5.

27 If events A and B are not disjoint, they can occur simultaneously. Outcomes in common!
28 Let A = the woman chosen is Let B = the woman is married 1) P(A) 2) P(A and B) 3) P(B given A)


29 The probability we assign to an event if we know that some other event has occurred.
30 Example Seventy-five percent of people who purchase hair dryers are women. Of these women purchases of hair dryers, thirty percent are over 50 years old. What is the probability that a randomly selected hair dryer purchaser is a woman over 50 years old?
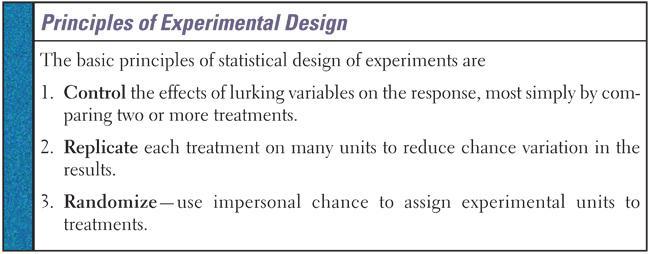
Observational study is a poor way to gauge the effect of an intervention. When looking for cause effect relationships you MUST have an experiment.
 Chapter 5 Producing data Observational study Observes individuals and measures variables of interest but does not attempt to influence the responses. Experiment Deliberately imposes some treatment on individuals
5.3: Associations in Categorical Variables
 5.3: Associations in Categorical Variables Now we will consider how to use probability to determine if two categorical variables are associated. Conditional Probabilities Consider the next example, where
Probability and Sample space
 Probability and Sample space We call a phenomenon random if individual outcomes are uncertain but there is a regular distribution of outcomes in a large number of repetitions. The probability of any outcome
Chapter 5: Producing Data
 Chapter 5: Producing Data Key Vocabulary: observational study vs. experiment confounded variables population vs. sample sampling vs. census sample design voluntary response sampling convenience sampling
Lecture 7 Section 2.5. Mon, Sep 8, 2008
 Lecture 7 Section 2.5 Hampden-Sydney College Mon, Sep 8, 2008 Outline 1 2 3 4 5 Exercise 9, p. 98 In a recent poll, 62% responded Yes when asked if they favored an amendment protecting the life of an unborn
Math HL Chapter 12 Probability
 Math HL Chapter 12 Probability Name: Read the notes and fill in any blanks. Work through the ALL of the examples. Self-Check your own progress by rating where you are. # Learning Targets Lesson I have
REVIEW FOR THE PREVIOUS LECTURE
 Slide 2-1 Calculator: The same calculator policies as for the ACT hold for STT 315: http://www.actstudent.org/faq/answers/calculator.html. It is highly recommended that you have a TI-84, as this is the
Chapter 1: Exploring Data
 Chapter 1: Exploring Data Key Vocabulary:! individual! variable! frequency table! relative frequency table! distribution! pie chart! bar graph! two-way table! marginal distributions! conditional distributions!
Chapter 6: Counting, Probability and Inference
 Chapter 6: Counting, Probability and Inference 6.1 Introduction to Probability Definitions Experiment a situation with several possible results o Ex: Outcome each result of an experiment o Ex: Sample Space
Section 6.1 Sampling. Population each element (or person) from the set of observations that can be made (entire group)
 from the set of observations that can be made (entire group)") Section 6.1 Sampling Population each element (or person) from the set of observations that can be made (entire group) Sample a subset of the population Census systematically getting information about an
Section 6.1 Sampling Population each element (or person) from the set of observations that can be made (entire group) Sample a subset of the population Census systematically getting information about an
Quizzes (and relevant lab exercises): 20% Midterm exams (2): 25% each Final exam: 30%
: 20% Midterm exams (2): 25% each Final exam: 30%") 1 Intro to statistics Continued 2 Grading policy Quizzes (and relevant lab exercises): 20% Midterm exams (2): 25% each Final exam: 30% Cutoffs based on final avgs (A, B, C): 91-100, 82-90, 73-81 3 Numerical
1 Intro to statistics Continued 2 Grading policy Quizzes (and relevant lab exercises): 20% Midterm exams (2): 25% each Final exam: 30% Cutoffs based on final avgs (A, B, C): 91-100, 82-90, 73-81 3 Numerical
CHAPTER 5: PRODUCING DATA
 CHAPTER 5: PRODUCING DATA 5.1: Designing Samples Exploratory data analysis seeks to what data say by using: These conclusions apply only to the we examine. To answer questions about some of individuals
Vocabulary. Bias. Blinding. Block. Cluster sample
 Bias Blinding Block Census Cluster sample Confounding Control group Convenience sample Designs Experiment Experimental units Factor Level Any systematic failure of a sampling method to represent its population
Section 6.1 "Basic Concepts of Probability and Counting" Outcome: The result of a single trial in a probability experiment
 Section 6.1 "Basic Concepts of Probability and Counting" Probability Experiment: An action, or trial, through which specific results are obtained Outcome: The result of a single trial in a probability
5. Suppose there are 4 new cases of breast cancer in group A and 5 in group B. 1. Sample space: the set of all possible outcomes of an experiment.
 Probability January 15, 2013 Debdeep Pati Introductory Example Women in a given age group who give birth to their first child relatively late in life (after 30) are at greater risk for eventually developing
Understanding Probability. From Randomness to Probability/ Probability Rules!
 Understanding Probability From Randomness to Probability/ Probability Rules! What is chance? - Excerpt from War and Peace by Leo Tolstoy But what is chance? What is genius? The words chance and genius
AP Statistics Chapter 5 Multiple Choice
 AP Statistics Chapter 5 Multiple Choice 1. A nutritionist wants to study the effect of storage time (6, 12, and 18 months) on the amount of vitamin C present in freeze dried fruit when stored for these
LSP 121. LSP 121 Math and Tech Literacy II. Topics. Binning. Stats & Probability. Stats Wrapup Intro to Probability
 Greg Brewster, DePaul University Page 1 LSP 121 Math and Tech Literacy II Stats Wrapup Intro to Greg Brewster DePaul University Statistics Wrapup Topics Binning Variables Statistics that Deceive Intro
Section 6.1 Sampling. Population each element (or person) from the set of observations that can be made (entire group)
 from the set of observations that can be made (entire group)") Section 6.1 Sampling Population each element (or person) from the set of observations that can be made (entire group) Sample a subset of the population Census systematically getting information about an
Section 6.1 Sampling Population each element (or person) from the set of observations that can be made (entire group) Sample a subset of the population Census systematically getting information about an
Probability. Esra Akdeniz. February 26, 2016
 Probability Esra Akdeniz February 26, 2016 Terminology An experiment is any action or process whose outcome is subject to uncertainty. Example: Toss a coin, roll a die. The sample space of an experiment
Chapter 1 Data Collection
 Chapter 1 Data Collection OUTLINE 1.1 Introduction to the Practice of Statistics 1.2 Observational Studies versus Designed Experiments 1.3 Simple Random Sampling 1.4 Other Effective Sampling Methods 1.5
Probability and Counting Techniques
 Probability and Counting Techniques 3.4-3.8 Cathy Poliak, Ph.D. cathy@math.uh.edu Department of Mathematics University of Houston Lecture 2 Lecture 2 1 / 44 Outline 1 Counting Techniques 2 Probability
Math 140 Introductory Statistics
 Math 140 Introductory Statistics Professor Silvia Fernández Sample surveys and experiments Most of what we ve done so far is data exploration ways to uncover, display, and describe patterns in data. Unfortunately,
Probability and Counting Techniques
 Probability and Counting Techniques 3.4-3.8 Cathy Poliak, Ph.D. cathy@math.uh.edu Department of Mathematics University of Houston Lecture 2 Lecture 2 1 / 44 Outline 1 Counting Techniques 2 Probability
august 3, 2018 What do you think would have happened if we had time to do the same activity but with a sample size of 10?
 august 3, 2018 summary from yesterday! What do you think would have happened if we had time to do the same activity but with a sample size of 10? Increasing the sample size decreases the variability of
First Problem Set: Answers, Discussion and Background
 First Problem Set: Answers, Discussion and Background Part I. Intuition Concerning Probability Do these problems individually Answer the following questions based upon your intuitive understanding about
Lecture 3. PROBABILITY. Sections 2.1 and 2.2. Experiment, sample space, events, probability axioms. Counting techniques
 Lecture 3. PROBABILITY Sections 2.1 and 2.2 Experiment, sample space, events, probability axioms. Counting techniques Slide 1 The probability theory begins in attempts to describe gambling (how to win,
Sampling. (James Madison University) January 9, / 13
 January 9, / 13") Sampling The population is the entire group of individuals about which we want information. A sample is a part of the population from which we actually collect information. A sampling design describes
Sampling The population is the entire group of individuals about which we want information. A sample is a part of the population from which we actually collect information. A sampling design describes
Probability and Statistics Chapter 1 Notes
 Probability and Statistics Chapter 1 Notes I Section 1-1 A is the science of collecting, organizing, analyzing, and interpreting data in order to make decisions 1 is information coming from observations,
6 Relationships between
 CHAPTER 6 Relationships between Categorical Variables Chapter Outline 6.1 CONTINGENCY TABLES 6.2 BASIC RULES OF PROBABILITY WE NEED TO KNOW 6.3 CONDITIONAL PROBABILITY 6.4 EXAMINING INDEPENDENCE OF CATEGORICAL
Intro to Survey Design and Issues. Sampling methods and tips
 Intro to Survey Design and Issues Sampling methods and tips Making Inferences What is a population? All the cases for some given area or phenomenon. One can conduct a census of an entire population, as
Section 1.1 What is Statistics?
 Chapter 1 Getting Started Name Section 1.1 What is Statistics? Objective: In this lesson you learned how to identify variables in a statistical study, distinguish between quantitative and qualitative variables,
Analytical Geometry. Applications of Probability Study Guide. Use the word bank to fill in the blanks.
 Analytical Geometry Name Applications of Probability Study Guide Use the word bank to fill in the blanks. Conditional Probabilities Sample Space Union Mutually Exclusive Complement Intersection Event Independent
I. Introduction and Data Collection B. Sampling. 1. Bias. In this section Bias Random Sampling Sampling Error
 I. Introduction and Data Collection B. Sampling In this section Bias Random Sampling Sampling Error 1. Bias Bias a prejudice in one direction (this occurs when the sample is selected in such a way that
8.2 Warm Up. why not.
 Binomial distributions often arise in discrimination cases when the population in question is large. The generic question is If the selection were made at random from the entire population, what is the
Chapter 3. Producing Data
 Chapter 3. Producing Data Introduction Mostly data are collected for a specific purpose of answering certain questions. For example, Is smoking related to lung cancer? Is use of hand-held cell phones associated
aps/stone U0 d14 review d2 teacher notes 9/14/17 obj: review Opener: I have- who has
 aps/stone U0 d14 review d2 teacher notes 9/14/17 obj: review Opener: I have- who has 4: You should be able to explain/discuss each of the following words/concepts below... Observational Study/Sampling
UNIT I SAMPLING AND EXPERIMENTATION: PLANNING AND CONDUCTING A STUDY (Chapter 4)
") UNIT I SAMPLING AND EXPERIMENTATION: PLANNING AND CONDUCTING A STUDY (Chapter 4) A DATA COLLECTION (Overview) When researchers want to make conclusions/inferences about an entire population, they often
UNIT I SAMPLING AND EXPERIMENTATION: PLANNING AND CONDUCTING A STUDY (Chapter 4) A DATA COLLECTION (Overview) When researchers want to make conclusions/inferences about an entire population, they often
Unit 1 Exploring and Understanding Data
 Unit 1 Exploring and Understanding Data Area Principle Bar Chart Boxplot Conditional Distribution Dotplot Empirical Rule Five Number Summary Frequency Distribution Frequency Polygon Histogram Interquartile
Problems for Chapter 8: Producing Data: Sampling. STAT Fall 2015.
 Population and Sample Researchers often want to answer questions about some large group of individuals (this group is called the population). Often the researchers cannot measure (or survey) all individuals
AP Stats Review for Midterm
 AP Stats Review for Midterm NAME: Format: 10% of final grade. There will be 20 multiple-choice questions and 3 free response questions. The multiple-choice questions will be worth 2 points each and the
Chapter 3. Producing Data
 Chapter 3 Producing Data Types of data collected Anecdotal data data collected haphazardly (not representative!!) Available data existing data (examples: internet, library, census bureau,.) Gather own
CHAPTER 8 Estimating with Confidence
 CHAPTER 8 Estimating with Confidence 8.1b Confidence Intervals: The Basics The Practice of Statistics, 5th Edition Starnes, Tabor, Yates, Moore Bedford Freeman Worth Publishers Confidence Intervals: The
Chapter 15: Continuation of probability rules
 Chapter 15: Continuation of probability rules Example: HIV-infected women attending either an infectious disease clinic in Bangkok were screened for high-risk HPV and received a Pap test; those with abnormal
Outline. Chapter 3: Random Sampling, Probability, and the Binomial Distribution. Some Data: The Value of Statistical Consulting
 Outline Chapter 3: Random Sampling, Probability, and the Binomial Distribution Part I Some Data Probability and Random Sampling Properties of Probabilities Finding Probabilities in Trees Probability Rules
Describe what is meant by a placebo Contrast the double-blind procedure with the single-blind procedure Review the structure for organizing a memo
 Please note the page numbers listed for the Lind book may vary by a page or two depending on which version of the textbook you have. Readings: Lind 1 11 (with emphasis on chapters 10, 11) Please note chapter
P. 266 #9, 11. p. 289 # 4, 6 11, 14, 17
 P. 266 #9, 11 9. Election. a) Answers will vary. A component is one voter voting. An outcome is a vote for our candidate. Using two random digits, 00-99, let 01-55 represent a vote for your candidate,
Still important ideas
 Readings: OpenStax - Chapters 1 11 + 13 & Appendix D & E (online) Plous - Chapters 2, 3, and 4 Chapter 2: Cognitive Dissonance, Chapter 3: Memory and Hindsight Bias, Chapter 4: Context Dependence Still
5.2 ESTIMATING PROBABILITIES
 5.2 ESTIMATING PROBABILITIES It seems clear that the five-step approach of estimating expected values in Chapter 4 should also work here in Chapter 5 for estimating probabilities. Consider the following
Chance. May 11, Chance Behavior The Idea of Probability Myths About Chance Behavior The Real Law of Averages Personal Probabilities
 Chance May 11, 2012 Chance Behavior The Idea of Probability Myths About Chance Behavior The Real Law of Averages Personal Probabilities 1.0 Chance Behavior 16 pre-verbal infants separately watch a puppet
CHAPTER 8 Estimating with Confidence
 CHAPTER 8 Estimating with Confidence 8.1 Confidence Intervals: The Basics The Practice of Statistics, 5th Edition Starnes, Tabor, Yates, Moore Bedford Freeman Worth Publishers Confidence Intervals: The
Conditional probability
 Conditional probability February 12, 2012 Once you eliminate the impossible, whatever remains, however improbable, must be the truth. Flip a fair coin twice. If you get TT, re-roll. Flip a fair coin twice.
Probabilities and Research. Statistics
 Probabilities and Research Statistics Sampling a Population Interviewed 83 out of 616 (13.5%) initial victims Generalizability: Ability to apply findings from one sample or in one context to other samples
Lecture Slides. Elementary Statistics Eleventh Edition. by Mario F. Triola. and the Triola Statistics Series 1.1-1
 Lecture Slides Elementary Statistics Eleventh Edition and the Triola Statistics Series by Mario F. Triola 1.1-1 Chapter 1 Introduction to Statistics 1-1 Review and Preview 1-2 Statistical Thinking 1-3
Review for Final Exam
 John Jay College of Criminal Justice The City University of New York Department of Mathematics and Computer Science MAT 108 - Finite Mathematics Review for Final Exam SHORT ANSWER. The following questions
Chapter 8 Estimating with Confidence. Lesson 2: Estimating a Population Proportion
 Chapter 8 Estimating with Confidence Lesson 2: Estimating a Population Proportion What proportion of the beads are yellow? In your groups, you will find a 95% confidence interval for the true proportion
Chapter 8 Estimating with Confidence. Lesson 2: Estimating a Population Proportion
 Chapter 8 Estimating with Confidence Lesson 2: Estimating a Population Proportion Conditions for Estimating p These are the conditions you are expected to check before calculating a confidence interval
Representativeness heuristics
 Representativeness heuristics 1-1 People judge probabilities by the degree to which A is representative of B, that is, by the degree to which A resembles B. A can be sample and B a population, or A can
Describe what is meant by a placebo Contrast the double-blind procedure with the single-blind procedure Review the structure for organizing a memo
 Business Statistics The following was provided by Dr. Suzanne Delaney, and is a comprehensive review of Business Statistics. The workshop instructor will provide relevant examples during the Skills Assessment
An observational study observes individuals and measures variables of interest but does not attempt to influence the responses.
 Producing Data: A sample chosen to represent the entire population. How shall we choose a sample that truly represents the opinions of the entire populaiton? Satistical designs for choosing samples are
ASSIGNMENT 2. Question 4.1 In each of the following situations, describe a sample space S for the random phenomenon.
 ASSIGNMENT 2 MGCR 271 SUMMER 2009 - DUE THURSDAY, MAY 21, 2009 AT 18:05 IN CLASS Question 4.1 In each of the following situations, describe a sample space S for the random phenomenon. (1) A new business
Chapter 2 Designing Observational Studies and Experiments Section 1 Simple Random Sampling
 Math 167 Pre-Statistics Chapter 2 Designing Observational Studies and Experiments Section 1 Simple Random Sampling Objectives 1. Identify the individuals, the variables, and the observations of a study.
Design, Sampling, and Probability
 STAT 269 Design, Sampling, and Probability Three ways to classify data Quantitative vs. Qualitative Quantitative Data: data that represents counts or measurements, answers the questions how much? or how
MAT 155. Chapter 1 Introduction to Statistics. Key Concept. Basics of Collecting Data. August 20, S1.5_3 Collecting Sample Data
 MAT 155 Dr. Claude Moore Cape Fear Community College Chapter 1 Introduction to Statistics 1 1 Review and Preview 1 2 Statistical Thinking 1 3 Types of Data 1 4 Critical Thinking 1 5 Collecting Sample Data
Probability Models for Sampling
 Probability Models for Sampling Chapter 18 May 24, 2013 Sampling Variability in One Act Probability Histogram for ˆp Act 1 A health study is based on a representative cross section of 6,672 Americans age
STA 291 Lecture 4 Jan 26, 2010
 STA 291 Lecture 4 Jan 26, 2010 Methods of Collecting Data Survey Experiment STA 291 - Lecture 4 1 Review: Methods of Collecting Data Observational Study vs. Experiment An observational study (survey) passively
Still important ideas
 Readings: OpenStax - Chapters 1 13 & Appendix D & E (online) Plous Chapters 17 & 18 - Chapter 17: Social Influences - Chapter 18: Group Judgments and Decisions Still important ideas Contrast the measurement
Lecture 12: Normal Probability Distribution or Normal Curve
 12_normalcurve.pdf Michael Hallstone, Ph.D. hallston@hawaii.edu Lecture 12: Normal Probability Distribution or Normal Curve The real importance of this lecture is to show you what a normal curve looks
APPLIED STATISTICS. Lecture 2 Introduction to Probability. Petr Nazarov Microarray Center
 Microarray Center LIED STTISTICS Lecture 2 Introduction to robability etr Nazarov petr.nazarov@crp-sante.lu 10-11-2009 Lecture 2. Introduction to probability OUTLINE Lecture 2 Experiments, counting rules
Genetics Project. Using the same traits from our Jane and John activity, we will determine how an offspring of yours could look.
 Genetics Project Name 7 th Grade PSI Science Partner s Name Due Date In our Jane and John activity, we looked at the traits of fictional characters. For this final project, we will now talk about YOUR
Handout 16: Opinion Polls, Sampling, and Margin of Error
 Opinion polls involve conducting a survey to gauge public opinion on a particular issue (or issues). In this handout, we will discuss some ideas that should be considered both when conducting a poll and
WDHS Curriculum Map Probability and Statistics. What is Statistics and how does it relate to you?
 WDHS Curriculum Map Probability and Statistics Time Interval/ Unit 1: Introduction to Statistics 1.1-1.3 2 weeks S-IC-1: Understand statistics as a process for making inferences about population parameters
Chapter 1 Where Do Data Come From?
 Chapter 1 Where Do Data Come From? Understanding Data: The purpose of this class; to be able to read the newspaper and know what the heck they re talking about! To be able to go to the casino and know
probability problems, first two days
 ph 141 probability problems, first two days from Moore, McCabe and Craig, 8th ed 4.111 Exercise and sleep. Suppose that 40 % of adults get enough sleep, 46 % get enough exercise, and 24 % do both. Find
MULTIPLE CHOICE. Choose the one alternative that best completes the statement or answers the question.
 Exam Name MULTIPLE CHOICE. Choose the one alternative that best completes the statement or answers the question. Identify the W's for the description of data. 1) A survey of bicycles parked outside college
Math 2311 Section 3.3
 Math 2311 Section 3.3 Recall: A binomial experiment occurs when the following conditions are met: 1. Each trial can result in one of only two mutually exclusive outcomes (success or failure). 2. There
Data = collections of observations, measurements, gender, survey responses etc. Sample = collection of some members (a subset) of the population
 of the population") Chapter 1: Basic Ideas 1.1 Sampling Statistics = the Science of Data By collecting a limited amount of data, we want to say something about the whole group that we want to study, i.e. we want to say something
Chapter 1: Basic Ideas 1.1 Sampling Statistics = the Science of Data By collecting a limited amount of data, we want to say something about the whole group that we want to study, i.e. we want to say something
Stat 13, Intro. to Statistical Methods for the Life and Health Sciences.
 Stat 13, Intro. to Statistical Methods for the Life and Health Sciences. 0. SEs for percentages when testing and for CIs. 1. More about SEs and confidence intervals. 2. Clinton versus Obama and the Bradley
Reasoning with Uncertainty. Reasoning with Uncertainty. Bayes Rule. Often, we want to reason from observable information to unobservable information
 Reasoning with Uncertainty Reasoning with Uncertainty Often, we want to reason from observable information to unobservable information We want to calculate how our prior beliefs change given new available
Margin of Error = Confidence interval:
 NAME: DATE: Algebra 2: Lesson 16-7 Margin of Error Learning 1. How do we calculate and interpret margin of error? 2. What is a confidence interval 3. What is the relationship between sample size and margin
10.1 Estimating with Confidence. Chapter 10 Introduction to Inference
 10.1 Estimating with Confidence Chapter 10 Introduction to Inference Statistical Inference Statistical inference provides methods for drawing conclusions about a population from sample data. Two most common
Learn to use informal measures of probability.
 10-1 Probability Learn to use informal measures of probability. 10-1 Probability Insert Lesson Title Here experiment outcome event probability equally likely impossible certain Vocabulary 10-1 Probability
Business Statistics Probability
 Business Statistics The following was provided by Dr. Suzanne Delaney, and is a comprehensive review of Business Statistics. The workshop instructor will provide relevant examples during the Skills Assessment
Math 124: Module 3 and Module 4
 Experimental Math 124: Module 3 and Module 4 David Meredith Department of Mathematics San Francisco State University September 24, 2009 What we will do today Experimental 1 What we will do today Experimental
AP Statistics Exam Review: Strand 2: Sampling and Experimentation Date:
 AP Statistics NAME: Exam Review: Strand 2: Sampling and Experimentation Date: Block: II. Sampling and Experimentation: Planning and conducting a study (10%-15%) Data must be collected according to a well-developed
Math 1313 Chapter 6 Section 6.4 Permutations and Combinations
 Math 1313 Chapter 6 Section 6.4 Permutations and Combinations Definition: n-factorial For any natural number n, n! = n( n 1)( n 2) 3 2 1 0! = 1 Definition: A permutation is an arrangement of a specific
Experimental and survey design
 Friday, October 12, 2001 Page: 1 Experimental and survey design 1. There is a positive association between the number of drownings and ice cream sales. This is an example of an association likely caused
PROBABILITY Page 1 of So far we have been concerned about describing characteristics of a distribution.
 PROBABILITY Page 1 of 9 I. Probability 1. So far we have been concerned about describing characteristics of a distribution. That is, frequency distribution, percentile ranking, measures of central tendency,
Trick or Treat. In April!
 Trick or Treat. In April! Take one small envelope but Don t open it! Teaching and Leading EBM 2018 Randomization: simple, stratified and block Juan M. Lozano, MD, MSc Describe three methods of randomization:
Lecture Start
 Lecture -- 5 -- Start Outline 1. Science, Method & Measurement 2. On Building An Index 3. Correlation & Causality 4. Probability & Statistics 5. Samples & Surveys 6. Experimental & Quasi-experimental Designs
Moore, IPS 6e Chapter 03
 Page 1 of 7 Moore, IPS 6e Chapter 03 Quizzes prepared by Dr. Patricia Humphrey, Georgia Southern University Researchers are studying the absorption of two drugs into the bloodstream. Each drug is to be
Chapter 1: Thinking critically with. Introduction
 Chapter 1: Thinking critically with psychological science Introduction Fact or Falsehood 1. Human intuition is remarkable accurate and free from error. 2. Most people seem to lack confidence in the accuracy
Statistics and Probability
 Statistics and a single count or measurement variable. S.ID.1: Represent data with plots on the real number line (dot plots, histograms, and box plots). S.ID.2: Use statistics appropriate to the shape
Study Design STUDY DESIGN CASE SERIES AND CROSS-SECTIONAL STUDY DESIGN
 STUDY DESIGN CASE SERIES AND CROSS-SECTIONAL Daniel E. Ford, MD, MPH Vice Dean for Clinical Investigation Johns Hopkins School of Medicine Introduction to Clinical Research July 15, 2014 STUDY DESIGN Provides
Please attempt all problems
 Please attempt all problems 1. (Algebra I: A Process Approach Set 1-6 #2, modified) For an upcoming sale, a store manager told a clerk to stack cans of peanuts in a single triangle. For example, if you
Chapter 4 SAMPLING METHODS AND RESEARCH DESIGNS
 SAMPLING METHODS AND RESEARCH DESIGNS TOPIC SLIDE Types of Research 2 Lurking and Confounding Variables 8 What are Subjects? 10 What is a Sample? 15 Sampling Methods 17 Systematic Bias 23 Random Assignment
Name: Class: Date: 1. Use Scenario 4-6. Explain why this is an experiment and not an observational study.
 Name: Class: Date: Chapter 4 Review Short Answer Scenario 4-6 Read the following brief article about aspirin and alcohol. Aspirin may enhance impairment by alcohol Aspirin, a long time antidote for the
Lesson 87 Bayes Theorem
 Lesson 87 Bayes Theorem HL2 Math - Santowski Bayes Theorem! Main theorem: Suppose we know We would like to use this information to find if possible. Discovered by Reverend Thomas Bayes 1 Bayes Theorem!
Making Inferences from Experiments
 11.6 Making Inferences from Experiments Essential Question How can you test a hypothesis about an experiment? Resampling Data Yield (kilograms) Control Group Treatment Group 1. 1.1 1.2 1. 1.5 1.4.9 1.2
PSYCHOLOGICAL RESEARCH DESIGN & METHODS AP PSYCHOLOGY: CHAPTER 2
 PSYCHOLOGICAL RESEARCH DESIGN & METHODS AP PSYCHOLOGY: CHAPTER 2 Bellwork: Why do we need Psychological Research? What were your thoughts.. Hindsight Bias I knew it all along phenomenon Examples.. 2 groups..