1999 DRUG TREND REPORT
|
|
|
- Prudence Kennedy
- 6 years ago
- Views:
Transcription

1 express scripts 1999 DRUG TREND REPORT june 2000
2 T HE B OTTOM L INE Per member per year (PMPY) Average Wholesale Price (AWP) prescription expenditures grew at a significant rate in percent. This annual growth rate surpassed the rate of 16.8 percent, continuing a trend of increasing rates of drug outlays seen since 1993, the first year Express Scripts began monitoring drug trends. PMPY drug costs are projected to grow at an even higher rate to 17.6 percent in 2000, before gradually slowing to an annual 12.1 percent growth rate in Acknowledgements: The authors owe special thanks to the following people who provided substantial input and comments: Emily Cox, PhD; Sandra Ellis, RPh; Raulo Frear, PharmD; Jeannie Harty; Shelly Heinle; Brenda Motheral, PhD; Chris Peterson, PharmD; Regina Thompson and Clinical Services Staff.
3 I NTRODUCTION BACKGROUND The significant increases in prescription drug expenditures in the past several have been well documented. Many pundits point to drug cost increases as the primary cause for rising healthcare premiums. Blaine Bos of William M. Mercer Inc. asserts that prescription drug costs accounted for 15 percent of total employer health plan costs in 1998 compared with 9 percent in In its most recent HMO Intercompany Rate Survey, Milliman and Robertson attribute the 1999 health premium increase of 8.2 percent primarily to rising pharmacy costs. 2 The 2000 Towers Perrin Health Care Survey indicated that increasing prescription drug cost would be a significant factor in the anticipated 12-percent rise in the cost of large employers health benefit plans. 3 The Segal Company forecasts that due to an anticipated 18 percent growth in 2000, drug outlays will account for 15 percent of total health benefit costs for people under 65 of age and fully 40 percent for those 65 and older. 4 The 1999 annual Hoechst Marion Roussel survey found that prescription drug costs represented 13.6 percent of total HMO operating costs in 1999, up from 10.4 percent in Empire Blue Cross and Blue Shield asserted that prescription drug costs represented 15.5 percent of premiums in 1999 compared with 12 percent just three before. 6 The magnitude of drug cost increases clearly is responsible for the increasing importance of drug expenditures in overall healthcare costs. Based on results from its annual survey of benefit plans of medium and large U.S. companies, the Hay Group found that prescription drug costs rose 15 percent in National Health Expenditure data indicate that, after declining from 1990 through 1993, annual percent changes in prescription drug spending increased every year thereafter, reaching 15.4 percent in Looking to the future, HCFA staff expect prescription drug expenditures to increase at a double-digit rate through 2005 but at a steadily declining rate of 12.9 percent to 10.2 percent. 9 The unabated rise in prescription drug costs has placed substantial pressure on third-party payers and self-funded groups to at least curb the rate of prescription drug growth. The factors driving the use of more drugs and more expensive drugs are the same supply-and-demand phenomena discussed in the 1998 Drug Trend Report: 1 Bloomberg News, Dec. 14, As quoted in Managed Care Executive Edition, January 2000, p. 3. Respondents to the 1999 annual Deloitte & Touche/Business Employer Survey on Managed Care indicated that employers expected health rate increases of 8.7% in 1999, 9.1% in 2000 and 9.6% in 2001, with escalating pharmacy cost cited as the number one reason for this level of increase. (Business & Health, December 1999) 3 Towers Perrin Survey Projects Double-Digit Growth in Health Care Costs in 2000, Segal Health Plan Cost Trend Survey, December Hoechst Marion Roussel Managed Care Digest Series 1999, p. 7 6 Rising Costs of Drugs Take a Bigger Share of Health Insurance Outlays, Jennifer Steinhauer, New York Times, October 29, The Rise in Health Care Premiums Is Closely Tied To Prescription Drugs Cost, Michael Carter, the HayGroup 8 National Health Expenditures, 1998, Table 2, Health Care Financing Administration, Office of the Actuary, National Health Statistics Group 9 National Health Expenditures Projections: , Table 12a, Health Care Financing Administration, Office of the Actuary 1
4 The introduction of many new, usually more expensive, products into the market New indications for existing drugs Consumer expectations that: Drugs can be used as a substitute for lifestyle changes, as a way of enhancing the quality of life and as a fix for cosmetic blemishes Consumers should have access to all drugs and that the costs of these drugs should be subsidized ultimately by their employers or health plans The effective use of direct-to-consumer (DTC) advertising to stimulate demand SUMMARY OF FINDINGS The 1999 Drug Trend Report is the fourth in the series produced by Express Scripts. The intent of these reports is to provide our clients with a better understanding of the dynamics underlying current drug cost increases and future drug cost trends. The 1999 edition highlights the magnitude and underlying causes for drug cost trends in the most recent five-year period, in particular between 1998 and Among the key findings of this study are: Between 1995 and 1999 Per Member Per Year (PMPY) Average Wholesale Price (AWP) ingredient costs grew 79.5 percent Drugs introduced since 1995 represent 37.2 percent of this growth Between 1998 and 1999 PMPY AWP ingredient costs grew by 17.4 percent, from $ to $ The PMPY AWP growth rates for non-managed care clients and managed care clients were 18 percent and 16.3 percent, respectively Increased use of antihyperlipidemics, antidepressants and gastrointestinal products accounted for $10.47 of the total $57.26 cost increase The introduction of COX-2 antirheumatic drugs represented 8.3 percent, or $4.77, of the total cost increase About half of this increase is attributable to increased costs per prescription, although this percentage varies across therapy classes The inflation rate for common drugs (drugs available in 1998 and 1999) grew by 5.4 percent, slightly above 1998 levels but more than double the rate seen in Whereas inflation accounted for 14.9 percent of the total cost increase, inflation represented 31.2 percent of the total cost increase Through 2004 Projections PMPY AWP ingredient costs are projected to increase by: 17.6 percent in percent in percent in percent in percent in
5 The most significant factor accounting for the projected decline in the rate of growth in drug expenditures is the anticipated decrease in price inflation. More specifically, we expect inflation will grow to 6 percent in 2000 but drop to 4 percent in 2001 and to 2 percent from 2002 to 2004, owing to political pressures surrounding a possible Medicare prescription benefit and differential manufacturer pricing in the United States relative to other countries. Moreover, as payers adopt plan designs encouraging more cost-conscious consumer behavior, increases in utilization likely will abate. These plan designs also will encourage the use of less expensive but therapeutically efficacious products and will be reinforced by physician online prescription writing. The trend figures cited above reflect past experience and future expectations about the magnitude of drug cost increases if plan sponsors take no significant action to curb costs. Plan sponsors that did take aggressive steps saw their drug cost trend decrease by about half the 1999 PMPY AWP trend, thereby saving $29 PMPY. The first section of this report describes the reasons for the drug cost growth, followed by our PMPY AWP drug cost forecast for the period from The final part of this analysis discusses some of the key factors influencing drug costs in recent and explains the types of actions plan sponsors can take to offset growing prescription costs. Two appendices are included in this report. Appendix A includes an analysis of drug cost changes across and within therapy classes between 1995 and This appendix highlights some of the key changes in utilization of specific drugs and drug classes, as well as pointing out factors that are likely to impact future product mix in these classes. Appendix B presents gender and age group profiles of prescription use across key therapy classes. This information offers clients a way to better understand drug usage according to the demographic makeup of their populations. METHODS The analyses contained in the 1999 Drug Trend Report are based on prescription medications for a large sample of Express Scripts clients. Prescriptions in this database represent drug usage for a monthly average of 8.8 million members in 1998 and 9.6 million members in Because of the unique demographics and drug coverage for Medicaid recipients and Medicare beneficiaries receiving drug coverage through Medicare + Choice plans, data from those two groups are excluded from this study. The resulting sample consists of 57 percent non-managed care commercial members and 43 percent managed care commercial members. Prescriptions dispensed in inpatient settings and drugs sold over-the-counter are also excluded from consideration. To ensure comparability across time periods and across client groups, all cost figures are expressed as Average Wholesale Price (AWP) ingredient costs (retail list price of the medication). Thus, retail network discounts, mail discounts, dispensing fees and member financial contributions are not reflected in these data. Overall figures may not represent actual client experience due to differences in plan design. Finally, the numbers of prescriptions dispensed through mail service have been converted to equivalent numbers that would have been dispensed through retail pharmacies to adjust for differential mail usage rates across Express Scripts clients. 3
6 4
7 T RENDS IN E XPENDITURES FOR P RESCRIPTION D RUGS In 1999, AWP ingredient costs grew by $57.26 to $ PMPY, a 17.4-percent increase over the 1998 PMPY cost and a 79.5-percent rise over the 1995 PMPY cost of $ (see Figure 1). Figure 1: Per Member Per Year AWP Costs $ $400 $350 $ $300 $ $250 $ $ $200 $150 $100 $50 $ This 17.4-percent drug expenditure growth rate between 1998 and 1999 continues a pattern of annual increases seen since 1993, the first year Express Scripts began monitoring drug costs. The growth rate is almost equally attributable to rises in utilization and increases in per-prescription costs. Non-managed care clients experienced higher PMPY cost increases (18 percent) than managed care clients (16.3 percent). The higher trend for non-managed care clients is due to substantially greater rises in utilization of common drugs, 8.1 percent as opposed to 4.1 percent for managed care clients, as well as to the use of more new drugs, 2.2 percent vs. 1.2 percent, respectively. Lower use of new products for managed care clients is consistent with restrictions that these clients typically impose. New products are often not on formulary for the first six-12 months after their introduction into the market. However, the finding that non-managed care clients experienced almost twice the rate of growth as managed care clients in the use of common drugs is contrary to the and experience. This result may reflect non-managed care clients catching up with managed care clients that traditionally have had higher utilization rates. The actual net claim costs trend for Express Scripts clients ranged from a 5-percent-35-percent rise, depending on how aggressively plan sponsors chose to implement Express Scripts recommended cost-management programs. Why have prescription drug costs escalated so significantly over the past five? To answer this question, growth rates for one-year and five-year periods were analyzed in terms of: 1) changes in the utilization of common drugs medications that were available for use between 1995 and 1999; 2) increases in AWP ingredient costs per prescription of these common drugs; and 3) the introduction of new products to the market (see Table 1). 5
8 Table 1: Components of PMPY AWP Cost Trend * 1995 v v v v v 99 Inflation 3.3% 2.4% 5.1% 5.4% 16.3% Units per Rx 1.8% 1.0% 0.6% 0.2% 3.4% Strength 0.5% 0.6% 0.6% 0.8% 3.9% Mix 4.2% 4.7% 4.4% 2.3% 10.5% Utilization 1.4% 4.5% 3.8% 6.2% 9.7% = Common Drug 11.5% 13.7% 15.2% 15.6% 49.9% + New Drugs 1.3% 2.4% 1.6% 1.8% 29.6% = All Drug 12.9% 16.1% 16.8% 17.4% 79.5% * The percentage contribution of each factor does not total the common drug percentage increase. The calculation takes the base cost for a given year and multiplies it by one plus the percentage contributed by the first factor (inflation). The resulting total is then multiplied by the percentage contributed by the second factor (units per Rx) and so on. The percentage contribution of the new drugs is then added to the total common drug percentage increase to yield an all drug percentage increase. The final results may differ slightly due to rounding. In the 1998 Drug Trend Report, almost half of the overall 66.6-percent increase between 1994 and 1998 was attributed to drugs that were introduced in 1995 or later. Only slightly more than one-tenth of the remaining growth was related to higher utilization, with roughly nine-tenths caused by factors that affect prescription cost. Between 1994 and 1998, about 55 percent of the rise in the cost per prescription was due primarily to inflation and secondarily to therapeutic mix. A combination of larger numbers of units per prescription and the use of higher strength drugs contributed the remaining amounts. In contrast, the 1999 Drug Trend Report suggests a somewhat different pattern. Drugs introduced since 1996 accounted for slightly more than one-third of the growth rate of 79.5 percent. In addition, whereas utilization accounted for about 12 percent of the growth rate attributable to common drugs between 1994 and 1998, this factor accounted for about 20 percent of the common drugs increase between 1995 and No significant differences are discernable between these two time periods in the contribution of either inflation alone or inflation and therapeutic mix to the total rates of drug cost increases. (As described later in the report, wide variations exist across therapy classes in terms of the relative contribution of utilization and per prescription costs.) The following sections discuss in more detail how each of the components of cost trend contributed to cost increases of the combined non-managed and managed commercial memberships between 1998 and CHANGES IN COMMON DRUG COSTS BETWEEN 1998 AND 1999 Utilization of Common Drugs The utilization rate of common drugs between 1998 and 1999 rose by more than 50 percent of the rate seen between 1997 and This is the highest annual rate seen since Express Scripts began monitoring drug trends in Utilization of common drugs grew by 6.2 percent from 7.73 prescriptions PMPY in 1998 to 8.21 PMPY in 1999 (see Figure 2) and accounted for 38.8 percent of the total cost increase. Changes in usage patterns of common drugs differed significantly by 6
9 therapeutic drug grouping. To determine the nature of this variable use pattern, common drugs were categorized into therapy classes groups of pharmaceutical agents that are chemically or therapeutically related. Products were grouped according to the first two digits of the 14-digit Generic Product Identifier (GPI) code as classified by First Data Bank. This classification system defines broad drug groups employed to treat similar medical conditions. Figure 2: Utilization of Common Drugs Utilization + 6.2% 8.21 Number of Rxs PMPY Changes in utilization of common drugs between 1998 and 1999 varied widely (see Table 2). Of the top 25 therapy classes ranked by the number of prescriptions dispensed in 1999, only three non-steriodal anti-inflammatory drugs (NSAIDs), calcium channel blockers (CCBs) and cephalosporins experienced declines in utilization. In contrast, common drug utilization declined for eight therapeutic categories between 1996 and 1997 and for six between 1997 and Four of the 22 therapy classes with increases experienced double-digit utilization growth in As was true in both 1997 and 1998, the largest percentage increase in utilization occurred for antihistamines. Prescriptions for common drugs in that class grew by 18.4 percent to 0.26 PMPY in 1999, slightly above the 17.5-percent rise seen between 1997 and These dramatic increases in the use of antihistamines occurred in non-sedating and low-sedating products. Between 1997 and 1999 the market share for the top three of these products Claritin, Allegra and Zyrtec grew from 80 percent to 88 percent. Not coincidentally, according to IMS HEALTH and Competitive Media Reporting, DTC advertising for just these three products was more than $224 million in 1999, with the market leader Claritin accounting for $123 million of this total. Antihyperlipidemics continued to be the second fastest growing class in 1999, rising 18.1 percent to 0.32 prescriptions PMPY. Increased use of these products is due not only to evidence showing that their use reduces mortality, but also to intense marketing, particularly in the form of DTC advertising. IMS HEALTH and Competitive Media Reporting estimates that in 1999 DTC advertising for Zocor and Lipitor was $90.5 million. Lipitor, introduced in 1997, has eroded the market share of the other major products in this class, becoming the market leader with a 43.9-percent share in PMPY utilization of common antidepressant drugs continued to grow in 1999, rising 11.3 percent to 0.46 prescriptions PMPY. As the sixth fastest-growing class in terms of common drug use, the antidepressant class maintained its status as the second most-used class of common drugs in As has been the case over the past several, reduction in the stigma associated with 7
10 Table 2: Utilization of Common Drugs of Top 25 Therapy Classes Ranked by 1999 Rxs PMPY Previous Year Selected Year Therapy Class Rxs PMPY Rxs PMPY % Change Antihypertensives % Antidepressants % Estrogens % Narcotic Analgesics % Cough/Cold % Gastrointestinals % Antihyperlipidemics % Penicillins % Oral Contraceptives % Antiasthmatics % Antidiabetics % Dermatologicals % Antihistamines % Calcium Blockers % Diuretics % Anti-Rheum (NSAIDS) % Beta Blockers % Thyroid % Macrolides % Antianxiety Agents % Cephalosporins % Decongestants % Ophthalmic Products % Anticonvulsants % Corticosteroids % Other % Total % depression, together with greater public awareness of depressive symptoms, resulted in more people obtaining medical care in the form of drug therapy. In addition, the availability of easier-to-dose, lower-toxicity, better-tolerated selective serotonin reuptake inhibitors (SSRIs) and selective norepinephrine reuptake inhibitors (SNRIs) has enhanced the treatment of depression. Increased utilization of these drugs also reflects new indications for antidepressants. The use of common antidiabetic drugs increased by 8.1 percent to 0.28 PMPY in 1999 a somewhat lower rate of growth compared to the 11.5 percent rise in The continued rise in the use of this class is attributable to the emphasis on aggressive management of diabetes, as well as to the availability of newer oral products such as Glucophage, which increased its market share from 21.5 percent in 1998 to 26 percent in As in 1998, antihypertensives continued to have the highest utilization in This class, consisting of angiotensin converting enzyme (ACE) inhibitors, angiotensin receptor blockers (ARBs), vasodilators and combination products, grew by 8.5 percent in 1999 to 0.51 prescriptions PMPY. This strong growth pattern will likely continue as the population ages. Most heavily prescribed in this class were the ACE inhibitors. This growth may be attributed to the perception that ACE inhibitors have superior efficacy and better side-effect profiles than other kinds of drug products 8
11 used to treat hypertension. In addition, new indications for use of ACE inhibitors have added to their increasing popularity. Other classes of cardiac drugs show mixed results for The use of calcium channel blockers, for example, continued to decline, dropping to 0.7 PMPY. Diuretics increased in use by a modest 6.8 percent, and beta blocker use increased by 7.2 percent. Diuretics and beta blockers are the recommended first-line agents for uncomplicated hypertension. Gastrointestinal (GI) drug use rose by 9.7 percent PMPY in 1999 despite heavy marketing of several OTC GI products previously available only as prescription drugs. Most of the rise in prescribed GI drugs came from the use of proton pump inhibitors (PPIs), Prilosec and Prevacid. The manufacturers of these products have effectively used DTC advertising to help increase their combined market share from 36.2 percent in 1997 to 55.5 percent in The cost of DTC advertising for Prilosec alone was $79.5 million in The use of narcotic analgesics grew by 8.3 percent PMPY in The 1999 common drug use rate of 0.38 PMPY placed narcotic analgesics as the fourth most widely used class of drugs. In the past, narcotics were used most often to treat terminally ill patients and patients with severe, short-term pain such as post-operative pain. Recently, pain management strategies have become more aggressive, particularly for non-life threatening conditions, such as lower back pain. With a growing number of invasive procedures being performed in the outpatient setting, more narcotic analgesics are being administered in ambulatory settings. Additionally, more terminally ill patients are living longer and, therefore, are in need of more pain-killing medications. Utilization of common drugs in several classes of drugs pertaining to women s health grew in Increases were seen in the use of estrogens, thyroid replacement products, oral contraceptives and miscellaneous endocrine agents. The utilization of estrogens, commonly used to treat postmenopausal symptoms and to prevent osteoporosis, grew by 4.7 percent in 1999, maintaining its position as the third most widely prescribed class of drugs. This modest increase in utilization may reflect growing awareness of the possible link between estrogen use and increased risk of breast cancer. Also, the popularity of newly introduced products like Evista, an estrogen-like product classified as a miscellaneous endocrine, eroded some of the estrogen market. In 1999, PMPY utilization of thyroid replacement products rose by 8.3 percent, somewhat more than the 5.5-percent increase that this class experienced between 1997 and The growth rate in the use of oral contraceptives was 6.8 percent in To a large degree, utilization of oral contraceptives reflects changes in plan design regarding coverage of oral contraceptives. Additionally, growing political pressure to mandate the coverage of these drugs is being exerted in many states. The use of common decongestants, a group consisting primarily of nasal steroids, rose by 8.1 percent to 0.14 prescriptions PMPY in These drugs are used to alleviate allergy symptoms. This class includes many of the popular anhistamines in combination with decongestants (Claritin D and Allegra D). DTC advertising for antihistamines may have had an indirect effect on the utilization of cough and cold products. After declining in use in 1998, prescriptions for cough and cold products rose 12.9 percent, making it the fifth fastest growing class. Use of common drugs in the NSAID class continued to decline in However, the reasons for the declines in 1998 and 1999 are probably quite different. In 1998, the decline in common NSAID use was likely due to the availability of OTC products people using OTC products rather than prescription products. Conversely, the 8.7-percent decrease in common NSAID prescriptions in 9
12 1999 was largely attributable to the introduction of two new cyclo-oxygenase 2 (COX-2) inhibitors, Celebrex and Vioxx. These agents, classified as new drugs in this analysis, have somewhat lower rates of GI distress than older NSAID products. Introduced in 1999, Celebrex and Vioxx together captured 18.9 percent of the NSAID market. After growing by only 3.6 percent in 1998, the use of drugs in the macrolide antibiotic class shot up by 13.2 percent in 1999 to 0.20 prescriptions PMPY. The continued rise in the use of this drug class resulted from the increased reliance on macrolides for treating strains of bacteria that are resistant to other antibiotics, as well as from their role in treating H. pylori infection. With the growing problem of bacterial resistance, especially S. pneumoniae, many physicians are initiating therapy with broader spectrum antibiotics, as evidenced by the modest 2.5-percent increase in PMPY utilization of penicillins and the 1.4-percent decline in the use of cephalosporins. Finally, after declining by 0.5 percent between 1997 and 1998, the PMPY use of common antiasthmatic drugs increased by 5.1 percent in The continued relatively stable use of this drug class is somewhat surprising given the emphasis that has been placed on asthma control in recent and the central role that prescription drug therapy plays in that control. Figure 3: Percent Increase of Common Drug AWP Per Prescription Cost Change Attributable to Price, Units, Therapeutic Mix and Strength Mix % Units 27.7% Price 61.8% Strength Therapeutic Mix 8.4% AWP INGREDIENT COST PER PRESCRIPTION Overall, increases in the AWP ingredient costs per prescription for common drugs were responsible for half of overall prescription drug expenditures between 1998 and However, as noted previously, the relative contributions of utilization and cost per prescription to cost change vary significantly across therapy classes. Components of the trend in the cost per prescription for common drugs are: Inflation (AWP price increases per unit moderated by the availability of less expensive generic equivalents for branded products) Therapeutic mix (changes in the mix of chemical entities within and across therapeutic classes) Strength mix (changes in the mix of strengths and dosage forms of existing chemical entities) Units (the number of units dispensed per prescription) 10
13 Inflation (price), the number of units dispensed and the two types of mix contributed somewhat unevenly on an annual basis over the period examined (see Table 1 and Figure 3). Between 1998 and 1999 for common drugs, inflation had by far the greatest effects on the AWP ingredient cost per prescription, followed by therapeutic mix, number of units per prescription and strength mix. The contributions of these factors to the overall increase in the AWP per prescription for common drugs are described below. INFLATION Inflation reflects the AWP that manufacturers set for each unit of their product. The 5.4 percent unit price increase in common drugs between 1998 and 1999 continued a pattern of extraordinarily high increases that began in 1998 when inflation was 5.1 percent. In the period from 1993 through 1997, inflation ranged from 1 percent-3.3 percent. During this five-year period, prescription drug inflation was at its lowest point in , a time when healthcare reform and the potential for government regulation of drug prices were being hotly debated. After healthcare reform died, the inflation rate rose. Table 3: CPI for Selected Major Categories, % Change % Change % Change % Change Food 3.3% 2.6% 2.2% 2.1% Housing 2.9% 2.6% 2.3% 2.2% Fuels and Other Utilities 3.1% 2.6% -1.8% 0.2% Household Furnishings and Operations 1.4% 0.6% 1.0% 0.1% Apparel and Upkeep -0.2% 0.9% 0.1% -1.3% Transportation 2.8% 0.9% -1.9% 2.0% Medical Care 3.5% 2.8% 3.2% 3.5% Prescription drugs 3.4% 2.6% 3.7% 5.7% Medical Care Services 3.7% 2.9% 3.2% 3.4% All Commodities 2.6% 1.4% 0.1% 1.8% All Commodities less Food 2.2% 0.6% -1.0% 1.5% Durables 1.1% -0.5% -0.9% -1.3% Nondurables 3.0% 2.0% 0.3% 2.9% Energy 4.7% 1.3% -7.7% 3.6% Grand Total of All Items 3.0% 2.3% 1.6% 2.2% Source: Consumer Price Index-All Urban Consumers. Washington D.C.: Bureau of Labor Statistics, [Cited 2000 March 01]. Available from To put the magnitude of these inflationary increases in perspective, the Consumer Price Index (CPI) for selected major expenditure categories was examined (see Table 3). Although the U.S. Department of Labor defines inflation somewhat differently than this analysis, the patterns of annual rate increases since 1995 in prescription drugs are the same increasing in 1996, dropping in 1997, then rising again in 1998 and According to Department of Labor statistics, the inflation rate for prescription drugs ranked the highest among the major consumer categories analyzed in both 1998 and In 1999, the prescription drug inflation rate was 5.7 percent, with the next highest inflation rate being medical care at 3.5 percent. 11
14 Based on Express Scripts data, the rate of inflation of 5.4 percent accounted for almost one-third of the overall 17.4-percent trend in PMPY AWP Cost (see Table 1). An examination of possible factors influencing the 5.4 percent inflation rate was conducted to identify whether the high inflation rate was specifically and obviously attributable to particular factors or concentrated in isolated therapeutic classes. Analysis of Brand and Generics: We found that the inflation increase occurred among both generic and brand products (see Table 4). The inflation rate for generic products between 1998 and 1999 was 7 percent, slightly above the 6.9-percent increase experienced between 1997 and After rising 5.7 percent between 1997 and 1998, prices for branded products increased 5.8 percent in The top 50 common branded drugs, ranked by prescriptions filled, had price increases anywhere from 0 percent-15.6 percent between Dec. 31, 1998 and Dec. 31, 1999 (see Table 5). The seeming anomaly of a 5.8-percent increase in brand prices and a 7-percent increase in generic prices resulting in a 5.4-percent increase for all products reflects the fact that our inflation rate also captures cost changes resulting from the shift from branded products to their generic equivalents. The move to generics somewhat moderates the inflation rate because generics are usually less expensive than their brand equivalents. Analysis of Key Variables by the Top 25 Therapy Classes: We then explored whether there was a noteworthy relationship by therapy class between the percentage of total prescriptions, the percent change in PMPY prescription utilization, the AWP cost per prescription, or the percent of generic prescriptions and inflation rate. Figures 4-7 present the inflation rate against each of these variables. As can be seen, no meaningful relationships were apparent. Analysis of Specific Therapy Classes: Additional analyses were conducted for therapy classes with the largest price increases and for antidepressants. Only two of these classes (narcotic analgesics and ophthalmic products) were new to the top-five therapy classes ranked by change in price between 1998 and The top-ranking class, thyroid, had a 10.9-percent increase in prescription cost between 1998 and The price increase followed the 12.2-percent increase from Both the brand and generic products had large increases in average wholesale price per unit. Synthroid, a brand-name product, had a 64.4-percent market share within the thyroid therapeutic class. The manufacturer of Synthroid increased the AWP per unit of this medication two times from Dec. 31, 1998-Dec. 31, 1999, resulting in a 9.4-percent increase in the price per unit. Levoxyl, a generic equivalent of Synthroid, had a majority of the 31.6-percent generic market share. The price of Levoxyl was increased twice during the time period, resulting in a 19.1-percent price increase. Although the shift in utilization from the expensive brand products to less expensive generic equivalents helped to mitigate the inflation rate, the large increase in the price per unit of both the brand and generic products placed the thyroid class in the first place for price increases at 10.9 percent. A 10.6-percent price increase moved the narcotic analgesic class from eighth ranked between 1997 and 1998 to second ranked for change in price between 1998 and The increase in generic pricing had the greatest impact on the overall inflation rate in this class. Generic products accounted for 77.5 percent of narcotic analgesic utilization. Of the 77.5 percent generic market share, hydrocodone w/acetaminophen had a 46.5 percent share. The manufacturer of the most commonly used form of hydrocodone w/acetaminophen, which had 17.5 percent of the market share of this product, had not 12
15 Figure 4: Percentage Change in Price Ranked by Percent of 1999 Total Rxs 12% % Change in Price % of Total Rxs 7% 10% 6% Percentage Change in Price 8% 6% 4% 2% 0% Antihypertensives Antidepressants Narcotic Analgesics Estrogens Cough/Cold Gastrointestinals Antihyperlipidemics Penicillins Oral Contraceptives Antiasthmatics Antidiabetics Figure 5: Percentage Change in Price Ranked by Percentage Change in PMPY Rxs Dermatologicals Antihistamines Calcium Blockers Diuretics Anti-Rheum (NSAIDS) Beta Blockers Thyroid Macrolides Antianxiety Agents Cephalosporins Decongestants Ophthalmic Products Anticonvulsants Corticosteroids 5% 4% 3% 2% 1% 0% Percent of 1999 Total Rxs 12% % Change in Price % Change in PMPY Rxs 12% 9% Percentage Change in Price 10% 8% 6% 4% 2% 0% Antihistamines Antihyperlipidemics Macrolides Anticonvulsants Cough/Cold Antidepressants Gastrointestinals Thyroid Antihypertensives Narcotic Analgesics Decongestants Corticosteroids Beta Blockers Oral Contraceptives 13 Diuretics Antidiabetics Antiasthmatics Estrogens Antianxiety Agents Ophthalmic Products Penicillins Dermatologicals Calcium Blockers Cephalosporins Anti-Rheum (NSAIDS) 6% 3% 0% -3% -6% -9% -12% -15% Percentage Change in PMPY Rxs
16 Figure 6: Percentage Change in Price Ranked by AWP Cost per Rx 12% % Change in Price Selected Year AWP/Rx $120 10% $100 Percentage Change in Price 8% 6% 4% 2% 0% Gastrointestinals Antihyperlipidemics Anticonvulsants Antidepressants Calcium Blockers Antihistamines Antidiabetics Anti-Rheum (NSAIDS) Figure 7: Percentage Change in Price Ranked by Percent of Generic Rxs 12% Cephalosporins Antiasthmatics Decongestants Dermatologicals Macrolides Antihypertensives Antianxiety Agents Ophthalmic Products Beta Blockers Oral Contraceptives Cough/Cold Narcotic Analgesics Estrogens Penicillins Diuretics Thyroid Corticosteroids % Change in Price 1999 % Generic Rxs $80 $60 $40 $20 $0 100% AWP Cost per Rx 10% 80% Percentage Change in Price 8% 6% 4% 2% 0% Corticosteroids Diuretics Narcotic Analgesics Antianxiety Agents Beta Blockers Penicillins Anti-Rheum (NSAIDS) Cough/Cold Cephalosporins Antiasthmatics Ophthalmic Products Thyroid Dermatologicals Gastrointestinals Anticonvulsants 14 Calcium Blockers Antidepressants Antidiabetics Macrolides Estrogens Antihypertensives Oral Contraceptives Antihistamines Antihyperlipidemics Decongestants 60% 40% 20% 0% Percent of Generic Rxs
17 changed the price of this product since Oct. 1, The second- and third-ranked hydrocodone w/acetaminophen products, which are produced by the same manufacturers, had a combined market share of 24.5 percent of the hydrocodone w/acetaminophen market. The price for the second-ranked product remained constant, while the third-ranked product increased in price by more than 60.8 percent between the end of 1998 and the end of Acetaminophen w/codeine had 16 percent of the generic market share within the class. The manufacturer of the most commonly dispensed form of acetaminophen w/codeine, after increasing the price by 70 percent in 1998, did not increase the price of their product in The majority of the generic products within this class had price increases ranging from 0 percent-66 percent between the end 1998 and the end of The shift between brands and their generic equivalents helped to slightly minimize the impact of these large price increases. In addition to the large price increases among generics, the most frequently dispensed branded product, Ultram, which ranked second in terms of filled prescription in this class and held 7.1 percent of the market, had a 9.1 percent increase in price per unit between Dec. 31, 1998 and Dec. 31, The ophthalmic product class moved up from a ranking of 12th in 1998 to third with a 9.8-percent increase in price between 1998 and The primary factor contributing to cost increase within this class was the price increase of brand products. The brand products, with a 60.1-percent market share within this class, exhibited an 11.7-percent increase in price (see Table 4). The most commonly used brand name products within the class Xalatan, Tobradex, Patanol, Alphagan, Timoptic-XE and Ciloxan had a combined market share of 34 percent. Among these products, Xalatan, Alphagan and Ciloxin all had one price increase in 1999, each resulting in a total price increase of less than 6 percent. The other three products, Tobradex, Patanol, and Timoptic-XE, each had two price increases and at least a 15-percent total price increase in The generic ophthalmic products, with a 40-percent market share, increased in price by 5.8 percent overall between 1998 and The same manufacturer of the three most commonly prescribed generic products in this class polymyxin B sulf/trimethopriate, tobramycin sulfate 0.3% and sulfacetamide sodium held greater than a 70-percent share of the generic market for these products in This manufacturer did not increase the price of these products in 1999, although sulfacetamide sodium was increased by 8.3 percent in Many other generic manufacturers followed the market leader and did not raise their prices in 1999 either, preferring to hold at prices increased in 1998 or in previous. The unit-price increase for estrogen replacement therapy increased by 8.9 percent between 1998 and This is subsequent to an 8.7-percent increase between 1997 and The increase in price of branded products was a contributing factor to the overall price increase of this therapeutic class. Brand products, which had 89.4 percent of the market share within this class, had a 9.7-percent increase in unit price. Generic products increased in unit price by only 2.7 percent. Premarin and Prempro, which were the two most commonly prescribed branded products within this class, both had 12.1-percent increases in the price per unit. Both products are made by the same manufacturer, which increased the AWP unit price twice for both products between December 1998 and December This pattern of multiple increases is consistent with the pattern seen between December 1997 and December Only one estrogen product in the top 10, Estradiol 1mg, had a percentage increase in price per unit of less than 10 percent. Cenestin, which was new to the market, was priced at $0.52 per unit, just a few pennies below its primary competitor, Premarin. Within the estrogen replacement therapy class, the shift from brand medications to their less expensive generic equivalents kept the unit price increase slightly lower overall at 8.9 percent, compared with the 9.7-percent price rise of brand name products. 15
18 Rounding out the top-five therapy classes in terms of increase in price were the dermatological products. The 8.4-percent increase in price for dermatological products was after the 8.1-percent increase between 1997 and The primary factor contributing to the increase in the unit price of the dermatological class was the 8-percent-9-percent overall increase in price of both brand and generic products. Of the top-15 utilized dermatological products, all but one, Differin 0.1%, had at least two price changes from Dec. 31, 1998 to Dec. 31, The acne drugs, Accutane (27.8%), Cleocin T (16.5%) and Benzamycin (23.5%) all had well-above average price per unit increases in These increases followed the 18.8-percent, 12.0-percent and 5.8-percent increases in price, respectively, that each of these products had between the end of 1997 and the end of Minimizing the impact of the price increase of the dermatological products was the shift in the use of brand name products to their less-expensive generic equivalents. Table 4: Utilization and Price Changes of Top 25 Therapy Classes Ranked by % Change in Price Price % Change Price % Change Price % Change Therapy Class Generic Products Branded Products All Products Thyroid 15.1% 11.3% 10.9% Narcotic Analgesics 20.0% 6.5% 10.6% Ophthalmic Products 5.8% 11.7% 9.8% Estrogens 2.7% 9.7% 8.9% Dermatologicals 9.5% 8.8% 8.4% Decongestants 9.1% 7.3% 7.3% Antidiabetics 6.4% 7.4% 6.9% Diuretics 8.5% 5.5% 6.5% Antiasthmatics 0.2% 9.9% 6.4% Antidepressants 31.3% 4.7% 6.2% Oral Contraceptives 25.6% 5.0% 5.9% Antianxiety Agents 5.9% 7.2% 5.3% Anticonvulsants 0.6% 6.2% 4.8% Antihistamines 11.9% 4.7% 4.7% Penicillins 0.8% 5.8% 4.2% Macrolides 1.9% 4.2% 4.1% Corticosteroids 5.7% 9.2% 4.0% Cough/Cold 9.8% 5.1% 3.9% Cephalosporins -1.2% 7.4% 3.6% Antihypertensives -5.8% 4.8% 3.5% Gastrointestinals -0.4% 4.6% 3.2% Antihyperlipidemics 0.0% 3.2% 2.9% Anti-Rheum (NSAIDS) 2.2% 5.1% 2.8% Calcium Blockers 2.4% 4.1% 2.7% Beta Blockers 3.5% 6.1% 2.5% Other 14.8% 6.0% 6.8% Total 7.0% 5.7% 5.4% Given that the antidepressant therapy class was ranked second in both PMPY cost and PMPY utilization for 1999, closer analysis of the class with a 6.2-percent increase in unit price was conducted as well. In the antidepressant therapeutic class, the price increase was attributed to both the unit price increases of brand and generic products. The branded products, which had 77 percent of the market share within the class, had a 4.7-percent price increase between
19 and The SSRI branded products Prozac, Zoloft, Paxil and Celexa had 56.1 percent of the market share within this class. Prozac, the only SSRI with multiple increases in price in 1999 and, at 5.6 percent, the largest total price increase, is the first SSRI scheduled to go off patent in The manufacturer may be increasing the price at a significant rate in anticipation of a loss in revenue due to patent expiration. The manufacturer of Paxil increased the price of the product once from the end of 1998 to the end of 1999, resulting in a 4.5-percent increase in unit price. In contrast, Zoloft had an increase in price per unit of 2.6 percent. Celexa, the newest of the SSRI products, was priced lower than the other SSRI products and subsequently gained 4.8 percent of the market share in The Celexa price increase was consistent with the other SSRIs. Another branded antidepressant with significant price increases was Wellbutrin SR. The non-ssri indicated for depression and used off-label for smoking cessation had two price increases in 1999, resulting in a 14.9-percent increase. The unit price for generic products within the class increased by 31.3 percent. The market share of the most commonly used generic, amitriptyline HCL, was 9.6 percent in The top-two manufacturers of amitriptyline HCL had price increases of 68.1 percent and 243 percent. The large increase in price per unit caused the average cost per prescription of amitriptyline HCL to increase by more than 100 percent between 1998 and THERAPEUTIC MIX AND STRENGTH MIX Therapeutic mix is the use of relatively more expensive or less expensive drugs within and across therapy classes. Strength mix refers to cost impacts caused by changing to more or less expensive strengths of the same drug or the introduction of new strengths of existing products. The therapeutic mix trend among 1999 s top-25 classes by utilization was 2.4 percent, lower than the 3.2 percent seen last year. The difference is primarily due to a relative increase in utilization in classes with less expensive drugs. For instance, two of the classes with the lowest cost per prescription cough and cold, and penicillins experienced utilization trend 14.9-percent and 9.1-percent higher, respectively, than their trend last year. Strength mix, still one of the lowest contributors to trend, did increase 0.75 percent from 1998 to 1999, marginally higher than the 0.6-percent contribution from 1997 and Taken together, therapeutic and strength mix accounted for 36 percent of the overall cost increase. Among the top-25 classes, the largest changes in therapeutic mix occurred in the antidiabetic and NSAID classes. In 1998, antidiabetics lead all classes with a 10.5-percent increase, largely due to the rise in popularity of Rezulin, the most expensive drug in the class. In 1999, safety concerns that eventually resulted in Rezulin s removal from the market and continuing marketshare growth of less expensive antidiabetic agents, such as Glucophage, resulted in a decline of 1.2 percent in therapeutic mix trend. This decline was somewhat offset by a relatively high strength mix rise of 2.3 percent, primarily due to the introduction of 1000mg Glucophage tablets in While less expensive than Rezulin, costs for the new strength of Glucophage were still about $30 per prescription more than the class average cost. In contrast to trends affecting antidiabetics, the NSAID class experienced a dramatic increase in therapeutic mix from a decline of 1.6 percent in 1998 to a rise of 7.8 percent in In large part, the increase resulted from growing use of expensive disease-modifying anti-rheumatic drugs (DMARDs), such as Arava and Enbrel, both introduced late in Per prescription costs of Arava were $250, and per prescription costs of Enbrel were slightly over $1,000. Some plans 17
20 Table 5: Price Changes for Top 50 Common Drugs # of Price Changes Unit Price on Unit Price on Percent Between 12/31/1998 Product12/31/ /31/1999 Change and 12/31/ CLARITIN 10MG $2.19$ % 1 2 LIPITOR 10MG $1.88 $ % 0 3 ZITHROMAX 250MG $6.39$ % 1 4 PREMARIN 0.625MG $0.51 $ % 2 5 PROZAC 20MG $2.50 $ % 2 6 PREMPRO $0.77 $ % 2 7 PRILOSEC 20MG $3.87 $ % 1 8 ORTHO TRI-CYCLEN $0.98 $ % 2 9PREVACID 30MG $3.59$ % 1 10 GLUCOPHAGE 500MG $0.56 $ % 2 11 FLONASE 50MCG $2.89$ % 2 12 ZYRTEC 10MG $1.81 $ % 1 13 LIPITOR 20MG $2.90 $ % 0 14 ZOLOFT 50MG $2.21 $ % 1 15 ALLEGRA 60MG $0.92 $ % 1 16 PAXIL 20MG $2.23 $ % 1 17 ZOLOFT 100MG $2.28 $ % 1 18 PREMARIN 1.25MG $0.71 $ % 2 19CLARITIN-D 12 HOUR 120-5MG $1.23 $ % 1 20 BIAXIN 500MG $3.26 $ % 2 21 CIPRO 500MG $3.99 $ % 1 22 NORVASC 5MG $1.29$ % 1 23 PRAVACHOL 20MG $2.17 $ % 1 24 ZESTRIL 10MG $0.91 $ % 1 25 WELLBUTRIN SR 150MG $1.33 $ % 2 26 TRIPHASIL $0.98 $ % 1 27 CLARITIN-D 24 HOUR MG $2.47 $ % 1 28 ZESTRIL 20MG $0.98 $ % 1 29ORTHO-NOVUM $0.98 $ % 2 30 NORVASC 10MG $2.17 $ % 0 31 HUMULIN N 100U/ML $2.08 $ % 2 32 ULTRAM 50MG $0.71 $ % 2 33 AMBIEN 10MG $2.03 $ % 1 34 SYNTHROID 100MCG $0.28 $ % 2 35 DIFLUCAN 150MG $11.24 $ % 1 36 ZOCOR 20MG $3.66 $ % 1 37 AUGMENTIN MG $4.54 $ % 1 38 SEREVENT 21MCG $4.49$ % 2 39PREMARIN 0.9MG $0.61 $ % 2 40 K-DUR 20MEQ $0.46 $ % 2 41 ALLEGRA-D MG $1.03 $ % 1 42 NASONEX 50MCG $2.84 $ % 2 43 TOPROL XL 50MG $0.56 $ % 1 44 CELEXA 20MG $1.93 $ % 1 45 ORTHO-CYCLEN $0.98 $ % 2 46 LO/OVRAL MG $1.05 $ % 1 47 SYNTHROID 125MCG $0.33 $ % 2 48 GLUCOTROL XL 10MG $0.66 $ % 1 49SYNTHROID 50MCG $0.25 $ % 2 50 ACCUPRIL 20MG $0.95 $ % 1 18
21 Table 6: Mix Changes of Top 25 Therapy Classes Therapeutic Mix Strength Mix Total Mix Therapy Class % Change % Change % Change Penicillins 7.99% 3.16% 11.16% Anticonvulsants 8.76% 0.34% 9.10% Anti-Rheum (NSAIDS) 7.82% -0.40% 7.42% Narcotic Analgesics 5.56% 1.82% 7.38% Antiasthmatics 5.01% 0.98% 5.99% Gastrointestinals 4.78% 0.32% 5.10% Ophthalmic Products 3.97% -0.05% 3.92% Dermatologicals 2.94% 0.74% 3.68% Cephalosporins 1.09% 0.82% 1.91% Antianxiety Agents 0.26% 1.39% 1.65% Beta Blockers 1.75% -0.12% 1.64% Cough/Cold 0.88% 0.72% 1.60% Estrogens 0.91% 0.40% 1.30% Corticosteroids 1.24% 0.06% 1.30% Antidiabetics -1.25% 2.28% 1.03% Macrolides 0.40% 0.48% 0.88% Decongestants 1.03% -0.33% 0.69% Antihyperlipidemics -2.11% 2.78% 0.67% Calcium Blockers -0.14% 0.77% 0.62% Antidepressants -0.18% 0.53% 0.35% Oral Contraceptives 0.06% 0.18% 0.24% Antihistamines -0.15% 0.28% 0.13% Antihypertensives -0.39% 0.25% -0.14% Thyroid 0.14% -0.43% -0.29% Diuretics -2.42% 0.34% -2.07% Other 2.76% 0.63% 3.38% Total 2.28% 0.76% 3.04% cover Enbrel under the medical benefit. Despite the fact that both drugs are generally considered second-line treatment for pain and joint swelling associated with rheumatoid arthritis (RA), they are showing dramatic growth in use. Enbrel, in particular, has been boosted recently by its approval for the treatment of juvenile RA in addition to its previous indication for RA in adults. Among the top-10 classes of drugs ranked by total mix change in 1999, seven of them penicillins, anticonvulsants, narcotic analgesics, antiasthmatics, gastrointestinals, ophthalmic products and dermatologicals were also among the top 10 in In most cases, these trends merely reflect a continued increase in market share of the same drugs seen last year. Among penicillins, Augmentin increased market share by 2.5 percent in a class consisting of approximately 80-percent generics. In addition, while ranking second in therapeutic mix, penicillins also led all other classes in strength mix due to the introduction of 200mg and 400mg chewable tablets and suspension formulations for Amoxil in The increase in anticonvulsant cost due to therapeutic mix was driven by a dramatic 5.3-percent rise in the market share of Neurontin. At $ per prescription, Neurontin s cost was almost twice the class average. Some of this increased utilization may be due to recent studies showing Neurontin as effective treatment for severe pain associated with diabetic nerve damage and with shingles. 19
22 Similar to the effect of one product on the entire class of anticonvulsants, narcotic analgesics experienced well above average mix increase due to a higher market share for OxyContin, which was much more expensive than the class average. While Oxycontin increased by only 0.8 percent, at $ its average per-prescription price was almost eight times higher than the class average. Recent efforts by manufacturers to educate prescribers, dispensers and patients about the use of narcotics in non-terminal, non-institutional pain management may be responsible for at least part of the increased use of the more expensive, more powerful narcotics. In the GI and antiasthmatic classes, newer drugs continue to gain market share at the expense of older, less expensive therapies. Within the GI class, proton pump inhibitors (PPIs) increased their market share by 9.3 percent, only slightly less than the 10.3-percent jump seen last year. Decreasing at the expense of PPIs were histamine-2 receptor antagonists (H2RAs), which declined by 7.5 percent to 31.6 percent of the GI market. Increases in the antiasthmatic class were led by one product, Singulair, which increased its market share from 2.2 percent to 6.5 percent. Introduced in 1998, Singulair is one of the leukotriene modifier agents that control persistent asthma, with the additional benefit of once-a-day dosing in tablet formulation and an indication for use in children. Additional newer products, such as Flovent and Serevent asthma controllers, not relievers also experienced growth but at a slower rate than Singulair. Ophthalmic products experienced an increase of almost 4 percent due to mix. Two types of ophthalmic drugs experienced the most market share movement from 1998 to 1999, those to treat glaucoma and allergic conjunctivitis. Among the products used to treat glaucoma are Xalatan, Trusopt and Cosopt. Xalatan, at $61.93 per prescription, was slightly less than twice the average price of all drugs within the class. As the most frequently dispensed brand in this class, Xalatan s 1-percent increase in market share had a significant impact on mix. Trusopt utilization declined while use increased for Cosopt, a product combining the active ingredient in Trusopt with the ophthalmic beta blocker, timolol. A prescription for Cosopt, however, was about $26 more expensive than one for Trusopt not quite as much as separate Trusopt and generic timolol scripts would cost. The result was a net increase in the cost per script due to mix. Finally, at 2.3 percent, Patanol increased market share the most of any drug in the class. Since it is used to treat watery, itchy eyes caused by allergies, Patanol may be benefiting from the DTC advertising for allergy medications. Dermatologicals, the last of the classes in the top 10 for mix in both 1998 and 1999, achieved this status largely because Accutane, Dovonex and Aldara, three drugs that cost more than $100 per prescription, all either increased or maintained their 1998 market share. UNITS PER RX Changes in the number of units per prescription accounted for only 0.2 percent of the increase in cost from 1998 to 1999 (see Table 7). This rate was the lowest seen since the inception of the Drug Trend Report. One of the factors driving this component of trend lower was in the antiasthmatic class where there were sharp declines in the use of relievers, such as beta agonists, and modest increases in controllers such as inhaled steroids or the newer leukotriene antagonists. Among classes experiencing an increase in the units trend were narcotic analgesics with more than a 2 percent rise. With the increasing emphasis on pain control as a quality-of-life issue in conditions like fibromyalgia, many drugs in this class are being used to treat non-terminal pain 20
23 for longer time periods. As these drugs have made the transition from short-term to long-term treatment regimens, the number of units per prescription has increased. Dermatologicals also showed a relatively high increase in the number of units per prescription, 2.2 percent, led by two drugs used to treat acne. Both Accutane and Benzamycin may be showing strong growth partly due to the more aggressive treatments of acne. The effects of DTC advertising, particularly with Accutane, may also be prompting more individuals to pursue these types of therapies. The cough/cold and antihistamine classes have consistently shown above-average increases in the number of units in each year of the Drug Trend Report. These classes are dominated by nonsedating antihistamines, either as single agents or as combination products with decongestants. Patients may not be using an antihistamine every day, particularly in non-allergy seasons, but they may still be requesting a full month s supply of that drug. Table 7: Changes in Cost/Rx Due to Changes in Units/Rx , Top 25 Therapy Classes by Rxs in 1999 Therapy Class % Rxs % Change Narcotic Analgesics 4.6% 2.2% Dermatologicals 3.3% 2.2% Cough/Cold 4.5% 1.8% Antihistamines 3.1% 1.5% Antidiabetics 3.4% 1.3% Anti-Rheum (NSAIDS) 3.0% 1.0% Antianxiety Agents 2.2% 0.7% Gastrointestinals 3.9% 0.6% Decongestants 1.7% 0.6% Antidepressants 5.7% 0.4% Penicillins 3.7% 0.3% Oral Contraceptives 3.6% 0.2% Estrogens 5.2% 0.2% Antihypertensives 6.2% 0.1% Macrolides 2.4% 0.1% Calcium Blockers 3.1% 0.0% Cephalosporins 1.9% -0.3% Beta Blockers 3.0% -0.4% Anticonvulsants 1.3% -0.7% Diuretics 3.0% -0.9% Antihyperlipidemics 3.9% -1.2% Thyroid 2.5% -1.4% Ophthalmic Products 1.4% -1.5% Corticosteroids 1.3% -2.1% Antiasthmatics 3.5% -5.6% Other 18.7% 0.3% Total 100.0% 0.2% NEW DRUGS As total drug costs have continued to climb over the past few, the impact of new drugs can be clearly seen. New drugs introduced since 1992 accounted for 40.8 percent of 1999 cost and 25.4 percent of 1999 prescription use (see Figure 8). In 1999, 35 new drugs and five biologic 21
24 agents were approved by the FDA, comparable with the introduction of 30 new drugs and nine biologics in The number of drugs approved in a given year, however, is only one part of the story. Another important factor is whether blockbuster drugs were among the products introduced. In 1997 new drugs accounted for 2 percent of total costs, largely on the strength of Lipitor and Rezulin (see Figure 9). The contribution of all 1997 new drugs to total annual costs rose to 6.5 percent in In this case, the impact of the new drugs was immediate. Sometimes, though, a drug s true influence is not seen for a few due to the timing of the FDA approval. For instance, Enbrel was not approved until November 1998, thereby having little impact on 1998 costs. In 1999, PMPM costs for Enbrel jumped more than 35 percent, exceeding 1999 costs of much more celebrated drugs such as Viagra. In 2000, new drugs introduced in 1998, led by potential blockbusters such as Enbrel, Celexa and Singulair, may be on course to surpass the impact of drugs that were new in several previous. To help put the importance of both blockbusters and release dates into perspective, the top-20 drugs of 1999 are presented in Table 8. Drugs introduced in 1999 accounted for 1.6 percent of the total cost in This percentage is slightly above the average over the previous seven of 1.4 percent for the percentage of new drug contribution to total annual cost in the year of their introduction. One drug, Celebrex, accounted for 62 percent of the total new drug cost. In contrast, Lipitor was only able to account for 0.8 percent of total cost in 1997, the first year it was on the market. Celebrex had great success in its first year for several reasons. First, as the first COX-2 inhibitor on the market, it offered something new pain relief with less GI discomfort. In contrast, Lipitor entered a market already crowded with several established products and had to prove that it was better than the existing products. Secondly, Celebrex was approved on the last day of 1998 which means it had a full first year on the market, unlike Lipitor, which was approved Dec. 17, 1996, but not introduced until April Two additional insulin-sensitizing agents that are in the same class as Rezulin were introduced in These products, Avandia and Actos, are likely to capture much of the market share left by Rezulin s voluntary withdrawal. So far these new products have not exhibited the kind of liver toxicity seen with Rezulin. Nevertheless, it will be up to their manufacturers to restore consumer faith in this class of drugs. Xenical, a new drug to manage obesity, was introduced in A lipase inhibitor, Xenical blocks the absorption of dietary fats. This represents a fundamentally different method of managing obesity than previous anorexiant drugs, including Redux, which work in the brain to reduce appetite. While Xenical does have some unpleasant side effects, such as partial loss of bowel control and oily discharge, it has not been shown to have any of the life-threatening risks that drove Redux from the market. Two products were brought to market in 1999 to treat disorders at opposite ends of the sleep spectrum. Provigil is a non-amphetimine product used to treat the excessive daytime sleepiness of narcolepsy. Sonata, a non-benzodiazepine, is used on a short-term basis to treat insomnia. In the GI class, Aciphex entered the proton pump inhitor (PPI) market previously consisting only of Prilosec and Prevacid. Currently Aciphex has FDA indication for gastric ulcers, duodenal ulcers, gastroesophageal reflux disease and hypersecretory conditions. However, it does not have an indication for H. pylori. It was introduced in August 1999, relatively late to make a big impact 10 New Drug Approvals in 1999, Pharmaceutical Research and Manufacturers of America, January P1. 22
25 on 1999 costs. How successful Aciphex will be in the PPI market remains to be seen. The cost per Aciphex prescription is about $8 less than Prevacid, the least expensive of the established PPIs. Two other products introduced in 1999 worthy of note are products used to treat influenza. Relenza, an inhaled powder, and the oral capsule Tamiflu are both antiviral drugs intended to reduce or shorten the symptoms of flu when taken as directed. The key to their effectiveness is timing. They must be started within two days after flu symptoms begin. Both entered the market after mid-year. While 1999 revenue was a significant factor, the ultimate success of these products will be measured by how accurately patients interpret their flu-like symptoms and how carefully they take the drug within its narrow window of effectiveness. In 1999, two new products were added to the arsenal of drugs available to treat HIV infection. Ziagen is a nucleoside analogue reverse transciptase inhibitor indicated for use in combination with other HIV drugs. Agenerase, a new protease inhibitor, offers the advantage of twice-daily dosing, compared with the three-times-daily dosing for other protease inhibitors. Agenerase is the first protease inhibitor to crack the top 20 new drug list since Crixivan in The new chemical entity Xopenex represents a growing trend among drug manufacturers to create new products by using only the active components of existing drugs. Purified from the asthma drug albuterol, Xoponex is currently available only in a nebulizer formulation, but an oral syrup and an extended-release tablet are currently in clinical trials. Development of purified products is likely to produce new variations of such highly used drugs as Prozac and Claritin in the next few. Cenestin, a new estrogen replacement therapy, was also introduced in Cenestin is a conjugated estrogen product derived from plant sources and intended to compete directly with Premarin. Obtained from the urine of pregnant mares, Premarin currently garners about 46 percent of the estrogen replacement therapy market. As we look ahead five, the number of new drugs that will come to market will increase dramatically. The potential explosion of new drug products is even more dramatic when the current drug pipeline activity is examined. According to SG Cowen, there are 1,051 pipeline products. Of these products, 181 are in preclinical trials, 653 are in phase I, II or III clinical trials, and applications for licenses for an additional 217 products have been filed with the FDA. 11 However, based on our analysis of existing pipeline products, we think very few blockbuster drugs will come to market over the next five. In contrast, after 2004 the size of the new drug pipeline is likely to grow more as new technologies enhance the discovery process. This pipeline will consist of traditional drugs as well as biologics, which are drugs made from living material human, plant or animal. Historically, biologics have consisted primarily of vaccines used to treat relatively rare conditions. However, as advances are made in genetic engineering, new biologics are likely to be developed to treat more common diseases, such as HIV and cancer. In fact, the biologic Enbrel, a genetically engineered protein used to treat rheumatoid arthritis, was introduced in 1998 and has seen widespread use. When the identification and sequencing of the DNA structure is completed in 2003, a myriad of new DNA and protein targets will be discovered. This will allow for the tailoring of medications to different genetic profiles. While such products will not be seen for a number of, the number and therapeutic promise of such innovations are exciting. However, the cost of these technological advances will likely be high. 11 SG Cowen, Pipeline Pulse, March
26 Figure 8: Impact of New Drugs Introduced Since 1992 on 1999 Utilization and Cost 100% Total Existing 80% New 1999 New % New 1997 New % New 1995 New % New 1993 New % % Rxs % Cost Figure 9: Percent of AWP Accounted for by New Drugs % of AWP Cost New in 1999 New in 1998 New in 1997 New in 1996 New in 1995 New in 1994 New in 1993 New in
27 Table 8: Top New Drugs in 1999 FDA Primary PMPY Drug Name Route Approval Date Indication % AWP Cost Cost CELEBREX PO Dec-98 Osteoarthritis 1.0% $3.84 VIOXX PO May-99 Osteoarthritis 0.2% $0.93 AVANDIA PO May-99 Type 2 Diabetes 0.1% $0.33 XENICAL PO Apr-99 Obesity 0.1% $0.23 ACTOS PO Jul-99 Type 2 Diabetes 0.0% $0.12 ZIAGEN PO Dec-98 HIV Infection 0.0% $0.11 PROVIGIL PO Dec-98 Narcolepsy 0.0% $0.09 ACIPHEX PO Aug-99 Erosive GERD 0.0% $0.08 AGENERASE PO Apr-99 HIV Infection 0.0% $0.06 SANDOSTATIN LAR IM Nov-98 Severe Diarrhea 0.0% $0.05 RELENZA IH Jul-99 Influenza A & B 0.0% $0.03 SONATA PO Aug-99 Insomnia 0.0% $0.03 XOPENEX IH Mar-99 Asthma/COPD 0.0% $0.03 TAMIFLU PO Oct-99 Influenza A & B 0.0% $0.03 TEMODAR PO Aug-99 Brain Tumors 0.0% $0.03 MICARDIS PO Nov-98 Hypertension 0.0% $0.02 PLETAL PO Jan-99 Claudication 0.0% $0.02 MERREM IV Jun-96 Bacterial Infection 0.0% $0.02 MIRALAX PO Feb-99 Constipation 0.0% $0.01 CENESTIN PO Mar-99 Estogen Replacement 0.0% $0.01 Top 20 New Drugs 1.6% $6.08 All New Drugs 1.6% $6.13 All Other Drugs 98.4% $ All Drugs 100.0% $ PO Oral IM Injected into Muscle IH Inhaled IV Injected into Vein 25
28 Table 9: Percent of 1999 Cost and AWP Cost/Rx for Top 50 New Drugs Brand Name Year of Introduction % of 1999 Cost 1999 AWP/Rx LIPITOR % $78.60 PREVACID % $ CLARITIN % $66.41 ZOCOR % $ ZOLOFT % $81.44 PAXIL % $77.19 ZITHROMAX % $38.16 GLUCOPHAGE % $57.43 NORVASC % $56.08 CELEBREX % $84.93 IMITREX tablets % $ PREMPRO % $25.91 REZULIN % $ ZYRTEC % $52.40 REBETRON % $1, EFFEXOR % $91.04 ALLEGRA % $51.68 FLONASE % $50.78 NEURONTIN % $ AMBIEN % $55.41 LAMISIL % $ AVONEX ADMINISTRATION PACK % $ CEFZIL % $64.21 SEREVENT % $67.05 RELAFEN % $72.14 FLOVENT % $72.63 CELEXA % $68.13 ROXICODONE % $ LEVAQUIN % $82.94 PROPULSID % $82.80 SINGULAIR % $73.86 FOSAMAX % $66.44 ULTRAM % $49.65 ZYPREXA % $ DAYPRO % $79.34 ACCUTANE % $ ENBREL % $1, ASACOL % $ SPORANOX % $ SERZONE % $73.23 COZAAR % $50.00 HYZAAR % $46.65 VALTREX % $84.64 NASONEX % $50.33 VIOXX % $75.97 RISPERDAL % $ LOTREL % $57.29 IMITREX injection % $ EVISTA % $66.63 ISMO % $44.76 Other 9.29% $82.68 Total 41.66% $
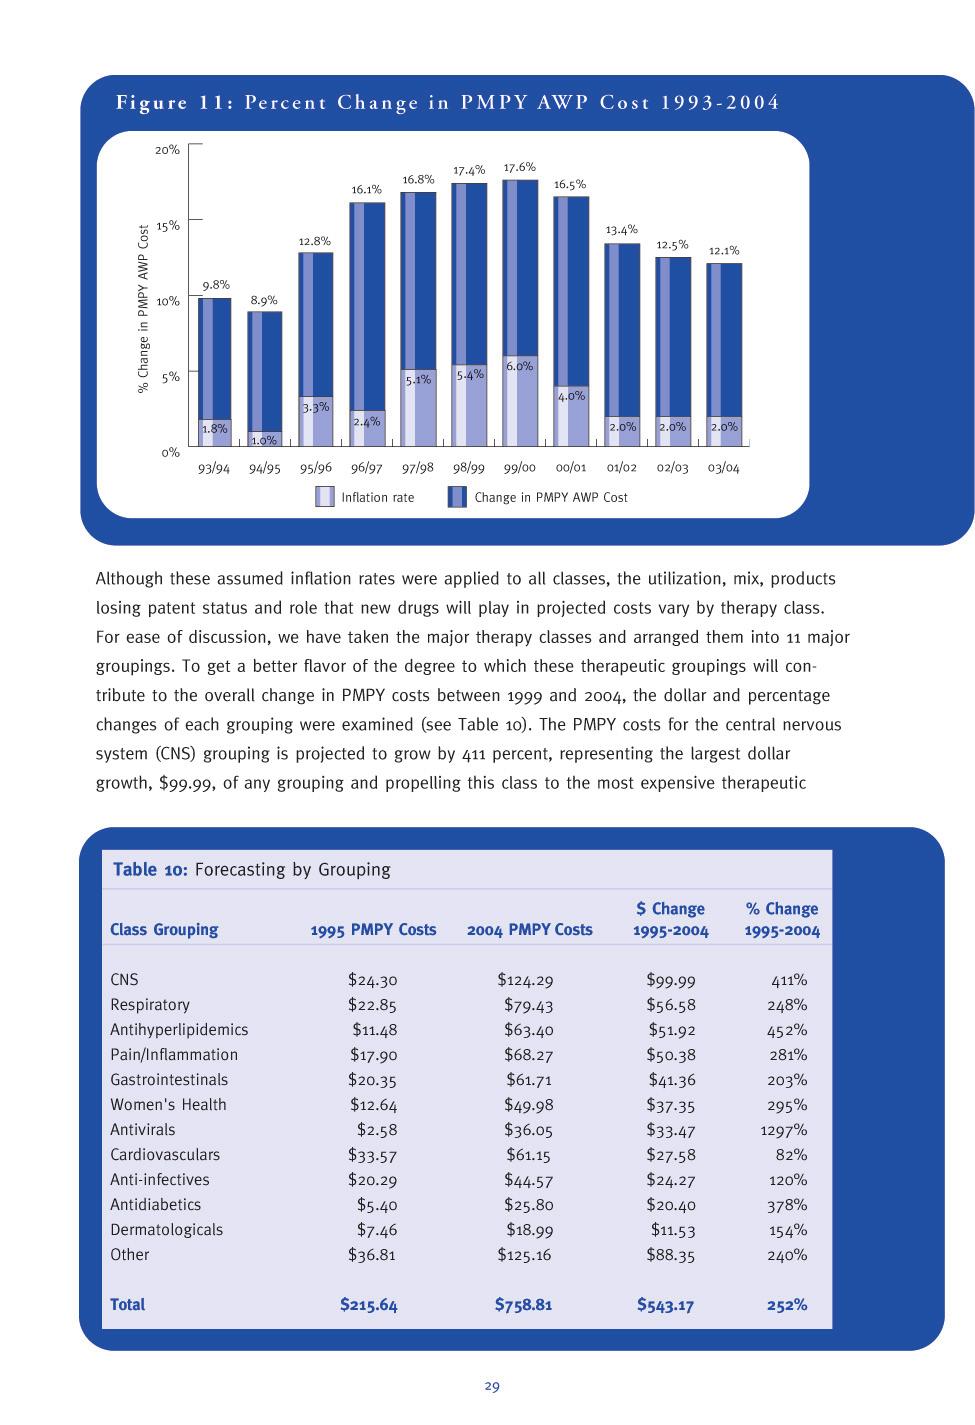
29 DRUG C OST T REND F ORECAST Following a pattern seen since 1995, PMPY AWP prescription drug costs continued to rise at an increasing rate in The 17.4-percent rise in PMPY drug costs between 1998 and 1999 was the highest seen in the seven-year period that we have been monitoring drug costs. In past Drug Trend Reports, specific cost projections were given only for the following year and a range was given for the succeeding four. In this year s Report, specific annual projections for the next five are presented in the aggregate and for major therapy class groupings. These projections suggest that costs will grow by an even higher rate in 2000, before abating somewhat from 2001 through More specifically, Express Scripts projects that drug costs will grow by: 17.6 percent in percent in percent in percent in percent in 2004 Figure 10: Per Member Per Year AWP Costs $800 $759 $700 $600 $530 $601 $677 PMPY AWP Cost $500 $400 $300 $216 $243 $282 $330 $387 $455 $200 $100 $ These projections translate into a near-doubling of PMPY costs over the next five from $ in 1999 to $ in 2004 (see Figure 10). The assumption regarding the inflation rate that will occur in this period is a key factor influencing the magnitude of the projected rates of cost increase. As was discussed in the inflation portion of this Report, inflation for prescription drugs was 5.1 percent in 1998 and 5.4 percent in The CPI for prescription drugs for the first quarter of 2000 relative to the first quarter of 1999 was 5.5 percent, indicating that inflation for 2000 likely will be about 6 percent. However, we do not expect inflation rates to continue at such high levels for the succeeding four largely because the political environment is becoming somewhat hostile toward the pharmaceutical industry. The industry probably will react to this pressure by reducing the level of price increases in much the same way that it did during the healthcare reform debate. 27
30 The presidential campaign and parallel congressional elections have placed a greater emphasis on establishing a Medicare prescription benefit. Both political parties have developed plans to accomplish this goal, acknowledging the political clout of the elderly, particularly in an election year. As this debate has proceeded, greater attention has been paid to the cost of prescription prices in general, as well as to the magnitude of recent price increases. The number and frequency of media stories about the pharmaceutical industry have risen dramatically. Some stories focus on the important role drugs play in treating illnesses and the promise of more drugs to treat previously untreated or under-treated diseases. Other stories are not so favorable toward the industry. These stories have focused on the: Inability of the elderly to pay for much-needed high-cost prescription drugs Substantial differences in drug costs in the United States relative to other countries Size of drug manufacturers profits Various direct and indirect tax subsidies the United States provides to the pharmaceutical industry FTC investigations of some pharmaceutical manufacturers regarding their alleged engagement in unfair practices, including unfair competition in generic pricing and making deals with potential competitors that would keep generic products and companies out of the market. 12 One manifestation of this growing public concern was the recent action taken by the state of Maine. Legislation was enacted creating a council that has the power to set maximum drug prices beginning July 1, 2003, if drug prices exceed council-determined levels. Against this backdrop, we project that these political pressures will result in pharmaceutical manufacturers reducing price increases as the debate over a Medicare prescription drug benefit heightens this fall and next year. This reaction has been translated into the following inflation assumptions: 6 percent in percent in percent in percent in percent in 2004 The relationship between our overall PMPY cost projections and our inflation assumptions is graphically depicted in Figure Mehl, Bernard and Santell, John P. Projecting Future Drug Expenditures; American Journal of Health Systems Pharmacy; Vol 57, Jan. 15, 2000; p
31
32 Table 11: Drug Trends: All Drugs Summary and 2000 Forecast 1998 Previous 1999 Selected 2000 Selected 2001 Estimated Therapy Class Year $PMPY % Change Year $PMPY % Change Year $PMPY % Change Year $PMPY % Change Gastrointestinal $ % $ % $ % $ % PPIs $ % $ % $ % $ % H2RAs $ % $ % $ % $ % Other $ % $ % $ % $ % Central Nervous $ % $ % $ % $ % System (CNS) Antidepressants $ % $ % $ % $ % Anticonvulsants $ % $ % $ % $ % Antianxiety Agents $ % $ % $ % $ % Antipsychotics $ % $ % $ % $ % Hypnotics $ % $ % $ % $ % Antihyperlipidemics $ % $ % $ % $ % Cardiovasculars $ % $ % $ % $ % Antihypertensives $ % $ % $ % $ % Calcium Blockers $ % $ % $ % $ % Beta Blockers $ % $ % $ % $ % Diuretics $ % $ % $ % $ % Pain/Inflammation $ % $ % $ % $ % Anti-Rheum (NSAIDS) $ % $ % $ % $ % Cox-2s $ % $ % $ % $ % Narcotic Analgesics $ % $ % $ % $ % Migraine Products $ % $ % $ % $ % Antidiabetics $ % $ % $ % $ % Oral $ % $ % $ % $ % Insulin $ % $ % $ % $ % Respiratory $ % $ % $ % $ % Antiasthmatics $ % $ % $ % $ % Antihistamines $ % $ % $ % $ % Cough/Cold $ % $ % $ % $ % Decongestants/ $ % $ % $ % $ % Nasal Steroids Dermatologicals $ % $ % $ % $ % Antivirals $ % $ % $ % $ % HIV $ % $ % $ % $ % Herpes $ % $ % $ % $ % Hepatitis $ % $ % $ % $ % Other/Flu$ % $ % $ % $ % Women's Health $ % $ % $ % $ % Estrogens $ % $ % $ % $ % Oral Contraceptives $ % $ % $ % $ % Misc. Endocrine $ % $ % $ % $ % Anti-infectives $ % $ % $ % $ % Macrolides $ % $ % $ % $ % Cephalosporins $ % $ % $ % $ % Penicillins $ % $ % $ % $ % Quinolones $ % $ % $ % $ % 30
33 2002 Estimated 2003 Estimated 2004 Estimated Estimated Year $PMPY % Change Year $PMPY % Change Year $PMPY 2005 % Change PMPY AWP Comments $ % $ % $ % $65.79 $ % $ % $ % $53.30 Growth rate will moderate as market reaches saturation and Prilosec goes off patent $ % $ % $ % $9.35 Utilization will continue to shift to PPIs $ % $ % $ % $3.15 Treatment of IBS will offset decreased use of other drugs $ % $ % $ % $ $ % $ % $ % $90.09 New indications for existing products will drive up costs $ % $ % $ % $29.17 Use of Neurontrin and its successor Pregabalin for pain relief will drive up costs $ % $ % $ % $9.31 Little growth expected because of growing preference for SSRIs for treatment of anxiety $ % $ % $ % $16.12 Increased use of atypicals will drive costs $ % $ % $ % $3.78 Modest increase in use expected $ % $ % $ % $76.08 With aging of population and DTC, expect high growth to continue $ % $ % $ % $60.79 $ % $ % $ % $31.61 Key products going generic will slow growth $ % $ % $ % $15.19 Little additional use of class expected $ % $ % $ % $14.00 Continued important role of class in treatment of hypertention and new use for heart failure $ % $ % $4.53 JNC-6 guidelines for HTN advocate first-line use $ % $ % $ % $75.13 $ % $ % $ % $12.49 Cox-2s eroding market share of brand NSAIDs $ % $ % $35.07 Will continue to bring in new users $ % $ % $ % $16.36 Use will continue to increase as terminal patients live longer and rely on outpatient procedures $ % $ % $ % $11.21 Modest increases expected to continue $ % $ % $ % $28.93 $ % $ % $ % $24.08 Move to more expensive products will fuel growth $ % $ % $ % $4.85 New modes of administration will increase utilization primarily for Type 2 $ % $ % $ % $89.76 $ % $ % $ % $29.21 Utilization grows marginally but use of more expensive products (Accolate, Singulair, Flovent) will lead to double digit growth $ % $ % $ % $34.49 Significant but declining utilization increases $ % $ % $ % $13.93 Modest increases anticipated because of DTC advertising $ % $ % $ % $12.13 Growth to continue due to supported effectiveness of these products $ % $ % $ % $20.89 Price increases will drive class costs $ % $ % $ % $43.82 $ % $ % $ % $5.41 Cost growth will be minimal due to shifts toward less intensive treatment $ % $ % $ % $5.18 Modest growth will continue $ % $ % $ % $2.32 Will grow significantly but impact will partially be reflected in cancer class (Intron A) $ % $ % $ % $30.91 Flu product growth expected due to consumer awareness and possible indication for prevention $ % $ % $ % $59.11 $ % $ % $ % $15.79 Continued modest growth due to aging population $ % $ % $ % $14.96 Expect somewhat more coverage of OCs by plan sponsors $ % $ % $ % $28.37 The availability of new products, coupled with the aging of the population and massive undertreatment of osteoporosis, will lead to substantial utilization growth $ % $ % $ % $49.74 $ % $ % $ % $18.58 Physician preference for use in respiratory infections will continue $ % $ % $ % $8.87 Market for these products supplanted by quinolones $ % $ % $ % $11.33 Utilization declines as preference for other antibiotic classes expands, but use of Augmentin will grow $ % $ % $ % $10.96 Growth in class costs will decline when Cipro goes generic in
34 class PMPY cost increases for respiratory, antihyperlipidemics and pain/inflammation are projected to grow by $56.58, $51.92 and $50.38, respectively. The dollar rise for antihyperlipidemics represents a projected 452-percent increase, explaining its ascension from the eighth-ranked to the fourth-ranked class. Express Scripts annual PMPY cost estimates from 2000 through 2004 are presented in the aggregate and for major therapeutic classes, along with a brief rationale for these projections in Table 11. Key new drugs and patent expirations that were considered in developing our cost projections for each therapy class are highlighted. GASTROINTESTINAL There are two major developments in the gastrointestinal class. First is the expiration of the Prilosec patent in This will create new competition in the proton pump inhibitor (PPI) class of drugs. The second development is in new treatments for irritable bowel syndrome (IBS). The first drug in this class, Lotronex (alosetron), was approved in early 2000, and the second drug, Zelmac (tegaserod), is expected to be approved near the end of IBS affects 10 percent-20 percent of the adult population and is currently an under-treated condition. Table 12: New Gastrointestinal Products Brand name Generic name Proposed use Estimated Release Date Protonix Pantoprazole GERD, PUD Nexium Esomeprazole GERD, PUD Zelmac Tegaserod IBS MK-869 Chemotherapyinduced vomiting Prucalopride GERD Mosapride GERD Norcisapride GERD Patent expirations: Pepcid 2001 Prilosec 2001 Axid
35 CENTRAL NERVOUS SYSTEM (CNS) Developments in the central nervous system pipeline are focused on both new drug discovery and new uses for existing drugs. There are several new compounds in development for depression and psychosis, but most are not significantly different than existing products. The pipeline for anti-anxiety and hypnotic drugs is relatively quiet. Some new uses for existing drugs include the use of Prozac for premenstrual dysphoric disorder and Prozac in combination with Zyprexa for refractory depression. Zyprexa, which recently received an indication for the short-term treatment of acute mania, is being studied for additional uses, including dementia associated with Alzheimer s disease. A pipeline product that may have a broad range of uses is the anticonvulsant pregabalin, which is expected on the market in Pregabalin is similar to Neurontin (gabapentin) and may have indications for both epilepsy and pain when it is approved. A significant upcoming patent expiration is that of Prozac, which may occur any time between 2001 and Table 13: New CNS Products Brand name Generic name Proposed use Estimated Release Date Zeldox Ziprasidone Psychosis Zomaril Iloperidone Psychosis Aripiprazole Psychosis Duloxetine Depression Vestra Reboxetine Depression r-fluoxetine Depression Pregabalin Epilepsy, pain Patent expirations: Buspar 2000 Neurontin 2000 Prozac 2001/2003 Tomoxetine Attention-deficit hyperactivity disorder 33
36 RESPIRATORY A number of new products are in the pipeline for the treatment of respiratory disease, but most are similar to existing products. New antihistamines include desloratadine, which is a derivative of Claritin, and norastemizole, which is a derivative of Hismanal. Developments in the asthma pipeline include new inhaled steroids and a number of early-stage compounds that target the underlying causes of the disease. One unique product in the final stages of development is Xolair (olizumab), which is being studied in both asthma and allergic rhinitis. Xolair works by antagonizing the effects of IgE, which is an inflammatory protein found in the lungs. Table 14: New Respiratory Products Brand name Generic name Proposed use Estimated Release Date Advair Salmeterol/ Asthma fluticasone Asmanex Mometasone Asthma Qvar Beclomethasone Asthma (CFC-free) Foradil Formoterol Asthma Desloratadine Allergic Rhinitis Norastemizole Allergic Rhinitis Zyrtec-D Cetirizine/ Allergic Rhinitis/ pseudoephedrine congestion Xolair Olizumab* Asthma, Allergic Rhinitis Anti-Interleukin-5* Asthma Interleukin-4* Asthma Neurokinin-1 antagonist* Asthma Patent expirations: Flovent 2003 Claritin 2004, pending outcome of ligitation *injectable product 34
37 PAIN/INFLAMMATION This therapeutic category contains drugs for general pain, osteoarthritis, rheumatoid arthritis and migraine headaches. There have been a number of significant drugs approved in this area during the past couple of, and new products appear similar to those on the market. New COX-2 inhibitors and triptans for migraine headache are among the more notable products in the pipeline. The use of Enbrel as first-line therapy for the treatment of rheumatoid arthritis is likely to be approved by the FDA in 2000, and studies in congestive heart failure patients are ongoing. Table 15: New Pain/Inflammation Products Brand name Generic name Proposed use Estimated Release Date Valdecoxib Arthritis, pain Parecoxib* Acute pain MK-663 Arthritis, pain Kineret Anakinra* Rheumatoid arthritis Dirame Propiram Pain Relpax Eletriptan Migraine headache Miguard Frovatriptan Migraine headache Axert Almotriptan Migraine headache Patent expirations: Relafen 2002 Daypro 2000 *injectable product 35
38 CARDIOVASCULAR Patent expirations will likely play a larger role than new drug introductions in this class for the next few. Mevacor will be the first statin to lose patent protection in 2001, and several ACE inhibitors will also lose patent protection soon, starting with Vasotec in The most significant product in the short-term cardiovascular pipeline was thought to be Vanlev (omapatrilat), a vasopeptidase inhibitor that works on multiple sites in the kidney to lower blood pressure. However, FDA concerns over side effects will require new clinical trials and delay the approval of the drug until late 2001 or early There are several compounds similar to Vanlev in clinical trials, although none is close to approval. Table 16: New Cardiovascular Products Brand name Generic name Proposed use Estimated Release Date ZD-4522 Hyperlipidemia Vanlev Omapatrilat Hypertension Eplerenone Hypertension, heart failure Olmesartan Hypertension Patent expirations: Procardia XL Vasotec 2000 Mevacor Zestril /Prinivil 2002 Accupril 2002 Lotensin
39 WOMEN S HEALTH New compounds for osteoporosis dominate the pipeline for women s health products. Actonel (residronate) was approved in 2000 and will compete with Fosamax in the bisphosphonate class. Another bisphosphonate, Bonviva (ibandronate), is in the late stages of development. A second class of drugs receiving attention is the selective estrogen receptor modulators (SERMs). The SERM, Evista, was approved in 1998, and several more are in development. These drugs are being investigated for osteoporosis and for breast-cancer prevention. The use of parathyroid hormone as a treatment for osteoporosis is also being studied in large-scale trials. Another area of women s health that may receive greater attention in the coming is sexual dysfunction. Viagra is currently being studied in women, as are other drugs in earlier stages of development. Table 17: New Women s Health Products Brand name Generic name Proposed use Estimated Release Date Actonel Risedronate Osteoporosis Bonviva Ibandronate Osteoporosis Fosamax Alendronate Osteoporosis once-weekly Arzoxifene Cancer Lasofoxifene Osteoporosis, breast cancer Parathyroid hormone* Osteoporosis Viagra Sildenafil Female sexual dysfunction Tibolone Osteoporosis Lunelle Medroxyproges- Contraception, terone/estradiol* monthly injection (IM) (SQ) *injectable product 37
40 ANTI-INFECTIVES A few new classes of drugs are in the anti-infective pipeline, along with many compounds similar to existing products. The first antibacterial drug in the oxazolidinone class, Zyvox, was approved in Zyvox will mainly be used in the hospital, but its availability in an oral formulation may Table 18: New Anti-Infective Products Brand name Generic name Proposed use Estimated Release Date Zyvox Linezolid Pneumonia, skin infections Spectracef Cefditoren Respiratory tract infection Ketek Telithromycin Respiratory tract infection Factive Gemifloxacin Respiratory tract infection, urinary tract infection Faropenem Multiple infections Vfend Voriconazole Fungal infections Trizivir Lamivudine/ HIV zidovudine/ abacavir Coactinon Emivirine HIV Tenofovir HIV Capravirine HIV Tipranavir HIV BMS HIV GW HIV MK-944A HIV Pegasys Pegylated inter- Hepatitis C feron alfa-2b* Peg-Intron Pegylated inter- Hepatitis C feron alfa-2a* Pleconaril Common Cold Patent expirations: Augmentin 2002 Ceftin 2003 Cipro 2003 *injectable product 38
41 allow for earlier hospital discharges. Another new class of antibacterials is the ketolides. Ketolides are similar to macrolides (i.e., erythromycin) in chemical structure and activity, so they will be used mainly in respiratory tract infections. The first product in this class, Ketek, was recently filed with the FDA and is expected on the market in Faropenem is a new drug in the penem class of antibacterials and is the first that can be taken orally. Pipeline products in the HIV category of antivirals are similar to those currently available. New products for hepatitis include pegylated interferons, which can be given once weekly, instead of three times a week with current interferon products. The antiviral drugs Relenza and Tamiflu are pursuing an indication for the prevention of influenza, which could increase utilization of these products. DIABETES The diabetes pipeline centers on the insulin product Exubera. This product administers dry powder human insulin by use of an inhaler rather than the traditional method of injection. Exubera is in Phase III trials and may be available in 2001 or Other oral insulin products are in earlier stages of development. Oral agents for type 2 diabetes are similar to existing products. The patent for Glucophage expires in 2000, but an extended-release product, Glucophage XR, is expected to be approved this year. The removal of Rezulin from the market has not discouraged the development of similar drugs in that class. Table 19: Diabetes Brand name Generic name Proposed use Estimated Release Date Lantus Insulin glargine Diabetes (injection) type 1 and 2 Exubera Insulin, inhaled Diabetes type 1 and 2 Starlix Nateglinide Diabetes type 2 Glucophage XR Metformin Diabetes type 2 Glucovance Metformin/ Diabetes type 2 glyburide Voglibose Diabetes type 2 GI Diabetes type 2 PNU Diabetes type 2 Symlin Pramlintide Diabetes (injection) type 1 and 2 Oralgen Insulin, oral Diabetes liquid type 1 and 2 Patent expirations: Glucophage :
42 40
43 ACTIONS TO M ITIGATE I MPACT OF THESE T RENDS DISCUSSION The fourth edition of the Express Scripts Drug Trend Report documents a continued escalation of prescription drug expenditures in Indeed, the rate of increase between 1998 and 1999 was the highest seen since Express Scripts began monitoring drug costs in Between 1998 and 1999, PMPY AWP costs increased by 17.4 percent, compared with the 16.8-percent rise seen in the period. About half of this growth is attributable to per-prescription increases, stemming primarily from the rise in price and, secondarily, to therapeutic and strength mix. In addition, growth in common drug utilization, 6.3 percent, was the highest increase in this factor seen since Despite the promise of significant products going generic over the next several, it is anticipated that prescription drug costs will continue to grow at a rapid but declining rate of growth over the next five. It must be emphasized that the trend figures cited above reflect past experience and future expectations about the magnitude of drug cost increases if plan sponsors take no aggressive action to curb costs. Plan sponsors that did take aggressive steps saw their drug cost trend increase by only about half the 1999 PMPY AWP trend. The dynamics underlying these substantial cost increases are the same as those discussed in previous editions of this Report. The key cost drivers are: The continued supply of new drugs coming to market: The pharmaceutical industry has continued to pour billions of dollars into research and development. According to the Pharmaceutical Research and Manufacturers of America, an estimated $26.4 billion will be spent in 2000 alone. Some new products will be innovative agents designed to treat previously untreated or under-treated diseases. Others may be more efficacious therapies than products now on the market. In the short run, most probably will not be more efficacious than current products but will likely have better side-effect profiles witness the COX-2 inhibitors Celexa and Vioxx and anticipated isomers of existing products such as Prozac. In addition, during the past several, a spate of mergers has occurred between pharmaceutical manufacturers, as well as acquisitions and strategic alliances between large pharmaceutical companies and biotechnology companies. The goals of these activities are to enrich drug pipelines and achieve economies of scale in all phases of business operations, including research and development. The demand for prescription drugs continues unabated, fueled by a society that looks to drugs as a primary curative for all sorts of maladies: This phenomenon has occurred with an apparent disregard for the possible known and unknown long-term effects of some prescription drugs. Some drugs are used by consumers in lieu of changing their behavior or lifestyle. Why should a person with high blood pressure or elevated cholesterol levels exercise or modify diet when it is easier to take a pill? Other products are life-enhancing. Antihistamines and decongestants alleviate symptoms from allergies. Fertility and anti-impotence agents clearly promote better quality of life. At the extreme are products that treat cosmetic conditions such as wrinkles and baldness. The view of Americans that drugs are the panacea of all ills is not restricted to prescription drugs. 41
44 A survey conducted by the Hartman Group found that alternative therapies are being used by 85 percent of American households. About 40 percent of households would use alternative medicines even more if they were covered by health insurance. 13 To obtain an idea of the proportion of 1999 spending attributable to drugs that may be considered more closely akin to life-enhancing, drugs in therapy classes representing more than 95 percent of the drug spend were arrayed along a continuum ranging from life-sustaining to life-enhancing. This grouping of drug classes along the continuum does not imply that a given drug class that falls more toward the life-enhancing end of the continuum would not fall more toward the lifesustaining end of the continuum for an individual patient. Neither does the placement of the various drug classes on the continuum imply that drugs on the life-enhancing end of the continuum should be placed on a third copay tier or not be covered by a plan sponsor. Rather, the arrangement of drug classes along the continuum is only meant as a tool to gain better insights into the dynamics of drug cost increases. As shown in Table 20, only a small percentage of costs are attributable to life-sustaining drugs, such as anticancer agents and antiviral products that are used to treat AIDS and hepatitis (4.5 percent). Another one-third of the 1999 spend is for drugs that most would view as essential to a pharmacy benefit antibiotics, antidepressants, antiasthmatics, etc. In contrast, 6.3 percent of 1999 costs are accounted for by clearly lifeenhancing drugs, such as antifungals and treatments for erectile dysfunction. The remaining half of 1999 costs are for drugs in the middle of the continuum. Drugs in these middle categories range from products treating high blood pressure and hyperlipidemia to those treating allergies. Table 20: Distribution of AWP Cost by Groupings of Therapy Classes Therapy Classes Included % of 1999 AWP Cost Life-Sustaining Antineoplastics, Antivirals 4.5% Anticonvulsants, Thyroid, Cephalosporins, Antidiabetics, Hematopoietic Agents, Opthalmic Products, Macrolides, Quinolones, Antiasthmatics, Penicillins, Antipsychotics, Misc. Anti-infectives, Tetracyclines, Antianxiety Agents, Anticoagulants, Misc. Hematologicals, Antidepressants 31.5% Antiarrhythmics, Antiparkinsonians, Beta Blockers, Misc. GI Agents, Antianginal Agents, Antihyperlipidemics, Diuretics, Antihypertensives, Calcium Blockers, Ulcer Drugs, Unclassified 29.9% Vaginal Products, Migraine Products, Anti-Rheum (NSAIDS), Narcotic Analgesics, Hypnotics, Skel. Musc. Relaxants, Dermatologicals, Cough/Cold, Decongestants, Antihistamines, Estrogens 23.4% Oral Contraceptives, Stimulants/Weight Loss, Misc. Endocrine (includes Fertility Agents), Misc. Cardiovascular (includes Life-Enhancing agents to treat Erectile Dysfunction), Antifungals, Misc. Psych. 6.3% Other 4.4% Total 100.0% 13 Drug Topics, November 1,
45 Some of these illnesses are controllable through exercise and diet, while others can be treated with over-the-counter products. Consumers expect all prescription drugs should be available and accessible and that employers or health plans should subsidize the cost of these drugs: Most Americans look at the drug benefit as an entitlement. That is, many Americans think they are guaranteed the right to receive any prescription drug from any provider of their choosing and to have their employer or relevant government program subsidize the cost of those pharmaceuticals. Just as consumers began to react against MCOs for limiting access to providers and types of services, so too are consumers beginning to actively express dissatisfaction about their inability to access certain drugs not covered on formulary. This discontent has forced MCOs to heavily market PPO plans and to break away from closed formularies. In addition, several state legislatures are considering measures to control what prescription drugs MCOs can exclude from formulary coverage. Consumer demand is also stimulated by DTC advertising: IMS HEALTH and Competitive Media Reporting estimate 1999 DTC spending for pharmaceuticals was in excess of $1.85 billion, up from $969 million in Sixty-one percent of these expenditures was for television ads, and 36 percent was for magazine ads. The success of DTC advertising from the manufacturers point of view is clear. According to a FDA-sponsored consumer survey, about 70 percent of the respondents indicated they saw or heard an advertisement for a prescription drug, and 86 percent thought the prescription drug ads help make me aware of new drugs. 14 Of those respondents who saw their physicians in the previous three months, 23 percent either asked about prescriptions or mentioned they had seen or heard prescription advertising. Some even brought information about a drug to the physician s office. Half of these people were given the prescription drug they asked about. DTC ads can be a positive force in promoting health awareness. Of those FDA-sponsored survey respondents who saw their physician in the past three months, 51 percent thought that the DTC ads for prescription drugs caused (me) to look for more information for the drug or about (my) health, and 47 percent thought that these ads help me make better decisions about my health. Forty-one percent of respondents who had not seen their physicians in the past three months responded in a similar fashion. On the other hand, about 57 percent of all respondents thought DTC ads for prescription drugs make drugs seem better than they are, and about 58 percent thought these ads do not give enough information about the possible risks and negative effects of using the drug. DTC advertising is certainly not the only readily available source of medical and pharmaceutical information. The proliferation of the Internet and the multitude of Web sites that contain medical and drug information further broaden access to data. With all this available information, more patients are encouraged to take charge of their medical problems. This includes becoming educated about one s illness, alternative ways of treating the condition and the costs associated with these treatments, as well as feeling free to ask physicians about the illnesses and how they plan to treat the diseases. On the positive side, the more patients learn about their diseases, the more likely patients will own the disease, including adhering to a recommended regimen and altering lifestyle and behavior as needed. 14 Attitudes and Behaviors Associated with Direct-to-Consumer(DTC) Promotion of Prescription Drugs. Main Survey Results. www/fda/gov/cder/ddmac/dtcindex.htm 43
46 Empowering patients in this way presents great opportunities to enhance care but has risks. How can a layperson sift through all of this information and determine what articles or studies on a given topic are valid? How can one guard against the purposeful or inadvertent inclusion of false or misleading information on the Internet? How can the trailer advertisements promoting various products be monitored to prevent misleading information from appearing? Faced with these underlying phenomena, plan sponsors or payers are faced with the problem of how to finance ever-growing pharmacy costs. One strategy being considered by employers is to get out of the business of providing healthcare benefits altogether. This approach involves allowing each employee a fixed amount of money to purchase his or her own healthcare coverage. Although this tactic caps the employer s financial exposure, this tactic places the employee in the difficult position of having to purchase health insurance without the leverage of numbers enjoyed by an employer who is negotiating rates for many lives. Without a government-mandated set of coverages, risk-pooling plans and regulation of premiums, the employee may be unable to find affordable health insurance with adequate coverage. Alternatively, if enough employers adopt this tactic, the medical provider/insurance industry may fill this need. If so, government likely would have to regulate these providers to ensure their financial viability as well as the quality of care they deliver. A second, more likely scenario has the employer moving toward a defined-contribution approach. This strategy involves the employer offering its workers multiple drug-coverage options but capping the employer contribution at a set amount. This approach responds to consumer choice and at the same time ties pharmacy use more directly to member financial responsibility. For example, an employer could provide one coverage for all drugs, regardless of the type of condition the drug treats, and another that excludes coverage of drugs for which there are less expensive alternatives and for drugs used for cosmetic purposes. In either case, the employer will contribute the same amount of money. The employee selecting the richer benefit that includes all drugs or drugs that treat cosmetic conditions pays the incremental costs attached to the coverage of these drugs. This approach provides the employee open access to all drugs but places part of the financial burden on the employee for his or her choices. One important consideration that must be taken into account when adopting this strategy is whether to maintain some element of insurance in the pricing decision. A key assumption in insurance is that the price of the benefit should be spread across both the healthy and sick or, put another way, between low and high utilizers. This principle entails low utilizers subsidizing the costs of high utilizers. One approach to this insurance issue is to redefine how one looks at the drug benefit. Instead of conceptualizing the drug benefit as an entitlement for all employees and their dependents, the payer could design the benefit to address primarily the needs of the sick. This strategy takes the point of view that a drug benefit should focus primarily on subsidizing the financial burden of the sick the high utilizers. In contrast, episodic, lower utilizers would be expected to pay all or a significant portion of their drug costs. This approach consists of abandoning the notion of first-dollar coverage and replacing it with the medical indemnity practice of implementing a member deductible. After this deductible is reached, the plan sponsor and member would share the financial risk for an amount between the deductible and a predetermined amount (stop-loss), after which the plan sponsor would pay the entire costs of drugs used. 44
47 For instance, such a plan could take the following form. The plan sponsor offers a drug benefit that covers a set list of drugs a drug formulary. In a given plan year, each member is responsible for the first $100 of drug costs he or she incurs, regardless of whether the drugs used were generics, preferred brands or non-preferred brands. After this $100 deductible is met, the member is responsible for paying, for example, $5 for each generic product, $15 for each preferred product and $30 for each non-preferred product prescribed, up to an out-of-pocket expense of $1,500. Once that member has paid $1,500 in the form of the $100 deductible and copays, the plan sponsor will pay the entire cost of drugs for the remainder of the plan year. Under this scheme, for an average non-retiree population, roughly 35 percent of the total plan population uses no prescription drugs and, therefore, would be unaffected by any plan change (see Figure 12). An additional 30 percent has a gross AWP spend of between $0.01 and $100, accounting for about 5 percent of total plan population expenditures. This group would assume the entire financial burden for its total prescription cost under a $100 deductible. The remaining roughly 35 percent of the population would be subject to three-tier copayments up to an out-of-pocket stop-loss of $1,500. Of this 35-percent segment, 15 percent spend between $100 and $250, representing about 10 percent of total plan costs. The rest of the 20 percent of the population spends more than $250 annually and accounts for about 85 percent of total plan costs. Of this population segment, 15 percent incurs between $250 and $1,000 in drug costs and accounts for 30 percent of the total gross plan spend. The other 5 percent spends more than $1,000 annually and represents 55 percent of total gross plan costs. Under this scheme, approximately 1 percent of the plan population would reach the out-of-pocket stop-loss level of $1,500. Figure 12: Percent of Members and Gross Cost 100% 80% 60% 40% >$1000 >$250 - $1000 >$100 - $250 >$0 - $100 $0 20% 0% % Members % Gross Cost In designing this type of catastrophic approach to the pharmacy benefit design, the plan sponsor has to carefully consider the demographic and use pattern of its members. The older the population, the higher their prescription drug use and consequently their costs. Moreover, in setting deductible, copay and out-of-pocket stop-loss amounts, the salary levels of their employees must be considered. If these factors are set too high, those at the lower end of the salary scale may 45
48 be overly disadvantaged. This obstacle, at least to a degree, can be mitigated by setting deductible and stop-loss amounts differentially for people in various salary buckets. That is, people with lower salaries would have lower deductible and stop-loss levels than those at the upper end of the pay scale. Given these issues, employers may consider involving their employees in the design of such a longer-term cost management strategy. SHORT-TERM COST MANAGEMENT STRATEGIES Payers can use a number of techniques in the short term to offset rising drug costs. These techniques include actions aimed at controlling per-prescription drug costs, reducing utilization of prescription drugs, and reducing both prescription costs and utilization. Actions Aimed at Controlling Per-Prescription Costs Although the payer community cannot directly influence manufacturer pricing, individual payers can affect per-prescription costs by adopting particular ground rules under which they will pay for drug products. Such strategies include limiting the size of retail networks; and promoting the use of mail service, mandatory generic programs, quantity limits, step therapy and therapeutic switching. Generally the deepest discounts payers can attain are through a mail service pharmacy, which can capitalize on economies of scale to lower cost, with the resulting savings being passed on to clients. Consequently, it would behoove the payer to encourage members to have prescriptions that are used to treat chronic disease filled through mail service. About 80 percent of Express Scripts members have a choice of retail or mail order usage. On the retail side of the equation, better discounts can be obtained in exchange for driving higher volume into network stores. Consequently, a payer willing to limit the number of retail pharmacies in its network can obtain deeper discounts from this limited network. The plan sponsor can directly impact the per-prescription cost by controlling or influencing the mix of products reimbursable under the drug plan benefit. In a mandatory generic program, the member is required to pay the difference between the price for a multi-source brand for which a generic is available and the price for the generic equivalent. A mandatory generic program can be implemented requiring the member to pay the difference only if the physician has indicated that a generic can be substituted or regardless of whether the physician had indicated that a generic can be substituted. The percentage of Express Scripts sample clients that adopted one of these mandatory generic programs grew from 40 percent in 1996 to about 47 percent in 1997 and 1998, and to 55 percent in In both 1998 and 1999, 69 percent of HMO clients had a mandatory generic program. In contrast, only 32 percent of non-managed care commercial clients had such a program in This figure grew to 50 percent in Excessive quantities per prescription can be controlled by implementing quantity limits per copay. This strategy involves targeting products for which prescriptions are prone to include quantities beyond what is suggested for typical use. Depending on how aggressive the client is willing to be, limiting the quantity per prescription can save between $0.10 and $0.20 per member per month. Additionally, managing drug choices within a therapeutic class has become a viable alternative for reducing costs. Compared with the more indirect approach of physician intervention and behavior changes, plans are opting to manage utilization choices at the point of service. Requiring the 46
49 participant/member to attempt a trial of a less expensive drug, such as a generic, for a specified period of time before the plan will pay for the originally prescribed medication, often referred to as step-therapy, successfully reduces the cost of treatment, especially in short-term drug therapies. Therapeutic switching is another vehicle that can be used to reduce per-prescription costs. Most formulary lists designate specified products as preferred products that are at least as efficacious as non-preferred drugs but that have the potential to provide the greatest level of net savings for the plan. Increased use of these less expensive preferred drugs may be obtained if a plan sponsor chooses to implement initiatives like those recommended in Express Scripts Drug Choice Management SM program. Such programs encourage physicians and members to switch from more expensive products to less costly therapeutically equivalent products. As connectivity between the PBM and the physician s office becomes more widespread, real-time implementation regarding formulary compliance and concurrent plan design edits will become a more effective and less cumbersome method of implementing plan sponsor programs. Reducing Utilization of Prescription Drugs A number of strategies can be employed to reduce utilization in a responsible manner. One approach is simply to exclude cosmetics and other lifestyle drugs. Most plans do exclude a variety of such products, but given the number of lifestyle products that continually come to market, the list of excluded products must be continually re-evaluated. Concurrent DUR programs include online edits for duplicate therapies, drug interactions, too-early refills and the like. Another concurrent program aimed at reducing unnecessary utilization is prior authorization. Prior authorization programs require a patient be a given age or have a documented diagnosis to receive a prescription for a specific drug. Retrospective DUR programs also can be implemented. Such programs are designed to identify issues pertaining to poly-pharmacy, drugs of concern for specific age groups and questionable use of controlled substances. Other types of initiatives can be adopted to assist payers that have a closed panel of physicians. One such technique is to place the physician at some form of risk for prescription drug costs. The 1999 Hoechst Marion Roussel Managed Care Digest Series reports that the percentage of HMOs using capitation reimbursement for primary care physicians (PCPs) dropped from 79.5 percent to 73.4 percent in The percentage of contracts associated with fee-for-service payments has increased during the same time period. Some plans have incorporated incentives for management of prescription drug costs into risk-sharing contracts. Some of the larger at-risk physician groups have hired pharmacists to help them manage the prescription drug risk. Challenges to capitation and risk pools have emerged in some states through litigation and proposed legislation to prohibit or modify these reimbursement techniques. A strategy for promoting the appropriate use of drugs is to look at prescription drugs within the context of overall health resources expended to treat a specific disease. This requires integrated medical and drug data that can be organized around disease states and that embed severity-of-illness measures in the definition of disease state. This allows for physicians practice patterns to be analyzed in the context of their respective treatment/resource expenditure patterns relative to their peers or to some agreed treatment protocols. Physicians whose resource consumption, including prescription cost, is significantly beyond the norm can be identified and counseled. Such tools, like those developed by Express Scripts Practice Patterns Science, are now available in the marketplace. 47
50 Another strategy to encourage appropriate prescription drug use is disease management, an approach that encompasses the comprehensive management of a patient with a specific disease. Programs range from identifying patients who have a given disease and sending them objective educational materials to active intervention/contact and monitoring/evaluation of these patients on a regular basis. The latter strategy necessitates not only the availability of data to identify patients with those diseases but also the mechanisms to intervene. A variety of companies, including Express Scripts, offer disease management services and retrospective DUR programs. While ensuring that key disease states are appropriately managed with medications is purported to promote better outcomes, the drug costs within these diseases usually increase as they promote appropriate utilization of medication. Retrospective DUR programs provided by Express Scripts include those promoting compliance with and use of inhaled steriods for asthmatics. Communications with physicians and members for disease management and retrospective DUR programs will be greatly enhanced by the availability of the Internet. Reducing Per Prescription Costs and Utilization Persons who view prescription drugs as a virtually free good to which they are entitled have little or no incentive to worry about the cost of that drug. Consequently, one critical challenge facing the payer is to sensitize participants/members to drug costs. The most direct way of accomplishing this goal is to make the member financially responsible for part of the cost of the medications consumed. Members who are not cost-sensitive have no reason to think about whether they really need the prescription. Neither do they consider the number of units of the drug needed vs. how many might be used or whether a less expensive drug will yield the same clinical outcome as a more costly agent. Member cost share directly affects the cost of every prescription covered by plan sponsors. Every dollar the member pays for a drug is a dollar the payer does not have to pay. Despite this fact, many plan sponsors do not regularly adjust their member cost-share structure. The effects of holding member cost share static can be dramatic. The average AWP cost per prescription grew by 49.3 percent between 1995 and As is shown in Figure 13, average per-prescription costs rose for all but one of the top 25 therapy classes. These increases appeared from commonly utilized gastrointestinal drugs to less-used but very expensive antivirals. Payers that had constant member cost share levels during this period had to bear the entire burden of these increases. Continuing a trend seen since 1995, member share of cost for clients in this report actually declined from 21.8 percent in 1995 to 20.8 percent in Member share of cost decreased for both HMO and commercial clients from 24.2 percent to 23.3 percent for HMOs and from 19.2 percent to 18.7 percent for commercial clients. However, 1999 levels for both HMOs and commercial clients increased slightly, 1 percent and 0.5 percent respectively, over 1998 levels. The member share of cost generally takes the form of a front-end deductible, a copay for every prescription dispensed or a limitation on the total amount of drug costs for which the plan sponsor will pay over a year. The use of a front-end deductible has declined somewhat in both the commercial and MCO markets. About 5 percent of Express Scripts clients have a front-end deductible. For those with such plan designs, the average deductible for an individual was about $60 and for a family $
51 Figure 13: Increases in Average Prescription Cost From 1995 to 1999 by Therapy Class Gastrointestinals Antidepressants Antihyperlipidemics Antihypertensives Anti-Rheum (NSAIDS) Antidiabetics Antihistamines Calcium Blockers Antiasthmatics Dermatologicals Antivirals Estrogens Narcotic Analgesics Oral Contraceptives Cough/Cold Macrolides Beta Blockers Cephalosporins Anticonvulsants Antianxiety Agents Penicillins Migraine Products Decongestants Misc. Endocrine Quinolones Other Total $78.72 $72.55 $53.45 $82.37 $71.31 $39.96 $35.16 $58.90 $39.62 $51.57 $29.50 $54.48 $40.26 $54.79 $48.44 $46.96 $32.50 $42.94 $28.87 $22.59 $15.36 $24.48 $14.09 $31.17 $24.60 $24.64 $16.20 $40.90 $31.53 $31.68 $28.16 $49.64 $44.40 $66.73 $39.85 $39.18 $24.21 $22.26 $13.24 $61.15 $47.03 $33.94 $84.45 $76.23 $61.03 $34.38 $21.34 $46.77 $31.32 $ $ $ $ $ $0.00 $50.00 $ $ $ * Antihypertensives include ACE Inhibitors, Angiotensin Receptor Blockers and other antihypertensives. ** Dermatologicals include topical antifungal agents. *** Decongestants include nasal corticosteroids. Express Scripts clients, like other payers nationwide, have raised 1999 copay levels more aggressively than in the past, particularly for branded products. In the aggregate, between 1997 and 1998, MCO and commercial clients raised network generic copays from $5.57 to $5.84 to $6.40 and copays for brands from $10.91 to $11.60 to $ MCO clients raised copays more than their commercial counterparts. Generic copays went from $5.79 to $6.05 to $7.06 and copays for 49
52 brands from $11.22 to $11.91 to $ Commercial clients raised their generic copays from $5.07 to $5.40 to $6.73, and branded copays from $10.04 to $10.39 to $ As pointed out earlier, despite these increases, payers lost some ground because member share of cost did not keep pace with increases in the average cost per prescription. Clients that have percentage member copays do not have to worry about this inflation creep because the member automatically assumes a constant percentage of that per-prescription cost increase. Another opportunity to reduce cost and utilization is by augmenting a mandatory generic program with a closed formulary, which limits the single-source drugs for which the plan sponsor will pay. A payer can choose to exclude from coverage more expensive branded products for which less costly therapeutic alternatives are available. An even more aggressive strategy is to deny coverage for entire classes of drugs, such as those to treat baldness or obesity. A payer adopting a closed formulary must have medical override protocols to deal with instances in which the physician determines that a patient must have the non-covered drug. The amount of saving from this strategy is directly related to the degree of restrictiveness of the formulary. In the recent past, few payers adopted closed formularies that exclude significant numbers of branded drugs from coverage. As consumers have increasingly demanded access to all drugs, even fewer payers have chosen this approach. To the contrary, more plans that had closed formularies are moving to less restrictive approaches. One such approach is a three-tier copay plan. Under this scenario, a member s copay is lowest for generics (tier one), somewhat higher for preferred or neutral brands (tier two), and highest for expensive and non-preferred branded products (tier three). Members desiring tier-three products are not denied access to them as part of the covered benefit but instead are charged a premium, in the form of a higher copay, for using those products. This type of plan helps the payer either by inducing the member to use less expensive brands (tier-two drugs) or generics (tier-one drugs) or by allowing the payer to reduce costs for tier-three drugs through higher member copays. A three-tier copay plan has become more attractive to payers because the plan sponsor still pays for the drug, albeit a lesser amount, making it perhaps more marketable than a closed formulary. A plan moving from a $5/$10 copay structure to a three-tier plan at $5/$10/$25 structure can save between 7 percent and 8 percent of its overall drug cost. According to the Scott-Levin 1999 Managed Care Formulary Drug Audit, the percentage of MCOs offering a three-tier copay structure rose from 36 percent in the spring of 1998 to 52 percent by the fall of 1998 to 67 percent in the fall of According to the Scott-Levin findings, the average three-tier copayment system is $6.63 for generics, $13.94 for formulary branded drugs and $28.32 for non-formulary drugs. For clients choosing a three-tier copay approach, care should be taken to not set the third-tier copay level so high as to dissuade members from having essential prescriptions filled or refilled, a situation that could result in emergency room or inpatient admissions. 15 Thus, the levels at which copays are set must take into account the family income of the covered membership and the types of drugs placed on the third tier Roe, C.M. Have You Been Taking Your Medications? Proceedings of the 1999 Express Scripts, Inc. Outcomes Conference. 16 Fairman, K. A., Motheral, B.R. and Teitelbaum, F. One Size Fits Most: Commercially Insured Enrollees Respond to a Three- Tier Drug Copayment, Presented at Managing the Pharmacy Benefit, Tucson Arizona, January 27,
53 Some clients have initiated or are contemplating a four-tier copay system. This approach essentially is a variant of a closed formulary in that the member must pay 100 percent of the costs for some drugs. As in a three-tier system, there are three escalating copay amounts for generics, preferred brands and non-preferred brands. However, there is a group of drugs that are placed on a fourth tier. The member is responsible for paying the total cost of all of these fourth-tier products. The marketing spin on this strategy is that all drugs are accessible but the member copay varies according to which drugs the member chooses. The advantage to members is that they benefit from the negotiated discounts for the tier-four products. Another variation of a four-tier copay system is to cover these fourth-tier drugs but charge the member a substantial copay, 50 percent-75 percent, of the cost of these products. Regardless of the method employed, payers have been and will continue to pass along to patients an ever-growing financial contribution for the prescription drugs consumers take for granted as being readily accessible and inexpensive. Depending on how the financial shift is accomplished, those who can least financially afford to pay this extra amount might be forced to do without much-needed medications. Consequently, payers must carefully consider the demographic makeup of their employees and their dependents, as well as the types of drugs that may be placed on a third tier. SUMMARY This report is the fourth edition of the Drug Trend Report published by Express Scripts. The purposes of this series are to: Describe the drug cost trends payers have confronted over the past five Delineate primary factors underlying these trends Project future levels of drug increase that payers can expect Discuss the various tools payers can adopt to mitigate anticipated cost escalation The fourth edition of this Report generally reaffirms many of the conclusions reached in earlier editions. Over the next five, Express Scripts expects drug costs to rise. However, after 2000, Express Scripts projects the rate of increase in costs to decline to about 12 percent. This decline in the rate of growth largely is a function of reduced inflation rates as pharmaceutical manufacturing adapts to the political environment over the next several. In general, however, PMPY drug costs will continue to rise because of: The availability of newer, clinically superior, more expensive medications Growing numbers of consumers who: Look to drug therapy as a substitute for lifestyle changes, as a way of enhancing quality of life and as a fix for cosmetic blemishes Expect drugs to be readily accessible and subsidized by their employers or health plans The superior marketing prowess of pharmaceutical manufacturers In turn, payers are facing the difficult challenge of financing these growing bills. As a result, plan sponsors are being forced to ask their employees and dependents to be part of the solution by paying for a larger share of drug costs. While in the short-run, most payers will simply raise co-pays or implement three-tier copay plans, in the longer term, many plan sponsors will be forced to 51
54 re-evaluate the nature of the pharmacy benefit. The next generation of pharmacy benefit plans may well be based on a new philosophy that the drug benefit should be focused more on subsidizing the costs of the sicker people. The approach is a throwback to the fee-for-service indemnity plans that had a deductible instead of first-dollar coverage. Alternatively, plan sponsors may opt to address the member choice preference and adopt a defined-contribution strategy with the member given a choice between the drug plans. Payers adopting this approach must carefully consider how to price such options given the measurable principle that healthier people should subsidize the costs of sicker people. In considering what cost management approach to take, employers must balance the goal of cost trend reduction against employee retention issues in today s labor market. In this environment, the pharmacy benefit is viewed as an important part of the employee compensation package. Thus, employers may have to adopt less aggressive short-term cost management techniques such as those described above. However, as pharmacy cost pressures mount or the economy dips, employers must begin to think through the longer-term strategies they may need to adopt. 52
55 Drug Therapy Class Review Appendix A 53
56 D RUG T HERAPY C LASS R EVIEW The top 25 therapy classes ranked by cost account for about 80 percent of total AWP prescription expenditures. The data in Appendix A describe the cost and utilization trends for these classes since The discussion of these therapy classes focuses primarily on changes that took place between 1998 and 1999 and highlights drugs in the pipeline that are likely to have a significant impact on these classes over the next several. The data included in this Appendix include all drugs, both common and new. Table A1: Cost Per Prescription and PMPY Cost for Major Therapy Classes % % Therapy Class AWP/Rx AWP/Rx Change $ PMPY $ PMPY Change Gastrointestinals $ $ % $ $ % Antidepressants $ $ % $ 28.31$ % Antihyperlipidemics $ $ % $ $ % Antihypertensives $ $ % $ $ % Anti-Rheum (NSAIDS) $ $ % $ $ % Antidiabetics $ $ % $ $ % Antihistamines $ $ % $ $ % Calcium Blockers $ $ % $ $ % Antiasthmatics $ $ % $ $ % Dermatologicals $ $ % $ $ % Antivirals $ $ % $ 7.36 $ % Estrogens $ $ % $ 8.29 $ % Narcotic Analgesics $ $ % $ 7.05 $ % Oral Contraceptives $ $ % $ 8.07 $ % Cough/Cold $ $ % $ 7.46 $ % Macrolides $ $ % $ 6.88 $ % Beta Blockers $ $ % $ 6.92 $ % Cephalosporins $ $ % $ 7.38 $ % Anticonvulsants $ $ % $ 5.52 $ % Antianxiety Agents $ $ % $ 6.22 $ % Penicillins $ $ % $ 5.69 $ % Migraine Products $ $ % $ 5.50 $ % Decongestants $ $ % $ 5.43 $ % Misc. Endocrine $ $ % $ 3.86 $ % Quinolones $ $ % $ 3.97 $ % Other $ $ % $ $ % Total $ $ % $ $ % 54
57 G ASTROINTESTINALS For decades, research on conditions affecting the gastrointestinal (GI) tract has centered on the treatment of Peptic Ulcer Disease (PUD) and Gastroesophageal Reflux Disease (GERD). PUD occurs when breaks in the mucous lining of the stomach gastric ulcers or upper intestines (duodenum) create places that are damaged by stomach acids. Typically, ulcers cause burning pain in the abdomen. The discovery that a bacteria known as Helicobacter pylori causes ulcers completely revolutionized ulcer treatment and dramatically reduced the need for continuing maintenance therapy. The most typical sign of GERD is heartburn, the irritation caused when stomach contents flow backward into the esophagus. Untreated, chronic inflammation of the esophagus can cause more serious conditions including cancer. Treatment for GERD may last months or even. Although the same drug classes are used to treat ulcers and GERD, dosing and length of therapy can differ greatly. Proton Pump Inhibitors (PPIs) are rapidly replacing histamine-2 blockers (H2RAs) as the most used prescription GI medications. Another class used much less often for GI conditions is called promotility agents or GI stimulants. These drugs speed up gastric emptying time so stomach acid has less chance to damage exposed tissue. Because of severe side effects, Propulsid, the most widely used promotility product, was recently taken off the market. In 1999, guidelines for the treatment of GERD were updated by a committee of the American College of Gastroenterology. Taking into account the OTC status of low-dose versions of the H2RAs, which were available only by prescription when the original guidelines were issued in 1995, the recommendations now include more information on patient-directed therapies in addition to the use of prescription drugs. Figure A1: Therapy Class Drug Market Share Trend Gastrointestinals 40 % 35 % % Change in PMPY Cost 20.0% 1999 PMPY = $ % Prilosec ($139.57) 25 % Prevacid ($125.56) 20 % Ranitidine HCL ($84.94) 15 % Pepcid ($99.90) 10 % Cimetidine ($73.18) 5 % Axid ($98.82) 0 % Zantac ($90.66) Drugs used to treat GI diseases are the most costly, as well as some of the most widely used. In 1999, the PMPY costs for GI products grew to $34.23, 20 percent over 1998 levels, despite utilization increases of only 10 percent. The substantial rise in costs for this class owes to the dramatic shift away from less expensive H2RAs to PPIs. 55
58 Until recently, Zantac (ranitidine) dominated this class with a 39 percent market share in Consequently, when Zantac went generic a couple of ago, many thought that the cost of this class would at least remain somewhat stable. This hypothesis proved untrue as the more expensive PPIs, Prilosec (omeprazole) and the newer product, Prevacid (lansoprazole), came to dominate the GI market. Between 1998 and 1999, these products together grew in share from 46.4 percent to 55.5 percent primarily at the expense of generic ranitidine and branded H2RA products Pepcid (famotidine) and Axid (nizatidine). This shift to more expensive PPIs has resulted in higher PMPY costs for this class. The 1999 average AWP per prescription costs for Prilosec and Prevacid increased by 6.2 percent and 5.5 percent, respectively, to $ and $ In contrast the average 1999 AWP cost for ranitidine was $ The third PPI to become available in the United States, Aciphex (rabeprazole), was approved in August and marketed in fourth quarter Aciphex is indicated for the treatment of gastric ulcers, duodenal ulcers, gastroesophageal reflux disease and hypersecretory conditions. Future Trends On Dec. 6, 1999, a new drug application (NDA) was filed for Nexium (esomeprazole previously called perprazole). One of omeprazole s isomers, Nexium is a second-generation PPI expected to have more predictable activity against GERD, reflux esophagitis and duodenal ulcers. Approved on Feb. 3, 2000, to treat erosive esophagitis, Protonix (pantoprazole) was expected to be launched in second quarter Other indications are still under FDA consideration. Protonix is presently the only PPI to come in both oral and IV forms. Despite an extension, the U.S. patents for some Prilosec indications will begin to expire in Generic forms of Pepcid are due in 2000 and of Axid in Both of these H2RAs are already available in reduced-strength OTC versions. The number of drugs available for Irritable Bowel Syndrome (IBS) and for Inflammatory Bowel Diseases (IBDs), such as Crohn s Disease and ulcerative colitis, is growing since the 1998 approval of Remicade (infliximab), a monoclonal antibody for Crohn s Disease. Lotronex (alosetron), was approved in February 2000 for treating IBS in women whose primary symptom is diarrhea. The following week an NDA was filed for Zelmac (tegaserod), representing a new class of agents that affects 5HT-4 receptors in the GI tract. Zelmac improves GI motility to relieve constipation and may diminish the perception of pain as well. A number of other products are currently in development. C ENTRAL N ERVOUS S YSTEM Designated the Decade of the Brain by the National Institute of Mental Health (NIMH) and the Library of Congress, the 1990s produced significant research results that increased understanding of both the structure and the functions of the central nervous system (CNS). Conditions affecting the brain and spinal column include pain, depression and anxiety, as well as epilepsy. The number of 56
59 medications available for these conditions has increased significantly in the past several. Additionally, new classes of drugs are being developed for previously untreatable conditions like Alzheimer s Disease, Multiple Sclerosis (MS) and Amyotrophic Lateral Sclerosis (ALS). As scientists understand more about the substances and processes involved in normal nerve function, the scientists are beginning to discover new techniques that will potentially restore function to damaged nerves. ANTIDEPRESSANTS Prescription medications used to treat depression enhance the activity of one or more neurotransmitters chemicals that facilitate electrical signals along nerve cells. The three principal neurotransmitters involved in depression are dopamine, norepinephrine and serotonin. Newer antidepressants called selective serotonin reuptake inhibitors (SSRIs) have fewer side effects than tricyclics (TCAs) and monoamine oxidase inhibitors (MAOIs). Expenditures for antidepressants have grown at a substantial rate as the use of more costly SSRIs Prozac (fluoxetine), Paxil (paroxetine), Zoloft (sertraline) and Celexa (citalopram) has increased dramatically. To a lesser extent, use of equally expensive SNRIs Serzone (nefazodone) and Effexor (venlafaxine) has increased, as well. Figure A2: Therapy Class Drug Market Share Trend Antidepressants 30 % % Change in PMPY Cost 19.0% 25 % 1999 PMPY = $ % Prozac ($110.35) Zoloft ($81.44) 15 % Paxil ($77.19) 10 % Amitriptyline HCL ($9.49) Trazodone HCL ($21.66) 5 % Effexor/XR ($91.09) 0 % Celexa ($68.12) PMPY costs for antidepressants continued to grow, rising by 19 percent to $33.68 in Most of this growth is attributable to the 11.3 percent increase in the use of drugs in this class. Utilization of Prozac, which peaked at 27.4 percent market share in 1994, continued its decline to 19.9 percent in Market shares of the other older SSRIs Zoloft and Paxil remained stable at a combined 1998 market share of 31.4 percent, while the use of the newer agent, Celexa, grew to 4.8 percent; the combined market share of Effexor and Effexor XR rose to 6.1 percent. The product whose market share has grown the most from 2.5 percent in 1997 to 7.0 percent in 1999 is Wellbutrin SR (bupropion, extended 57
60 release). The primary reason for the growth is its off-label use as a smoking cessation tool, despite the availability of OTC products and of Zyban (bupropion, extended release), which is not covered by many health plans. Future Trends Although no new SSRIs have been approved for several, most activity in the antidepressant area centers on new indications or dosages for SSRIs. Zoloft has been given a new indication for post-traumatic stress disorder. Paxil is now indicated for social phobia, and an additional NDA has been filed for its use in generalized anxiety disorder. The makers of Luvox received a six-month extension of the original December 1999 expiration date because they are conducting studies in a pediatric population. Prozac has been granted a new indication for the treatment of depression in geriatric patients. It is also under FDA review for premenstrual dysphoric disorder and for pediatric depression. A separate application for approval of a once-weekly 60mg dosage of Prozac was filed with the FDA in March The FDA has already given tentative approval for generic fluoxetine in 10mg and 20mg strengths, but ongoing lawsuits are delaying introduction of the generic perhaps by as much as two. The patent for immediate-release Wellbutrin (bupropion) in the treatment of anxiety expired in Generic 75mg and 100mg bupropion tablets are being marketed in the United States. Extended-release bupropion, already reformulated to Zyban for smoking cessation, is also under investigation for effectiveness in bipolar disorder. To further extend the brand-name line, an application for a transdermal bupropion patch has been submitted for approval in the treatment of anxiety and attention deficit disorder (ADD). A selective norepinephrine reuptake blocker, Vestra (reboxetine mesylate) has been under FDA review since On Feb. 23, 2000, the FDA issued a second approvable letter for Vestra but also requested that an additional clinical trial be conducted to clarify inconsistent results from earlier studies. Patents for Serzone expire early in R-fluoxetine, the active isomer of Prozac will continue clinical trials for at least another year. A modification of the monoamine oxidase inhibitor (MAOI) class of antidepressants resulted in a group called reversible inhibitors of monoamine oxidase type A (RIMAs). Approved in several countries around the world, RIMAs produce enzyme modulation that is not permanent. In addition, RIMAs are much more selective than MAOIs, and they do not cause the side effects associated with either MAOIs or TCAs. RIMAs seem, however, to be as effective as other drug classes in the treatment of depression. At least one RIMA, Manerix (moclobemide), is in U.S. clinical trials. ANTIANXIETY AGENTS Pharmacologic treatment for anxiety can be complex often because more than one type of anxiety can be experienced at the same time. Patients with anxiety may also suffer from depression. Both conditions 58
61 Figure A3: Therapy Class Drug Market Share Trend Antianxiety Agents 100 % 80 % % Change in PMPY Cost 11.9% 1999 PMPY = $ % Generic ($30.05) 40 % Buspar ($102.58) 20 % Xanax ($64.76) Valium ($44.04) 0 % Ativan ($58.08) can have psychological causes as well as physical ones. Benzodiazepines, antidepressants, anticonvulsants and a unique agent, BuSpar (buspirone), are commonly used to treat various types of anxiety. Similar to the pattern seen between 1997 and 1998, PMPY cost rose by 11.9 percent in 1999, although PMPY utilization increased by only 3.9 percent. The generics market share continued to increase in 1999 to 82.6 percent. Effexor XR was approved in March 1999 for the treatment of generalized anxiety disorder. Future Trends BuSpar will go off patent for its anxiety indication in I NFLAMMATION AND PAIN M ANAGEMENT New procedures allow researchers to track very precisely the ways that pain signals progress through the body. Although chronic and acute pain follow different specific routes, all pain signals travel along the same general pathway. In response to neurotransmitters, which are chemicals released at the site of injury or inflammation, pain impulses move through nerve cells also called neurons to the spinal cord. After gathering momentarily at the dorsal horn, a type of central switching facility in the spinal cord, pain travels up the spinal cord and through the thalamic region of the brain until it finally reaches the cerebral cortex where it is actually perceived. Blocking any of the chemicals, channels or receptors involved in transmitting pain can potentially interrupt the signals and, therefore, relieve pain. Future Trends An NDA for ziconotide, the first in a new class of pain relievers called neuronal calcium channel blockers, was submitted in December The FDA not only accepted this application in February 2000 but also promised to make a decision regarding its approval by September. 59
62 If approved, ziconotide will be administered directly into the area surrounding the spinal cord to treat intense chronic pain that has been unresponsive to other therapies. ABT-564, an experimental drug derived from the skin of poisonous frogs, seems to produce analgesic effects without the addiction and withdrawal problems associated with narcotics. This may be due to the fact that ABT-564 attaches to nicotine receptors instead of the opiod receptors that are affected by narcotics. Still in early stages of development, Prosaptides are a group of peptides derived from natural proteins that affect damaged nerve tissues in a number of positive ways. Prosaptide TX14a, the most advanced drug in this new therapy class, is in Phase II clinical trials for the treatment of neuropathies and pain resulting from the complications of diabetes and other conditions. Scientists are also studying the pain controlling aspects of drugs that have already been approved for the treatment of other conditions. An example is the use of Botox, a refined injectable form of the toxin that causes botulism. Currently used in the treatment of strabismus and blepharospasm, conditions that affect the eye, Botox is now being studied for use in migraine headaches, back pain, whiplash and temporomandibular joint (TMJ) disorder. Remicade (infliximab), a monoclonal antibody originally approved to treat the intestinal disorder Crohn s Disease, has now been approved for use in rheumatoid arthritis (RA). Duraclon (clonidine hydrochloride injection), a higher dose injectable form of an alpha blocker that is used orally for hypertension and benign prostatic hyperplasia, has orphan indications in the treatment of severe pain as well. ANTI-RHEUM (NSAIDS AND COX-2S) Non-steroidal anti-inflammatory drugs (NSAIDs) relieve pain by suppressing production of prostaglandins. As a side effect, NSAIDs can cause GI problems because they interfere with cyclooxygenase 1 (COX-1), an enzyme that helps to preserve the lining of the stomach. Cyclo-oxygenase 2 enzyme blockers (COX-2s) work by blocking a specific enzyme involved in pain but not affecting COX-1. Celebrex (celecoxib) and Vioxx (rofecoxib) are the two COX-2s available in the United States. Already used for several types of pain, COX-2s are also likely to receive a flood of new indications. Celebrex is already approved for familial colonic polyps, a predisposing factor in the development of colon cancer. Still under investigation are the apparent protective effect of NSAIDs against Alzheimer s Disease and their possible use in irritable bowel syndrome, urinary incontinence and the complications of diabetes. 60
63 Figure A4: Therapy Class Drug Market Share Trend Anti-Rheum (NSAIDS and COX-2s) 25 % % Change in PMPY Cost 39.2% 1999 PMPY = $ % 15 % Ibuprofen ($14.05) Naproxen ($49.83) 10 % Celebrex ($84.93) 5 % Relafen ($72.14) Daypro ($79.34) 0 % Vioxx ($75.97) Anti-inflammatories represent the second fastest growing class in 1999, increasing by 39.2 percent to $ This dramatic cost increase was driven primarily by the use of newly introduced more expensive COX-2 products Celebrex and Vioxx. Costing an average AWP per prescription of $84.93 and $75.97, respectively, Celebrex and Vioxx captured a combined 18.9 percent market share. In contrast, generic ibuprofen at an average cost of $14.05 and generic naproxen at $49.83 saw their combined market share decline from 43.4 percent in 1998 to 39.4 percent in The combined market share for Relafen (nabumetone), Lodine (etodolac), Lodine XL (etodolac extended-release) and Daypro (oxaprozin), all branded products, dropped from 20.4 percent to 14.3 percent between 1998 and Future Trends Mobic (meloxicam), is a new NSAID that was approved for osteoarthritis (OA) in April Patent protection is running out for Daypro in 2000 and for Relafen at the end of COX-2s in late stages of development are parecoxib, an injectable product for the management of acute pain; valdecoxib for pain and arthritis; and MK-663 for OA. 61
64 NARCOTIC ANALGESICS In the past, the fear that people who take narcotics may develop addictions or abuse the medications has kept many physicians from prescribing narcotics for chronic non-terminal pain. Attitudes about the use of narcotics are changing, however, and long-term narcotic prescriptions for patients outside of care facilities are becoming more common. Figure A5: Therapy Class Drug Market Share Trend Narcotic Analgesics 80 % 70 % % Change in PMPY Cost 31.1% 1999 PMPY = $ % 50 % 40 % 30 % 20 % Generic ($12.85) 10 % Ultram ($49.65) 0 % Darvocet-N 100 ($32.18) After growing 20.6 percent between 1997 and 1998, overall PMPY cost for narcotic analgesics continued its rapid ascent, rising 31.1 percent in 1999 to $9.24. PMPY utilization for this class grew by 8.3 percent. In contrast the average prescription cost rose by 21 percent. Per prescription cost increases of 25 percent were seen for generics, which accounted for 77.4 percent of the total class market share. In 1999 Ultram (tramadol) held its leading position among branded products with a 7.1 percent share of the market. The nasal drug Stadol NS (butorphanol nasal spray), reclassified as a controlled substance in 1998, is expensive (averaging $ per prescription). At only 0.8 percent of the market share, though, it shows a low level of use. Percocet (acetaminophen and oxycodone) is now available in four strengths making doses easier to adjust but also creating a greater potential for mistakes in both prescribing and dispensing. Future Trends Dirame (propiram) is an oral opiate that is close to NDA filing for moderate to severe pain. A skin patch that would deliver steady and controlled doses of marijuana is under research. Still in the preclinical stage of development, the marijuana patch is many from realization. It would potentially stimulate appetite as well as relieve pain for people who suffer from chronic painful conditions. 62
65 MIGRAINE PRODUCTS Approximately 12 percent of adults in the United States experience migraine headaches. Caused when blood vessels in the brain expand and become inflamed, migraine pain is often accompanied by nausea and sensory disturbances. In the 1990s, migraine treatment underwent a radical shift from older ergotamine-based drugs to more effective and more potent 5-hydroxytriptamine receptor agonists commonly referred to as triptans. Developed to affect specific serotonin receptors in the brain, all triptan drugs reduce inflammation and swelling in cranial arteries. In addition, triptan drugs reduce the excitability of certain cells in the brainstem and constrict various blood vessels in and around the brain. People with heart disease should use triptans only with a great deal of caution because these drugs also constrict coronary arteries. All the triptans produce milder side effects the so-called triptan sensation which involves flushing, tingling, anxiety and feelings of tightness in the chest or throat. Figure A6: Therapy Class Drug Market Share Trend Migraine Products 80 % 70 % % Change in PMPY Cost 16.3% 1999 PMPY = $ % 50 % Imitrex ($172.74) 40 % Generic ($15.97) 30 % Zomig ($151.26) 20 % Amerge ($169.18) 10 % Midrin ($18.33) 0 % Maxalt/MLT ($121.28) The PMPY cost of migraine products rose 16.3 percent from $5.50 in 1998 to $6.40 in The market share for Imitrex (sumatriptan injection, nasal spray and tablets) continued to decline in 1999, dropping from 60.1 percent in 1998 to 52.0 percent in Lost market share has gone to Zomig (zolmitriptan), Amerge (naratriptan) and Maxalt (rizatriptan), which saw their combined market share increase from 7.4 percent in 1998 to 19.0 percent in Motrin Migraine Pain became the second OTC product to be labeled specifically for the treatment of migraine headaches. It contains 200mg of ibuprofen the same active ingredient as regular Motrin. A migraine indication is also being sought for another non-prescription product, Advil (ibuprofen). 63
66 Future Trends Major news in the area of migraine headache treatment continues to center on triptans. An approvable letter was issued in October 1999 for another oral triptan, Relpax (eletriptan). Expected to be introduced in 2000, Relpax would be the fifth product of its type to be made available for the U.S. market. Another triptan, Miguard (frovatriptan), was declared approvable by the FDA in May Miguard has a longer duration of effectiveness than the other triptans, so it may prevent the rebound headaches that affect up to 40 percent of patients treated with triptans. An NDA has been filed for yet another triptan medication, Axert (almotriptan). In other research, an anticonvulsant medication, Depakene (valproic acid), prevented migraine attacks or sharply decreased their frequency among patients in study groups. Depakote (sodium valproate), a medication closely related to Depakene, already has FDA approval for migraine prevention. Neurontin (gabapentin), another antiepileptic drug, shows effectiveness in preventing or alleviating migraine attacks, as well. Other drug classes that have been used successfully to prevent migraines are beta blockers, calcium channel blockers and antidepressants. In ongoing trials, Botox (botulinum toxin type A) has shown reductions in both severity and frequency of migraines for approximately three months after being injected directly into the foreheads of migraine sufferers. Botox is a neurotoxin that is already approved for certain conditions that affect the eye. Botox not only has orphan drug status in a number of other neuromuscular conditions, it is also being studied for other types of headaches as well as for other chronic pain syndromes. A fairly rare type of migraine appears to be caused by distinct genetic mutations, leading researchers to speculate that other kinds of migraine may also have hereditary causes. Other very preliminary studies seem to indicate a link between migraines and H. pylori, the bacterium that causes stomach ulcers. Additional research is needed in both areas, however, before any cause and effect can be determined. ANTICONVULSANTS Seizures or convulsions result from many different causes, the most common being epilepsy. Defined as a recurring disturbance of cerebral function, epilepsy generally is characterized by sudden, usually brief interruptions of consciousness, movement or sensory perception. Distinctly different types of epilepsy are classified by the kind of seizures experienced. The majority of people with epilepsy cannot identify one single cause of the condition. In other cases, seizures result from stroke, infection, head injury, high fever, congenital defects, metabolic abnormalities, brain tumors or CNS lesions. Several classes of medications are used to prevent, abort or alleviate seizures. 64
67 Figure A7: Therapy Class Drug Market Share Trend Anticonvulsants 30 % 25 % % Change in PMPY Cost 29.0% 1999 PMPY = $ % 15 % 10 % 5 % Generic ($37.89) Depakote ($88.34) Neurontin ($114.17) Dilantin ($26.89) Tegretol ($46.62) 0 % Anticonvulsant PMPY costs increased to $7.13 in 1999 a 29.0 percent rise from 1998 due to increases in both use and cost per prescription. Neurontin (gabapentin) continued to gain market share attaining a 17.1 percent level in 1999, while market share for generic products also grew to 29.1 percent. However, some generics may not be absorbed in the same ways as their branded counterparts. The market share for Depakote, Dilantin (phenytoin), Tegretol (carbamazepine), Tegretol XR (carbamazepine extended release) and Klonopin (clonazepam) declined from 54 percent in 1998 to 45.2 percent in Of products with market shares above 4 percent, the average change in prescription cost of Dilantin, Klonopin and generic products was virtually flat, while costs for Tegretol XR, Depakote, Tegretol and Neurontin rose by 11.3 percent, 7.7 percent, 7.7 percent and 3.7 percent respectively. Future Trends A new antiepileptic medication that could be very promising is Keppra (levetiracetam). Approved in December 1999 for combination therapy in adults with partial seizures, Keppra has not shown any significant interactions with other drugs, including other epilepsy medications. Zonegran (zonisamide) has also been approved. An oral drug unrelated to other anticonvulsants, Zonegran is indicated for combination therapy in adults with partial seizures. Neurontin goes off patent in 2000.The makers of Neurontin have introduced new, higher dose tablets that simplify dosing regimens. Neurontin continues to be used extensively for the treatment of chronic pain not yet an FDA-labeled indication. Trileptal (oxcarbazepine) was approved Jan. 17, 2000, as monotherapy for partial seizures in 65
68 adults. It is also indicated as adjunctive therapy in adults and children 4 and older. In clinical trials, Trileptal had fewer interactions and side effects than older counterparts. A potentially important antiepileptic drug called pregabalin is in Phase III clinical trials for both epilepsy and pain indications. Similar to Neurontin, pregabalin may be marketed in the United States as early as In Europe, several anticonvulsants, including gabapentin, are in late stages of clinical trials for bipolar disorder. C ARDIOVASCULAR The multitude of conditions that can affect the heart and blood vessels has prompted the discovery of drugs that act directly or indirectly to lower blood pressure, improve heart function, relieve irregular heartbeats or reduce the amount of cholesterol in the blood. Angiotensin-converting enzyme inhibitors (ACEIs), angiotensin receptor blockers (ARBs), beta blockers, calcium channel blocker (CCBs) and antihyperlipidemics are all discussed separately. Other kinds of heart drugs include diuretics that reduce fluid load to relieve stress on the heart; digitalis, which improves the pumping of the heart; nitrates that relieve angina by relaxing the muscles in blood vessels; and anticoagulants, which prevent blood clotting. Aldactone (spironolactone), a potassium-saving diuretic that has been in use for, gained new popularity as the result of 1999 s RALES (Randomized Aldactone Evaluation Study). The progression of heart failure was prevented so well in RALES participants that the study was stopped early. New guidelines for the management of chronic stable angina written by a joint task force of the American College of Cardiology and the American Heart Association were published in June Among other recommendations, the guidelines suggest the use of aspirin or beta blockers as first-line therapy to prevent heart attacks in angina patients who have no contraindications. Extended-release CCBs are the choice for patients who cannot take aspirin or beta blockers. In October 1999, an anti-arrhythmic agent, Tikosyn (dofetilide), became the first oral therapy in 10 to receive FDA approval for atrial fibrillation. A selective potassium channel blocker that can cause paradoxical arrhythmias, Tikosyn will be prescribed only by physicians who have completed specialized training. Future Trends Concerns about possible side effects including angioedema prompted the manufacturer of Vanlev (omapatrilat) to withdraw the NDA. Vanlev is a vasopeptide inhibitor (VPI) one of a new class of medications that fight hypertension by blocking both angiotensin-converting enzyme (ACE) and another enzyme called neutral endopeptase (NEP). New studies will be done for Vanlev, and its NDA may be re-filed as early as Another novel chemical compound, Natrecor (nesiritide), is a human b-type natriuretic peptide that has been filed for first-line IV use in patients with heart failure (HF) needing rapid and sustained relief. An FDA Advisory Committee has recommended that Natrecor be approved, but the agency has requested more information before proceeding with approval. 66
69 ANTIHYPERTENSIVES An ACEI is still the drug of choice for initial therapy in people with hypertension who also have diabetes, HF or systolic dysfunction after a heart attack. ARBs are a newer group of drugs that produce an antihypertensive effect similar to the ACEIs, but they have yet to demonstrate long-term protective effects on heart or kidney function. Figure A8: Therapy Class Drug Market Share Trend Antihypertensives 20 % % Change in PMPY Cost 12.3% 1999 PMPY = $ % Zestril ($34.59) Accupril ($35.40) 10 % Vasotec ($52.47) Lotensin ($29.36) 5 % Prinivil ($34.68) Cozaar ($50.00) 0 % Hyzaar ($48.26) From 1998 to 1999, PMPY costs for antihypertensives grew by 12.3 percent, with rising utilization accounting for about two-thirds of this increase. Nearly 20 ACEIs and ACEI combination products are on the U.S. market. Because most are therapeutically interchangeable for hypertension, favorable price competition exists. Several of the more commonly used ACEIs are also indicated for HF. The market share among the myriad of products in this class changed little between 1998 and The only product having any appreciable market share change (about 2 percent) was the most expensive drug, Vasotec (enalapril), which continued to decline to 6.5 percent in The results of several studies such as ATLAS (Assessment of Treatment with Lisinopril), HOPE (Heart Outcomes Prevention Evaluation), the Studies of Left Ventricular Dysfunction Trial and the Survival and Ventricular Enlargement Trial prove that ACEIs used in higher doses not only improve quality of life for HF patients but also reduce the risk of cardiovascular events. Whether this protection is offered by all members of the class remains to be tested, however. Approval was granted in May 1999 for once daily dosing of an ARB, Teveten (eprosartan), which had been approved in 1997 as a twice-a-day product. Teveten was not marketed in the United States until mid
70 Aceon (perindopril erbumine), the American version of a once-daily ACEI that has been used in Europe for several, was launched in October Future Trends Although patent protection has been extended by six months due to ongoing investigation for pediatric use, Vasotec and Vaseretic (enalapril and hydrochlorothiazide) will still go generic in August Zestril (lisinopril), Prinivil (lisinopril) and Accupril (quinapril) are all scheduled to go off patent in 2001, followed by Monopril (fosinopril) in CALCIUM BLOCKERS Muscles contract and expand in response to stimulus from chemicals like sodium and calcium. Drugs known as calcium channel blockers (CCBs) prevent the entry of calcium into muscle cells, causing blood vessel walls to relax and reducing resistance to blood flow. As a result, the heart does not have to pump with as much force, so conditions like hypertension are relieved. Figure A9: Therapy Class Drug Market Share Trend Calcium Blockers 30 % 25 % % Change in PMPY Cost 2.7% 1999 PMPY = $ % 15 % Norvasc ($56.08) 10 % Generic ($44.69) Cardizem CD ($63.80) 5 % Procardia XL ($70.36) 0 % Adalat CC ($54.89) Since 1994 the trend in both use and price of this therapy class has been relatively flat. Between 1998 and 1999, overall PMPY costs rose by a modest 2.7 percent. During the same period, utilization of these products dropped by 0.7 percent, while the per prescription cost rose by 3.4 percent. The market share for generic CCBs continued to increase reaching 23.5 percent in Norvasc (amlodipine) continued to lead the class in 1999 as its market share grew from 25 percent in 1998 to 28.6 percent in Norvasc s manufacturer is attempting to shift market share from its older CCB, Procardia XL (nifedipine extended-release). Nifedipine extended-release, the first generic equivalent for Procardia XL, was approved in December However, the generic is BC rated to the brand name product, which means 68
71 that studies proving both the rate and the extent of the active ingredient s absorption have not been submitted to the FDA, even though the generic contains the same active ingredients as the branded product. The market share for Cardizem CD (diltiazem extended-release capsules), the third largest product in this class, continued to erode to 12.3 percent in Virtually all other CCB products either lost or barely maintained their respective market shares. Also in December 1999, a generic version of Cardizem CD was FDA approved. Generics for immediate-release diltiazem tablets and sustained-release diltiazem tablets were already available on the U.S. market. Future Trends Plendil (felodipine) will go off patent for its hypertension indication in BETA BLOCKERS Beta blockers affect the cardiovascular system in several different ways. They decrease both the speed and the force of heartbeats, and they relax muscles in blood vessel walls. Not only do beta blockers reduce blood pressure, they are also effective in angina and some kinds of arrhythmias. Many beta blockers are available as generics. Figure A10: Therapy Class Drug Market Share Trend Beta Blockers 80 % 70 % 60 % % Change in PMPY Cost 11.2% 1999 PMPY = $ % 40 % Generic ($28.01) 30 % Toprol XL ($25.32) 20 % Tenormin ($43.03) 10 % Lopressor ($37.13) 0 % Corgard ($59.87) The overall 1999 PMPY cost increased by 11.2 percent over 1998 levels, most of which is attributable to increased utilization. This class continued to be dominated by generics, which captured 76.1 percent of the 1999 market. 69
72 Among the branded products, Toprol XL (metoprolol extended-release), is the largest seller, growing steadily from a 3.1 percent market share in 1994 to 13.5 percent in New studies demonstrate that beta blockers can be beneficial in patients with HF a reversal of previous recommendations. Two major studies the MERIT-HF (The Mortality Effect of Metoprolol CR/XL in Patients with Heart Failure) trial and the U.S. Carvedilol Heart Failure Study were ended early because results were so good. Another trial, BEST (Beta Blocker Evaluation of Survival Trial), also showed that beta blockers have value in early stages of HF, particularly for Caucasian patients and people with diabetes. Coreg (carvedilol) is currently the only beta blocker to have FDA approval for HF patients. Future Trends Betapace AF (sotalol), a reformulated beta blocker already used for ventricular arrhythmias, was approved in February 2000 for a more common and less life-threatening condition atrial fibrillation. It must be given in a clinical setting because it can actually precipitate arrhythmias. ANTIHYPERLIPIDEMICS In addition to the fats eaten in foods, certain types of fats or lipids are manufactured by the body for use in essential body functions. Cholesterol, for example, is necessary to make bile and steroid hormones. When the wrong kinds of fat cholesterol, low density lipoproteins (LDLs) and triglycerides stay in the blood, a condition variously called hyperlipidemia, hypercholesterolemia or high cholesterol results. Fatty deposits can form on artery walls causing narrowing, inflexibility and even blockages that contribute to heart disease. High blood levels of another fat called high density lipoproteins (HDLs) are desirable because they protect against heart disease. When exercise, weight loss and the limitation of dietary fats fail to reduce blood lipid levels, antihyperlipidemic medications can be added. By far the most common drug type prescribed for high cholesterol is an HMG-CoA reductase inhibitor commonly called a statin. These oral drugs reduce cholesterol by interfering with an enzyme that regulates cholesterol production in the liver. An older class of medications, called bile acid sequestrants or ion exchange resins, lowers cholesterol levels by attaching to bile and pulling it out of the body. The creation of new bile requires that cholesterol be removed from the blood. Since bile acid sequestrants are not absorbed by the body, they have few side effects. A third group of drugs, fibric acid derivatives, is most effective in reducing triglycerides by changing the metabolism of dietary fats. 70
73 Figure A11: Therapy Class Drug Market Share Trend Antihyperlipidemics 50 % % Change in PMPY Cost 20.9% 1999 PMPY = $ % Lipitor ($78.60) 30 % Zocor ($106.18) Pravachol ($89.31) 20 % Gemfibrozil ($58.96) 10 % Lescol ($42.16) Mevacor ($106.37) 0 % Lopid ($81.25) 1999 PMPY expenditures for antihyperlipidemic medications continued to grow substantially. Between 1998 and 1999, these costs grew by 20.9 percent to $28.17, making it the third highest expenditure class. This overall cost increase was driven almost exclusively by increased utilization 18.1 percent over 1998 levels. Prices for these products have not risen sharply due to price competition among the many products in the statin market. Lipitor (atorvastatin) continued its meteoric success since its March 1997 market entry. In 1997, Lipitor claimed a 14.1 percent market share, a level that rose to 43.9 percent in This growth in market share in turn decreased the market share for virtually all other products in the class. For example, between 1998 and 1999, the market share for Pravachol (pravastatin) dropped from 16.4 percent to 15.0 percent, for Zocor (simvastatin)/mevacor (lovastatin) from 31.6 percent to 24.2 percent and for Lescol (fluvastatin) from 7.2 percent to 4.3 percent. In 1999 Zocor became the first statin to be FDA-approved for raising HDL. Future Trends Patent protection for both major bile acid sequestrants, Questran (cholestyramine) and Colestid (colestipol), has expired. Generic equivalents for Questran are marketed in the United States under the names Prevalite, LoCholest and cholestyramine. No generic is currently available for Colestid. An NDA for Welchol formerly named Cholestagel (colesevelam) is under FDA review. A polymer-based product that is not absorbed, Cholestagel can be used as monotherapy or in combination with a statin. Additionally, it can be taken with meals either once or twice a day. An application for the approval of a new, 80mg extended-release form of Lescol was submitted to the FDA in December
74 The patent for Mevacor is scheduled to expire in All other branded statin products have several more of patent protection. A new statin called ZD 4522, currently in clinical trials, is expected to be approved in 2002 or Preliminary data show that ZD 4522 produces greater lowering of LDL than statins presently available in the U.S. In research news, a gene called ABC1 has been identified as being involved in the production of HDL cholesterol. In preclinical lab experiments, increased ABC1 levels resulted in lowered total cholesterol levels in cultured cells. Despite large amounts of evidence that reducing LDLs can lower heart attack risk substantially, a recent study found that many high-risk patients do not receive cholesterol-lowering medications. Women especially are not likely to be given drugs to control cholesterol, according to the research which was published in the February 2000 Archives of Internal Medicine. R ESPIRATORY Respiratory conditions can be as mild as an annoying seasonal allergy or as serious as a life-threatening asthma attack. Medications for respiratory conditions available in oral and inhaled dosage forms include antihistamines, corticosteroids, beta agonists, decongestants and various combination products. Inhaled medications that are used to treat asthma get into the lungs faster to open constricted bronchioles. During the past few, worldwide environmental initiatives have emphasized the removal of ozone-damaging chlorofluorocarbons (CFCs) from the propellants used in inhalers. As a result, new kinds of inhaler devices are available that deliver dry powdered medications or a finer aerosol spray than the metered dose inhalers (MDIs) that are being replaced. The FDA approved three new anti-allergy eye drops in Alamast (pemirolast potassium ophthalmic solution) and Alocril (nedocromil sodium ophthalmic solution 2%) are mast cell stabilizers. Zaditor (ketotifen fumarate ophthalmic solution) combines mast cell stabilization with a histamine blocker. All three relieve itchy eyes associated with allergies. ANTIASTHMATICS In asthma, chronic inflammation of lung tissues causes sensitive and blocked air passages called bronchioles. Symptoms of asthma include wheezing, coughing and shortness of breath. Acute asthma attacks can be triggered by numerous factors such as exercise, allergens or stress. People with asthma usually need two types of medications: controllers to suppress inflammation and relievers to alleviate acute asthma attacks. Controllers must be taken on a regular basis. Some classes of controller medications are long-acting beta agonists, leukotriene modifiers, mast call stabilizers, inhaled corticosteroids (ICSs) and oral corticosteroids. Relievers such as short-acting beta agonists and anticholinergic agents are taken to stop an attack. 72
75 Figure A12: Therapy Class Drug Market Share Trend Antiasthmatics 30 % 25 % % Change in PMPY Cost 11.6% 1999 PMPY = $ % Albuterol Inhaler ($25.47) 15 % Albuterol Sulfate ($32.26) 10 % Serevent ($66.61) Azmacort ($58.46) 5 % Vanceril ($45.85) 0 % Beclovent ($50.21) In 1999 PMPY cost of antiasthmatics grew by 11.6 percent to $13.57, although PMPY utilization rose by only 4.3 percent. Albuterol (brand name Proventil or Ventolin ) is the most widely used beta agonist. Albuterol inhalers have been available generically since early The market share for the generic forms remained stable at 26 percent in The use of the long-acting beta agonist, Serevent (salmeterol) often considered a niche product for nocturnal asthma symptoms maintained its market share of 7.3 percent. Because Serevent has a slow (15-30 minute) onset of action, it should not be used to treat acute asthma symptoms. It is used instead as a daily controller medication, often in combination with an anti-inflammatory agent. The newest controller medications for asthma are the leukotriene modifiers Accolate (zafirlukast), Zyflo (zileuton) and Singulair (montelukast). The National Asthma Education and Prevention Program (NAEPP) guidelines list these products as an alternative to ICSs in mild persistent asthma. Taken as tablets, all the leukotriene modifiers are for long-term control of asthma so they must be taken continually. These products have low overall market share because they are usually either prescribed in combination with other products or used as a second-line therapy. The market share for Singulair grew from 2.2 percent in 1998 to 6.5 percent in 1999, while the market for Accolate declined slightly to 3.2 percent. Flovent (fluticasone) Rotadisk, Serevent, Diskus and Pulmicort (budesonide) Turbohaler are some of the currently available dry powder dosage forms. Designed not only to eliminate the need for CFC propellants, they also simplify the administration of inhaled medications. Their redesigned inhaler style eliminates much of the hand-eye-breath coordination that makes liquid inhalers difficult to use for children, elderly and disabled 73
76 patients. In 1999 Flovent increased its market share to 7.1 percent, whereas Pulmicort increased its share to 1.1 percent. Vanceril and Beclovent, the two brand-name products of an orally inhaled corticosteroid called beclomethasone dipropionate, went off patent in However, the FDA does not recognize the generic version of beclomethasone dipropionate as therapeutically equivalent to the branded products. Both have market shares of less than 2 percent. Future Trends An FDA Advisory Committee recommended Advair for approval in November Administered with a patented Diskus device, Advair combines a long-acting beta agonist (salmeterol) with a corticosteroid (fluticasone). An NDA was submitted in November 1999 for Asmanex (mometasone furoate inhalation powder). If used regularly for the prevention of asthma attacks, Asmanex may reduce the need for oral steroids in some asthma patients. A version of the same active drug in a metered-dose inhaler is still in Phase III clinical trials, but it seems to offer no advantage over existing products. Singulair received a new indication for children as young as two old. Approved in March 2000, the new cherry-flavored 4mg tablet is meant to be given once a day. Singulair was previously available only as 10mg tablets for adults and as 5mg chewable tablets for children from 6-14 of age. The NDA for a CFC-free beclomethasone inhaler has been filed with the FDA. The medication, Qvar (hydrofluoroalkane-134a beclomethasone dipropionate), uses a press-and-breathe (P&B) inhaler device that delivers a smaller particle size and uses less force than earlier inhaler sprays. As a result, the inhaler is easier to use. Patients may require smaller doses as well, since more active drug will reach their lungs. Formoterol is a beta agonist with both rapid onset and long duration, so it can be used not only to prevent asthma attacks but also to treat an attack once it has begun. The European Union approved a type of formoterol called Oxis Turbuhaler in January In the United States, formoterol with the brand name Foradil was taken under consideration by the FDA in late Approval has been delayed, however, by questions about the manufacturing processes used in Foradil s production. In a completely new approach to asthma therapy, researchers have reported positive results from Phase III trials of a biological, anti-ige. IgE (immunoglobulin epsilon) is a protein made by cells in the respiratory tract. It provokes the release of histamines, leukotrienes and prostaglandins that in turn cause allergic reactions. Anti-IgE, also called rhumab-e25 or olizumab, is a humanized monoclonal antibody that interferes with the action of IgE. Anti-IgE will be injected twice a week for allergic asthma and for seasonal allergic rhinitis. U.S. filing for approval is anticipated in
77 ANTIHISTAMINES Allergies are acquired, exaggerated sensitivities to substances called allergens which normally do not produce reactions. Allergic rhinitis is a common form of allergy produced primarily by airborne allergens. Typical symptoms of allergic rhinitis like sneezing, nasal congestion and itchy eyes can be seasonal or chronic. Other types of allergy may show as rashes, wheezing or, rarely, as very severe swelling of the throat. Oral antihistamine tablets and capsules are the most popular type of medication to treat systemic allergy symptoms. Newer non-sedating products have virtually replaced first-generation antihistamines that cause drowsiness. Figure A13: Therapy Class Drug Market Share Trend Antihistamines 60 % 50 % % Change in PMPY Cost 25.8% 1999 PMPY = $ % Claritin ($66.41) 30 % Zyrtec ($52.40) 20 % Allegra ($51.68) 10 % Generic ($4.59) Hismanal ($69.78) 0 % Seldane ($48.98) After growing 38.5 percent between 1996 and 1997, another 25.2 percent in 1998, PMPY costs for antihistamines grew 25.8 percent more in In all of these, the cost increases were largely due to substantial increases in utilization. Most of the increase in cost took place among the non-sedating antihistamines Claritin (loratidine) and Allegra (fexofenadine) and the low-sedating product Zyrtec (cetirizine). All of these products have been promoted heavily through DTC advertising. The use of Claritin, the market leader, increased from 28.3 percent in 1994 to 50.6 percent in 1998, before declining somewhat to 48.8 percent in The AWP per prescription for Claritin was $66.41 in 1999, a 5.9 percent rise over 1998 levels. Allegra s market share rose to 19.0 percent in Allegra has an average cost of $51.68 per prescription, 11.9 percent over 1998 costs. Zyrtec, although relatively new, is increasing in use, reaching a 19.9 percent market share. It had an AWP of $52.40 in percent over 1998 costs. Hismanal (astemizole) was taken off the U.S. market June 28, 1999, due to sharply declined sales after the FDA cautioned in February about potentially dangerous reactions when it was taken with certain other drugs or when it was used in higher than recommended doses. 75
78 The FDA has approved two new strengths and one new indication for Allegra. In addition to the original 60mg tablet indicated for twice-a-day adult dosing, it is now available as a 180mg tablet for once-a-day dosing in adults and as a 30mg tablet that can be given up to twice daily to children between 6 and 11 of age. Allegra is also indicated for the treatment of chronic idiopathic urticaria an unexplained skin condition characterized by itchy hives. Future Trends The makers of Claritin hope that a loratidine metabolite, desloratadine, will win FDA approval for the treatment of seasonal allergic rhinitis in Desloratadine was filed for approval in both the United States and the European Union in November Phase III clinical trials are nearing completion for norastemizole, a metabolite of astemizole. Research has shown that norastemizole provides a non-sedating antihistamine effect without the interaction or side effect problems associated with astemizole. An NDA could be filed with the FDA by the end of the year for this once-a-day allergy medication. Development of Kestine (ebastine), an oral non-sedating antihistamine, was essentially stopped after a not-approvable letter was issued by the FDA in April DECONGESTANTS (NASAL STEROIDS) Nasal corticosteroids (NCSs) are often used for localized allergic rhinitis symptoms. Sprayed directly into the nose, they reach inflamed passages quickly to reduce swelling and to decrease nasal secretions. Because very little of the drug is absorbed, nasal steroids do not produce the side effects associated with oral corticosteroids. Figure A14: Therapy Class Drug Market Share Trend Decongestants (Nasal Steroids) 35 % 30 % % Change in PMPY Cost 17.5% 1999 PMPY = $ % 20 % Flonase ($50.78) 15 % 10 % Nasonex ($50.33) Vancenase AQ ($52.39) Rhinocort ($36.93) 5 % Nasacort AQ ($40.85) 0 % Beconase AQ ($44.61) 76
79 NCSs include only branded products at this time. The most commonly used products are Flonase (fluticasone), which increased its 1999 market share to 33 percent, and Nasonex (mometasone), which captured a 14.4 percent market share in In contrast, market shares for other products either grew marginally or declined. Vancenase AQ (beclomethasone aqueous) saw its market share drop from 18.4 percent in 1998 to 11.3 percent in Beconase AQ s (beclomethasone aqueous) market share declined by about one-third to 6.3 percent, Nasacort s (triamcinolone) market share increased slightly to 12.5 percent and Rhinocort s (budesonide) market share fell to 10.5 percent. The patent for Beconase and regular-strength Vancenase expired in Although a generic has been introduced, it is not rated as therapeutically equivalent by the FDA. Vancenase DS (beclomethasone dipropionate monohydrate inhalation 0.084mg/inhalation) is still only available as a branded product. COUGH AND COLD Most cough and cold therapies are available over the counter. The few prescription medications available to treat upper respiratory conditions consist mainly of products that combine prescription antihistamines with decongestants. Figure A15: Therapy Class Drug Market Share Trend Cough and Cold 60 % 50 % % Change in PMPY Cost 21.1% 1999 PMPY = $ % 30 % 20 % Generic ($10.45) 10 % Claritin-D 12 Hour ($63.60) Allegra-D ($49.63) 0 % Entex LA ($34.34) PMPY costs grew by 21.1 percent, with utilization increases accounting for about 13 percent of this increase. This class of drugs consists primarily of generic products that represent a flat 60 percent of the market. Claritin -D (loratidine and pseudoephedrine), a combination product that includes a non-sedating antihistamine, made up 17.9 percent of the 1999 market, a decrease from the 19.6 percent share it enjoyed in The only other branded combination product of any importance in this class is Allegra -D (fexofenadine and pseudoephedrine), 77
80 which doubled its market share to 6.2 percent in Whereas the average AWP cost per prescription is $10.45 for generic products (an increase of 8.9 percent over 1998 levels), it is $63.60 for Claritin -D and $49.63 for Allegra -D. Average prescription costs grew by 8.4 percent for Claritin -D and by 12.7 percent for Allegra -D. Future Trends A generic version of Claritin -D 24-hour was submitted for FDA approval in February If approved, it will be the first equivalent to the branded product to be approved under provisions of the Hatch-Waxman Act, and it will have a six-month period of exclusivity. An NDA for Zyrtec-D (cetirizine and pseudoephedrine) is expected to be filed with the FDA during A NTI-INFECTIVES Drugs used to treat bacterial infections either destroy bacteria (bactericides) or slow down bacterial replication (bacteriostats). Some antibacterial agents are only effective against certain types of bacteria or for specific types of infections. Most, however, have a broad-spectrum of activity, which means they can be used for a number of different infections. The overuse of antibiotics has lead to mutations that make some bacteria resistant to previously effective medications, especially in developing areas of the world. To combat the worldwide problem of bacterial resistance, pharmaceutical manufacturers are studying completely new chemical classes. For example, Synercid (quinupristin and dalfopristin) is the first agent to be approved in a new class of antibiotics called streptogramins. Given as an injection, Synercid will be reserved for infections that are resistant to vancomycin currently the most potent antibiotic available in the United States. Future Trends A completely new antibiotic product approved in 2000 is Zyvox (linezolid), which represents a class called oxazolidinones. Like Synercid, Zyvox will be used for pneumonia, skin infections and some serious systemic infections that do not respond to other antibiotic therapies. It will be available in both oral and IV formulations. An NDA for Ketek (telithromycin), the first antibiotic in a new class known as ketolides, was filed with the FDA in March Ketolides are similar to macrolides. Ketek has been formulated for once-a-day oral dosing in the treatment of four common respiratory infections. A fourth new class of antibiotics is designated BPIs (bactericidal/permeability-increasing proteins). Derived from a protein found in human white blood cells, BPIs are biologic products that will probably be used only in a hospital setting. The drug that is closest to general marketing in the United States is Neuprex (rbpi-21). Neuprex has already received an orphan designation for the treatment of meningococcemia, a very serious systemic infection caused by a type of bacteria that also causes meningitis. 78
81 CEPHALOSPORINS Similar to the penicillins in structure, cephalosporins kill bacterial cells by disrupting the formation of viable bacterial cell walls. At least four distinct generations of cephalosporins have specific activity against different groups of bacteria that cause respiratory, genital, urinary and skin infections. Figure A16: Therapy Class Drug Market Share Trend Cephalosporins 50 % 40 % % Change in PMPY Cost 3.8% 1999 PMPY = $ % Cephalexin ($27.55) Cefzil ($64.21) 20 % Ceftin ($85.94) 10 % Cefaclor ($59.33) Suprax ($58.75) 0 % Ceclor ($70.85) PMPY expenditures for cephalosporins rose by a nominal 3.8 percent. This slight increase was due to increased prescription costs as utilization for this drug class actually declined by 1.4 percent. The market share for generic cephalexin remained stable at 45.8 percent. The use of another generic, cefaclor, (often used to treat otitis media) continued to decline from a peak of 14.5 percent in 1996 to 6.2 percent in 1999 owing to the availability of more effective second-line antibiotics. The preference for two second generation branded cephalosporins, Cefzil (cefprozil) and Ceftin (cefuroxime), continued slow growth. The market share for Cefzil rose marginally to 16.2 percent, while the share for Ceftin increased to 14.1 percent in Third generation cephalosporins, Suprax (cefixime), Vantin (cefpodoxime) and Cedax (ceftibuten), have relatively low use, which seems to be declining. Omnicef (cefdinir), a third generation cephalosporin introduced to the U.S. market in October 1998, offered nothing new to the already crowded class but still managed to grow in market share from 0.3 percent in 1998 to 1.7 percent in A number of brand name cephalosporins either just lost patent protection or face patent loss in Among them are Vantin (cefpodoxime proxetil suspension and tablets), Suprax (cefixime suspension and tablets) and Duricef (cefadroxil capsules). Patents for hospital products Cefobid (cefoperazone for injection), Mefoxin (cefoxitin for injection) and Fortaz and Tazicef (ceftazidime for injection) have all expired. 79
82 Future Trends In January 2000 an NDA was submitted for Spectracef (cefditoren pivoxil) a new broad spectrum oral cephalosporin for the treatment of respiratory and skin infections in adults. Clinical trials for the effectiveness of Spectracef in pediatric patients are still being conducted. MACROLIDES Macrolides belong to an antibiotic class that was named for the large or macro chemical structure they share. Erythromycin, the oldest currently used member of the group, is derived from Streptomyces erythraeus an organism found in soil. Macrolides are bacteriostats, which means they stop bacteria from reproducing rather than killing bacteria like some other types of antibiotics do. Drugs in the Macrolide class are particularly effective against opportunistic infections in immunocompromised patients. Macrolides are also used as a part of the triple therapy regimens for eradicating H. pylori. Figure A17: Therapy Class Drug Market Share Trend Macrolides 60 % 50 % % Change in PMPY Cost 19.0% 1999 PMPY = $ % 30 % Zithromax ($38.16) 20 % Biaxin ($66.04) Generic ($17.37) 10 % E-Mycin ($15.91) 0 % PCE ($46.85) Overall the rate of growth in PMPY cost for macrolides grew by 19 percent in 1999, after growing by only 7.7 percent between 1997 and About two-thirds of this growth was attributable to rising utilization rates. Zithromax (azithromycin), Biaxin (clarithromycin) and generic macrolides account for about 94 percent of all drug use in this category. Zithromax dominates this therapy class with a 1999 market share of 57.2 percent more than double its 1996 share. This increased market share came at the expense of both generic erythromycins, which continued to decline from a 26.7 percent market share in 1996 to 14.5 percent in 1999, and Biaxin whose market share declined from a peak 34.6 percent in 1996 to 22.4 percent in In first quarter 1998, Dynabac (dirithromycin) was given approval for additional indications, as well as approval for shorter dosing periods. 80
83 Future Trends Biaxin XL, a once-a-day version of clarithromycin, was approved and launched in the first half of Biaxin was previously formulated for twice-a-day dosing. PENICILLINS Penicillins work by disrupting bacterial ability to make cell walls and to keep them intact. Penicillins are widely used as first-line treatment against common childhood infections like otitis media, as well as in multiple respiratory and urinary tract infections in adults. As one of the first classes of antibacterial medications to be discovered, many of the penicillins are available in generic form. Figure A18: Therapy Class Drug Market Share Trend Penicillins 100 % 80 % % Change in PMPY Cost 19.2% 1999 PMPY = $ % 40 % 20 % Generic ($7.84) 0 % Augmentin ($72.73) After growing by a modest 4.3 percent between 1997 and 1998, the PMPY cost of this class rose by 19.2 percent in 1999, almost all of which is attributable to increased costs per prescription. Augmentin (amoxicillin and sodium clavulanate) is the only branded product in this class with significant use. Its average prescription price grew by 8.2 percent to $72.73 in 1999 compared with the 3.7 percent rise to a $7.84 average price for generic products. The use of Augmentin had been steady at approximately 13 percent from 1993 through In 1997, its market share increased to 17.1 percent, then continued to grow reaching 21.7 percent in During summer 1999, a shortage of penicillin G, an injectable form of penicillin used mainly in hospitals, called attention to a larger potential problem. A combination of factors caused supplies of the raw materials that are needed for several penicillins, cephalosporins and other antibiotics to become scarce. Alternatives exist for most of the medications in short supply, but not all the substitutes work as well as the drugs they are replacing. 81
84 Future Trends The U.S. patent on Augmentin was due to expire in 2002, but the company that makes it received a new patent apparently based on new antibacterial activity recently discovered in its clavulanate component. QUINOLONES Fluoroquinolones, usually called quinolones, were synthesized from an older class of antibiotics used primarily to treat urinary tract infections. Beginning in 1987, several second or third generation quinolones have been introduced into the U.S. market. The newer fluoroquinolones have a broad range of activity against multiple micro-organisms including some that are resistant to other antibiotics and a lower incidence of adverse effects compared with the older agents. Fluoroquinolones kill bacterial cells by interfering with enzymes called topoisomerase II (DNA gyrase) and topoisomerase IV. Figure A19: Therapy Class Drug Market Share Trend Quinolones 80 % 70 % 60 % % Change in PMPY Cost 25.1% 1999 PMPY = $ % 40 % Cipro ($73.81) 30 % Levaquin ($82.94) 20 % Floxin ($80.33) 10 % Trovan ($71.37) 0 % Noroxin ($64.61) Cipro s (ciprofloxacin) dominant market share continued to decline in After reaching a 76.4 percent market share in 1995, Cipro s share dropped to 60.2 percent in Floxin s (ofloxacin) maximum market share of 19.8 percent achieved in 1996, decreased to only 5.3 percent in The lost market shares for Cipro and Floxin went to Levaquin (levofloxacin), whose market share grew from 8.9 percent in 1997, when it was introduced, to 27.4 percent in At $82.94, Levaquin s average prescription cost is the highest among these three products. Tequin (gatifloxacin) and Avelox (moxifloxacin) were FDA approved in December 1999 for once-daily oral dosing in bronchitis, community-acquired pneumonias and sinusitis. Neither Tequin nor Avelox seems to cause photosensitivity, liver toxicity or interaction problems that are associated with other fluoroquinolones. 82
85 Less than two after it was approved by the FDA, Raxar (grepafloxacin) was voluntarily withdrawn from the world market in October 1999 after reports suggested that a rare but serious arrhythmia was associated with its use. In similar action, the European Community withdrew Trovan (trovafloxacin) because of its potential to cause liver toxicity. Trovan was introduced to the U.S. market in 1998 and it is still being used in this country, although cautiously. Future Trends An NDA for Factive (gemifloxacin) to be used against respiratory infections was filed with the FDA in December Patent protection for injectable forms of Floxin will begin to run out next year. Patents for the oral forms of both Floxin and Cipro expire in ANTIVIRALS Infections caused by viral organisms range from merely annoying head colds to life threatening illnesses like Acquired Immune Deficiency Syndrome (AIDS). Other viral illnesses include measles, mumps, chicken pox, shingles, influenza and chronic fatigue syndrome (CFS), as well as most types of hepatitis and some forms of meningitis. Intense research for treatments, vaccines and ultimately for cures effective against the human immunodeficiency viruses (HIV) that cause AIDS has also lead to the discovery of agents effective against other types of viruses. Drugs now available for the treatment of AIDS do not cure HIV infection, they only decrease viral duplication. Current anti-aids drugs fall into two broad therapy classes called protease inhibitors and reverse transcriptase inhibitors (RTIs). RTIs are either nucleosides (NRTIs) or non-nucleosides (NNRTIs). Each class represses an enzyme that is critical to the viral replication process, thereby decreasing the amount of virus in the blood, which is known as the viral load. For HIV-positive adults and adolescents, the goal is to suppress viral load for as long as possible. According to updated Guidelines for the Use of Antiretroviral Agents in HIV-Infected Adults and Adolescents, treatment should be available to all patients with acute or symptomatic HIV infection. Recommended therapy combinations are either a protease inhibitor or the NNRTI Sustiva (efavirenz) along with two NRTIs or one of the protease inhibitors Fortovase (saquinavir) or Norvir (ritonavir) along with one or two NRTIs. Some physicians are beginning to prescribe two protease inhibitors together to enhance effectiveness and improve adherence. New research suggests that non-compliance with complicated and lengthy treatment regimens may be as important as viral mutation in the development of resistance. Although vaccines are effective against quite a few viral diseases, a problem with developing vaccines to protect against some viral infections especially HIV is that viruses are constantly mutating. Antibodies produced by a vaccine may only work against some strains of a particular virus. As viruses change, they may also develop resistance to treatments that were once effective. 83
86 Figure A20: Therapy Class Drug Market Share Trend Antivirals 8 % 7 % 6 % % Change in PMPY Cost 39.9% 1999 PMPY = $ % 4 % Zerit ($285.42) 3 % Epivir ($258.03) 2 % Crixivan ($427.24) 1 % Videx ($206.31) 0 % Norvir ($425.07) The 1999 PMPY cost of antivirals grew at a faster rate, 39.9 percent, than any other class of drug. The introduction of new drugs, the increasing popularity of combination therapy and the growing number of patients in therapy caused PMPY costs to reach $10.29 in The average cost per prescription grew by more than 22 percent, suggesting that use of higher cost drugs account more than rising utilization for this dramatic PMPY cost increase. After growing dramatically between 1997 and 1998, the market share for generics declined somewhat to 30.3 percent in Two drugs for the treatment of herpes, Valtrex (valacyclovir) and Famvir (famciclovir), are the most widely used branded products in this category with a combined 32.6 percent market share in 1999, moderately above 1998 levels. After growing its market share to 7.1 percent in 1997, Epivir s (lamivudine) share continued to drop to 3.2 percent in Zerit (stavudine) saw its market share decrease slightly to 3.5 percent in Among the protease inhibitors, Crixivan (indinavir) continued to experience a slight market share decline to 1.9 percent, while Norvir (ritonavir) dropped to a 0.8 percent market share. The hot topic in antiviral medications for the winter season was the release of two new flu drugs, Tamiflu (oseltamivir oral tablets) and Relenza (zanamivir powder for inhalation). Both medications block an enzyme that keeps influenza viruses from reproducing and infecting new cells. Now indicated for treatment of flu symptoms within 48 hours of onset, Tamiflu and Relenza may be approved for the prevention of influenza as well by next flu season. In the battle against AIDS, a protease inhibitor called Agenerase (amprenavir) was given accelerated approval by the FDA and marketed in the United States during A soft 84
87 capsule form of the protease inhibitor, Norvir (ritonavir), was approved in July for twice daily dosing and Videx (didanosine), an NRTI, received approval for once-daily dosing in October A warning has been added to labeling for the NRTI Ziagen (abacavir) to caution about fatal hypersensitivity reactions that have been associated with its use. In addition, a new film-coated tablet dosage form and a new twice daily dosing schedule have been approved for the protease inhibitor, Viracept (nelfinavir). In October 1999, RotaShield (rotavirus vaccine) was taken off the market by the manufacturer due to reports that the vaccine caused bowel obstruction in some of the infants who had received it. Future Trends Guidelines for the treatment of AIDS in children first proposed in 1993 were revised by the Working Group on Antiretroviral Therapy and Medical Management of HIV-infected Children. Released in January 2000, the new guidelines recommend that antiretroviral therapy should be started for children younger than 1 year old as soon as they are diagnosed and for children of any age as soon as symptoms appear. HIV-positive children who are older than a year and who do not exhibit symptoms of AIDS should either be given drug therapy or be monitored for symptoms. Triple therapy with two NRTIs and one protease inhibitor appears to be most effective. In November 1999 an FDA committee recommended against accelerated approval for Preveon (adefovir), the first agent in a new class called nucleotide analogs, for the treatment of HIV infection. Clinical trials and an expanded access program in the United States were stopped for the seemingly promising drug after researchers noted both kidney and liver problems among the study participants. Adefovir is still under investigation, however, in this country for the treatment of Hepatitis B (HVB) and in Europe for several indications. A similar, but more potent, chemical called tenofovir disoproxil fumarate or PMPA began Phase III clinical trials for AIDS in late Coactinon (emivirine, formerly called MKC-442) is currently in Phase II and Phase III trials in the United States, Africa and Europe. A NRTI that acts more like a NNRTI, Coactinon will be used in combination with other AIDS medications. Coviracil (emtricitabine or FTC), another NRTI that was in advanced trials for HIV and in Phase II trials for HVB, has been placed on clinical hold by the FDA after more than the expected number of trial participants developed liver problems. Another group of compounds currently under investigation for AIDS affects HIV in a way that is different from other classes of drugs. These drugs, called fusion inhibitors, keep HIV cells from attaching or fusing to host cells. The first one to be tested in humans, T-20 (pentafuside), is in Phase II trials; at least four others are in Phase I or Phase II. A potential disadvantage of fusion inhibitors is that they must be injected or infused because they are degraded by stomach acid. A vaccine for the virus group that causes AIDS is still elusive. The agents most advanced in studies are AIDSVax, a glycoprotein obtained from HIV coats, and Remune, a specially treated form of inactivated HIV that is to be injected four times a year. A mixture of the glycoproteins, gp41 and gp120 also shows promise in earlier phases of study. 85
88 An experimental agent that could be effective treatment for the common cold is pleconaril, previously called VP Intended for oral use, pleconaril has shown enough effectiveness against viral meningitis to be available through a compassionate use program while Phase III trials for meningitis continue in the United States. Pleconaril is also being studied in Phase II trials to treat severe respiratory infections in high-risk patients, although more recent results from trials in both indications have been disappointing. Peg-Intron (pegylated interferon alfa 2b) was filed late in 1999 for FDA approval and Pegasys (peginterferon alfa-2a) is in late stages of clinical trials. Both are long-acting interferons that can be injected fewer times a week for the treatment of chronic hepatitis C. Twinrix (inactivated hepatitis A and recombinant DNA hepatitis B vaccine), the first single agent to combine the two vaccines, is in Phase III clinical trials in the United States. This vaccine has been approved for both adults and children in the European Community since Ampligen is a second-generation interferon that appears to have broad activity against many different types of viruses. Available in Canada under a compassionate use program for the treatment of Chronic Fatigue Syndrome, Ampligen is in several U.S. clinical trials Phase III for Chronic Fatigue Syndrome and Phase II for HVB and HIV. A whole new area of research for people with damaged immune systems centers on agents to restore the immune function. Thymic peptides, natural and synthetic compounds that mimic normal thymus activity, have been studied most. For over 30, the thymus gland has been known to be the center for T-cell production and regulation. T-cells are specialized blood cells that ordinarily fight infections. Viruses invade and destroy T-cells, so the body s natural defenses are weakened. The first commercially available thymic peptide, Zadaxin (thymosin alpha 1 or thymalfasin), has been approved in several Asian, Middle Eastern and South American countries for HVB and HVC. In the United States, Zadaxin is in Phase III clinical trials for HVC. Some interesting preliminary research shows that fatty acids destroy the coatings that surround infective organisms particularly viruses. Oral forms of one fatty acid known as monolaurin are still in early stages of research, but a topical form called Glylorin has been granted FDA approval for orphan status in the treatment of a relatively rare skin condition called congenital primary ichthyosis. WOMEN S H EALTH Health concerns specific to women include the prevention of pregnancy, the reversal of infertility, and the replacement of female hormones after menopause. An increasingly important problem in an aging population is the prevention and treatment of osteoporosis more common in women than in men. ORAL CONTRACEPTIVES Methods for contraception have begun to evolve as more women seek different options for protection from untimely pregnancies. The Pill is still the most popular form of birth control, but newer delivery systems under investigation include a transdermal patch, a monthly estrogen-progestin injection, a long-term progestin implant similar to Norplant (levonorgestrel implant) and even a once-a-day topical gel formulation combining estradiol and levonorgestrel. 86
89 Figure A21: Therapy Class Drug Market Share Trend Oral Contraceptives 25 % 20 % % Change in PMPY Cost 13.7% 1999 PMPY = $9.18 Ortho Tri-Cyclen ($31.65) 15 % Ortho-Novum ($31.34) Triphasil-28 ($30.46) 10 % Generic ($27.04) 5 % Lo/Ovral-28 ($32.51) Desogen ($26.61) 0 % Ortho-Cept ($31.36) PMPY costs for oral contraceptives grew 13.7 percent between 1998 and This growth rate is equally attributable to growing use and rising average per prescription costs. Even though many are available generically, overall use of the estrogen-progestin combinations that were the most popular over the last decade is declining. The Ortho-Novum product line, for example, continued its market share decline, dropping from 17.3 percent in 1997 to 14.9 percent in 1998 then to 12.2 percent in Market share for generic versions of the most popular branded combinations increased only slightly, despite lower cost. Low, but sustained growth, has been seen with some newer products and formulations. Most notably, Ortho Tri-Cyclen (ethinyl estradiol and norgestimate) increased its market share from 12.2 percent in 1998 to 16.8 percent in The manufacturer of Ortho Tri-Cyclen is heavily marketing this product, promoting its acne indication to young women. Plan B, an emergency contraceptive pill that contains only a progesterone (levonorgestrel), was approved in July and launched in the fourth quarter of Future Trends Tri-Norinyl (ethinyl estradiol and norethindrone) will go off patent in Lunelle (estradiol cypionate and medroxyprogesterone acetate), a new contraceptive to be given as a monthly injection, has completed Phase III clinical trials in the United States and is awaiting FDA approval. Initially intended for administration only in clinics or physicians offices, Lunelle is expected to be approved eventually for self-administration at home. Another new dosage form to complete Phase III trials successfully in the United States, Evra (ethinyl estradiol and deacetylnorgestimate), is a transdermal patch made to be worn on the arm, abdomen or buttocks. Evra needs to be changed only once a week. 87
90 Implanon (etonorgestrel) is a single rod-shaped implant that releases a progestin continuously for 24 months, as reported in the results of recent clinical trials. Norplant (levonorgestrel) is also being reformulated so that the newer version, tentatively named Norplant II, will use only one rod instead of the six that are now needed to ensure contraceptive protection for up to five. After of uncertainty, mifepristone, also known as RU-486, is closer to being released to the U.S. market for emergency contraception. The FDA is considering aspects of manufacture and distribution before final approval is granted. A progesterone antagonist, mifepristone is intended to be used in combination with misoprostol, a prostaglandin. ESTROGENS Hormone replacement therapy (HRT) with estrogen and progesterone not only helps to prevent osteoporosis and to relieve the symptoms associated with menopause but may also reduce the risk of cardiovascular diseases in some postmenopausal women. Troublesome side effects of HRT, however, cause a significant percentage of women to stop therapy. Most postmenopausal women who receive HRT are prescribed both estrogens and progestin, while others need replacement only for estrogens (ERT). A group of hormones produced primarily by the ovaries, estrogens are responsible for female characteristics. Figure A22: Therapy Class Drug Market Share Trend Estrogens 80 % 70 % 60 % % Change in PMPY Cost 15.7% 1999 PMPY = $ % Premarin ($20.76) 40 % Prempro ($26.21) 30 % Generic ($13.67) 20 % Estrace ($19.03) 10 % Estraderm ($26.34) 0 % Ogen ($29.94) 1999 PMPY costs for estrogens grew by 15.7 percent, slightly more than the 14.5 percent rise in cost between 1997 and About two-thirds of this growth rate is attributable to a 10.5 percent increase in the average cost per prescription. Premarin (conjugated estrogens), the best known branded estrogen product, continued its dramatic decline in market share, dropping from 71.8 percent in 1994 to 47.2 percent in 1998 and sliding even further to 44.6 percent in In contrast, Prempro (conjugated estrogens 88
91 and medroxyprogesterone acetate fixed-dose tablets) grew its market share from 20.7 percent to 22.7 percent between 1998 and Market share changes for other products in this class were marginal. Branded products that contain several types of estrogen have dominated the market, mainly because bioequivalence cannot be documented for some generics. Generics currently have only a 10.5 percent market share. Two new estrogen/progestin combinations are now being marketed in the United States. FemHRT (ethinyl estradiol and norethindrone) and Ortho Prefest (ethinyl estradiol and norgestimate) are oral alternatives to Prempro and other estrogen-progesterone regimens. A tablet containing both Cenestin (synthetic conjugated estrogens) and a progestin is also under development. New estrogen patches also became available for distribution in the United States during With five different strengths, Esclim (estradiol transdermal patch) offers the widest range of dosing options among topical estrogen forms. Vivelle-Dot (estradiol transdermal patch), a smaller sized version of Vivelle, is more convenient for some women to use. Future Trends Patents for Estraderm (estradiol transdermal patch), the grandmother of estrogen patches, will expire in Generic estradiol transdermal patches are already available on the U.S. market but not in all strengths. Lower doses and different formulations of Premarin, Prempro and Premphase (conjugated estrogens and medroxyprogesterone acetate phased-dose tablets) are expected to be submitted for FDA approval in The new combinations will address the concern that a higher risk of breast cancer may be associated with long-term use of HRT. Ongoing research suggests that estrogen replacement not only has a protective effect against colorectal cancer, it may be effective against Alzheimer s disease as well. Premarin is now in Phase III clinical trials for Alzheimer s. MISCELLANEOUS ENDOCRINES Drugs in this class treat a number of conditions that result from deficiencies in hormones normally produced by the endocrine system. Treatments for nocturnal enuresis (bedwetting), infertility and growth hormone deficiency all fall into this diverse group. The top three endocrine drugs are all different in activity, but they all prevent or treat osteoporosis. Fosamax (alendronate) is a bisphosphonate, a relatively new class of drugs which inhibit bone resorption. Evista (raloxifene) is a selective estrogen receptor modulator (SERM). Drugs of this type protect bone mass in the same general ways that HRT does but they do not increase the chance of breast or endometrial cancers like estrogens do. The third drug for osteoporosis is Miacalcin (calcitonin-salmon), which is marketed as both an injection and a nasal spray. Miacalcin is usually reserved for women who cannot take estrogens. 89
92 Figure A23: Therapy Class Drug Market Share Trend Miscellaneous Endocrines 60 % 50 % 40 % % Change in PMPY Cost 37.4% 1999 PMPY = $ % 20 % Fosamax ($66.44) Evista ($66.63) 10 % Miacalcin ($62.56) 0 % DDAVP ($161.59) PMPY expenditures for miscellaneous endocrines rose by a substantial 31.4 percent. This increase is due totally to increased utilization because average per prescription costs actually declined by 1.3 percent. In 1999 Fosamax received a new indication for the treatment of osteoporosis that is caused by taking steroid drugs. A much-publicized study released in November 1999 reported that a large weekly dose of Fosamax was as effective in the treatment of osteoporosis as the currently recommended dose of 10mg once a day. Whether GI side effects are inordinately increased with the larger dose remains to be seen. Evista s market share grew dramatically from 15 percent in 1998 to 26.9 percent in 1999, while the market share for Fosamax declined from 47.9 percent in 1998 to 43.1 percent in Future Trends In April 2000 Actonel (risendronate), a bisphosphonate already approved for Paget s disease, received additional indications for prevention and treatement of osteoporosis. It will compete directly with Fosamax. Several new therapies are currently under investigation for prevention and/or treatment of osteoporosis. Already in clinical trials are several SERMs as well as oral and inhaled forms of calcitonin. An injectable version of human parathyroid hormone called ALX1-11 is in Phase III trials for osteoporosis. While currently available medications merely stop the progression of bone loss in osteoporosis, ALX1-11 is the first in a class of drugs that potentially can reverse osteoporosis. 90
93 D ERMATOLOGICALS The medications used to treat skin conditions come in an assortment of topical formulations including creams, gels, lotions, ointments, powders and solutions. A few, such as some antifungal medications and Accutane (isotretinoin), a medication for severe acne in males, are available in oral forms. Dermatological medications treat all sorts of conditions that affect the skin surface. Many dermatological preparations, especially antibiotics and antifungals, are available without prescription, and many are also generic. Figure A24: Therapy Class Drug Market Share Trend Dermatologicals 35 % 30 % 25 % % Change in PMPY Cost 14.6% 1999 PMPY = $ % 15 % 10 % Generic ($17.75) Lotrisone ($39.76) Nizoral ($25.97) 5 % Bactroban ($33.12) 0 % Elocon ($32.22) Between 1998 and 1999, the PMPY cost of the class grew by 14.6 percent to $ The entire increase was due to higher costs per prescription since no growth in utilization occurred. Continuing a pattern seen throughout the 1990s, the market share for generics continued to rise reaching 30.4 percent in Levulan (aminolevulinic acid) Kerastik was approved in December 1999 for the treatment of actinic keratoses a type of skin lesion that could develop into cancer. Using a unique new photodynamic therapy, the active drug is applied in liquid form directly to skin lesions, where it is absorbed into abnormal cells making them sensitive to light. Fourteen to 18 hours later, the areas are exposed to a specific kind of light that disrupts the cell membranes of treated cells but does not damage normal cells. The gel form of Loprox (ciclopirox 0.77%) has been approved for superficial fungal infections and for seborrhea. Patent approval for Loprox gel expires in July Loprox cream and lotion are already off patent, but a completely new dosage form has been approved. Penlac, a colorless nail polish containing ciclopirox, is indicated for the topical treatment of fingernail and toenail fungus. 91
94 Nizoral A-D (ketoconazole 1%) has become the first OTC shampoo marketed for fungal dandruff. Oral and lotion forms of Nizoral are still prescription-only, as is a 2% shampoo. The patent for Nizoral tablets expired in 1999 and a generic is available. A topical mousse form of ketoconazole is in development. Aldara (imiquimod 5% cream) is being used for common and plantar warts even though it is approved only for genital warts. High oral doses of Tagamet (cimetidine) are also being used off label for the treatment of warts in both adults and children. Adult doses in the range of 1200mg to 2400mg a day for three months or longer are needed to see improvement. Unlike other wart treatments that are applied externally to disintegrate warty tissue, Aldara and cimetidine are used internally to enhance immune system function. Future Trends Novel topical dosage forms continue to be a big focus of investigation. In an effort to more precisely deliver medications to target areas, researchers are also discovering delivery systems that are less irritating and longer acting than conventional topical dosage forms. One experimental technique incorporates medications into polymers that apply like gels but then dry to form clear, water-resistant reservoirs that release active drugs. Photodynamic procedures are being expanded for use in diagnosis. When exposed to the right wavelengths of light, for example, specially treated cancer cells have been made to fluoresce pinpointing the location of main tumors and metastases. The patent on a widely-used combination steroid and antifungal cream, Lotrisone (betamethasone dipropionate 0.05% and clotrimazole 1%) will expire fourth quarter The ointment formulation of Diprolene (augmented betamethasone dipropionate 0.05% ointment) is already off patent. Diprolene cream, gel and lotion will be losing patent protection between 2000 and 2007, depending on the indication. Another popular steroid Elocon (mometasone fumarate 0.1% cream, lotion and ointment), begins to go generic in A topical NSAID, diclofenac gel, is widely available in other countries for the pain associated with arthritis as well as for the topical treatment of actinic keratoses. Although it is being compounded at local pharmacies, diclofenac gel is still not available commercially in the United States. Pennsaid, a diclofenac lotion, is finishing clinical trials and it will be submitted for FDA review in Topical forms of NSAIDs provide localized relief without the systemic side effects particularly GI upset that accompany the oral use of NSAIDs. OLUX ViaFoam, a mousse formulation of the high-potency steroid, clobetasol propionate 0.05%, has been filed for FDA approval in treating severe scalp conditions. Other topical forms of clobetasol are available generically. An NDA for tacrolimus ointment to be used in the treatment of eczema was submitted to the FDA in September The ointment is marketed under the trade name Protopic in Japan, but the U.S. product may have a different brand name. In March 2000 an oral inhibitor of collagen synthesis, halofuginone, was given orphan status for the treatment of scleroderma. 92
95 A NTIDIABETICS Diabetes is really a set of conditions characterized by the inability to metabolize carbohydrates or sugars normally. Untreated diabetes is a major cause of blindness, kidney disease and nerve damage. The best way to prevent or postpone long-term complications from diabetes is to keep blood glucose levels as close to the normal range of 64mg/dL to 112mg/dL as possible. The most prevalent forms of diabetes are diabetes mellitus Types 1 and 2. People with Type 2 diabetes either do not produce enough of their own endogenous insulin to counterbalance the carbohydrates in foods that they eat or they have a resistance to the effects of the insulin that their bodies do produce. Oral antidiabetes drugs, manufactured exogenous insulin or a combination of both can be used to treat Type 2 diabetes. Exogenous insulin, however, is essential for people with Type 1 diabetes because they do not make endogenous insulin at all. People with Type 1 diabetes depend on two kinds of exogenous insulin one that acts rapidly to control blood sugar changes caused by meals and exercise, and a long-acting insulin to maintain baseline blood glucose levels. The goal is to keep blood sugar from becoming dangerously high or low. While research has lead to the development of improved formulations and dosage forms of insulin, the range of oral antidiabetic medications is also expanding. In addition, new products are currently being studied to treat the long-term complications of diabetes. For instance, Pimagedine (aminoquanidine hydrochloride), a product nearing FDA approval, preserves kidney function in patients with kidney damage. PMPY costs for antidiabetic drugs, both oral and insulins, rose 22.2 percent in 1999 to $ Utilization growth and average cost per prescription increases accounted for about equal proportions of these increases. ORAL HYPOGLYCEMICS People with Type 2 diabetes do not always have to take insulin. Often, they can use oral medication with or without supplemental insulin to help use their endogenous insulin more effectively. Beginning in the 1950s, the sulfonylurea class of drugs offered an oral alternative to injected insulin. A second generation of better acting, more refined sulfonylureas came to market during the 1980s. Nearly all of those products are now available in generic forms. At least four new classes of oral antidiabetic agents have been introduced in the United States during the past few. Each class works differently. For example, an alpha-glucosidase inhibitor, Precose (acarbose), delays carbohydrate absorption. Biguanides increase the usefulness of naturally produced insulin and also reduce glucose production. Glucophage (metformin) is the only biguanide currently marketed in the United States. Prandin (repaglinide) is a meglitinide; it promotes endogenous insulin production. Thiazolidinediones or glitazones increase insulin sensitivity. Oral antidiabetic medications are often used in combination with one another or with insulin. 93
96 Figure A25: Therapy Class Drug Market Share Trend Oral Hypoglycemics 30 % 25 % % Change in PMPY Cost 22.2% 1999 PMPY = $ % 15 % Glucophage ($57.43) 10 % Glyburide ($37.85) Glucotrol XL ($25.52) 5 % Rezulin ($153.00) 0 % Glipizide ($29.88) As second generation oral sulfonylurea medications become available generically, the original brand name products are declining in use. One exception is Glucotrol XL (glipizide sustained-release), which is not available generically. The use of Glucotrol XL increased from 11 percent to 11.2 percent between 1998 and While the market shares for Precose and Prandin remain at about 1 percent each, Glucophage s market share continued to rise from 18.8 percent in 1997 to 21.5 percent in 1998 then to 25.5 percent in Amid concerns about liver toxicity associated with the use of the earliest glitazone, Rezulin (troglitazone), it was removed from the U.S. market in March Two new glitazones were introduced to the U.S. market during Avandia (rosiglitazone) was approved in May, and Actos (pioglitazone) received FDA approval in July. Although liver function testing is recommended for patients taking either Avandia or Actos, neither drug has yet produced the same types of liver damage that Rezulin has caused. Avandia and Actos achieved 1999 market shares of 1.1 percent and 0.4 percent, respectively. In August 1999 the company that was experimenting with Alond (zopolrestat), an aldose reductase inhibitor, decided not to continue clinical investigation for the treatment of peripheral diabetic neuropathy. Trials are continuing for the effectiveness of zopolrestat in treating kidney and heart damage caused by diabetes. Future Trends Starlix (nateglinide 1) is an insulin secretagogue, another new class of oral medications that stimulate the pancreas to produce more insulin. In December 1999 an NDA was submitted for its review, and the FDA may have a decision on Starlix by mid Derived from an amino acid (phenylalanine), Starlix has a mechanism of action different from other oral antidiabetic 94
97 medications. With both a fast onset and a short duration of action, it can be taken close to mealtimes making it more convenient for patients to use. Glucophage was scheduled to go off patent early in 2000, but a six-month extension was granted because clinical trials for pediatric indications are being conducted. In other efforts to prolong its profitability, the company that makes Glucophage has filed not only for a new controlled-release dosage form to be called Glucophage XR, but also for a new combination tablet, Glucovance, containing both metformin and glyburide, which is one of the sulfonylureas. Voglibose, an alpha glucosidase inhibitor, is in Phase III clinical trials in the U.S. Under the brand name Basen, voglibose has been approved in Japan since INSULINS People who have Type 1 diabetes mellitus require the injection of exogenous insulin because they do not make insulin naturally. The earliest exogenous insulins were obtained from beef or pork tissues, but recombinant DNA (rdna) technology changed insulin production completely. Semisynthetic rdna insulins more closely match the insulin naturally produced by humans. Today insulin is available in many different formulations some act quickly but for short lengths of time; others are slow in onset but long lasting. Insulins currently on the market require injection. Figure A26: Therapy Class Drug Market Share Trend Insulins 15 % 12 % % Change in PMPY Cost 22.2% 1999 PMPY = $ % Humulin N ($41.28) 6 % Humulin 70/30 ($47.87) Humulin R ($32.52) 3 % Novolin 70/30 ($60.02) Novolin N ($50.27) 0 % Humulin L ($38.84) Partly due to unsubstantiated fears that Mad Cow Disease may be transmitted through beef insulin, the manufacturer no longer makes Iletin I. Although beef insulin may be imported for personal use, importation involves cumbersome paperwork. Purified insulins derived from pork are still available for people who prefer an animal product to the recombinant DNA insulins. 95
98 Future Trends Humulin (rdna human insulin) is losing patent protection this year. In April 2000 the FDA approved Lantus (insulin glargine), a new recombinant human insulin product for treatment of type 1 and type 2 diabetes. Lantus is injected once daily at bedtime to release a relatively constant level of insulin over 24 hours. Its slower, more prolonged absorption is less likely to produce pronounced high or low blood-glucose levels than is NPH insulin. On the other end of the insulin activity spectrum is insulin aspart, a very rapid-acting insulin designed to be effective even when taken at mealtime. Insulin aspart has been approved in Europe as NovoRapid ; in the United States it will probably be called Novolog after FDA approval. New mixtures of insulin types that can be taken with only one injection are appearing, as well. Mixtures like Humulin 70/30 (70 percent human insulin isophane suspension and 30 percent human insulin injection [rdna origin]) have been available for several. They will now be joined by combinations that contain a rapid-acting insulin. Humalog Mix 75/25 (75 percent human lispro protamine suspension and 25 percent insulin lispro injection [rdna origin]) is the first new combination insulin to be approved by the FDA. Oral forms of insulin continue to be tested. One form in clinical trials would be dissolved in the mouth to enter the bloodstream directly through the cheek lining. Oralin, a liquid insulin administered through an inhaler similar to the ones used for asthma medications, is in Phase II and Phase III trials in Canada. Liquid insulin particles must be exactly the right size or they will not reach lung tissues where they are absorbed. Another investigational method of delivering insulin orally uses a mechanical device to spray dry powdered insulin called Exubera into the lungs. Exubera may be marketed in the United States as early as A transdermal insulin patch is in very early stages of development. A NTICANCER Although over 100 distinctly different diseases are all classified as cancers, they can be grouped into four general types. Most frequently diagnosed are carcinomas, tumors that begin in the surface layers of the body s organs or cavities. Common sites of carcinomas include the lungs, breast, colon and prostate. Leukemias are cancers of the blood. In leukemias, white blood cells multiply uncontrollably, interfering with normal blood production and function. A similar problem occurs with lymphomas specialized white blood cells called lymphocytes are overproduced, displacing normal cells and spreading through the lymphatic system. The fourth major type of cancer, sarcoma, is relatively rare. Sarcomas originate in connective tissues like muscles or bones. Any type of cancer can spread or metastasize to other parts of the body. The exact cause of cancer is not usually known. Some cancers do have clear links to environmental factors such as lung cancers in people who smoke cigarettes. Genetic predisposition appears to be involved in other cancers. Daughters of a man who has colon cancer, for instance, are more likely than other women to develop cancers of the breast. Early detection of cancer offers the best chance of survival. Treatment usually involves surgery to remove solid tumor tissue, followed by radiation and drugs (chemotherapy) to kill any remaining cancer cells. Often, more than one drug is used at the same time, and cancer medications are 96
99 frequently used off-label to treat forms of cancer for which they are not specifically indicated. The ongoing discovery of cancer s genetic markers is leading not only to new treatments, but also to new diagnostic procedures that can identify cancers before they spread. In the past, medications especially those for the various types of cancer were developed according to the shape of chemical receptors in the body. More recently research has focused on the interruption of functions that are essential for cancer cell replication. A prime example is the use of monoclonal antibodies designated as MAb or as the suffix -mab in generic drug names. Antibodies are extremely specific each type inhibits one particular antigen so only one exact type of tissue is affected. Once activated, antibodies prevent recurrence of the cells they are programmed to fight. Another promising area of anticancer research is the development of angiogenesis inhibitors, which prevent tumors from developing new blood vessels. Other studies center on antisense compounds, which keep cancer cells from forming proteins they need to grow. Anticancer vaccines are also beginning to be used. Unlike traditional vaccines that prevent specific diseases, cancer vaccines are for people who already have cancer. In general, cancer vaccines are derived from tumor cells taken from an individual patient, changed to make them invoke that patient s immune system then re-introduced into the patient s body. An immune response similar to that seen in organ transplant rejection causes the body to reject the cancer cells. Since they are much more targeted to cancer cells, emerging therapies promise to produce fewer and milder side effects than older classes of anticancer drugs. In addition, many of the new medications are available in oral formulations. As a result, patients who used to be hospitalized for intravenous therapy or for the major systemic side effects associated with earlier anticancer chemotherapy will now be able to receive effective treatment at home. Figure A27: Therapy Class Drug Market Share Trend Anticancer 50 % 40 % % Change in PMPY Cost -28.0% 1999 PMPY = $ % Generic ($81.37) 20 % Tamoxifen Citrate ($112.83) Nolvadex ($107.59) 10 % Megace ($161.00) Intron A IJ ($1,010.59) 0 % Eulexin ($298.27) 97
100 The use of some expensive injectable anticancer agents and injectable adjuvant therapies (e.g., granulocyte stimulating factors) is growing. The costs of these drugs generally are reflected in the medical portion of the health care budget. Approved in February 1999, Ontak (denileukin diftitox) is composed of diphtheria toxin pieces that are joined genetically to Interleukin-2, an immune modulator that promotes the production of cells to fight infection. Ontak is approved to treat a type of lymphoma that persists or recurs after treatment with other anticancer agents. After being granted orphan approval in September, Ellence (epirubicin injection) was fully FDA approved in December 1999 for the adjuvant treatment of early node-positive breast cancer. Temodar (temozolomide capsules) was launched in fourth quarter 1999 for the treatment of refractory anaplastic astrocytoma, a type of brain tumor. In November 1999, the FDA approved Aromasin (exemestane tablets) which permanently inhibits a specific enzyme. Used in oral form, Aromasin is indicated for postmenopausal women with advanced breast cancers that have not responded to other therapy. Previously approved only for breast cancer, Taxotere (docitaxel) received an additional indication for non-small cell lung cancer in December An oral form of Targretin (bexarotene capsules) was approved in December 1999 for one type of lymphoma. Approval of a topical gel form for cancerous skin lesions was pending under a six-month priority review filed in December of A number of investigational cancer agents have been designated as orphan products by the FDA. Orphan approval is granted as an incentive to pharmaceutical manufacturers so they will develop drugs for rare diseases. A medication may have more than one orphan indication or it may have full approval for certain conditions and orphan status in others. Drugs that received orphan designations for cancer during 1999 include Hepacid (pegylated arginine deiminase) for a type of liver cancer, Melanocid (pegylated arginine deiminase) for invasive malignant melanoma; Nipent (pentostatin) for certain lymphomas and Theragyn (Murine MAb to polymorphic epithelial mucin, human milk fat globule 1) for adjuvant treatment of ovarian cancer. Future Trends In April 1999 M-Vax, a vaccine for a kind of skin tumor called malignant melanoma, received approval for orphan status from the FDA. A second melanoma vaccine, Melacine (melanoma therapeutic vaccine) has been approved fully in Canada. O-Vax for late-stage ovarian cancers and possible vaccines for breast, colon, lung and prostate cancers are in various early phases of development. An application for FDA approval was filed in the summer of 1999 for Bexxar (tositumomab, iodine I 131 tositumomab), which combines a radioactive isotope of iodine with a monoclonal antibody. Additional data were requested before the FDA takes action on the application. 98
101 Viadur, an implantable form of leuprolide acetate, was approved for the treatment of prostate cancer in March One Viadur implant per year can replace the daily or monthly injections that some prostate cancer patients currently must take. An application for arsenic trioxide as treatment for an acute type of leukemia was put on fast-track approval mode by the FDA after being filed in March Novantrone (mitoxantrone for injection concentrate), previously indicated for Multiple Sclerosis (MS) patients, was also approved in March 2000 for the alleviation of pain associated with advanced prostate cancer. Early in 2000, the FDA gave both orphan approval and priority status to Mylotarg (gemtuzamab zogamicin) for the treatment of relapsed adult acute myeloid leukemia. A unique combination of a synthesized antibody and a chemotherapeutic agent, Mylotarg is specifically targeted at an antigen released by leukemia cells. Extensive lawsuits are delaying the introduction of generic Taxol (paclitaxel). Widely used to treat both ovarian cancers and Kaposi s Sarcoma, a complication of AIDS, Taxol has several original patents with different expiration dates. Zometa (zoledronic acid for injection), a bisphosphonate, is in accelerated review for the treatment of hypercalcemia high levels of calcium in the blood. Hypercalcemia is a metastatic bone complication of some cancers. Marimastat, the oral angiogenesis inhibitor closest to general marketing in the United States, has been involved in at least eight Phase III trials around the world for the past 12. Despite disappointing results from some of the studies, marimastat and similar chemicals still show promise in treating a wide range of solid tumor-type cancers. They inhibit enzymes called matrix metalloproteinases (MMPs), which may break down the body s own natural immunity allowing cancers to grow and spread. MMPs may also be involved in the development of new blood vessels that feed tumors. Rubitecan (9-nitrocamptothecin [9NC] for oral administration) is a topoisomerase I inhibitor that is in Phase III clinical trials for pancreatic cancer and Phase II trials for a number of other cancers. Under its former designation, RF 2000, rubitecan already has orphan approval for cancer of the pancreas. An inhaled dosage form is also being developed. Other research involves a composite of DNA with antigens and lipids. Injected directly into tumor tissue, these compounds sometimes called vectins work locally on tumor cells but not on normal cells. The most advanced product in the class, Allovectin-7 (HLA-B7/Beta2M DNA Lipid DMRIE/DOPE Complex), was designated as an orphan drug for the treatment of metastatic melanoma by the FDA in October
102 100
103 Drug Utilization and Cost by Sex and Age Appendix B 101
104 D RUG U TILIZATION AND C OST BY S EX AND AGE The number, type and cost of prescription drugs differ by the sex and age of members in a given population. Appendix B of the Drug Trend Report details drug utilization and cost as they vary by sex and age. The first section of Appendix B discusses the most frequently used therapy classes; the second section examines overall utilization and cost; and the third section details drug utilization by therapy class for male and female members of varying age groups. METHODS Systematic sampling was used to select a representative subset of pharmaceutical claims from the same database that has been used elsewhere in the Drug Trend Report. Using this method, every 60th claim was selected from the Express Scripts Drug Trend database. This resulted in a total of 1,380,069 pharmacy claims with each claim representing a prescription filled between Jan. 1, 1999 and Dec. 31, Claims for prescriptions processed through the mail pharmacy service were converted to 30-day network equivalents. Each claim included information on the member s sex and age, the drug dispensed, the date the prescription was filled and the days supply of medication the member received. Drug utilization and cost were then compared between females and males, and among members of various age groups. MOST FREQUENTLY USED THERAPY CLASSES BY SEX AND AGE Table B1: Most Frequently Used Therapy Classes by Sex Females Males Rank Therapy Class Percent of Rank Therapy Class Percent of Prescriptions Prescriptions 1 Estrogens Antihypertensives Antidepressants Antihyperlipidemics Oral Contraceptives Antidiabetics Antihypertensives Narcotic Analgesics Narcotic Analgesics Ulcer/Gastrointestinal Cough/Cold Cough/Cold Antirheumatics/NSAIDs Antiasthmatics Ulcer/Gastrointestinal Antidepressants Thyroid Penicillins Penicillins Calcium Blockers
105 Table B1 shows the 10 most frequently used therapy classes for females and males, along with the percentage of prescriptions filled for drugs in each class by each sex. As this table shows, the use of prescription drugs differed between women and men. Estrogens ranked highest among the most frequently used therapy classes by female members. Used primarily by women to replace hormones lost with menopause and to decrease the risk of osteoporosis, estrogens accounted for 8.1 percent of all prescriptions filled among members of this sex. Other therapy classes used more frequently, and in some cases exclusively, by females included oral contraceptives, antirheumatics/nsaids and thyroid medications. NSAIDs are often used to treat arthritis and the pain associated with osteoporosis, conditions that have a higher rate of prevalence among women 1,2. Thyroid disease also occurs more commonly in women, particularly among the elderly. 3 The antidepressant class was ranked second for female members, although it was the eighth most-frequently used therapy class among males. This may be because women are twice as likely to be affected by depression as men are, particularly during adolescence and the reproductive. 4 There is also some evidence that doctors are more likely to prescribe psychotropic medications like antidepressants to women, even when factors such as morbidity, age and use of other medications are controlled. 5 Antihypertensives, antihyperlipidemics and antidiabetics are the three therapy classes used most frequently by males. High blood pressure and high cholesterol affect more men than women, especially those men who are less than 55 of age and who have a family history of heart disease. 6,7 Both of these conditions can increase the risk for developing diabetes. However, statistics indicate that diabetes affects men and women almost equally. 8 Antihypertensives ranked fourth on the list among female members while antihyperlipidemics and, surprisingly, antidiabetics did not make it into the top 10. Calcium channel blockers, which are used to treat a variety of conditions ranging from high blood pressure to migraine headaches, was another therapy class that ranked among the top 10 for male members but not for females. Other therapy classes that were included in the top 10 list for both females and males included narcotic analgesics, cough/cold, ulcer/gastrointestinal and penicillins. Although appearing on both lists, the rankings for these therapy classes differed slightly between the two groups. 1 National Institute of Arthritis and Musculoskeletal and Skin Diseases. Questions and Answers about Arthritis and Rheumatic Disease, 2 National Osteoporosis Foundation. Osteoporosis: Fast Facts, 3 Guide to Clinical Preventive Services, Second Edition, Metabolic, Nutritional, and Environmental Disorders; Screening for Thyroid Disease, cpmcnet.columbia.edu/texts/gcps/gcps0030.html 4 National Mental Health Association. Depression in Women, 5 Sayer GP, Britt H. Sex differences in prescribed medications: Another case of discrimination in general practice. Soc Sci Med 1997;10: c 6 National Institutes of Health. National Heart, Lung, and Blood Institute. National High Blood Pressure Education Program. The Sixth Report of the Joint National Committee on Prevention, Detection, Evaluation, and Treatment of High Blood Pressure, 7 National Institutes of Health. National Heart, Lung, and Blood Institute. National Cholesterol Education Program. 2nd Report of the Expert Panel on Detection, Evaluation, and Treatment of High Blood Cholesterol in Adults, 8 National Diabetes Information Clearinghouse. Diabetes overview, 103
106 Table B2. Most Frequently Used Therapy Classes by Age Age Group Rank Therapy Class Percent of Prescriptions Birth to 9 Years 1 Penicillins Cough/Cold Antiasthmatics Cephalosporins Macrolides to 19 Years 1 Dermatologicals Penicillins Cough/Cold Antiasthmatics Stimulants/Anti-obesity to 29 Years 1 Oral Contraceptives Cough/Cold Narcotic Analgesics Dermatologicals Antidepressants to 39 Years 1 Oral Contraceptives Antidepressants Narcotic Analgesics Cough/Cold Antirheumatics/NSAIDs to 49 Years 1 Antidepressants Antihypertensives Narcotic Analgesics Estrogens Cough/Cold to 59 Years 1 Estrogens Antihypertensives Antihyperlipidemics Antidepressants Antidiabetics to 69 Years 1 Antihypertensives Antihyperlipidemics Estrogens Antidiabetics Calcium Blockers to 79 Years 1 Antihypertensives Antihyperlipidemics Diuretics Calcium Blockers Antidiabetics Years and Above 1 Antihypertensives Diuretics Calcium Blockers Ulcer/Gastrointestinals Beta Blockers
107 Table B3. Most Frequently Used Therapy Classes by Sex and Age Females Males Age Group Rank Therapy Class Percent of Rank Therapy Class Percent of Prescriptions Prescriptions Birth to 9 Years 1 Penicillins Penicillins Cough/Cold Antiasthmatics Cephalosporins Cough/Cold Antiasthmatics Cephalosporins Macrolides Macrolides to 19 Years 1 Dermatologicals Dermatologicals Oral Contraceptives Stimulants/Anti-obesity Penicillins Antiasthmatics Cough/Cold Penicillins Antiasthmatics Cough/Cold to 29 Years 1 Oral Contraceptives Cough/Cold Cough/Cold Narcotic Analgesics Narcotic Analgesics Dermatologicals Antidepressants Penicillins Dermatologicals Antidepressants to 39 Years 1 Oral Contraceptives Narcotic Analgesics Antidepressants Cough/Cold Narcotic Analgesics Antidepressants Cough/Cold Antihypertensives Antirheumatics/NSAIDs Ulcer/Gastrointestinals to 49 Years 1 Antidepressants Antihypertensives Estrogens Narcotic Analgesics Narcotic Analgesics Antihyperlipidemics Cough/Cold Antidepressants Antihypertensives Ulcer/Gastrointestinals to 59 Years 1 Estrogens Antihypertensives Antihypertensives Antihyperlipidemics Antidepressants Antidiabetics Ulcer/Gastrointestinals Calcium Blockers Diuretics Beta Blockers to 69 Years 1 Estrogens Antihypertensives Antihypertensives Antihyperlipidemics Antihyperlipidemics Antidiabetics Diuretics Calcium Blockers Calcium Blockers Beta Blockers to 79 Years 1 Antihypertensives Antihypertensives Diuretics Antihyperlipidemics Antihyperlipidemics Antidiabetics Calcium Blockers Calcium Blockers Beta Blockers Diuretics Years 1 Diuretics Antihypertensives 10.6 and Above 2 Antihypertensives Diuretics Calcium Blockers Calcium Blockers Ulcer/Gastrointestinals Ulcer/Gastrointestinals Opthalmic Products Beta Blockers
108 Table B2 categorizes the drug use of Express Scripts members by age groupings. For each of the nine age groups, the five most frequently used therapy classes are listed along with the percentage of prescriptions filled for drugs in that class. As one might expect, drugs used to treat infections, coughs and colds, and respiratory conditions dominated the list for children from birth through 9 of age. In fact, the top five therapy classes accounted for more than 50 percent of all the prescriptions filled for children in this age group. Although most of these same therapy classes are still widely used by preteens and teenagers, the most commonly used therapy class among year olds was the dermatologicals. This is likely to be related to the treatment of acne, which affects about 85 percent of individuals in this age group. 9 One surprising finding is that drugs in the stimulant/anti-obesity class were used almost as often as drugs for cough/colds and respiratory conditions among members aged Table B3, which categorizes drug use by both sex and age, showed that drugs in the stimulant/ anti-obesity class were used with great frequency by males in the age group but did not rank among the top five therapy classes for females in any age group. Further analysis showed that methylphenidate HCl (Ritalin ) accounted for 7.4 percent of all prescriptions filled for males in this age group, primarily attributed to the treatment of Attention Deficit Hyperactivity Disorder (ADHD). Although some medical professionals and consumers believe stimulant drugs are being overused in children with ADHD, reports suggest that fewer children are treated for ADHD than prevalence rates indicate may actually suffer from it specifically in regard to females and children in certain minority groups. One explanation for an increase in the use of stimulant drugs is that ADHD may be diagnosed inappropriately in children who have not fully meet the diagnostic criteria. 10 The drugs that were dispensed most commonly among all members in their 20s and 30s were the oral contraceptives. Although not apparent in Table B2, Table B3 shows that oral contraceptives accounted for 9.9 percent of the prescriptions used by females in the year age group. Narcotic analgesics, which are used to treat various types of pain, entered the top five therapy classes for the age group. For individuals in their 30s, the narcotic analgesics were joined by antirheumatics/nsaids another class of drugs used for pain. Antidepressants were the fifth most frequently used therapy class among members aged They leapt to number two in the rankings for members in their 30s, and were the most common therapy class used among members in their 40s. Antidepressants were fourth-ranked among members in their 50s, finally disappearing from the top five for members aged 60 and above. Linked to the arrival of menopause, estrogens were used frequently by members aged and were the most commonly prescribed therapy class among members in their 50s. Estrogens were ranked third on the list for members aged and disappeared completely from the top five rankings thereafter. 9 National Institute of Arthritis and Musculoskeletal and Skin Diseases. Questions and Answers about Acne, 10 National Institute of Mental Health. Mental Health: A Report of the Surgeon General on Attention- Deficit/Hyperactivity Disorder, 106
109 The antihypertensive therapy class began to be used extensively among members in their 40s, ranking second to antidepressants in that age stratum. Antihypertensives continued to play an important role throughout the rest of the adult, ranking as the second most frequently used therapy class among members in their 50s and occupying the top ranking in the remaining age categories. Like the antihypertensives, calcium channel blockers are used to treat high blood pressure. Frequent use of calcium channel blockers occurred later in the lifespan than for antihypertensives, however, and only began to appear among the top five therapy classes for members 60 of age and older. Frequent use of diuretics and beta blockers, also used in the treatment of high blood pressure, was associated with the older adult as well. Antihyperlipidemics and antidiabetics were frequently used among members in their 50s, 60s, and 70s while ulcer/gastrointestinal drugs were commonly used by those who were 80 of age and older. OVERALL UTILIZATION AND COST BY SEX AND AGE Since these analyses are based on a systematic sampling of claims from the Express Scripts Drug Trend database, the underlying sex and age distribution of sample members is unavailable. For that reason, these analyses are for descriptive purposes only and do not provide the reason(s) for relatively high or low utilization by a sex/age category. That is, particularly high or low utilization within a sex/age category could be due to the relative number of members in that category, to the relative usage of drugs per category member or to a combination of both factors. Table B4: Overall Drug Utilization by Sex and Age # of Prescriptions % of Prescriptions 11 Age Group Females Males Total Females Males Total Birth-9 34,528 40,930 75, ,252 38,444 80, ,431 24,741 99, ,555 58, , , , , , , , ,824 81, , ,070 38,394 86, ,787 13,288 35, Total 858, ,974 1,380, Due to rounding error, the sum of the percentage of prescriptions used by males and females within an age group may not exactly equal the total percentage of prescriptions filled by that age group. Likewise, also due to rounding error, the sum of the percentages of prescriptions filled by females or males of each age group may not exactly equal the total percentage of prescriptions filled by that sex. 107
110 Table B4 shows the number as well as the percentage of prescriptions for all therapy classes combined that were attributable to females, males and members of each age group. Figure B1: Percent of Prescriptions Filled by Members of Each Sex and Age Category % of Prescriptions Females Males There were no significant changes from 1998 to 1999 in the distribution of prescriptions overall as a function of age and sex (Figure B1). Females accounted for more prescriptions than males, with a greater disparity in the proportion of prescriptions attributable to males and females occurring for members aged 20 through 59. In 1999, 62.2 percent of all prescriptions were filled for females, although other analyses showed that females made up only 51.2 percent of the population of Express Scripts members. This indicates that females filled more prescriptions per member than males. Both female and male members between 30 and 69 of age were responsible for the bulk of the more than 1.3 million prescriptions in this sample. 95-percent confidence intervals were calculated for each of the sample percentages shown in Table B4. Confidence intervals are used to estimate how closely values based on a sample represent the population values (in this case, the values that would have resulted if the entire Express Scripts Drug Trend database had been used in these analyses). The 95-percent confidence interval calculations showed that each of the sample percentages is accurate to within ±0.1 percentage points. For example, Table B4 states that females aged 0 to 9 accounted for 2.5 percent of sample prescriptions. The confidence interval calculation indicates that there is a 95-percent probability that the percentage of prescriptions attributable to females between the ages of birth and 9 in the entire Express Scripts database lies somewhere between 2.4 percent and 2.6 percent. 108
111 Table B5: Percent of Total AWP, Mean AWP Per Prescription, and Percent Change in Mean AWP Per Prescription by Sex and Age Groups % of Total AWP 12 Mean AWP per Prescription % Change in Mean AWP from 1998 to 1999 Age Group Females Males Total Females Males Total Females Males Total Birth $26.54 $29.69 $ $41.84 $50.41 $ $37.97 $46.75 $ $43.90 $52.68 $ $46.59 $54.88 $ $44.65 $54.19 $ $46.35 $53.75 $ $49.39 $52.92 $ $44.84 $48.97 $ Totals $44.01 $51.30 $ Average Wholesale Price (AWP) was used to reflect ingredient cost in these analyses to ensure comparability across time and for all clients. The percent of AWP costs accounted for by each sex/age group combination is presented in Table B5, together with the mean AWP per prescription for Table B5 also shows the percent change in mean AWP per prescription from 1998 to 1999 as a function of age and sex. The percentage of total pharmacy costs (percent of total AWP) borne by each of the sex/age group categories in 1999 was similar to that shown in The majority of costs were attributable to members aged Females accounted for 62.2 percent of all prescriptions filled by Express Scripts members but only 58.5 percent of costs. This disparity indicates that the mean cost per prescription is less for females than males, a fact that is confirmed by the mean AWP per prescription figures of $44.01 for females and $51.30 for males. Prescriptions for children from birth through age 9 were the least expensive ($28.25 per prescription) and those for adults aged were the most expensive ($50.95 per prescription), a difference of $22.70 per prescription between these age groups. 95-percent confidence interval calculations indicate that there is a 95-percent probability that each of the sample percentages listed under the heading % of Total AWP in Table B4 were within ±0.1 percentage points of the corresponding percentage values which would have resulted if the entire Express Scripts Drug Trend database had been analyzed. Likewise, 95-percent confidence interval calculations indicate that for each of the mean AWP values calculated from the sample (Table B5), there is a 95-percent probability that the corresponding mean AWP value in the entire Express Scripts Drug Trend database lies within ±$1.51 of the sample mean. 12 Due to rounding error, the sum of the percentage of AWP attributed to males and females within an age group may not exactly equal the total percentage of AWP attributed to that age group. Likewise, also due to rounding error, the sum of the percentages of AWP attributed to females or males of each age group may not exactly equal the total percentage of AWP attributed to that sex. 109
112 Figure B2: Mean AWP Percent Change from 1998 to 1999 by Sex and Age % Change Females Males The mean AWP per prescription overall rose from $42.68 in 1998 to $46.77 in 1999, an increase of 9.58 percent (Table B5). The percent change in mean AWP per prescription from 1998 to 1999 varied as a function of sex and age (Figure B2). There was a greater percent change in cost per prescription for females ( percent) than for males (+7.24 percent), and cost increases impacted elderly members to a greater degree than younger members. The mean AWP per prescription increased percent and percent for members aged and those 80 of age and above, respectively. As Figure B2 shows, increases in cost per prescription hit elderly females disproportionately hard. Mean AWP per prescription increased 18.2 percent for women in their 70s, and percent for women 80 of age and older. In contrast, the percent increase for every other sex/age group combination was less than 13 percent. In dollar terms, women 70 of age and older were paying approximately $7.50 more per prescription in 1999 compared with 1998 on average. The mean dollar increase for each of the other sex/age group strata was on the order of $5 or less per prescription. 110
113 UTILIZATION OF EACH THERAPY CLASS BY SEX AND AGE 13 This section examines the percentage of prescriptions attributed to members of each sex/age grouping for each therapy class. GASTROINTESTINAL Figure B3: Gastrointestinal Drugs % of Prescriptions Females Males The majority of prescriptions for gastrointestinal drugs were filled by females (57 percent) although males also filled a respectable percentage of prescriptions (43 percent). As might be expected, individuals aged used the bulk of prescriptions in this class. Research suggests that there may still be discrepancies in the way that medical professionals treat Peptic Ulcer Disease (PUD), with specialists being more likely to prescribe eradication therapy for Helicobacter pylori. 14 Current efforts focus on improving existing therapies for PUD. Another important area of development is in the treatment of Irritable Bowel Syndrome (IBS), a condition that affects up to 20 percent of Americans at some time in their lives and that appears to be more prevalent among women %-confidence interval calculations indicate that for each of the sample percentages (in every therapy class examined), there is a 95% probability that the corresponding percentage value in the entire Express Scripts Drug Trend database lies within ±1.1 percentage points of the sample percentages. 14 Fendrick AM., et al. Differences between generalist and specialist physicians regarding Helicobacter pylori and peptic ulcer disease. American Journal of Gastroenterology 1996; 91(8): Heitkemper M., et al. Evidence for autonomic nervous system imbalance in women with irritable bowel syndrome. Digestive Diseases & Sciences 1998;43(9):
114 CENTRAL NERVOUS SYSTEM Figure B4: Antidepressants % of Prescriptions Females Males More than two-thirds of all prescriptions for antidepressants were used by females, especially women in their middle. Over 50 percent of all 1999 prescriptions for antidepressants (53.6 percent) were filled by women age A recent report from the Surgeon General indicates that nearly half of all Americans who suffer from a mental illness, such as depression, fail to seek treatment. Goals for the future include increasing public awareness about mental illnesses and the available treatment options as well as overcoming the stigma of these illnesses. Ongoing research will look at tailoring therapies to individuals based on age, gender, race and culture. 16 Figure B5: Antianxiety Agents % of Prescriptions Females Males Scientific Revolution In Mental Health Research And Services Declared In First Surgeon General s Report On Mental Health. HHS News, December
115 The distribution of prescriptions for antianxiety agents by sex and age is similar to that shown for antidepressants. Like antidepressants, the majority of antianxiety agents were used by females. Most prescriptions for these agents were dispensed to members age A number of drugs are now available to treat anxiety disorders and, with proper treatment, many people will experience significant improvement in their symptoms. Behavioral therapies play an important part as well, which is why researchers are looking at the use of combined therapies. 17 CARDIOVASCULAR Figure B6: Antihypertensives % of Prescriptions Females Males The antihypertensive therapy class was one of only three classes in which males filled more prescriptions than females (54.9 percent versus 45.1 percent). More than three-fourths of all prescriptions in this class (78.3 percent) were filled by members age The past decade has seen an alarming decrease in the rates of awareness and control of high blood pressure, despite evidence that detection and proper treatment can reduce the number of deaths and disabilities associated with uncontrolled high blood pressure. It is not yet known if medical professionals and consumers have merely become indifferent about the treatment of high blood pressure or if factors such as the cost of therapy have had a significant influence National Institute of Mental Health. Anxiety Disorders Research at the National Institute of Mental Health. Fact Sheet Decline in awareness and treatment of high blood pressure could pose a serious public health threat. American Heart Association News Release August
116 Figure B7: Calcium Channel Blockers % of Prescriptions Females Males Figure B8: Beta Blockers % of Prescriptions Females Males Calcium channel blockers and beta blockers are typically used for the same purposes as drugs in the antihypertensive class, and the pattern of use by age associated with these classes is similar to that of antihypertensives. Unlike antihypertensives, however, slightly greater percentages of prescriptions for calcium channel blockers and beta blockers were filled for females than for males. Based on their ability to decrease mortality, beta blockers remain a treatment of choice for the initial therapy of uncomplicated hypertension and for the prevention of a second heart attack in patients who have previously experienced a heart attack. 19,20 In addition, both beta blockers and calcium channel blockers play an important role in the prevention of migraine headaches National Institutes of Health. National Heart, Lung, and Blood Institute. National High Blood Pressure Education Program. The Sixth Report of the Joint National Committee on Prevention, Detection, Evaluation, and Treatment of High Blood Pressure, 20 American Heart Association; Recommendations for Secondary Prevention of Heart Attack, 21 William E.M., et al. Guidelines for the diagnosis and management of migraine in clinical practice. CMAJ 1997;156:
117 Figure B9: Antihyperlipidemics % of Prescriptions Females Males Antihyperlipidemic prescriptions were most often filled by males and by individuals 40 of age and above. Results from a large study conducted in the United States indicate that more than 60 percent of those receiving lipid-lowing therapy fail to meet National Cholesterol Education Program (NCEP) treatment goals, suggesting a need for more aggressive therapy. 22 INFLAMMATION AND PAIN MANAGEMENT Figure B10: Antirheumatics/Nonsteroidal Anti-Inflammatory Drugs (NSAIDS) % of Prescriptions Females Males Pearson TA., et al. The lipid treatment assessment project (L-TAP). A multicenter survey to evaluate the percentages of dyslipidemic patients receiving lipid-lowering therapy and achieving low-density lipoprotein cholesterol goals. Arch Intern Med 2000;160:
118 Figure B11: Narcotic Analgesics % of Prescriptions Females Males Females accounted for a greater percentage of prescriptions than males for both the antirheumatic/nsaids and narcotic analgesic therapy classes. However, the shape of each distribution indicates that narcotic analgesic users are slightly younger on average than are users of antirheumatics/nsaids. Adequate pain management is now recognized as an integral part of the treatment of cancer and other conditions involving chronic pain. Current guidelines recommend early and aggressive treatment measures, including the use of narcotic analgesics when necessary, and dispel the notion that addiction and abuse are common among pain sufferers. 23 Figure B12: Migraine Products % of Prescriptions Females Males 23 Management of Cancer Pain. Clinical Practice Guideline No. 9 (AHCPR Publication No )
119 Four out of every five prescriptions for a migraine drug are filled by females, with women in their 40s accounting for almost one-third of all prescriptions. A recent study suggests the incidence of migraines is on the rise, particularly among women of age. Based on the review of medical records for more than 1,300 patients, the number of women newly diagnosed with migraine between 1980 and 1989 increased by 56 percent with a corresponding increase of 34 percent among men. Interestingly, the increase among women has been attributed in part to changes in the social environment. Notable factors include the rise in the number of single-parent households, increased stress in the workplace and the pressures of dieting for weight loss. 24 RESPIRATORY Figure B13: Antiasthmatics % of Prescriptions Females Males Unlike most classes examined, a large proportion of antiasthmatic prescriptions was accounted for by children. At younger ages (birth through age 19), boys accounted for the greatest percentage of prescriptions. Conversely, women filled more prescriptions than men did across the year age range. The prevalence of asthma has increased among all patient groups over the past 20, regardless of age, sex or race. Even so, a report by the National Heart, Lung and Blood Institute (NHLBI) suggests that asthma is still under-treated or inappropriately treated in many cases primarily due to the inadequate use of anti-inflammatory drugs. Special attention is now being focused on minority children, the elderly and pregnant women with asthma Rozen TD, et al. Increasing incidence of medically recognized migraine headache in a United States population. Neurology 1999;53(7): National Asthma Education and Prevention: Practical Guide for the Diagnosis and Management of Asthma NIH Publication No
120 Figure B14: Antihistamines % of Prescriptions Females Males Figure B15: Decongestants % of Prescriptions Females Males Figure B16: Cough and Cold Products % of Prescriptions Females Males
121 The antihistamines, decongestants and cough/cold therapy classes are characterized by relatively high use among young people (between 21.3 percent and 32.9 percent of prescriptions filled by members less than 30 of age) and greater use by females than males, particularly in the following childhood. More than 40 million Americans suffer from allergic rhinitis, the most common type of allergic condition. If left untreated, allergic rhinitis can have a significant impact on a person s quality of life and may lead to more serious conditions such as asthma, sinusitis and otitis media. 26 ANTI-INFECTIVES Figure B17: Penicillins % of Prescriptions Females Males Figure B18: Cephalosporins % of Prescriptions Females Males The Allergy Report. Overview of Allergic Diseases: Diagnosis, Management, and Barriers to Care. Volume 1. American Academy of Allergy, Asthma, and Immunology
122 Figure B19: Macrolides % of Prescriptions Females Males Like those therapy classes used to treat respiratory conditions, the anti-infective classes show high use by younger persons. Children from birth through age 9 accounted for more than one-third of all claims for penicillins. Infectious diseases are a serious challenge to the world population. Since 1976, scientists have identified approximately 30 new pathogens that have the ability to cause disease in humans. Moreover, previously identified micro-organisms have been shown to undergo changes that make them resistant to drugs that were once effective. As a result, the medical community has established guidelines to promote the judicious use of antibiotic therapy. 27 WOMEN S HEALTH Figure B20: Oral Contraceptives % of Prescriptions Females National Institute of Allergy and Infectious Diseases (NIAID) Emerging Infectious Disease Research: Meeting the Challenge. May
123 Figure B21: Estrogens % of Prescriptions Females Males Use of these therapy classes corresponds to reproductive milestones in the lives of women. Women of childbearing age (those in their 20s, 30s and 40s) account for the majority of prescriptions filled for oral contraceptives. Oral contraceptives are the preferred method of pregnancy prevention among women under 30 of age, although they are not as widely used by women in higher age groups. 28 Studies indicate the new low-dose oral contraceptives are safe and may even be beneficial for use by healthy non-smoking women over 40 of age who are not otherwise at risk for heart disease. Additional non-contraceptive benefits include improvements in acne and reductions in the incidence of benign heart disease as well as endometrial and ovarian cancer. 29 Menopausal women (age ) are responsible for most estrogen use. Because estrogen is sometimes used to retard the growth of prostate or breast cancer, a small number of estrogen prescriptions were filled by men. Although estrogen alone or in combination with a progestin has been proven effective in alleviating symptoms of menopause and reducing the risk of osteoporosis, up to 50 percent of eligible women either discontinue taking hormone replacement therapy (HRT) after as little as one year or choose not to take it at all. Reasons include the occurrence of undesirable side effects such as cyclic bleeding and the fear of breast cancer National Center for Health Statistics. Fastats A-Z. Contraceptive Use in the U.S. April Journal of the American Medical Association. Women s Health: Contraception Information Center. Oral Contraceptives in the Perimenopause. February Okon MA, et al. A study to examine women s knowledge, perception and acceptability of hormone replacement therapy. Eur Menopause J 1996;3(2):
124 Figure B22: Dermatologicals % of Prescriptions Females Males Compared with many other classes, dermatologicals are used by a relatively young population. Across the year age span, a greater percentage of dermatological prescriptions are filled by women than men. Some skin conditions are generally associated with a specific age group such as diaper rash in infants, acne in adolescents and shingles in the elderly. Others, like atopic dermatitis and psoriasis, can affect individuals throughout their entire lives. Common seasonal conditions include sunburns and allergic rashes from poison ivy, poison oak and poison sumac. Atopic dermatitis is thought to affect 15 million Americans an increase in incidence of nearly 30 percent over the past 30 while psoriasis affects more than 5 million. Contributing factors include environmental irritants and infectious agents that trigger an immune response as well as emotional stress. 31, 32 Nail disorders account for about 10 percent of all skin conditions. 33 Figure B23: Antidiabetics % of Prescriptions Females Males Million American Kids and Adults are Itchy, Irritable and Exhausted The Villian is Eczema and It s on the Rise. American Academy of Dermatology Press Release February Psoriasis Causes Disability That Equals Other Major Medical Diseases. American Academy of Dermatology Press Release December Anonymous. Guidelines of care for nail disorders. American Academy of Dermatology. Journal of the American Academy of Dermatology 1996;34(3):
125 Males were responsible for the majority of antidiabetic prescriptions overall, although the sex difference was typically small at each age category. Most prescriptions in this class were dispensed to adults By recent estimates, more than 10 million Americans currently have diabetes and an additional 5 million people with diabetes are believed to be undiagnosed. 34 An alarming number of children and adolescents are now being diagnosed with Type 2 non-insulin-dependent diabetes, a form of diabetes that was previously thought to be rare in this age group. Because an increasing number of American children are overweight, experts predict that this condition will become even more prevalent in the coming. Children with Type 2 diabetes are generally more than 10 of age, are overweight, belong to certain ethnic groups (African American, Inuit, Native American, Asian, Pacific Islander or Hispanic) and have a family history of diabetes. Additional characteristics include being female and having an apple-shaped figure (i.e., centrally distributed body fat). 35 Figure B24: Anticancer % of Prescriptions Females Males Almost three-quarters of prescriptions in this class were filled by females. Individuals in their 40s and 50s accounted for the majority of prescriptions in this therapy class. Cancer is the second leading cause of death in the United States. More than 12 million new cases of cancer have been diagnosed since 1990, with skin cancer being the most common. 36 Advances in genetic and molecular technologies are expected to help researchers identify the genes that predispose people to certain types of cancer and gain a better understanding of the impact of environmental factors. 34 Diabetes Facts and Figures. American Diabetes Association Dabelea D., et al. Type 2 diabetes mellitus in minority children and adolescents. An emerging problem. Endocrinology & Metabolism Clinics of North America 1999;28(4): Cancer Facts and Figures. American Cancer Society
126 Figure B25: Antivirals % of Prescriptions Females Males Members in their 20s and 30s accounted for almost 60 percent of prescriptions filled in this class. Although females filled a greater percentage of prescriptions overall, a marked sex difference appears to be present only for those in their 20s. Each year in the United States, 10 percent-20 percent of the population is affected by the influenza virus with infection rates varying somewhat among the different age groups. About 1 percent of those with influenza require hospitalization, and approximately 20,000 die each year due to respiratory complications. Although the rate of vaccinations against the influenza virus has increased among individuals older than 65, hospitalizations for pneumonia and influenza still appear to be on the rise. 37 The estimated number of new AIDS cases declined by 11 percent between 1997 and 1998, however a greater number of these cases were reported among women than ever before. Advances in available drug therapies resulted in a 10 percent increase in the number of Americans who are currently living with the disease. AIDS is now recognized as the fifth leading cause of death among Americans of age Overview of Influenza Surveillance. Centers for Disease Control and Prevention Centers for Disease Control and Prevention (CDC). HIV/AIDS Surveillance Report 1999;11(no.1):
127 Figure B26: Anticonvulsants % of Prescriptions Females Males The largest percentage of anticonvulsant prescriptions were dispensed to middle-aged members, those Within these middle-age ranges, women accounted for a greater percentage of claims than men did, although there was little difference between the sexes for the other age groups. An estimated 2 million Americans suffer from epilepsy, with more than 50 percent of all cases affecting children and adults younger than 25 of age. Although the number of drugs available for the treatment of epilepsy has nearly doubled in the past 10, a disturbing percentage of individuals with epilepsy are unable to achieve complete control of their seizures. In addition to the treatment of epilepsy, anti-epileptic drugs are widely used for the relief of pain associated with migraine headaches, diabetic neuropathy and trigeminal neuralgia Hansen HC. Treatment of Chronic Pain With Antiepileptic Drugs: A New Era. Southern Medical Journal 1999;92(7):
128 Figure B27: Antifungals % of Prescriptions Females Males Three out of every four prescriptions filled in 1999 for an antifungal was received by a female. Most of the prescriptions in this class were dispensed to members The prevalence of fungal infections has increased over the last several decades, particularly in those individuals who have a compromised immune system. It is estimated that 90 percent of people who have AIDS will develop at least one fungal infection as a result of their condition. 40 Moreover, 10 percent-20 percent of the general population will experience a superficial fungal infection at some time during their lives. Whether fungal infections are superficial (affecting the skin or nails) or deeply invasive (affecting an internal organ such as the lungs or the brain), they are difficult to treat and often require prolonged therapy. About 70 percent of all superficial fungal infections recur, due to either reinfection or the failure to completely eliminate the original fungal infection THE OI REPORT: A Critical Review of the Treatment & Prophylaxis of AIDS-Related Opportunistic Infections (OIs) January Guidelines of care for superficial mycotic infections of the skin: Tinea corporis, tinea cruris, tinea faciei, tinea manuum, and tinea pedis. J Am Acad Dermatol 1996;34:
129 E XPRESS S CRIPTS D RUG T REND R EPORT (Please copy and fax or mail back.) Quantity Item Amount 1999 Drug Trend Report June 2000 ($ per copy) 1998 Drug Trend Report June 1999 ($ per copy) Subtotal Shipping & Handling (add $3.00 for each additional copy) $7.00 MO residents add $5.975% sales tax Total Discounts available for volume orders; call for information. Payment Check enclosed payable to Express Scripts, Inc. Money order enclosed Credit card MasterCard Visa Discover Account No.: Exp. Date / Signature Shipping Address (Please print) Name Title Organization Shipping Address Telephone Fax Billing Address (if different from above) To Order: Fax: OR Mail: Express Scripts Drug Trend Report Express Scripts, Inc. Information: Riverport Drive Maryland Heights, MO
130 N OTES 128
131 N OTES 129
132 N OTES 130
133

134 13900 Riverport Drive Maryland Heights, Missouri C120
EXPRESS SCRIPTS. june
 EXPRESS SCRIPTS june 21 www.express-scripts.com THE BOTTOM LINE Per member per year (PMPY) Average Wholesale Price (AWP) ingredient costs rose by 16.2 percent in 2. This marks the first time since Express
MArch The 2014 Drug Trend Report Highlights
 MArch 2015 The 2014 Drug Report Highlights Highest Increase in U.S. Drug Spend Over Past Decade In 2014, the pharmacy landscape underwent a seismic change, and the budgetary impact to healthcare payers
TRENDS IN MANUFACTURER PRICES OF BRAND-NAME PRESCRIPTION DRUGS USED BY OLDER AMERICANS SECOND QUARTER 2006 UPDATE
 TRENDS IN MANUFACTURER PRICES OF BRAND-NAME PRESCRIPTION DRUGS USED BY OLDER AMERICANS SECOND QUARTER 2006 UPDATE INTRODUCTION This Data Digest reports on changes in manufacturer prescription drug prices
june drug trend report featuring the pharmacy benefit guide
 june 2005 2004 drug trend report featuring the pharmacy benefit guide Preface Dear Reader, This ninth publication of Express Scripts annual Drug Trend Report coincides with a significant milestone for
Realized Savings from Generic Drugs in Upstate New York
 T H E F A C T S A B O U T Realized Savings from Generic Drugs in Upstate New York More Than $130 Million Saved in 2006 Compared With 2005 Finger Lakes Region Estimated generic savings: $29 million Generic
Medication trends shaping workers compensation. A 2018 update of the prevailing industry influences impacting pharmacy outcomes
 Medication trends shaping workers compensation A 2018 update of the prevailing industry influences impacting pharmacy outcomes This page intentionally left blank Trends impacting workers compensation pharmacy
Prescription drug expenditures are the most rapidly growing component
 Changing Prescribing Patterns and Increasing Prescription Expenditures in Medicaid Kenneth S. Fink, MD, MGA, MPH 1 Patricia J. Byrns, MD 2 1 Department of Family Medicine, University of North Carolina
SOURCES PUBLIC POLICY. Prescription Drug Prices in Canada and the United States Part 1. A Comparative Survey. John R. Graham and Beverley A.
 PUBLIC POLICY SOURCES Number 42 Prescription Drug Prices in Canada and the United States Part 1 A Comparative Survey John R. Graham and Beverley A. Robson Contents Executive Summary... 3 Introduction...
Between 1985 and 1999, as managed
 National In Use Of Medications In Office- Based Practice, 1985 1999 Drugs were discussed 59 percent more often in office visits in 1999 than in 1985, rising to a rate of 146 prescriptions per 100 visits.
The Impact of Tiered Co-Pays A Survey of Patients and Pharmacists
 The Impact of Tiered Co-Pays A Survey of Patients and Pharmacists Research Report Conducted by Harris Interactive September, 2003 This study was completed on behalf of and with support from the National
Cost-Motivated Treatment Changes in Commercial Claims:
 Cost-Motivated Treatment Changes in Commercial Claims: Implications for Non- Medical Switching August 2017 THE MORAN COMPANY 1 Cost-Motivated Treatment Changes in Commercial Claims: Implications for Non-Medical
Summary of Related Documentation Pennsylvania House Bill 1846 of 2014
 Summary of Related Documentation Pennsylvania House Bill 1846 of 2014 15 November 2018 Department of Labor & Industry BWC-Administrative Division 1171 S. Cameron St. Harrisburg PA 17104-2501 Essential
Tips for Evolving Medicaid Pharmacy Benefits Management (PBM) Programs. June 5, 2015
 Programs. June 5, 2015") Tips for Evolving Medicaid Pharmacy Benefits Management (PBM) Programs 1 June 5, 2015 Introductions Mark Steck Pharm.D Independent Consultant, MAXIMUS John J.P. Crouse Vice President, MAXIMUS Market Lead
Tips for Evolving Medicaid Pharmacy Benefits Management (PBM) Programs 1 June 5, 2015 Introductions Mark Steck Pharm.D Independent Consultant, MAXIMUS John J.P. Crouse Vice President, MAXIMUS Market Lead
Pharmacy Costs: Can I Make a Difference?
 Pharmacy Costs: Can I Make a Difference? Pharmaceutical Market Dynamics What is driving Rx cost up? No New Blockbusters Patent Expirations OTC Market Dynamics Availability Pharmaceutical Companies Unfortunately,
2017 Drug Trends Series
 2017 Drug Trends Series Part 1 Evaluating the traditional view Retail and mail-order prescriptions Published April 2018 1 2017 Drug Trends Series Traditional View First Script A year of important progress
Prescription Drugs. Medicare & Medicaid Briefings National Health Policy Forum February 22, Jim Hahn Congressional Research Service
 Prescription Drugs Medicare & Medicaid Briefings National Health Policy Forum February 22, 2007 Jim Hahn Congressional Research Service Global and US. Prescription Drug Sales, 1998-2005 $700 $600 559 602
Amitriptyline Hydrochloride Heart Health & BP Amlodipine Besylate 5mg Norvasc Antibiotics Amoxicillin 500 mg Amoxil
 School Corp Formulary Antiviral Acyclovir 400mg Zovirax Asthma Advair Diskus Diskus 250/50 Fluticasone/Salmeterol Asthma Albuterol Sulfate 2.5 mg/3 ml Proventil Arthritis and Pain Allendronate Sodium 70
Value of Hospice Benefit to Medicaid Programs
 One Pennsylvania Plaza, 38 th Floor New York, NY 10119 Tel 212-279-7166 Fax 212-629-5657 www.milliman.com Value of Hospice Benefit May 2, 2003 Milliman USA, Inc. New York, NY Kate Fitch, RN, MEd, MA Bruce
TRENDS IN MANUFACTURER LIST PRICES OF GENERIC PRESCRIPTION DRUGS USED BY OLDER AMERICANS 2004 YEAR-END UPDATE
 TRENDS IN MANUFACTURER LIST PRICES OF GENERIC PRESCRIPTION DRUGS USED BY OLDER AMERICANS 2004 YEAR-END UPDATE INTRODUCTION This Data Digest describes changes in manufacturer list s in 2004 for the generic
Running head: PRESCRIPTIONS RECEIVED AT RETAIL PHARMACIES
 Retail Pharmacy Prescription Analysis 1 Running head: PRESCRIPTIONS RECEIVED AT RETAIL PHARMACIES An Analysis of Prescription Claims for Medications from Retail Pharmacies in TRICARE Region 2 Naval Medical
Safe, effective, affordable drug choices: online tool for payers and patients.
 Executive summary: Rising healthcare costs and greater access to medical information drive patients to seek options for their drug therapy. The MedAlternatives database by Gold Standard/Elsevier empowers
Scope and Methodology Size and Growth of the Market Issues and Trends Affecting the Rx-to-OTC Switches Market Leading Competitors
 TABLE OF CONTENTS CHAPTER ONE: EXECUTIVE SUMMARY Scope and Methodology Size and Growth of the Market Issues and Trends Affecting the Rx-to-OTC Switches Market Leading Competitors CHAPTER TWO: INTRODUCTION
Market Distortions from the 340B Drug Pricing Program
 Market Distortions from the 340B Drug Pricing Program Adam J. Fein, Ph.D. www.drugchannels.net @DrugChannels The opinions and views expressed in this presentation are those of the author and may not reflect
Medication trends shaping workers compensation. A 2018 mid-year review of the prevailing industry influences impacting pharmacy outcomes
 Medication trends shaping workers compensation A 2018 mid-year review of the prevailing industry influences impacting pharmacy outcomes OPTUM WORKERS COMPENSATION DATA SET Analysis of our data, the industry
Texas Vendor Drug Program. Formulary Drug Index File Layout. Layout effective: Jul. 2, 2018 Document update: Oct. 1, 2018
 Texas Vendor Drug Program Formulary Drug Index File Layout Layout effective: Jul. 2, 2018 Document update: Oct. 1, 2018 The Vendor Drug Program provides a weekly update of resource data available for download
Amitriptyline Hydrochloride Heart Health & BP Amlodipine Besylate 5mg Norvasc Antibiotics Amoxicillin 500 mg Amoxil
 Antiviral Acyclovir 400mg Zovirax Asthma Advair Diskus Diskus 250/50 Fluticasone/Salmeterol Asthma Albuterol Sulfate 2.5 mg/3 ml Proventil Arthritis and Pain Allendronate Sodium 70 mg Fosamax Arthritis
Prescription Drugs North Carolina Policies. Carol Steckel, MPH Medicaid Director
 Prescription Drugs North Carolina Policies Carol Steckel, MPH Medicaid Director March 19, 2013 Pharmacy Services Optional service provided each year to about 1.5 million beneficiaries by 2,200 pharmacy
Managed Care Trends in Statin Usage GARY R. BAZALO, MS, MBA
 PHARMACY UTILIZATION Managed Care Trends in Statin Usage GARY R. BAZALO, MS, MBA ABSTRACT Purpose HMG-CoA reductase inhibitors ( statins ) have become the drug class of choice for the treatment of hyperlipidemia.
Have you been paying for your prescription drugs? Stop!
 Dear Valued Medtipster Member: Have you been paying for your prescription drugs? Stop! Free prescription drugs are NOW just a Medtipster ID card away. Follow the steps below to obtain thousands of generic
PHARMACEUTICALS: Their Role in the Cost of Health Care
 PHARMACEUTICALS: Their Role in the Cost of Health Care Pennsylvania Health Care Cost Containment Council 225 Market Street, Suite 400 Harrisburg, PA 17101 Phone: (717) 232-6787 Fax: (717) 232-3821 http://www.phc4.org
Per Capita Health Care Spending on Diabetes:
 Issue Brief #10 May 2015 Per Capita Health Care Spending on Diabetes: 2009-2013 Diabetes is a costly chronic condition in the United States, medical costs and productivity loss attributable to diabetes
The prescription drug trend is an important metric
 Generational Impact on Prescription Drug Trend: Part 1 Drug Trends Anna A. Theodorou, RPh, MBA John A. Szychowski, AAS, BS Julie Slezak, MS Steven M. Fox, CPA CVS Caremark The prescription drug trend is
Rx Watchdog Report Trends in Manufacturer Prices of Generic Prescription Drugs Used by Medicare Beneficiaries 2003 to 2007
 Rx Watchdog Report Trends in Manufacturer Prices of Generic Prescription Drugs Used by Medicare Beneficiaries 2003 to 2007 by David J. Gross AARP Outreach & Service Stephen W. Schondelmeyer PRIME Institute,
Cyclosporine is an immunosuppressant
 Indiana Drug Utilization Review Board September, 1998 Issue No. 4 Generic Differences Associated with Cyclosporine Products Cyclosporine is an immunosuppressant agent used in the prophylaxis of organ rejection
2016 Drug Trends Series
 Drug Trends Series Part 3: Assessing opioids and compounds Published August 2017 1 Drug Trends Series Opioids & Compounds First Script Introduction As with the first two editions in Coventry s Drug Trends
Do OurHealth primary care clinics improve health & reduce healthcare costs? OurHealth Patient Engagement Analysis June 2018
 Question: Do OurHealth primary care clinics improve health & reduce healthcare costs? OurHealth Patient Engagement Analysis June 2018 An examination of health improvements, utilization & cost of care for
Walgreens (WAG) Analyst: Juan Fabres Fall 2014
 Analyst: Juan Fabres Fall 2014") Recommendation: Buy Target Price August 31, 2016: $77.57 1. Reasons for the Recommendation With the acquisition of Alliance Boots in Europe, Walgreens will be the first US pharmacy to operate retail stores
Recommendation: Buy Target Price August 31, 2016: $77.57 1. Reasons for the Recommendation With the acquisition of Alliance Boots in Europe, Walgreens will be the first US pharmacy to operate retail stores
Rx for Pharmacy Costs in Tennessee
 Rx for Pharmacy Costs in Tennessee A White Paper Detail on Issues and Actions to Address Double-Digit Drug Expense Increases Steven L. Coulter, M.D. Senior Vice President, Chief Medical Officer Rx for
Frequency Estimates from Prescription Drug Datasets. (Revision of # A)
") Frequency Estimates from Prescription Drug Datasets (Revision of #04-11-066A) Swu-Jane Lin, Ph.D. 1 1, 2, 3 Bruce Lambert, Ph.D. Hiangkiat Tan, B. Pharm, M.S. 1 Sengwee Toh, B. Pharm. 1 1 Department of
Frequency Estimates from Prescription Drug Datasets (Revision of #04-11-066A) Swu-Jane Lin, Ph.D. 1 1, 2, 3 Bruce Lambert, Ph.D. Hiangkiat Tan, B. Pharm, M.S. 1 Sengwee Toh, B. Pharm. 1 1 Department of
2017 Drug Trend Report Commercial Medicare Medicaid Exchanges
 2017 Drug Trend Report Commercial Medicare Medicaid Exchanges Leading the way for patients and plans Our clients place a great deal of trust in Express Scripts. They ask us to care for their plan members
California Workers Compensation Prescription Drug Utilization & Payment Distributions, : Part 1
 California Workers Compensation Prescription Drug Utilization & Payment Distributions, 2009-2018: Part 1 Bob Young and Steve Hayes Background Over the past two decades, public policymakers in California
Pharmacy Trends and Management Opportunities. Kerry Bendel, R.Ph. Director of Pharmacy Medica
 Pharmacy Trends and Management Opportunities Kerry Bendel, R.Ph. Director of Pharmacy Medica September 14, 20 1 Agenda Pharmacy Trend Experience Trend Drivers and Management Opportunities Call to Action
$250 (Deductible does not apply to Tier 1 and Tier 2) $500 (Deductible does not apply to Tier 1 and Tier 2)
 $500 (Deductible does not apply to Tier 1 and Tier 2)") Benefit Summary Outpatient Prescription Drug Illinois 5/50/100/250 Plan 455 Your Co-payment and/or Co-insurance is determined by the tier to which the Prescription Drug List (PDL) Management Committee
Benefit Summary Outpatient Prescription Drug Illinois 5/50/100/250 Plan 455 Your Co-payment and/or Co-insurance is determined by the tier to which the Prescription Drug List (PDL) Management Committee
Issues for Part D Compliance
 HCCA- MEDICARE PRESCRIPTION DRUG PART D COMPLIANCE CONFERENCE Issues for Part D Compliance Craig Miner, RPh, JD Division of Drug Plan Policy Babette S. Edgar, Pharm.D., MBA Division of Finance and Operations
How Mail-Servi. Prepared for
 How Mail-Servi ice Pharmacies Will Save $46.6 Billion Over the Next Decade and the Cost of Proposed Restrictions Prepared for February 2012 Table of Contents I. Executive Summary... 3 Major Findings on
April 2o14. The 2013 Drug Trend Report Highlights
 April 2o14 The 2013 Drug Trend Report Highlights Express Scripts Reports Lowest Specialty Drug Trend Since 2007 In 2013, spending on prescription drugs increased 5.4% after several years of slower-paced
Modernized Reference Drug Program
 Modernized Reference Drug Program Monitoring Report For the period ending May 31, 2017 Issued: November 2017 Published by: Pharmaceutical Services Division and Health Sector Information, Analysis and Reporting
2016 Travelers Prescription Drug Plan Blue Cross Blue Shield Plan and United Healthcare Choice Plus Plan
 2016 Travelers Prescription Drug Plan Blue Cross Blue Shield Plan and United Healthcare Choice Plus Plan Plan Details, Programs, and Policies Table of Contents Click on the links below to be taken to that
Spring Understanding the potential of generic substitution
 Spring 2014 Understanding the potential of generic substitution Understanding the potential of generic substitution Generic pricing reforms and the availability of generics for blockbuster drugs coming
Appendix A: List of Clinical Classification Software Diagnostic Categories Excluded from Calculation of HIV-Related Inpatient Days
 supplemental digitai content Appendix A: List of Clinical Classification Software Diagnostic Categories Excluded from Calculation of HIV-Related Inpatient Days CCS Category Description 80 Multiple sclerosis
Update to HMO Drug Formulary Tier Definitions. February 8, 2018
 Update to HMO Drug Formulary Tier Definitions February 8, 2018 Agenda 1 Overview of Current Drug Tiers 2 Proposed Drug Tiers for 2019 3 Impact to SFHSS and SFHSS Members 4 How the Drug Formulary Works
WORKERS COMPENSATION AND PRESCRIPTION DRUGS: 2016 Update
 September 2016 By Barry Lipton and David Colón WORKERS COMPENSATION AND PRESCRIPTION DRUGS: 2016 Update INTRODUCTION Prescription drug (Rx) costs represent a significant portion of workers compensation
Six strategies to identify and assist patients burdened by out-of-pocket prescription costs
 REVIEW CME CREDIT G. CALEB ALEXANDER, MD, MS Robert Wood Johnson Clinical Scholars Program, MacLean Center for Clinical Medical Ethics, University of Chicago, Chicago, IL CHIEN-WEN TSENG, MD, MPH Pacific
The Sustainability of Irish Pharmaceutical Expenditure. Valerie Walshe Ph.D. Economist
 The Sustainability of Irish Pharmaceutical Expenditure Valerie Walshe Ph.D. Economist valerie.walshe@hse.ie February 2015 Content Overview of Irish Health Services Community Drug Prescribing Trends Driving
Understanding the Value of Generic Drugs
 Understanding the Value of Generic Drugs Generic drugs can help you get the most out of your health care budget. 05.02.306.1 (8/05) Many people believe that when something costs more, it must be of higher
Texas Vendor Drug Program. Formulary Delimited File Layout. April 26, 2017
 Texas Vendor Drug Program Formulary Delimited File Layout April 26, 2017 The Vendor Drug Program provides a weekly update of resource data available for download from txvendordrug.com/resources/downloads.
Coventry Health Care of Georgia, Inc.
 Coventry Health Care of Georgia, Inc. PRESCRIPTION DRUG RIDER (for High Deductible Health Plans) This Prescription Drug Rider is an attachment to the Coventry Health Care of Georgia, Inc. ( Health Plan
Mediscor Medicines Review 2011
 Mediscor Medicines Review 2011 Mediscor Client Workshop 2012 28 August 2012 Presented by: Madelein Bester Benefit Management Mediscor PBM Content Background of the report Overall trends Expenditure per
Drug Guide. April New Specialty Drug Approvals. New Formulations for Existing Drugs
 April 2013 The MedTrak Drug Guide provides a monthly update on recent approvals by the Food and Drug Administration (FDA). Use the chart below as a valuable reference tool. Additional detailed information
Drug Classifications
 CLASSIFICATIONS: QUIZ 2 Drug Classifications 1. Which category of drugs is used to relieve minor to severe pain? a. Alkylates b. Analgesics c. Angiotensin-converting enzyme inhibitors d. Androgens e. Anesthetics
Can u take flonase with zyrtec
 Can u take flonase with zyrtec Search I think Zyrtec is blocking it off as much as it can. I was thinking about taking flonase, I did some research and what I found out was that it's a steriod. Compare
PREPARED BY THE CENTER FOR MEDICARE ADVOCACY, INC.
 MEDICARE DRUG CARDS PROVE INCONSISTENT AND PROVIDE FEW DISCOUNTS FOR MEDICARE BENEFICIARIES TRYING TO REDUCE THE COST OF THE TEN MOST POPULAR BRAND-NAME DRUGS USED BY SENIORS PREPARED BY THE CENTER FOR
Prevalence of Mental Illness
 Section 1 Prevalence of Mental Illness The prevalence of mental health problems or mental illness appears to be quite stable over time. Full epidemiological surveys of prevalence, reported using complex
VARIATIONS IN PRICES AND REIMBURSEMENT OF MEDICINES IN THE EUROPEAN UNION
 VARIATIONS IN PRICES AND REIMBURSEMENT OF MEDICINES IN THE EUROPEAN UNION A snapshot of data on amoxicillin, budesonide, losartan and salbutamol in eight European Union Member States Report INTRODUCTION
Behavioral Health Hospital and Emergency Department Health Services Utilization
 Behavioral Health Hospital and Emergency Department Health Services Utilization Rhode Island Fee-For-Service Medicaid Recipients Calendar Year 2000 Prepared for: Prepared by: Medicaid Research and Evaluation
QUALITY IMPROVEMENT Section 9
 Quality Improvement Program The Plan s Quality Improvement Program serves to improve the health of its members through emphasis on health maintenance, education, diagnostic testing and treatment. The Quality
Pharmaceutical Management Medicaid 2019
 Pharmaceutical Management Medicaid 2019 Toll-free Contact Number: (888) 327-0671 Pharmacy Administration: (810) 244-1660 Introduction Pharmaceutical Management promotes the use of the most clinically appropriate,
THE GROWTH OF SPECIALTY PHARMACY
 UnitedHealth Center for Health Reform & Modernization THE GROWTH OF SPECIALTY PHARMACY Current trends and future opportunities Issue Brief April 2014 Summary Innovative specialty drugs are providing important
Cost-Motivated Treatment Changes in Medicare Part B:
 Cost-Motivated Treatment Changes in Medicare Part B: Implications for Non- Medical Switching September 2016 THE MORAN COMPANY 1 Cost-Motivated Treatment Changes in Medicare Part B: Implications for Non-Medical
STEP THERAPY IN MEDICARE PART D
 STEP THERAPY IN MEDICARE PART D Sarkis Kavarian, PharmD Candidate 15 Preceptor Dr. Craig Stern Pro Pharma Pharmaceutical Consultants, Inc. May 1 st, 2015 Objectives Why is this important? Medicare Part
Medicaid Perspective
 Prescription Opioid Fraud and Abuse: Medicaid Perspective Presenter: Gary P. Gilmore, B.S., R.Ph. Director, Analysis & Reporting Office of Clinical Affairs Deputy Director, Pharmacy Program Objectives:
CYTOKINE AND CAM ANTAGONIST UTILIZATION IN MISSISSIPPI MEDICAID
 CYTOKINE AND CAM ANTAGONIST UTILIZATION IN MISSISSIPPI MEDICAID BACKGROUND Cytokine and cell-adhesion molecule (CAM) antagonists have a major role in the treatment of chronic inflammatory diseases such
2009 Workers' Compensation Drug Trend Report. An analysis of trend and a forecast for the future
 2009 Workers' Compensation Drug Trend Report An analysis of trend and a forecast for the future Published April 2010 LEAD AUTHORS Emily Cox, PhD, RPh Yakov Svirnovskiy Jennifer Kaburick, RN Ruth Martinez,
A nation in pain: Focus on Medicaid
 DATA INSIGHTS A nation in pain: Focus on Medicaid Opioid pain medications have become one of the most controversial classes of prescription therapy. While they provide great benefits in controlling both
Washington State Medicaid Prescription Drug Purchasing: Preferred Drug List
 Washington tate Medicaid Prescription rug Purchasing: Preferred rug List NLPE Conference eptember 21, 2011 John Bowden Joint Legislative udit & eview Committee JLC Background he Joint Legislative udit
PDF created with pdffactory trial version
 We are using more prescription drugs than ever before to manage health conditions and prevent problems. And those drugs are more expensive than ever before. In 2003, prescription drug costs in the United
Patient-Centered Primary Care Scorecard Measures
 Patient-Centered Primary Care Scorecard Measures Acute and Chronic Care Management Measures Medication Adherence Proportion of Days Covered (PDC): Oral Diabetes Identifies patients with at least two prescriptions
An Overview of One Formulary Making Decision Process
 An Overview of One Formulary Making Decision Process Disclosure Statement & Speaker s Non- Commercialism Agreement Rodney J. Gedey Presenter has no conflict of interest to disclose. This presentation was
January 16, Dear Administrator Verma:
 Ms. Seema Verma Administrator Centers for Medicare and Medicaid Services Department of Health and Human Services Attention: CMMI New Direction P.O. Box 8011 Baltimore, MD 21244-1850 Re: (CMS-4182-P) Medicare
An Evaluation Of Oregon s Evidence-Based Practitioner- Managed Prescription Drug Plan
 Oregon s Drug Plan An Evaluation Of Oregon s Evidence-Based Practitioner- Managed Prescription Drug Plan Oregon s effort to manage drug usage helped curb spending, but health outcomes for patients have
taking at (Jan. 21, 2016) by Older 2016.pdf).
 by Older 2016.pdf).") HSGAC MINORITY STAFF REPORT MANUFACTURED CRISIS How Devastating Drug Increases Are Harming America s Seniors U.S. Senate Homeland Security & Governmental Affairs Committee, Minority Office Page 1 EXECUTIVE
HSGAC MINORITY STAFF REPORT MANUFACTURED CRISIS How Devastating Drug Increases Are Harming America s Seniors U.S. Senate Homeland Security & Governmental Affairs Committee, Minority Office Page 1 EXECUTIVE
The year 2009 has been one of economic uncertainty,
 Recent Trends in Utilization of Antianxiety Medication Drug Trends Anna A. Theodorou, RPh, MBA; Kelly M. Johnson, MBA; Julie Slezak, MS; and John A. Szychowski, BS The year 2009 has been one of economic
2018 Travelers Prescription Drug Plan High Deductible + HSA Plan
 2018 Travelers Prescription Drug Plan High Deductible + HSA Plan Plan Details, Programs, and Policies Table of Contents Click on the links below to be taken to that section National Preferred Formulary
CONTENTS SECTION 1 SECTION
 CONTENTS SECTION 1 Foundations of Drug Therapy 1 CHAPTER 1 Introduction to Pharmacology 3 A Message to Students 3 Pharmacology and Drug Therapy 3 Understanding Grouping and Naming of Drugs 4 Prescription
Spending on Individuals with Type 1 Diabetes and the Role of Rapidly Increasing Insulin Prices
 Spending on Individuals with Type 1 Diabetes and the Role of Rapidly Increasing Insulin Prices Authors: Jean Fuglesten Biniek William Johnson January 2019 Insulin Prices Were the Primary Driver of Rapid
Patient Review and Coordination Program
 Patient Review and Coordination Program For Medical Assistance Clients Who Need Assistance In Appropriate Use of Phyllis Coolen, RN, MN Division of Healthcare Health and Recovery Administration January
Physician Dispensing: Latest Research From WCRI. November 17, 2017
 Physician Dispensing: Latest Research From WCRI November 17, 2017 About WCRI Independent, not-for-profit research organization Diverse membership support Studies are peer-reviewed Resource for public officials
MEASURING CARE QUALITY
 MEASURING CARE QUALITY Region November 2016 For Clinical Effectiveness of Care Measures of Performance From: Healthcare Effectiveness Data and Information Set (HEDIS ) HEDIS is a set of standardized performance
SUMMARY OF ARIZONA OPIOID PRESCRIBING GUIDELINES FOR THE TREATMENT OF CHRONIC NON-TERMINAL PAIN (CNTP)
") 9 SUMMARY OF ARIZONA OPIOID PRESCRIBING GUIDELINES FOR THE TREATMENT OF CHRONIC NON-TERMINAL PAIN (CNTP) SUMMARY OF ARIZONA OPIOID PRESCRIBING GUIDELINES FOR THE TREATMENT OF ACUTE PAIN NONOPIOID TREATMENTS
9 SUMMARY OF ARIZONA OPIOID PRESCRIBING GUIDELINES FOR THE TREATMENT OF CHRONIC NON-TERMINAL PAIN (CNTP) SUMMARY OF ARIZONA OPIOID PRESCRIBING GUIDELINES FOR THE TREATMENT OF ACUTE PAIN NONOPIOID TREATMENTS
Market Profile of U.S. Orthopedic Surgeons. Market Insights Report MARKET INSIGHTS
 Market Profile of U.S. Orthopedic Surgeons Market Insights Report MARKET INSIGHTS Market Profile of U.S. Orthopedic Surgeons Overview: Profile of U.S. Orthopedic Surgeons Orthopedic Surgeons by Number,
US pharmaceutical market: trends, issues, forecast. Doug Long Vice President Industry Relations IMS Health
 US pharmaceutical market: trends, issues, forecast Doug Long Vice President Industry Relations IMS Health 2006 Strategic management review The World Pharmaceutical Market All reproduction rights, quotations,
MEASURING CARE QUALITY
 MEASURING CARE QUALITY Region December 2013 For Clinical Effectiveness of Care Measures of Performance From: Healthcare Effectiveness Data and Information Set (HEDIS ) HEDIS is a set of standardized performance
Comparative Analysis of Individuals With and Without Chiropractic Coverage Patient Characteristics, Utilization, and Costs
 Comparative Analysis of Individuals With and Without Chiropractic Coverage Patient Characteristics, Utilization, and Costs 1 Archives of Internal Medicine. October 11, 2004;164:1985-1992 Antonio P. Legorreta,
PHARMACY BENEFITS MANAGER SELECTION FAQ FOR PRODUCERS
 PHARMACY BENEFITS MANAGER SELECTION FAQ FOR PRODUCERS For Producer Audience Only - Please Do Not Distribute Regence has selected Prime Therapeutics as the Pharmacy benefits manager for its health plans.
Volume 6; Number 1 January 2012 NICE CLINICAL GUIDELINE 127: HYPERTENSION CLINICAL MANAGEMENT OF PRIMARY HYPERTENSION IN ADULTS (AUGUST 2011)
") Volume 6; Number 1 January 2012 NICE CLINICAL GUIDELINE 127: HYPERTENSION CLINICAL MANAGEMENT OF PRIMARY HYPERTENSION IN ADULTS (AUGUST 2011) What s new in hypertension? NICE has issued an updated Clinical
Volume 6; Number 1 January 2012 NICE CLINICAL GUIDELINE 127: HYPERTENSION CLINICAL MANAGEMENT OF PRIMARY HYPERTENSION IN ADULTS (AUGUST 2011) What s new in hypertension? NICE has issued an updated Clinical
Chapter 6: Healthcare Expenditures for Persons with CKD
 Chapter 6: Healthcare Expenditures for Persons with CKD In this 2017 Annual Data Report (ADR), we introduce information from the Optum Clinformatics DataMart for persons with Medicare Advantage and commercial
paint a realistic picture of your organization s health
 plan analytics paint a realistic picture of your organization s health Impressionism has no place in your health care benefit plan. Arm yourself with the facts. Uses up-to-date client-specific data Clears
Effect of Physician Profiles and Academic Detailing on Cost and Utilization of Selective Serotonin Reuptake Inhibitors
 RESEARCH Effect of Physician Profiles and Academic Detailing on Cost and Utilization of Selective Serotonin Reuptake Inhibitors OBJECTIVE: To evaluate the effect of physician profiles and academic detailing
Innovation In Ophthalmics
 Innovation In Ophthalmics Ophthalmic Innovation Summit @ AAO 2018 October 25, 2018 Mark Iwicki Chairman & CEO, Kala Pharmaceuticals Disclaimers and Notices This presentation contains forward-looking statements
Pharmacy Orientation PP150. Associate professor of Pharmaceutics Faculty of Pharmacy-Mansoura University
 Pharmacy Orientation PP150 Associate professor of Pharmaceutics Faculty of Pharmacy-Mansoura University Lecture 1 Over-the-Counter (OTC) and Prescription Drugs Categories of Medicinal Products Three categories