To open a CMA file > Download and Save file Start CMA Open file from within CMA
|
|
|
- Jonas Johnson
- 5 years ago
- Views:
Transcription
1 Example name Effect size Analysis type Level Tamiflu Hospitalized Risk ratio Basic Basic Synopsis The US government has spent 1.4 billion dollars to stockpile Tamiflu, in anticipation of a possible flu pandemic. Cochrane recently published a 500+ page report that evaluates Tamiflu s utility in a wide number of areas. Tamiflu was shown to be effective for some outcomes but not for others. This analysis that follows is taken from that report, and focuses on Tamiflu s ability to reduce the risk of hospitalization. This analysis includes seven studies where patients were randomized to receive either Tamiflu or placebo. Outcome was the proportion of patients hospitalized in each group. The effect size is the risk ratio. We use this example to show How to enter data from 2x2 tables How to perform a simple analysis How to interpret statistics for effect size How to interpret statistics for heterogeneity How to create a high-resolution plot To open a CMA file > Download and Save file Start CMA Open file from within CMA Download CMA file for computers that use a period to indicate decimals Download CMA file for computers that use a comma to indicate decimals Download this PDF Download data in Excel Download trial of CMA Tamiflu hospitalized 1

2 Start the program Tamiflu hospitalized 2
![Select the option [Start a blank spreadsheet]](/docs-images/89/100579690/images/3-0.jpg "Click [Ok] www.meta-analysis.")
3 Select the option [Start a blank spreadsheet] Click [Ok] Tamiflu hospitalized 3

4 The screen should look like this Tamiflu hospitalized 4


5 Click Insert > Column for > Study names The screen should look like this Click Insert > Column for > Effect size data Tamiflu hospitalized 5

![[Comparison of two groups ] Click [Next] Drill](/docs-images/89/100579690/images/6-2.jpg "down to Dichotomous (number of events)")

6 The program displays this wizard Select [Show all 100 formats] Click [Next] Select [Comparison of two groups ] Click [Next] Drill down to Dichotomous (number of events) Unmatched groups, prospective Events and sample size in each group Tamiflu hospitalized 6

7 The program displays this wizard Enter the following labels into the wizard First group > Tamiflu Second group > Placebo Name for events > Hospitalized Name for non-events > Ok Click [Ok] and the program will copy the names into the grid Tamiflu hospitalized 7
, and press CTRL-C to copy to clipboard www.meta-analysis.")
8 There are three options at this point Enter the data directly into CMA or Open the CMA data file or Copy the data from Excel Here, we ll show how to copy the data from Excel Switch to Excel and open the file Tamiflu Hospitalized.xls Highlight the rows and columns as shown (Columns A to E only), and press CTRL-C to copy to clipboard Tamiflu hospitalized 8
![Switch to CMA Click in cell Study-name 1 Press [CTRL-V] to paste the data The](/docs-images/89/100579690/images/9-0.jpg "screen should look like this Click here www.meta-analysis.")
9 Switch to CMA Click in cell Study-name 1 Press [CTRL-V] to paste the data The screen should look like this Click here Tamiflu hospitalized 9


10 At this point we should check that the data has been copied correctly Click anywhere in Row 1 Select Edit > Delete row, and confirm Click here Tamiflu hospitalized 10


11 By default, the program is displaying the odds ratio as the effect size We want to switch to the risk ratio Right-click on any of the yellow columns Click Customize computed effect size display Tamiflu hospitalized 11


12 Tick Risk ratio Tick Log risk ratio Select Risk Ratio in the drop-down box in the wizard De-select Odds ratio De-select log odds ratio Click Ok The program now display the risk ratio rather than the odds ratio Click File > Save As and save the file Tamiflu hospitalized 12
13 Note that the file name is now in the header. [Save] will over-write the prior version of this file without warning [Save As ] will allow you to save the file with a new name Tamiflu hospitalized 13
14 By convention we ve put the treated group (Tamiflu) in the first two columns and the control (placebo) in the second two columns. Also by convention, we ve defined Event as the presence of the outcome (Hospitalized). When we follow these conventions, and the outcome is a bad event (as it is here) if the treated group does better than the control, the risk ratio will be less than 1. Therefore, in the present case, a risk ratio less than 1 indicates that Tamiflu was associated with a decreased risk of hospitalization. It s always a good idea to check at least one study and make sure that we have the direction right. For this purpose we ll use the last study, where the risk ratio is relatively large, and the distinction between groups should be clear. Both groups have approximately the same number of patients (about 225) but the number of hospitalizations is higher in the Placebo group than in the Tamiflu group (4 vs. 2). The risk ratio is less than 1 (0.502), which means that patients treated with Tamiflu were less likely to be hospitalized. To run the analysis, click [Run analysis] Tamiflu hospitalized 14

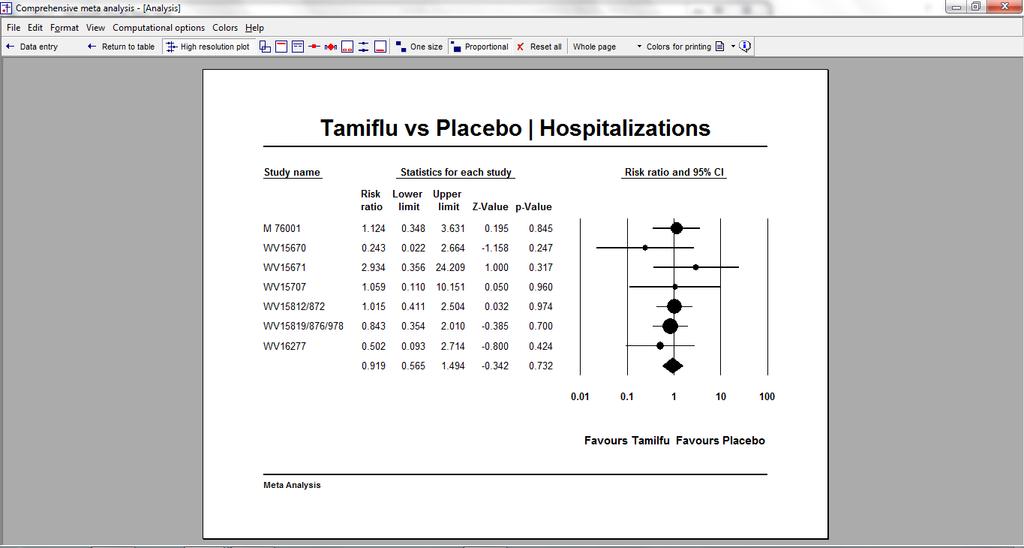
15 This is the basic analysis screen Initially, the program displays the fixed-effect analysis. This is indicated by the tab at the bottom and the label in the plot. Four of the studies have risk ratios very close to 1.0, which means that the treatment was unrelated to outcome. Two studies show an advantage for Tamiflu and one study shows an advantage for placebo, but none of these is statistically significant. The effects seem to be reasonably consistent. The confidence interval for every study overlaps the mean. The pooled effect is 0.919, which means that Tamiflu decreases the risk of being hospitalized by about 8%. However, the confidence interval is to 1.494, and the p-value for a test of the null is Tamiflu hospitalized 15
![Click [Both models] The program displays results for both the fixed-effect and the random-effects analysis. Under the fixed-effect model the pooled effect size is 0.](/docs-images/89/100579690/images/16-0.jpg "919 with a confidence interval of 0.565 to 1.494.")
16 Click [Both models] The program displays results for both the fixed-effect and the random-effects analysis. Under the fixed-effect model the pooled effect size is with a confidence interval of to Under the random-effects model the pooled effect size is with a confidence interval of to While the two models yield identical results, the random-effects model is a better fit for the way the studies were sampled, and therefore that is the model we will use in the analysis. The fixed-effect model would be appropriate if all the studies were virtual replicates of each other, which may or may not be the case here. The may have patients varied in some ways. The random-effects model would be appropriate if the studies vary in ways that may impact the effect size. Under the circumstances the random-effects model will yield a more conservative estimate (the standard error will be as large or larger as compared with the fixed-effect model). Tamiflu hospitalized 16
17 Click Random on the tab at the bottom The plot now displays the random-effects analysis alone. A quick view of the plot suggests the following Most of the studies show no real advantage for either group The observed effects are pretty consistent The summary effect is with a CI of to The summary effect has a Z-value a p-value of < Thus we cannot reject the null hypotheses that the true mean risk ratio is Tamiflu hospitalized 17
![Click [Next table] The statistics at the left duplicate those we saw on the prior screen. The summary effect is 0.919 with a CI of 0.565 to 1.494. The test of the null (that the true risk ratio is 1.](/docs-images/89/100579690/images/18-0.jpg "0) yields a Z-value of 0.342 and a corresponding p-value of 0.732. The statistics at the upper right relate to the dispersion of effect sizes across studies. The Q- value is 3.054 with df=6 and p=0.")

18 Click [Next table] The statistics at the left duplicate those we saw on the prior screen. The summary effect is with a CI of to The test of the null (that the true risk ratio is 1.0) yields a Z-value of and a corresponding p-value of The statistics at the upper right relate to the dispersion of effect sizes across studies. The Q- value is with df=6 and p= Q reflects the distance of each study from the mean effect (weighted, squared, and summed over all studies). Q is always computed using FE weights (which is the reason it is displayed on the Fixed row, but applies to both FE and RE analyses. If all studies actually shared the same true effect size, the expected value of Q would be equal to df (which is 6). Here, Q is less than this value, and so there is no evidence of variance in true effects. I 2 is the proportion of the observed variance that reflects differences in true effects rather than sampling error. Since the variance in true effects is zero, I 2 must be zero. T 2 is the estimate of the between-study variance in true effects. T is the estimate of the between-study standard deviation in true effects. Since the variance in true effects is zero, both of these values must be zero. These value are both in log units. Click [Next table] to return to this screen Tamiflu hospitalized 18
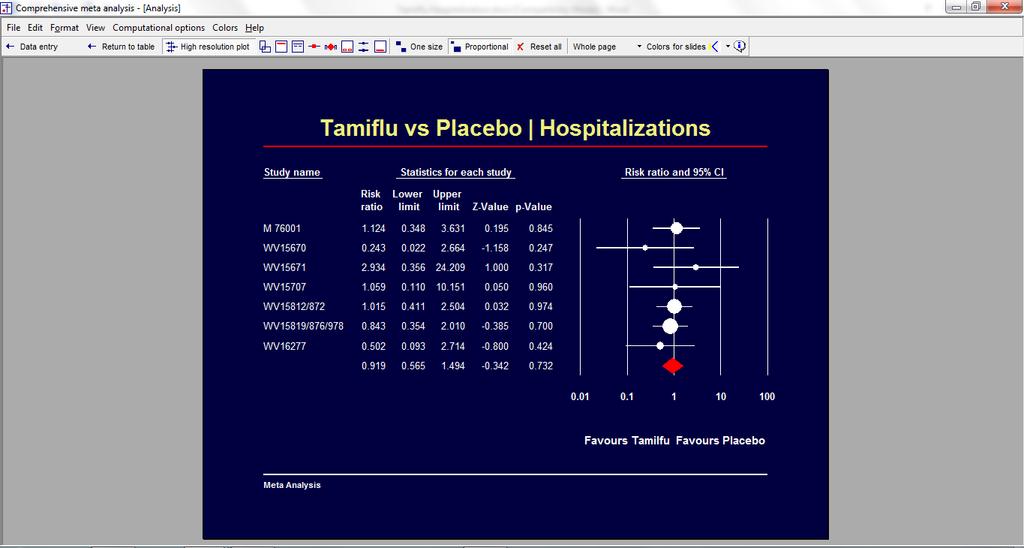
19 Tamiflu hospitalized 19
20 Summary Synopsis This analysis includes seven studies where patients were randomized to receive either Tamiflu or placebo. Outcome was the proportion of patients hospitalized in each group. The effect size is the risk ratio. Does Tamiflu affect the risk of hospitalization? The mean risk ratio is 0.919, which means that being assigned to a Tamiflu rather than a placebo resulted in an 8% lower risk of being hospitalized. The 95% confidence interval for the risk ratio is to The Z-value for a test of the null is , with a corresponding p-value of These studies were sampled from a universe of possible studies defined by certain inclusion/exclusion rules as outlined in the full paper. The confidence interval for the risk ratio is to 1.494, which tell us that the mean risk ratio in the universe of studies could fall anywhere in this range. This range includes a risk ratio of 1.0, which tells us that the mean risk ratio could be 1.0. Similarly, the Z-value for testing the null hypothesis (that the mean risk ratio is 1.0) is , with a corresponding p-value of We cannot reject the null that the risk of hospitalization is the same in both groups. Does the effect size vary across studies? The observed effect size varies somewhat from study to study, but a certain amount of variation is expected due to sampling error. We need to determine if the observed variation falls within the range that can be attributed to sampling error (in which case there is no evidence of variation in true effects), or if it exceeds that range. The Q-statistic provides a test of the null hypothesis that all studies in the analysis share a common effect size. If all studies shared the same effect size, the expected value of Q would be equal to the degrees of freedom (the number of studies minus 1). The Q-value is with 6 degrees of freedom. Thus, the observed dispersion is actually less than we would expect by chance. It follows that there is no evidence that the true effect size varies from study to study. The I 2 statistic tells us what proportion of the observed variance reflects differences in true effect sizes rather than sampling error. Since the variance in true effect sizes is zero, I 2 must be zero. T 2 is the variance of true effect sizes (in log units). Here, T 2 is zero. T is the standard deviation of true effects (in log units). Here, T is zero. Tamiflu hospitalized 20
To open a CMA file > Download and Save file Start CMA Open file from within CMA
 Example name Effect size Analysis type Level Tamiflu Symptom relief Mean difference (Hours to relief) Basic Basic Reference Cochrane Figure 4 Synopsis We have a series of studies that evaluated the effect
Two-Way Independent ANOVA
 Two-Way Independent ANOVA Analysis of Variance (ANOVA) a common and robust statistical test that you can use to compare the mean scores collected from different conditions or groups in an experiment. There
Charts Worksheet using Excel Obesity Can a New Drug Help?
 Worksheet using Excel 2000 Obesity Can a New Drug Help? Introduction Obesity is known to be a major health risk. The data here arise from a study which aimed to investigate whether or not a new drug, used
One-Way Independent ANOVA
 One-Way Independent ANOVA Analysis of Variance (ANOVA) is a common and robust statistical test that you can use to compare the mean scores collected from different conditions or groups in an experiment.
Unit 1: Introduction to the Operating System, Computer Systems, and Networks 1.1 Define terminology Prepare a list of terms with definitions
 AR Computer Applications I Correlated to Benchmark Microsoft Office 2010 (492490) Unit 1: Introduction to the Operating System, Computer Systems, and Networks 1.1 Define terminology 1.1.1 Prepare a list
One-Way ANOVAs t-test two statistically significant Type I error alpha null hypothesis dependant variable Independent variable three levels;
 1 One-Way ANOVAs We have already discussed the t-test. The t-test is used for comparing the means of two groups to determine if there is a statistically significant difference between them. The t-test
Psy201 Module 3 Study and Assignment Guide. Using Excel to Calculate Descriptive and Inferential Statistics
 Psy201 Module 3 Study and Assignment Guide Using Excel to Calculate Descriptive and Inferential Statistics What is Excel? Excel is a spreadsheet program that allows one to enter numerical values or data
MULTIPLE LINEAR REGRESSION 24.1 INTRODUCTION AND OBJECTIVES OBJECTIVES
 24 MULTIPLE LINEAR REGRESSION 24.1 INTRODUCTION AND OBJECTIVES In the previous chapter, simple linear regression was used when you have one independent variable and one dependent variable. This chapter
INRODUCTION TO TREEAGE PRO
 INRODUCTION TO TREEAGE PRO Asrul Akmal Shafie BPharm, Pg Dip Health Econs, PhD aakmal@usm.my Associate Professor & Program Chairman Universiti Sains Malaysia Board Member HTAsiaLink Adjunct Associate Professor
Analysis of Variance (ANOVA) Program Transcript
 Program Transcript") Analysis of Variance (ANOVA) Program Transcript DR. JENNIFER ANN MORROW: Welcome to Analysis of Variance. My name is Dr. Jennifer Ann Morrow. In today's demonstration, I'll review with you the definition
Analysis of Variance (ANOVA) Program Transcript DR. JENNIFER ANN MORROW: Welcome to Analysis of Variance. My name is Dr. Jennifer Ann Morrow. In today's demonstration, I'll review with you the definition
Using SPSS for Correlation
 Using SPSS for Correlation This tutorial will show you how to use SPSS version 12.0 to perform bivariate correlations. You will use SPSS to calculate Pearson's r. This tutorial assumes that you have: Downloaded
Section 3 Correlation and Regression - Teachers Notes
 The data are from the paper: Exploring Relationships in Body Dimensions Grete Heinz and Louis J. Peterson San José State University Roger W. Johnson and Carter J. Kerk South Dakota School of Mines and
The Hospital Anxiety and Depression Scale Guidance and Information
 The Hospital Anxiety and Depression Scale Guidance and Information About Testwise Testwise is the powerful online testing platform developed by GL Assessment to host its digital tests. Many of GL Assessment
Testing Means. Related-Samples t Test With Confidence Intervals. 6. Compute a related-samples t test and interpret the results.
 10 Learning Objectives Testing Means After reading this chapter, you should be able to: Related-Samples t Test With Confidence Intervals 1. Describe two types of research designs used when we select related
25. Two-way ANOVA. 25. Two-way ANOVA 371
 25. Two-way ANOVA The Analysis of Variance seeks to identify sources of variability in data with when the data is partitioned into differentiated groups. In the prior section, we considered two sources
Variant Classification. Author: Mike Thiesen, Golden Helix, Inc.
 Variant Classification Author: Mike Thiesen, Golden Helix, Inc. Overview Sequencing pipelines are able to identify rare variants not found in catalogs such as dbsnp. As a result, variants in these datasets
Lesson: A Ten Minute Course in Epidemiology
 Lesson: A Ten Minute Course in Epidemiology This lesson investigates whether childhood circumcision reduces the risk of acquiring genital herpes in men. 1. To open the data we click on File>Example Data
REPORTING INSTRUCTIONS AND DATA DICTIONARY FOR FY 2017 FLEX PROGRAM PIMS INTRODUCTION
 REPORTING INSTRUCTIONS AND DATA DICTIONARY FOR FY 2017 FLEX PROGRAM PIMS FORHP PERFORMANCE IMPROVEMENT AND MEASUREMENT SYSTEM MEDICARE RURAL HOSPITAL FLEXIBILITY PROGRAM PROGRAM YEARS FY 2015 FY 2018 (9/1/2015
1. To review research methods and the principles of experimental design that are typically used in an experiment.
 Your Name: Section: 36-201 INTRODUCTION TO STATISTICAL REASONING Computer Lab Exercise Lab #7 (there was no Lab #6) Treatment for Depression: A Randomized Controlled Clinical Trial Objectives: 1. To review
Multiple Linear Regression Analysis
 Revised July 2018 Multiple Linear Regression Analysis This set of notes shows how to use Stata in multiple regression analysis. It assumes that you have set Stata up on your computer (see the Getting Started
CNV PCA Search Tutorial
 CNV PCA Search Tutorial Release 8.1 Golden Helix, Inc. March 18, 2014 Contents 1. Data Preparation 2 A. Join Log Ratio Data with Phenotype Information.............................. 2 B. Activate only
BlueBayCT - Warfarin User Guide
 BlueBayCT - Warfarin User Guide December 2012 Help Desk 0845 5211241 Contents Getting Started... 1 Before you start... 1 About this guide... 1 Conventions... 1 Notes... 1 Warfarin Management... 2 New INR/Warfarin
Chapter 9: Comparing two means
 Chapter 9: Comparing two means Smart Alex s Solutions Task 1 Is arachnophobia (fear of spiders) specific to real spiders or will pictures of spiders evoke similar levels of anxiety? Twelve arachnophobes
Examining differences between two sets of scores
 6 Examining differences between two sets of scores In this chapter you will learn about tests which tell us if there is a statistically significant difference between two sets of scores. In so doing you
How to Conduct On-Farm Trials. Dr. Jim Walworth Dept. of Soil, Water & Environmental Sci. University of Arizona
 How to Conduct On-Farm Trials Dr. Jim Walworth Dept. of Soil, Water & Environmental Sci. University of Arizona How can you determine whether a treatment (this might be an additive, a fertilizer, snake
Hour 2: lm (regression), plot (scatterplots), cooks.distance and resid (diagnostics) Stat 302, Winter 2016 SFU, Week 3, Hour 1, Page 1
, plot (scatterplots), cooks.distance and resid (diagnostics) Stat 302, Winter 2016 SFU, Week 3, Hour 1, Page 1") Agenda for Week 3, Hr 1 (Tuesday, Jan 19) Hour 1: - Installing R and inputting data. - Different tools for R: Notepad++ and RStudio. - Basic commands:?,??, mean(), sd(), t.test(), lm(), plot() - t.test()
Agenda for Week 3, Hr 1 (Tuesday, Jan 19) Hour 1: - Installing R and inputting data. - Different tools for R: Notepad++ and RStudio. - Basic commands:?,??, mean(), sd(), t.test(), lm(), plot() - t.test()
Biology 345: Biometry Fall 2005 SONOMA STATE UNIVERSITY Lab Exercise 8 One Way ANOVA and comparisons among means Introduction
 Biology 345: Biometry Fall 2005 SONOMA STATE UNIVERSITY Lab Exercise 8 One Way ANOVA and comparisons among means Introduction In this exercise, we will conduct one-way analyses of variance using two different
ECDC HIV Modelling Tool User Manual version 1.0.0
 ECDC HIV Modelling Tool User Manual version 1 Copyright European Centre for Disease Prevention and Control, 2015 All rights reserved. No part of the contents of this document may be reproduced or transmitted
Impact of Group Rejections on Self Esteem
 Impact of Group Rejections on Self Esteem In 2005, researchers from the School of Physical Education at the University of Otago carried out a study to assess the impact of rejection on physical self esteem.
Getting a DIF Breakdown with Lertap
 Getting a DIF Breakdown with Lertap Larry Nelson Curtin University of Technology Document date: 8 October 2009 website: www.lertap.curtin.edu.au This document shows how Lertap 5 may be used to look for
1. Automatically create Flu Shot encounters in AHLTA in 2 mouse clicks. 2. Ensure accurate DX and CPT codes used for every encounter, every time.
 In clinics around the MHS, upwards of 70% of all flu shot workload credit is lost because the encounters are not documented within AHLTA. Let the Immunization KAT s PASBA approved coding engine do the
Automated process to create snapshot reports based on the 2016 Murray Community-based Groups Capacity Survey: User Guide Report No.
 research for a sustainable future Automated process to create snapshot reports based on the 2016 Murray Community-based Groups Capacity Survey: User Guide Report No. 116 Steven Vella Gail Fuller Michael
User Guide for Classification of Diabetes: A search tool for identifying miscoded, misclassified or misdiagnosed patients
 User Guide for Classification of Diabetes: A search tool for identifying miscoded, misclassified or misdiagnosed patients For use with isoft Premiere Synergy Produced by André Ring 1 Table of Contents
Binary Diagnostic Tests Two Independent Samples
 Chapter 537 Binary Diagnostic Tests Two Independent Samples Introduction An important task in diagnostic medicine is to measure the accuracy of two diagnostic tests. This can be done by comparing summary
Psychology of Perception PSYC Spring 2017 Laboratory 2: Perception of Loudness
 PSYC 4165-100 Laboratory 2: Perception of Loudness Lab Overview Loudness is a psychological dimension of sound experience that depends on several physical dimensions of the sound stimulus (intensity, frequency,
Commonwealth of Pennsylvania PA Test Method No. 423 Department of Transportation October Pages LABORATORY TESTING SECTION. Method of Test for
 Commonwealth of Pennsylvania PA Test Method No. 423 Department of Transportation 10 Pages 1. SCOPE LABORATORY TESTING SECTION Method of Test for RETRO-DIRECTIVE REFLECTIVITY OF REFLECTIVE MATERIALS 1.1
Simple Linear Regression One Categorical Independent Variable with Several Categories
 Simple Linear Regression One Categorical Independent Variable with Several Categories Does ethnicity influence total GCSE score? We ve learned that variables with just two categories are called binary
Technical Bulletin. Technical Information for Quidel Molecular Influenza A+B Assay on the Bio-Rad CFX96 Touch
 Technical Bulletin Technical Information for Quidel Molecular Influenza A+B Assay on the Bio-Rad CFX96 Touch Quidel Corporation has verified the performance of the Quidel Molecular Influenza A+B Assay
v Feature Stamping SMS 13.0 Tutorial Prerequisites Requirements Map Module Mesh Module Scatter Module Time minutes
 v. 13.0 SMS 13.0 Tutorial Objectives Learn how to use conceptual modeling techniques to create numerical models which incorporate flow control structures into existing bathymetry. The flow control structures
User Instruction Guide
 User Instruction Guide Table of Contents Logging In and Logging Out of MMSx 1 Creating a TPN (Terminal Profile Number) 2 Single Merchant 2 From Navigation Bar 2 From Home Page Link 4 Multiple Merchants
Small Group Presentations
 Admin Assignment 1 due next Tuesday at 3pm in the Psychology course centre. Matrix Quiz during the first hour of next lecture. Assignment 2 due 13 May at 10am. I will upload and distribute these at the
Intro to SPSS. Using SPSS through WebFAS
 Intro to SPSS Using SPSS through WebFAS http://www.yorku.ca/computing/students/labs/webfas/ Try it early (make sure it works from your computer) If you need help contact UIT Client Services Voice: 416-736-5800
Table of Contents Foreword 9 Stay Informed 9 Introduction to Visual Steps 10 What You Will Need 10 Basic Knowledge 11 How to Use This Book
 Table of Contents Foreword... 9 Stay Informed... 9 Introduction to Visual Steps... 10 What You Will Need... 10 Basic Knowledge... 11 How to Use This Book... 11 The Screenshots... 12 The Website and Supplementary
8/28/2017. If the experiment is successful, then the model will explain more variance than it can t SS M will be greater than SS R
 PSY 5101: Advanced Statistics for Psychological and Behavioral Research 1 If the ANOVA is significant, then it means that there is some difference, somewhere but it does not tell you which means are different
LAB ASSIGNMENT 4 INFERENCES FOR NUMERICAL DATA. Comparison of Cancer Survival*
 LAB ASSIGNMENT 4 1 INFERENCES FOR NUMERICAL DATA In this lab assignment, you will analyze the data from a study to compare survival times of patients of both genders with different primary cancers. First,
appstats26.notebook April 17, 2015
 Chapter 26 Comparing Counts Objective: Students will interpret chi square as a test of goodness of fit, homogeneity, and independence. Goodness of Fit A test of whether the distribution of counts in one
Two-Way Independent Samples ANOVA with SPSS
 Two-Way Independent Samples ANOVA with SPSS Obtain the file ANOVA.SAV from my SPSS Data page. The data are those that appear in Table 17-3 of Howell s Fundamental statistics for the behavioral sciences
Titrations in Cytobank
 The Premier Platform for Single Cell Analysis (1) Titrations in Cytobank To analyze data from a titration in Cytobank, the first step is to upload your own FCS files or clone an experiment you already
Motor Programs Lab. 1. Record your reaction and movement time in ms for each trial on the individual data Table 1 below. Table I: Individual Data RT
 Motor Programs Lab Introduction. This lab will simulate an important experiment performed by Henry and Rogers (1960). The task involved the subject responding to an external signal then executing a simple,
Using the New Nutrition Facts Label Formats in TechWizard Version 5
 Using the New Nutrition Facts Label Formats in TechWizard Version 5 Introduction This document covers how to utilize the new US Nutrition Facts label formats that are part of Version 5. Refer to Installing
Content Part 2 Users manual... 4
 Content Part 2 Users manual... 4 Introduction. What is Kleos... 4 Case management... 5 Identity management... 9 Document management... 11 Document generation... 15 e-mail management... 15 Installation
Your Task: Find a ZIP code in Seattle where the crime rate is worse than you would expect and better than you would expect.
 Forensic Geography Lab: Regression Part 1 Payday Lending and Crime Seattle, Washington Background Regression analyses are in many ways the Gold Standard among analytic techniques for undergraduates (and
Appendix B. Nodulus Observer XT Instructional Guide. 1. Setting up your project p. 2. a. Observation p. 2. b. Subjects, behaviors and coding p.
 1 Appendix B Nodulus Observer XT Instructional Guide Sections: 1. Setting up your project p. 2 a. Observation p. 2 b. Subjects, behaviors and coding p. 3 c. Independent variables p. 4 2. Carry out an observation
Estimating national adult prevalence of HIV-1 in Generalized Epidemics
 Estimating national adult prevalence of HIV-1 in Generalized Epidemics You are now ready to begin using EPP to generate HIV prevalence estimates for use in the Spectrum program. Introduction REMEMBER The
PedCath IMPACT User s Guide
 PedCath IMPACT User s Guide Contents Overview... 3 IMPACT Overview... 3 PedCath IMPACT Registry Module... 3 More on Work Flow... 4 Case Complete Checkoff... 4 PedCath Cath Report/IMPACT Shared Data...
Tutorial: RNA-Seq Analysis Part II: Non-Specific Matches and Expression Measures
 : RNA-Seq Analysis Part II: Non-Specific Matches and Expression Measures March 15, 2013 CLC bio Finlandsgade 10-12 8200 Aarhus N Denmark Telephone: +45 70 22 55 09 Fax: +45 70 22 55 19 www.clcbio.com support@clcbio.com
15.301/310, Managerial Psychology Prof. Dan Ariely Recitation 8: T test and ANOVA
 15.301/310, Managerial Psychology Prof. Dan Ariely Recitation 8: T test and ANOVA Statistics does all kinds of stuff to describe data Talk about baseball, other useful stuff We can calculate the probability.
ANOVA. Thomas Elliott. January 29, 2013
 ANOVA Thomas Elliott January 29, 2013 ANOVA stands for analysis of variance and is one of the basic statistical tests we can use to find relationships between two or more variables. ANOVA compares the
[ APPLICATION NOTE ] High Sensitivity Intact Monoclonal Antibody (mab) HRMS Quantification APPLICATION BENEFITS INTRODUCTION WATERS SOLUTIONS KEYWORDS
![[ APPLICATION NOTE ] High Sensitivity Intact Monoclonal Antibody (mab) HRMS Quantification APPLICATION BENEFITS INTRODUCTION WATERS SOLUTIONS KEYWORDS](/thumbs/79/80328542.jpg "[ APPLICATION NOTE ] High Sensitivity Intact Monoclonal Antibody (mab) HRMS Quantification APPLICATION BENEFITS INTRODUCTION WATERS SOLUTIONS KEYWORDS") Yun Wang Alelyunas, Henry Shion, Mark Wrona Waters Corporation, Milford, MA, USA APPLICATION BENEFITS mab LC-MS method which enables users to achieve highly sensitive bioanalysis of intact trastuzumab
Yun Wang Alelyunas, Henry Shion, Mark Wrona Waters Corporation, Milford, MA, USA APPLICATION BENEFITS mab LC-MS method which enables users to achieve highly sensitive bioanalysis of intact trastuzumab
Allergy Basics. This handout describes the process for adding and removing allergies from a patient s chart.
 Allergy Basics This handout describes the process for adding and removing allergies from a patient s chart. Accessing Allergy Information Page 1 Recording No Known Medication Allergies Page 2 Recording
Technologies for Data Analysis for Experimental Biologists
 Technologies for Data Analysis for Experimental Biologists Melanie I Stefan, PhD HMS 15 May 2014 MI Stefan (HMS) Data Analysis with JMP 15 May 2014 1 / 35 Before we start Download files for today s class
ANOVA in SPSS (Practical)
") ANOVA in SPSS (Practical) Analysis of Variance practical In this practical we will investigate how we model the influence of a categorical predictor on a continuous response. Centre for Multilevel Modelling
ANOVA in SPSS (Practical) Analysis of Variance practical In this practical we will investigate how we model the influence of a categorical predictor on a continuous response. Centre for Multilevel Modelling
VACCINE REMINDER SERVICE A GUIDE FOR SURGERIES
 VACCINE REMINDER SERVICE A GUIDE FOR SURGERIES Sign up to the free text and voicemail service to automatically remind patients eligible for flu vaccination to book their appointment. This guide shows how
CHAPTER ONE CORRELATION
 CHAPTER ONE CORRELATION 1.0 Introduction The first chapter focuses on the nature of statistical data of correlation. The aim of the series of exercises is to ensure the students are able to use SPSS to
Appendix: Instructions for Treatment Index B (Human Opponents, With Recommendations)
") Appendix: Instructions for Treatment Index B (Human Opponents, With Recommendations) This is an experiment in the economics of strategic decision making. Various agencies have provided funds for this research.
Appendix: Instructions for Treatment Index B (Human Opponents, With Recommendations) This is an experiment in the economics of strategic decision making. Various agencies have provided funds for this research.
COMPUTER-BASED BIOMETRICS MANUAL
 Student Name: Student No: COMPUTER-BASED BIOMETRICS MANUAL (Using GenStat for Windows) For BIOMETRY 222 EXPERIMENTAL DESIGN & MULTIPLE REGRESSION 2006 School of Statistics and Actuarial Science University
Exploring Mitosis Lab IMPORTANT LEARNING OBJECTIVES INTRODUCTION
 Exploring Mitosis Lab Today s lab will give you a chance to get an up-close view of mitosis, the process by which eukaryotic cells divide to generate identical daughter cells. We re using garlic (A. sativium)
Instructions for doing two-sample t-test in Excel
 Instructions for doing two-sample t-test in Excel (1) If you do not see Data Analysis in the menu, this means you need to use Add-ins and make sure that the box in front of Analysis ToolPak is checked.
OpenSim Tutorial #2 Simulation and Analysis of a Tendon Transfer Surgery
 OpenSim Tutorial #2 Simulation and Analysis of a Tendon Transfer Surgery Laboratory Developers: Scott Delp, Wendy Murray, Samuel Hamner Neuromuscular Biomechanics Laboratory Stanford University I. OBJECTIVES
Step 3 Tutorial #3: Obtaining equations for scoring new cases in an advanced example with quadratic term
 Step 3 Tutorial #3: Obtaining equations for scoring new cases in an advanced example with quadratic term DemoData = diabetes.lgf, diabetes.dat, data5.dat We begin by opening a saved 3-class latent class
POL 242Y Final Test (Take Home) Name
 Name") POL 242Y Final Test (Take Home) Name_ Due August 6, 2008 The take-home final test should be returned in the classroom (FE 36) by the end of the class on August 6. Students who fail to submit the final
POL 242Y Final Test (Take Home) Name_ Due August 6, 2008 The take-home final test should be returned in the classroom (FE 36) by the end of the class on August 6. Students who fail to submit the final
Steps to writing a lab report on: factors affecting enzyme activity
 Steps to writing a lab report on: factors affecting enzyme activity This guide is designed to help you write a simple, straightforward lab report. Each section of the report has a number of steps. By completing
CaseBuilder - Quick Reference Guide
 ADP UNEMPLOYMENT COMPENSATION MANAGEMENT CaseBuilder - Quick Reference Guide After signing into CaseBuilder, the first screen the user will see is called the Dashboard. The user can then navigate to any
Data Management, Data Management PLUS User Guide
 Data Management, Data Management PLUS User Guide Table of Contents Introduction 3 SHOEBOX Data Management and Data Management PLUS (DM+) for Individual Users 4 Portal Login 4 Working With Your Data 5 Manually
Meta-analysis: Basic concepts and analysis
 Meta-analysis: Basic concepts and analysis Matthias Egger Institute of Social & Preventive Medicine (ISPM) University of Bern Switzerland www.ispm.ch Outline Rationale Definitions Steps The forest plot
Dementia Direct Enhanced Service
 Vision 3 Dementia Direct Enhanced Service England Outcomes Manager Copyright INPS Ltd 2015 The Bread Factory, 1A Broughton Street, Battersea, London, SW8 3QJ T: +44 (0) 207 501700 F:+44 (0) 207 5017100
Problem Set 3 ECN Econometrics Professor Oscar Jorda. Name. ESSAY. Write your answer in the space provided.
 Problem Set 3 ECN 140 - Econometrics Professor Oscar Jorda Name ESSAY. Write your answer in the space provided. 1) Sir Francis Galton, a cousin of James Darwin, examined the relationship between the height
EXERCISE: HOW TO DO POWER CALCULATIONS IN OPTIMAL DESIGN SOFTWARE
 ...... EXERCISE: HOW TO DO POWER CALCULATIONS IN OPTIMAL DESIGN SOFTWARE TABLE OF CONTENTS 73TKey Vocabulary37T... 1 73TIntroduction37T... 73TUsing the Optimal Design Software37T... 73TEstimating Sample
Meta-analysis using RevMan. Yemisi Takwoingi October 2015
 Yemisi Takwoingi October 2015 Contents 1 Introduction... 1 2 Dataset 1 PART I..2 3 Starting RevMan... 2 4 Data and analyses in RevMan... 2 5 RevMan calculator tool... 2 Table 1. Data for derivation of
Lesson 9: Two Factor ANOVAS
 Published on Agron 513 (https://courses.agron.iastate.edu/agron513) Home > Lesson 9 Lesson 9: Two Factor ANOVAS Developed by: Ron Mowers, Marin Harbur, and Ken Moore Completion Time: 1 week Introduction
Background Information. Instructions. Problem Statement. HOMEWORK INSTRUCTIONS Homework #2 HIV Statistics Problem
 Background Information HOMEWORK INSTRUCTIONS The scourge of HIV/AIDS has had an extraordinary impact on the entire world. The spread of the disease has been closely tracked since the discovery of the HIV
Aggregate Report Instructions
 Version 2018_v4 Workplace Health Solutions Center for Workplace Health Research & Evaluation Version 2018_v4 Table of Contents Purpose.....3 Data Privacy....3 About Life's Simple 7....4 Table 1. Life's
Managing and Taking Notes
 When scheduling a meeting, the host can specify the default note-taking options that take effect once the meeting starts. During a meeting, the presenter can change the default note-taking options at any
Amplifon Hearing Health Care
 Amplifon Hearing Health Care Myamplifonusa.com Quick Guide Miracle-Ear July, 2016 Myamplifonusa.com User Guide The Myamplifonusa.com system was created to give you easy access to view Amplifon referrals,
Lab #7: Confidence Intervals-Hypothesis Testing (2)-T Test
-T Test") A. Objectives: Lab #7: Confidence Intervals-Hypothesis Testing (2)-T Test 1. Subsetting based on variable 2. Explore Normality 3. Explore Hypothesis testing using T-Tests Confidence intervals and initial
A. Objectives: Lab #7: Confidence Intervals-Hypothesis Testing (2)-T Test 1. Subsetting based on variable 2. Explore Normality 3. Explore Hypothesis testing using T-Tests Confidence intervals and initial
ECDC HIV Modelling Tool User Manual
 ECDC HIV Modelling Tool User Manual Version 1.3.0 European Centre for Disease Prevention and Control 20 December 2017 1 Table of Contents 2 Introduction... 3 2.1 Incidence Method... 3 2.2 London Method...
PBSI-EHR Off the Charts!
 PBSI-EHR Off the Charts! Enhancement Release 3.2.1 TABLE OF CONTENTS Description of enhancement change Page Encounter 2 Patient Chart 3 Meds/Allergies/Problems 4 Faxing 4 ICD 10 Posting Overview 5 Master
NYSIIS. Immunization Evaluator and Manage Schedule Manual. October 16, Release 1.0
 NYSIIS Immunization Evaluator and Manage Schedule Manual October 16, 2007 Release 1.0 Revision History Release Modifications Author Revision Date 1.0 Initial Draft R Savage 10/16/2007 INTRODUCTION: 1 BUILDING
The Leeds Reliable Change Indicator
 The Leeds Reliable Change Indicator Simple Excel (tm) applications for the analysis of individual patient and group data Stephen Morley and Clare Dowzer University of Leeds Cite as: Morley, S., Dowzer,
Provider Dashboard User's Manual
 Provider Dashboard User's Manual CAUTION: FEDERAL LAW RESTRICTS THIS DEVICE TO SALE BY OR ON THE ORDER OF A PHYSICIAN. IMPORTANT: READ THE SAEBOVR GETTING STARTED GUIDE (BAI-VOTA-LBL- 001) IN ITS ENTIRETY
Training Use of Diagnosis Module for ICD-10 Codes in HIS
 Training Use of Diagnosis Module for ICD-10 Codes in HIS This document will help to explain the changes in how diagnoses are assigned in HIS after the ICD-10 update which occurred during the weekend of
Managing and Taking Notes
 When scheduling a meeting, the host can specify the default note-taking options that take effect once the meeting starts. During a meeting, the presenter can change the default note-taking options at any
Stat Wk 9: Hypothesis Tests and Analysis
 Stat 342 - Wk 9: Hypothesis Tests and Analysis Crash course on ANOVA, proc glm Stat 342 Notes. Week 9 Page 1 / 57 Crash Course: ANOVA AnOVa stands for Analysis Of Variance. Sometimes it s called ANOVA,
UWA ERA Publications Collection 2011
 UWA ERA Publications Collection 2011 Overview of the collection process Introduction to Minerva Research Assessment Unit September 2011 In this seminar Why we collect ERA publications data See UWA Publications
15.053x. OpenSolver (http://opensolver.org/)
") 15.053x OpenSolver (http://opensolver.org/) 1 Table of Contents Introduction to OpenSolver slides 3-4 Example 1: Diet Problem, Set-Up slides 5-11 Example 1: Diet Problem, Dialog Box slides 12-17 Example
15.053x OpenSolver (http://opensolver.org/) 1 Table of Contents Introduction to OpenSolver slides 3-4 Example 1: Diet Problem, Set-Up slides 5-11 Example 1: Diet Problem, Dialog Box slides 12-17 Example
Meta Analysis. David R Urbach MD MSc Outcomes Research Course December 4, 2014
 Meta Analysis David R Urbach MD MSc Outcomes Research Course December 4, 2014 Overview Definitions Identifying studies Appraising studies Quantitative synthesis Presentation of results Examining heterogeneity
TMWSuite. DAT Interactive interface
 TMWSuite DAT Interactive interface DAT Interactive interface Using the DAT Interactive interface Using the DAT Interactive interface... 1 Setting up the system to use the DAT Interactive interface... 1
Exploring Mitosis Lab IMPORTANT LEARNING OBJECTIVES INTRODUCTION cell cycle interphase division (mitosis)
") Exploring Mitosis Lab Today s lab will give you a chance to get an up-close view of mitosis, the process by which eukaryotic cells divide to generate identical daughter cells. We re using garlic (A. sativium)
Exploring Mitosis Lab Today s lab will give you a chance to get an up-close view of mitosis, the process by which eukaryotic cells divide to generate identical daughter cells. We re using garlic (A. sativium)