Colorectal Cancer in Idaho November 2, 2006 Chris Johnson, CDRI
|
|
|
- Julius Jenkins
- 5 years ago
- Views:
Transcription

1 Colorectal Cancer in Idaho November 2, 2006 Chris Johnson, CDRI
2 Colorectal Cancer in Idaho, Fast facts: Colorectal cancer is the second leading cause of cancer death in Idaho and the U.S. It is largely preventable with screening and the removal of pre-cancerous polyps. There is currently no program in Idaho to specifically address awareness, prevention and early detection of colorectal cancer.
3 Colorectal Cancer in Idaho, Presentation includes information on: Risk Factors (BRFSS & YRBSS) Screening (BRFSS) Incidence (CDRI & SEER) Survival (CDRI & SEER) Mortality (CDRI & SEER)
4 Risk Factors - Data Sources YRBSS Youth Risk Behavior Surveillance System School-based health survey of public high school students in Idaho. Conducted by the Idaho Department of Education with assistance from Idaho Division of Health and CDC. BRFSS Behavioral Risk Factor Surveillance System Phone-based health survey of adults aged 18+. Conducted by Idaho Division of Health under cooperative agreement with CDC.
5 Presentation Format Population Prevalence Probability (Odds Ratios) Maps Crude (Population Prevalence) Adjusted (Odds Ratios)
6 Prevalence In epidemiology, the prevalence of a disease or condition is defined as: the total number of persons with the disease/condition in a specified population at a specified time and/or the ratio of the number of cases of the disease/condition to the total population size at a specified time (percentage, rate).
7 Odds Ratio The odds are a way of representing probability, especially familiar for betting. Example: the odds that a single throw of a die will produce a six are 1 to 5, or 1/5. The odds is the ratio of the probability that the event of interest occurs to the probability that it does not. This is often estimated by the ratio of the number of times that the event of interest occurs to the number of times that it does not.
8 Odds Ratio Review Disease Yes No Exposure Yes No Odds of Disease among Exposed = 20/30 =.667 Odds of Disease among non-exposed = 10/100 =.1 Odds Ratio = 6.67 Odds of Exposure among Cases = 20/10 = 2.0 Odds of Exposure among Controls = 30/100 = 0.3 Odds Ratio = 6.67
9 Odds Ratio Review These are the SAME numerical ratios. This property makes the odds ratio a useful indicator of the strength of relationships, for both case-control and cohort studies.
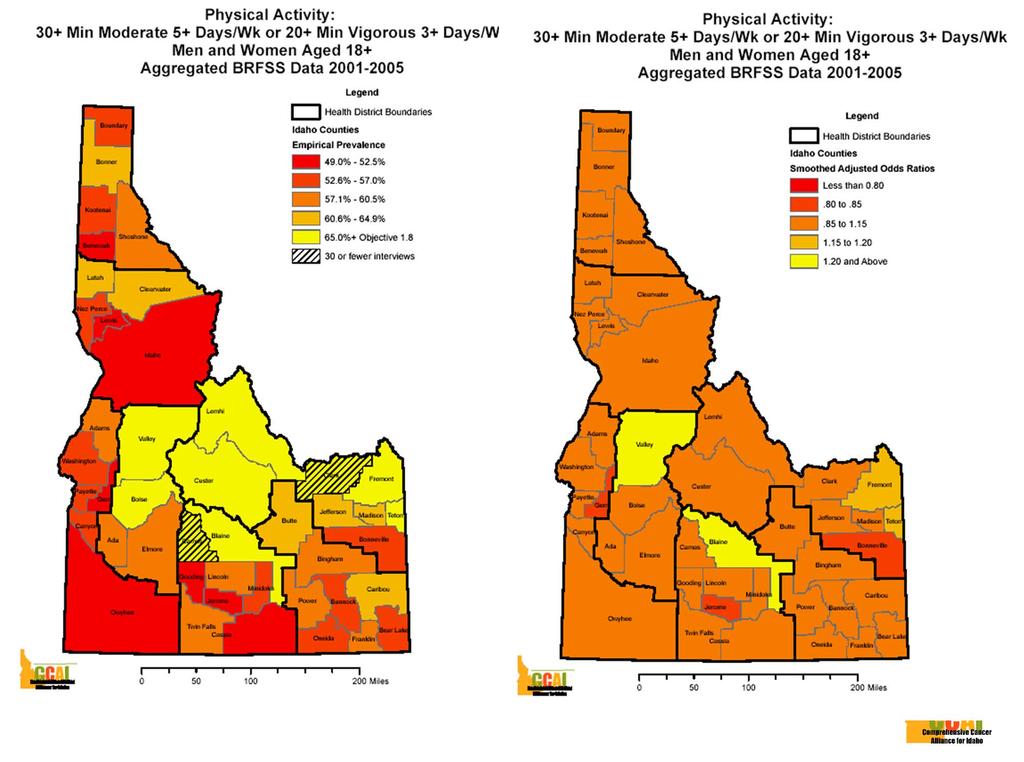
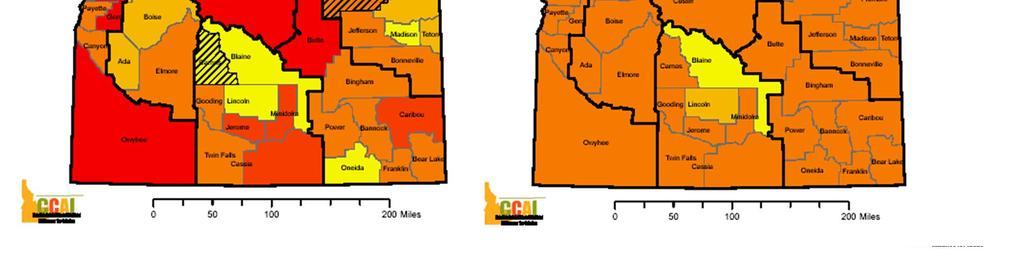
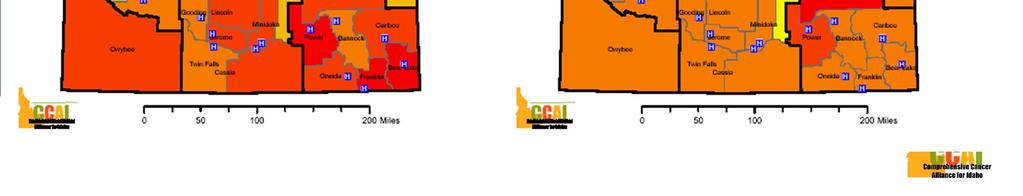
10 Physical Activity: 30+ Min Moderate 5+ Days/Wk or 20+ Min Vigorous 3+ Days/Wk Men and Women Aged 18+ Goal: 65% Percent 95% Confidence Rounded 2005 Number Insuff. # To Reach Overall N Phys Act Interval Population Phys Act Phys Act Goal Yes % 56.3% % 951, , ,000 67,000 Percent 95% Confidence Rounded 2005 Number Insuff. # To Reach Race/Ethnicity N Phys Act Interval Population Phys Act Phys Act Goal Non-Hispanic White % 57.2% % 827, , ,000 50,000 Hispanic % 37.1% % 80,000 37,000 43,000 16,000 Native American % 44.3% % 14,000 8,000 6,000 2,000 Other % 49.2% % 28,000 17,000 11,000 2,000 Percent 95% Confidence Rounded 2005 Number Insuff. # To Reach Age Group N Phys Act Interval Population Phys Act Phys Act Goal % 57.7% % 150,000 97,000 53,000 1, % 56.3% % 173, ,000 68,000 8, % 59.1% % 178, ,000 66,000 4, % 55.5% % 181, ,000 74,000 11, % 48.1% % 128,000 67,000 62,000 17, % 43.3% % 142,000 66,000 76,000 27,000 Percent 95% Confidence Rounded 2005 Number Insuff. # To Reach Sex N Phys Act Interval Population Phys Act Phys Act Goal Male % 57.1% % 478, , ,000 25,000 Female % 54.0% % 473, , ,000 42,000 Percent 95% Confidence Rounded 2005 Number Insuff. # To Reach Health Insurance N Phys Act Interval Population Phys Act Phys Act Goal Yes % 56.8% % 770, , ,000 49,000 No % 49.7% % 176,000 97,000 80,000 18,000 Percent 95% Confidence Rounded 2005 Number Insuff. # To Reach Household Income N Phys Act Interval Population Phys Act Phys Act Goal Less than $15, % 47.2% % 92,000 49,000 43,000 11,000 $15,000 - $24, % 47.6% % 157,000 82,000 75,000 21,000 $25,000 - $34, % 53.3% % 134,000 78,000 56,000 9,000 $35,000 - $49, % 54.9% % 172, ,000 71,000 11,000 $50, % 60.8% % 305, , ,000 4,000 Percent 95% Confidence Rounded 2005 Number Insuff. # To Reach Education N Phys Act Interval Population Phys Act Phys Act Goal Not College Grad % 53.6% % 684, , ,000 63,000 College Grad % 60.7% % 267, ,000 97,000 4,000 Source: 2005 BRFSS data provided by BHPVS, analyzed by CDRI. Note: Estimated 2005 population based on 2005 BRFSS weights. Category totals are not equal due to differential missing data patterns. Population numbers are rounded to the nearest 1,000. Number to screen to reach goal rounded up to nearest 1,000. * In 2005, Idaho ranked 12th among states (1st = best) in the proportion of adults who engaged in moderate or vigorous physical activity for the prescribed durations and frequencies.
11 Physical Activity Men and Women Aged 18+ Aggregated BRFSS Data Results from Multilevel Logistic Regression Modeling Odds Ratios and 95% Confidence Intervals for Fixed Parameters Main Effect OR 95% CI Age, y Sex Male Female 1.00 Race/Ethnicity Non-Hispanic White Hispanic Native American Other 1.00 Health Insurance Yes No 1.00 Household Income Less than $15, $15,000 - $24, $25,000 - $34, $35,000 - $49, $50, Education Not College Grad 1.00 College Grad Year of Survey Variation (on Logit Scale) in Screening Between Counties, Before and After Taking Into Account Individual-Level Covariates, Idaho, Before Adjustment After Percent Change %
12
13 Youth Physical Activity By 2010 Increase to 80% the percentage of idaho high school students who accumulate 30 minutes or more per day of moderate physical activity on five or more days of the week or participate in 20 minutes or more of vigorous physical acitivity on three or more days of the week. Source: 2005 Idaho Youth Risk Behavior Survey N % 95% C.I. Total Population* (rounded) Number of Physically Active Youth Number of students needing to increase P.A. to hit target 2005 Idaho total 1, % 70.5% % 66,700 48,691 4,669 Sex Male % 75.1% % 32,300 25, Female % 63.0% % 34,200 23,119 4,241 Ethnicity Hispanic % 61.3% % 7,000 4, White 1, % 71.0% % 50,600 37,242 3,238 Grade 9th % 70.8% % 12,200 9, th % 74.1% % 16,000 12, th % 63.8% % 22,900 15,755 2,565 12th % 61.3% % 15,000 10,305 1,695 *Based on weighted sample values; data were weighted by grade and sex to represent Idaho public school students in grades 9 through 12.
14 Body Mass Index: Neither Overweight Nor Obese (BMI<25.0) Men and Women Aged 18+ Goal: 45% Percent 95% Confidence Rounded 2005 Number Over- # To Reach Overall N OK Weight Interval Population OK Weight Weight Goal Yes % 36.8% % 970, , ,000 62,000 Percent 95% Confidence Rounded 2005 Number Over- # To Reach Race/Ethnicity N OK Weight Interval Population OK Weight Weight Goal Non-Hispanic White % 37.0% % 853, , ,000 53,000 Hispanic % 30.4% % 69,000 28,000 42,000 4,000 Native American % 14.2% % 15,000 4,000 11,000 3,000 Other % 25.3% % 30,000 11,000 19,000 3,000 Percent 95% Confidence Rounded 2005 Number Over- # To Reach Age Group N OK Weight Interval Population OK Weight Weight Goal % 52.1% % 144,000 86,000 59, % 38.1% % 173,000 73, ,000 5, % 30.9% % 180,000 62, ,000 19, % 26.1% % 184,000 54, ,000 30, % 27.4% % 131,000 40,000 91,000 19, % 35.1% % 157,000 60,000 97,000 11,000 Percent 95% Confidence Rounded 2005 Number Over- # To Reach Sex N OK Weight Interval Population OK Weight Weight Goal Male % 26.3% % 492, , ,000 78,000 Female % 46.2% % 478, , ,000 - Percent 95% Confidence Rounded 2005 Number Over- # To Reach Health Insurance N OK Weight Interval Population OK Weight Weight Goal Yes % 35.8% % 794, , ,000 59,000 No % 38.1% % 171,000 74,000 97,000 3,000 Males Percent 95% Confidence Rounded 2005 Number Over- # To Reach Household Income N OK Weight Interval Population OK Weight Weight Goal Less than $15, % 30.2% % 37,000 17,000 21,000 1,000 $15,000 - $24, % 24.7% % 82,000 25,000 56,000 12,000 $25,000 - $34, % 24.3% % 72,000 24,000 48,000 9,000 $35,000 - $49, % 15.8% % 92,000 19,000 73,000 23,000 $50, % 22.4% % 176,000 46, ,000 33,000 Females Percent 95% Confidence Rounded 2005 Number Over- # To Reach Household Income N OK Weight Interval Population OK Weight Weight Goal Less than $15, % 39.1% % 54,000 24,000 30,000 - $15,000 - $24, % 41.4% % 82,000 38,000 44,000 - $25,000 - $34, % 42.5% % 62,000 30,000 32,000 - $35,000 - $49, % 41.3% % 81,000 38,000 43,000 - $50, % 46.5% % 139,000 70,000 69,000 - Source: 2005 BRFSS data provided by BHPVS, analyzed by CDRI. Note: Estimated 2005 population based on 2005 BRFSS weights. Category totals are not equal due to differential missing data patterns. Population numbers are rounded to the nearest 1,000. Numbers to reach goal rounded up to nearest 1,000. * In 2005, Idaho ranked 25th among states (1st = best) in the proportion of adults who were neither overweight nor obese (body mass index < 25.0).
15 Body Mass Index: Neither Overweight Nor Obese (BMI<25.0) Men and Women Aged 18+ Aggregated BRFSS Data Results from Multilevel Logistic Regression Modeling Odds Ratios and 95% Confidence Intervals for Fixed Parameters Main Effect OR 95% CI Age, y Race/Ethnicity Non-Hispanic White Hispanic Native American Other 1.00 Health Insurance Yes No 1.00 Sex and Income M- Less than $15, M- $15,000 - $24, M- $25,000 - $34, M- $35,000 - $49, M- $50, F- Less than $15, F- $15,000 - $24, F- $25,000 - $34, F- $35,000 - $49, F- $50, Education Not College Grad 1.00 College Grad Year of Survey Variation (on Logit Scale) in Screening Between Counties, Before and After Taking Into Account Individual-Level Covariates, Idaho, Before Adjustment After Percent Change %

16
17 Colorectal Cancer Screening: Colonoscopy or Sigmoidoscopy Within Previous 5 Years Men and Women Aged 50+ Goal: 50% Percent 95% Confidence Rounded 2004 Number Not # to Screen To Overall N Screened Interval Population Screened Screened Reach Goal Yes % 35.7% % 365, , ,000 44,000 Percent 95% Confidence Rounded 2004 Number Not # to Screen To Age Group N Screened Interval Population Screened Screened Reach Goal % 20.1% % 92,000 22,000 69,000 24, % 32.1% % 124,000 44,000 80,000 18, % 44.4% % 149,000 72,000 77,000 3,000 Percent 95% Confidence Rounded 2004 Number Not # to Screen To Sex N Screened Interval Population Screened Screened Reach Goal Male % 35.6% % 170,000 67, ,000 19,000 Female % 34.0% % 195,000 72, ,000 26,000 Percent 95% Confidence Rounded 2004 Number Not # to Screen To Health Insurance N Screened Interval Population Screened Screened Reach Goal Yes % 38.1% % 331, , ,000 32,000 No % 8.1% % 33,000 4,000 29,000 13,000 Percent 95% Confidence Rounded 2004 Number Not # to Screen To Household Income N Screened Interval Population Screened Screened Reach Goal Less than $15, % 28.1% % 32,000 11,000 21,000 5,000 $15,000 - $24, % 32.2% % 73,000 27,000 46,000 10,000 $25,000 - $34, % 33.9% % 54,000 21,000 33,000 6,000 $35,000 - $49, % 30.5% % 61,000 22,000 39,000 9,000 $50, % 35.0% % 100,000 40,000 61,000 11,000 Percent 95% Confidence Rounded 2004 Number Not # to Screen To Education N Screened Interval Population Screened Screened Reach Goal Not College Grad % 33.9% % 263,000 96, ,000 36,000 College Grad % 37.1% % 102,000 42,000 59,000 9,000 Source: 2004 BRFSS data provided by BHPVS, analyzed by CDRI. Note: Estimated 2004 population based on 2004 BRFSS weights. Category totals are not equal due to differential missing data patterns. Population numbers are rounded to the nearest 1,000. Number to screen to reach goal rounded up to nearest 1,000. * In 2004, Idaho ranked 42nd among states (1st = best) in the proportion of adults aged 50+ who have ever had a sigmoidoscopy or colonoscopy.
18 Colonoscopy or Sigmoidoscopy Within Previous 5 Years Men and Women Aged 50+ Aggregated BRFSS Data Results from Multilevel Logistic Regression Modeling Odds Ratios and 95% Confidence Intervals for Fixed Parameters Main Effect OR 95% CI Age, y Sex Male Female 1.00 Health Insurance Yes No 1.00 Household Income Less than $15, $15,000 - $24, $25,000 - $34, $35,000 - $49, $50, Education Not College Grad 1.00 College Grad Year of Survey Variation (on Logit Scale) in Screening Between Counties, Before and After Taking Into Account Individual-Level Covariates, Idaho, Before Adjustment After Percent Change % Variation (on Logit Scale) in Screening Between Counties, Before and After Taking Into Account County-Level # of Facilities Offering Colonoscopy, Idaho, Before Adjustment After Percent Change %

19
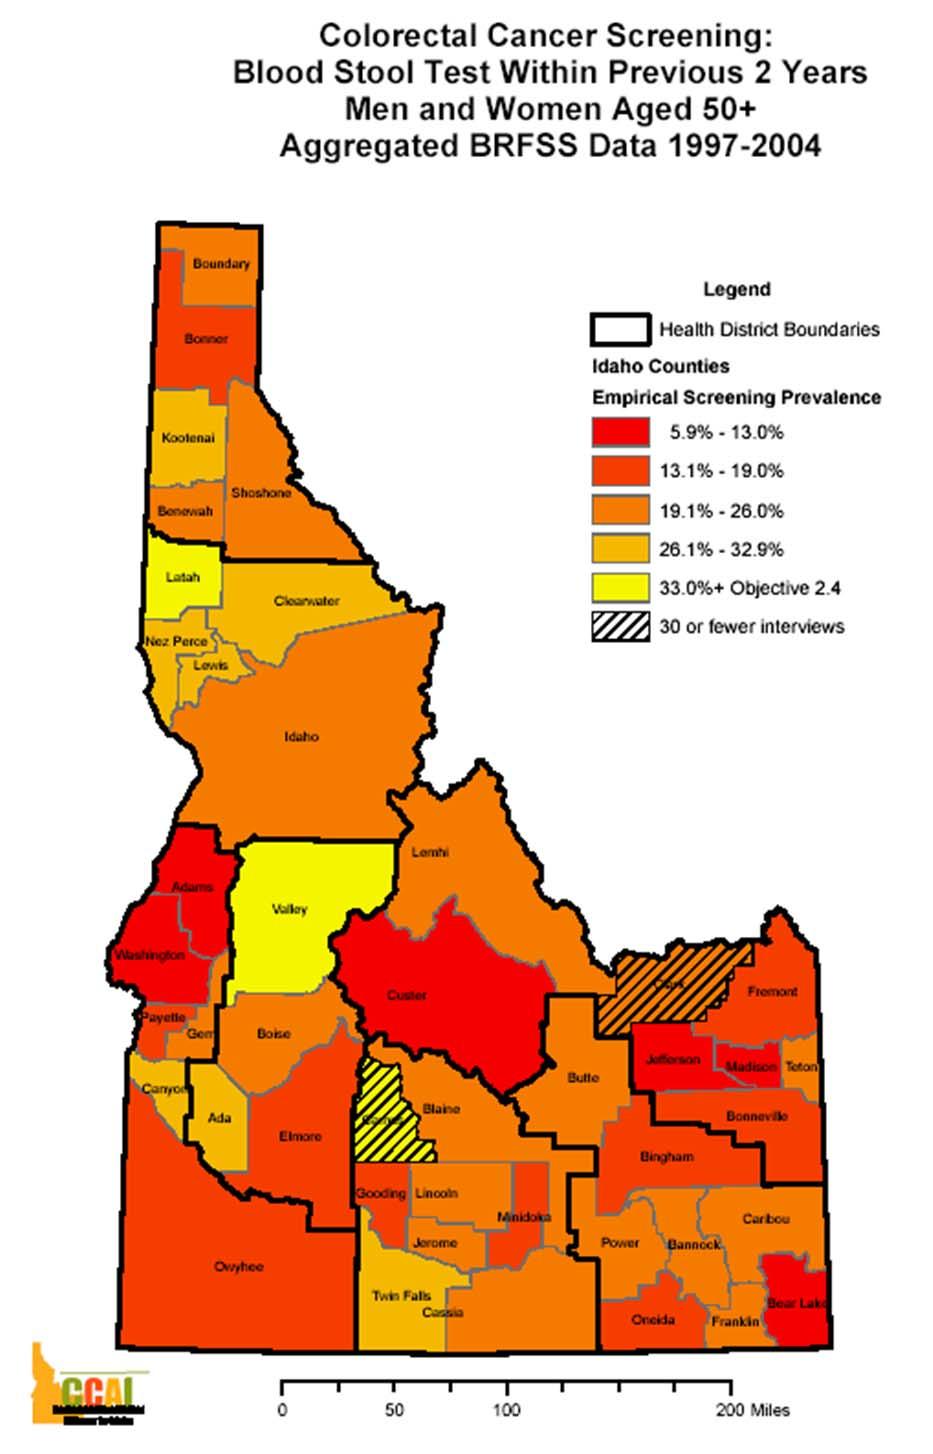
20 Colorectal Cancer Screening: Blood Stool Test Within Previous 2 Years Men and Women Aged 50+ Goal: 33% Percent 95% Confidence Rounded 2004 Number Not # to Screen To Overall N Screened Interval Population Screened Screened Reach Goal Yes % 19.9% % 362,000 79, ,000 41,000 Percent 95% Confidence Rounded 2004 Number Not # to Screen To Age Group N Screened Interval Population Screened Screened Reach Goal % 9.7% % 90,000 12,000 78,000 18, % 21.4% % 123,000 30,000 92,000 11, % 21.5% % 149,000 37, ,000 13,000 Percent 95% Confidence Rounded 2004 Number Not # to Screen To Sex N Screened Interval Population Screened Screened Reach Goal Male % 18.0% % 169,000 36, ,000 21,000 Female % 20.0% % 193,000 43, ,000 21,000 Percent 95% Confidence Rounded 2004 Number Not # to Screen To Health Insurance N Screened Interval Population Screened Screened Reach Goal Yes % 20.3% % 328,000 74, ,000 35,000 No % 10.1% % 33,000 5,000 27,000 6,000 Percent 95% Confidence Rounded 2004 Number Not # to Screen To Household Income N Screened Interval Population Screened Screened Reach Goal Less than $15, % 14.6% % 32,000 6,000 26,000 5,000 $15,000 - $24, % 17.8% % 72,000 16,000 56,000 8,000 $25,000 - $34, % 18.2% % 54,000 12,000 41,000 6,000 $35,000 - $49, % 15.1% % 61,000 12,000 49,000 9,000 $50, % 17.9% % 98,000 22,000 77,000 11,000 Percent 95% Confidence Rounded 2004 Number Not # to Screen To Education N Screened Interval Population Screened Screened Reach Goal Not College Grad % 18.5% % 261,000 54, ,000 33,000 College Grad % 20.8% % 100,000 25,000 75,000 8,000 Source: 2004 BRFSS data provided by BHPVS, analyzed by CDRI. Note: Estimated 2004 population based on 2004 BRFSS weights. Category totals are not equal due to differential missing data patterns. Population numbers are rounded to the nearest 1,000. Number to screen to reach goal rounded up to nearest 1,000. * In 2004, Idaho ranked 45th among states (1st = best) in the proportion of adults aged 50+ who had a blood stool test within the previous two years.
21 Blood Stool Test Within Previous 2 Years Men and Women Aged 50+ Aggregated BRFSS Data Results from Multilevel Logistic Regression Modeling Odds Ratios and 95% Confidence Intervals for Fixed Parameters Main Effect OR 95% CI Age, y Sex Male Female 1.00 Health Insurance Yes No 1.00 Household Income Less than $15, $15,000 - $24, $25,000 - $34, $35,000 - $49, $50, Education Not College Grad 1.00 College Grad Year of Survey Variation (on Logit Scale) in Screening Between Counties, Before and After Taking Into Account Individual-Level Covariates, Idaho, Before Adjustment After Percent Change %


22
23 Colorectal Cancer in Idaho, , Invasive Cases Numbers of Cases, Age-adjusted and Crude Rates Rates Geography Adjusted Crude Cases Person-Years Health District ,966 Health District ,038 Health District ,379 Health District ,109,708 Health District ,889 Health District ,239 Health District ,201 State of Idaho ,714 4,103,420 SEER Whites ,577 59,360,369 SEER All Races ,022 76,177,809 Rates are per 100,000 person-years. Age-adjusted rates use the 2000 U.S. standard.
24 State Colorectal Cancer Incidence Age-specific Rates < Age Group (in years) All Male Female Rate per 100,000 person-years
25 Colorectal Cancer Stage-specific Age-adjusted Incidence Rates, Late Early SEER 2003 State of Idaho Health District 1 Health District 2 Health District 3 Health District 4 Health District 5 Health District 6 Health District 7 Age-adjusted rate per 100,000
26 Colorectal Cancer Survival, % 90% Relative Percent Surviving 80% 70% 60% 50% 40% 30% 20% In situ Idaho In situ SEER Localized Idaho Localized SEER Regional Idaho Regional SEER Distant Idaho Distant SEER Unstaged Idaho Unstaged SEER 10% 0% Years Survival
27 Colorectal Cancer in Idaho, , Mortality Numbers of Deaths, Age-adjusted and Crude Rates Rates Geography Adjusted Crude Deaths Person-Years Health District ,966 Health District ,038 Health District ,124 Health District ,109,708 Health District ,889 Health District ,239 Health District ,201 State of Idaho ,103,420 US Whites , ,281,936 US All Races , ,788,976 Rates are per 100,000 person-years. Age-adjusted rates use the 2000 U.S. standard.
28 Questions/Comments
CDRI Cancer Disparities Geocoding Project. November 29, 2006 Chris Johnson, CDRI
 CDRI Cancer Disparities Geocoding Project November 29, 2006 Chris Johnson, CDRI cjohnson@teamiha.org CDRI Cancer Disparities Geocoding Project Purpose: To describe and understand variations in cancer incidence,
Metropolitan and Micropolitan Statistical Area Cancer Incidence: Late Stage Diagnoses for Cancers Amenable to Screening, Idaho
 Metropolitan and Micropolitan Statistical Area Cancer Incidence: Late Stage Diagnoses for Cancers Amenable to Screening, Idaho 26-29 December 2 A Publication of the CANCER DATA REGISTRY OF IDAHO P.O. Box
NEZ PERCE COUNTY CANCER PROFILE
 NEZ PERCE COUNTY CANCER PROFILE A fact sheet from the Cancer Data Registry of Idaho, Idaho Hospital Association. Cancer Incidence 2010-2014 Cancer Mortality 2011-2015 BRFSS 2011-2015 CANCER Cancer is a
KOOTENAI COUNTY CANCER PROFILE
 KOOTENAI COUNTY CANCER PROFILE A fact sheet from the Cancer Data Registry of Idaho, Idaho Hospital Association. Cancer Incidence 2010-2014 Cancer Mortality 2011-2015 BRFSS 2011-2015 CANCER Cancer is a
BOUNDARY COUNTY CANCER PROFILE
 BOUNDARY COUNTY CANCER PROFILE A fact sheet from the Cancer Data Registry of Idaho, Idaho Hospital Association. Cancer Incidence 2010-2014 Cancer Mortality 2011-2015 BRFSS 2011-2015 CANCER Cancer is a
ADAMS COUNTY CANCER PROFILE
 ADAMS COUNTY CANCER PROFILE A fact sheet from the Cancer Data Registry of Idaho, Idaho Hospital Association. Cancer Incidence 2010-2014 Cancer Mortality 2011-2015 BRFSS 2011-2015 CANCER Cancer is a group
BONNER COUNTY CANCER PROFILE
 BONNER COUNTY CANCER PROFILE A fact sheet from the Cancer Data Registry of Idaho, Idaho Hospital Association. Cancer Incidence 2010-2014 Cancer Mortality 2011-2015 BRFSS 2011-2015 CANCER Cancer is a group
BINGHAM COUNTY CANCER PROFILE
 BINGHAM COUNTY CANCER PROFILE A fact sheet from the Cancer Data Registry of Idaho, Idaho Hospital Association. Cancer Incidence 2011-2015 Cancer Mortality 2012-2016 BRFSS 2011-2016 CANCER Cancer is a group
NEZ PERCE COUNTY CANCER PROFILE
 NEZ PERCE COUNTY CANCER PROFILE A fact sheet from the Cancer Data Registry of Idaho, Idaho Hospital Association. Cancer Incidence 2011-2015 Cancer Mortality 2012-2016 BRFSS 2011-2016 CANCER Cancer is a
KOOTENAI COUNTY CANCER PROFILE
 KOOTENAI COUNTY CANCER PROFILE A fact sheet from the Cancer Data Registry of Idaho, Idaho Hospital Association. Cancer Incidence 2011-2015 Cancer Mortality 2012-2016 BRFSS 2011-2016 CANCER Cancer is a
TWIN FALLS COUNTY CANCER PROFILE
 TWIN FALLS COUNTY CANCER PROFILE A fact sheet from the Cancer Data Registry of Idaho, Idaho Hospital Association. Cancer Incidence 2011-2015 Cancer Mortality 2012-2016 BRFSS 2011-2016 CANCER Cancer is
JEROME COUNTY CANCER PROFILE
 JEROME COUNTY CANCER PROFILE A fact sheet from the Cancer Data Registry of Idaho, Idaho Hospital Association. Cancer Incidence 2011-2015 Cancer Mortality 2012-2016 BRFSS 2011-2016 CANCER Cancer is a group
BUTTE COUNTY CANCER PROFILE
 BUTTE COUNTY CANCER PROFILE A fact sheet from the Cancer Data Registry of Idaho, Idaho Hospital Association. Cancer Incidence 2011-2015 Cancer Mortality 2012-2016 BRFSS 2011-2016 CANCER Cancer is a group
LINCOLN COUNTY CANCER PROFILE
 LINCOLN COUNTY CANCER PROFILE A fact sheet from the Cancer Data Registry of Idaho, Idaho Hospital Association. Cancer Incidence 2011-2015 Cancer Mortality 2012-2016 BRFSS 2011-2016 CANCER Cancer is a group
CANYON COUNTY CANCER PROFILE
 CANYON COUNTY CANCER PROFILE A fact sheet from the Cancer Data Registry of Idaho, Idaho Hospital Association. Cancer Incidence 2011-2015 Cancer Mortality 2012-2016 BRFSS 2011-2016 CANCER Cancer is a group
Cancer Health Disparities in Tarrant County
 Cancer Health Disparities in Tarrant County A presentation to the Tarrant County Cancer Disparities Coalition May 3, 07 Marcela Gutierrez, LMSW Assistant Professor in Practice UTA School of Social Work
Incidence of Cancers Associated with Modifiable Risk Factors and Late Stage Diagnoses for Cancers Amenable to Screening Idaho
 Incidence of Cancers Associated with Modifiable Risk Factors and Late Stage Diagnoses for Cancers Amenable to Screening Idaho 2008-2011 August 2013 A Publication of the Cancer Data Registry of Idaho PO
BREAST CANCER IN IDAHO
 BREAST CANCER IN IDAHO 1997-2001 1 2 3 4 5 7 6 Non-Hospital Mammography Facilities Idaho Hospitals Health Districts Idaho County Boundaries This PowerPoint presentation was created as a collaborative effort
Incidence of Cancers Associated with Modifiable Risk Factors and Late Stage Diagnoses for Cancers Amenable to Screening Idaho
 Incidence of Cancers Associated with Modifiable Risk Factors and Late Stage Diagnoses for Cancers Amenable to Screening Idaho 2009-2012 June 2015 A Publication of the Cancer Data Registry of Idaho PO Box
Smoking Status and Body Mass Index in the United States:
 Smoking Status and Body Mass Index in the United States: 1996-2000 Jun Yang, MD, PhD and Gary Giovino, PhD Roswell Park Cancer Institute Elm and Carlton Streets Buffalo, NY 14263, USA Society for Research
Diabetes in the District
 Diabetes in the District Robin Diggs Outlaw, MPH Program Director Cardiovascular Disease and Diabetes Programs District of Columbia Department of Health Community Health Administration Bureau of Cancer
Supplementary Online Content
 Supplementary Online Content Drury KE, Schaeffer M, Silverberg JI. Association between atopic disease and anemia in US children. JAMA Pediatr. Published online vember 30, 2015. doi:10.1001/jamapediatrics.2015.3065.
Demographics and Health Data
 Demographics and Health Data Information for Local Planners City of Puyallup, WA Demographic Characteristics Environmental Health Division 3629 South D Street, Tacoma, WA 98418 (253) 798-6470 Table 1 presents
Demographics and Health Data
 Demographics and Health Data Information for Local Planners City of Lakewood, WA Demographic Characteristics Environmental Health Division 3629 South D Street, Tacoma, WA 98418 (253) 798-6470 Table 1 presents
IMPACT OF AREA-POVERTY RATE ON LATE-STAGE COLORECTAL CANCER INCIDENCE IN INDIANA, NAACCR JUNE 22, 2017
 IMPACT OF AREA-POVERTY RATE ON LATE-STAGE COLORECTAL CANCER INCIDENCE IN INDIANA, 2010-2014 NAACCR JUNE 22, 2017 Aaron Cocke, Amanda K. Raftery, Timothy McFarlane SECTION 1 OVERVIEW OF PROJECT Purposes
CANCER. in north carolina Report. cancer and income with a special report on cancer, income, and racial differences
 CANCER in north carolina 2008 Report cancer and income with a special report on cancer, income, and racial differences purpose During 2007 cancer passed heart disease as the number one cause of death among
Indiana Cancer Control Plan,
 Indiana Cancer Control Plan, 2018-2020 Data Compendium Contents About this Document... 1 Data Sources... 1 Primary Measures... 4 GOAL AREA: Primary Prevention... 4 Objective 1: Increase percentage of Hoosiers
The State of Asthma in Arkansas
 2013 The State of Asthma in Arkansas Jennifer Maulden, MA Martha Phillips, PhD University of Arkansas for Medical Sciences Fay W. Boozman College of Public Health This project was supported by Award Number
Florida Cancer Data System, University of Miami. Presentation for the Annual Conference of the North American Association of Central Cancer
 Hernandez, MN, Mackinnon, JA, Fleming, LE, Lee, DJ Florida Cancer Data System, University of Miami Presentation for the Annual Conference of the North American Association of Central Cancer Registries
Cancer Facts & Figures for African Americans
 Cancer Facts & Figures for African Americans What is the Impact of Cancer on African Americans in Indiana? Table 12. Burden of Cancer among African Americans Indiana, 2004 2008 Average number of cases
Healthy Montgomery Obesity Work Group Montgomery County Obesity Profile July 19, 2012
 Healthy Montgomery Obesity Work Group Montgomery County Obesity Profile July 19, 2012 Prepared by: Rachel Simpson, BS Colleen Ryan Smith, MPH Ruth Martin, MPH, MBA Hawa Barry, BS Executive Summary Over
Early Age and Late Stage Diagnosis of Colorectal Cancer Among American Indian Residents of Montana,
 Early Age and Late Stage Diagnosis of Colorectal Cancer Among American Indian Residents of Montana, 2001-2010 Laura L. Williamson, MPH Epidemiologist and Program Manager Montana Central Tumor Registry
American Cancer Society Progress Report. December 2016
 American Cancer Society Progress Report December 2016 2015 Goals Incidence: By 2015, 25% reduction (unlikely to meet goal) Baseline 1992-2013: 12.1% reduction Latest joinpoint trend: -1.5% APC (2009-2013)
5. Cardiovascular Disease & Stroke
 5. Cardiovascular Disease & Stroke 64: Self-Reported Heart Disease 66: Heart Disease Management 68: Heart Disease Mortality 70: Heart Disease Mortality Across Life Span 72: Stroke Mortality 185: Map 3:
State of Wyoming. Department of Health
 State of Wyoming Department of Health Colorectal Cancer in Wyoming: Issue Brief Thomas O. Forslund, Director March 2012 The Issue Brief of Colorectal Cancer in Wyoming is published by the Public Health
Community Health Needs Assessment (CHNA)
") Community Health Needs Assessment (CHNA) Pierce ; St. Croix Contents Demographics... 3 Total Population... 4 Median Age... 6 Population Under Age 18... 8 Population Age 65+... 9 Population with Any Disability...
Community Health Needs Assessment (CHNA) Pierce ; St. Croix Contents Demographics... 3 Total Population... 4 Median Age... 6 Population Under Age 18... 8 Population Age 65+... 9 Population with Any Disability...
Behavioral Risk Factors in Adults
 Behavioral Risk Factors in Adults Behavioral risk factors are behaviors that increase the possibility of disease, such as smoking, alcohol use, bad eating habits, and not getting enough exercise. Because
CIGARETTE SMOKING AMONG ADOLESCENTS AND ADULTS IN U.S. STATES AND THE DISTRICT OF COLUMBIA IN 1997 AND WHAT EXPLAINS THE RELATIONSHIP?
 CIGARETTE SMOKING AMONG ADOLESCENTS AND ADULTS IN U.S. STATES AND THE DISTRICT OF COLUMBIA IN 1997 AND 1999 - WHAT EXPLAINS THE RELATIONSHIP? Gary A. Giovino; Andrew Hyland; Michael W. Smith; Cindy Tworek;
THE STATE OF ASTHMA IN INDIANA
 THE STATE OF ASTHMA IN INDIANA ASTHMA PROGRAM OCTOBER 2015 Jack Kinsey, MPH Asthma Epidemiologist Indiana State Department of Health A healthier and safer Indiana Today s Session Will Cover: Data from
650, Our Failure to Deliver
 650, Our Failure to Deliver, Director UAB Comprehensive Cancer Center Professor of Gynecologic Oncology Evalina B. Spencer Chair in Oncology President, American Cancer Society All Sites Mortality Rates
Gender Disparities in Viral Suppression and Antiretroviral Therapy Use by Racial and Ethnic Group Medical Monitoring Project,
 Gender Disparities in Viral Suppression and Antiretroviral Therapy Use by Racial and Ethnic Group Medical Monitoring Project, 2009-2010 Linda Beer PhD, Christine L Mattson PhD, William Rodney Short MD,
Pennsylvania Department of Health 2006 Behavioral Risks of Chester County Adults Page 1
 2006 Behavioral Health Risks Of Adults Healthy Communities Partnership Department of Health 2006 Behavioral Risks of Adults Page 1 Introduction The Centers for Disease Control and Prevention (CDC) and
Some college. Native American/ Other. 4-year degree 13% Grad work
 Access to Affordable Health Care Access to affordable care improves quality of life and health outcomes. Without affordable access to a doctor, residents are more likely to end up in expensive emergency
Prediabetes Prevalence and Risk Factors in Alabama, 2013
 Prediabetes Prevalence and Risk Factors in Alabama, 2013 Emily Piercefield, MD, MPH CDC Assignee to the Alabama Department of Public Health Bureau of Health Promotion and Chronic Disease CSTE June 15,
OBESITY IN MISSOURI: IMPLICATIONS FOR HEALTH / FOOD POLICY
 1 OBESITY IN MISSOURI: IMPLICATIONS FOR HEALTH / FOOD POLICY Venkata Garikapaty, PhD, MPH Chief, Office of Epidemiology Missouri Department of Health and Senior Services 10/26/2017 Missouri Council for
Trends in Pneumonia and Influenza Morbidity and Mortality
 Trends in Pneumonia and Influenza Morbidity and Mortality American Lung Association Epidemiology and Statistics Unit Research and Health Education Division November 2015 Page intentionally left blank Introduction
What is the Impact of Cancer on African Americans in Indiana? Average number of cases per year. Rate per 100,000. Rate per 100,000 people*
 What is the Impact of Cancer on African Americans in Indiana? Table 13. Burden of Cancer among African Americans Indiana, 2008 2012 Average number of cases per year Rate per 100,000 people* Number of cases
Cancer and Demographic COUNTY PROFILE Broward County, Florida
 Cancer and Demographic COUNTY PROFILE Broward County, Florida Sylvester Comprehensive Cancer Center Jay Weiss Institute for Health Equity University of Miami Revised Sept. 2016 TABLE OF CONTENTS Page Introduction
Cancer Prevention & Early Detection Facts & Figures. Tables and Figures 2018
 Cancer Prevention & Early Detection Facts & Figures Tables and Figures 2018 1 Table of Contents Tobacco Use Figure 1A. State Cigarette Excise Tax, 2018..... 3 Figure 1B. Proportion of Cancer Deaths Attributable
Investigating the Effects of Racial Residential Segregation, Area-level Socioeconomic Status and Physician Composition on Colorectal Cancer Screening
 Virginia Commonwealth University VCU Scholars Compass Theses and Dissertations Graduate School 2016 Investigating the Effects of Racial Residential Segregation, Area-level Socioeconomic Status and Physician
2018 HIV/AIDS Epidemiology Update 2017 Data. James Dowling Health Program Coordinator Division of Public Health
 2018 HIV/AIDS Epidemiology Update 2017 Data James Dowling Health Program Coordinator Division of Public Health Primary Sources Evaluation HIV/AIDS Reporting System (EHARS) Collects infection data from
Medicaid Expansion & Adult Dental Benefits: Access to Dental Care among Low-Income Adults
 Medicaid Expansion & Adult Dental Benefits: Access to Dental Care among Low-Income Adults Astha Singhal BDS, MPH, PhD Assistant Professor, Health Policy & Health Services Research Boston University Henry
Community Health Needs Assessment
 Community Health Needs Assessment Gratiot County Community Health Assessment Community Health Assessment Data Sources Primary Data (new data collected first-hand) Community Opinion Survey Provider Opinion
Increasing Colorectal Cancer Screening in Wyoming. Allie Bain, MPH Outreach & Education Supervisor Wyoming Integrated Cancer Services Program
 Increasing Colorectal Cancer Screening in Wyoming Allie Bain, MPH Outreach & Education Supervisor Wyoming Integrated Cancer Services Program Overview What is colorectal cancer? What are risk factors for
Time to Colonoscopy After a Positive Fecal Test and Risk of Colorectal Cancer Outcomes
 Time to Colonoscopy After a Positive Fecal Test and Risk of Colorectal Cancer Outcomes Douglas Corley MD, PhD Kaiser Permanente, Northern California For Corley DA, Jensen CD, Quinn VP, Doubeni CA, Zauber
Santa Clara County Highlights
 Santa Clara County Highlights Data and Partnerships: Pivotal Elements to Create Healthy Communities November 6th, 2009 David Hill, PhD, MPH Cities of Santa Clara County 2 The pivotal elements Data evidence-based
SUPPLEMENTARY DATA. Supplementary Figure S1. Cohort definition flow chart.
 Supplementary Figure S1. Cohort definition flow chart. Supplementary Table S1. Baseline characteristics of study population grouped according to having developed incident CKD during the follow-up or not
CANCER FACTS & FIGURES For African Americans
 CANCER FACTS & FIGURES For African Americans Pennsylvania, 2006 Pennsylvania Cancer Registry Bureau of Health Statistics and Research Contents Data Hightlights...1 Pennsylvania and U.S. Comparison...5
QUICK FACTS. Ohio Special Emphasis Report: Fall Injuries among Older Adults A GROWING CONCERN. 1,160 Deaths* 19,461 Hospitalizations**
 A GROWING CONCERN Unintentional falls among older adults are a leading cause of fatal and nonfatal injury in the U.S. and Ohio. Hospital costs associated with injuries sustained by falls account for a
American Indian and Alaska Native Colorectal Cancer Screening Data April 26, 2016
 American Indian and Alaska Native Colorectal Cancer Screening Data April 26, 2016 Presented by: Donald Haverkamp, MPH Presentation Overview Importance of CRC screening surveillance in AI/AN populations
Is there an association between waist circumference and type 2 diabetes or impaired fasting glucose in US adolescents?
 Is there an association between waist circumference and type 2 diabetes or impaired fasting glucose in US adolescents? Meghann M. Moore, RD, CD Masters Thesis Maternal & Child Health Track School of Public
Introduction. Behavior Surveillance System (YRBSS),
,") 2015 Prepared for the Colorado Department of Education, Colorado Department of Human Services, and Colorado Department of Public Health & Environment by the University of Colorado Anschutz Community Epidemiology
2015 Prepared for the Colorado Department of Education, Colorado Department of Human Services, and Colorado Department of Public Health & Environment by the University of Colorado Anschutz Community Epidemiology
Special Cancer Behavioral Risk Factor Survey, 2008
 Special Cancer Behavioral Risk Factor Survey, 28 April 21 Table of Contents Introduction... 1 Methodology... 1 The Survey Instrument... 1 Interview Protocols... 2 Response Rates... 2 The Sample... 3 Analysis...
71 Potential Leading Health Indicators for Healthy Alaskans 2020: Documenting Progress Towards 25 LHIs
 71 Potential Leading Health Indicators for Healthy Alaskans 2020: Documenting Progress Towards 25 LHIs : Documenting Progress Towards 25 LHIs The purpose of this report is to document the data and information
HEALTH PROMOTION AND CHRONIC DISEASE PREVENTION PROGRAM OREGON STATE OF THE HEART AND STROKE REPORT 2001 PREPARED BY.
 OREGON STATE OF THE HEART AND STROKE REPORT 2001 PREPARED BY THE OREGON DEPARTMENT OF HUMAN SERVICES HEALTH SERVICES HEALTH PROMOTION AND CHRONIC DISEASE PREVENTION PROGRAM www.healthoregon.org/hpcdp Contents
Colorectal Cancer Screening
 Tool 2.1 Cancer Screening Basic Fact Sheet Are You at High Risk? Your risk for colorectal cancer may be higher than average if: stomach You or a close relative have had colorectal polyps or colorectal
Supplemental materials for:
 Supplemental materials for: Yawn BP, Wollan P, Rank M, Bertram S, Juhn Y, Pace W. Use of asthma APGAR tools in primary care practices: a cluster-randomized controlled trial. Ann Fam Med. 2018;16(2):100-110.
Trends in Seasonal Influenza Vaccination Disparities between US non- Hispanic whites and Hispanics,
 Trends in Seasonal Influenza Vaccination Disparities between US non- Hispanic whites and Hispanics, 2000-2009 Authors by order of contribution: Andrew E. Burger Eric N. Reither Correspondence: Andrew E.
MISSING IN ACTION : Ethnic Groups in Cancer Screening
 MISSING IN ACTION : Ethnic Groups in Cancer Screening Annette E. Maxwell, Dr.P.H. Division of Cancer Prevention and Control Research Jonsson Comprehensive Cancer Center University of California, Los Angeles
Pierce County Health Indicators
 Pierce County Health Indicators 3629 S. D. St., Tacoma WA 98418-6813 Phone: 253-798-7668 email: oapi@tpchd.org Demographics Characteristics Latest Year count Percent WA State count Percent Data Source
RACE-ETHNICITY DIFFERENCES IN ADOLESCENT SUICIDE IN THE 2009 DANE COUNTY YOUTH ASSESSMENT
 1 P age RACE-ETHNICITY DIFFERENCES IN ADOLESCENT SUICIDE IN THE 2009 DANE COUNTY YOUTH ASSESSMENT Andrew J. Supple, PhD Associate Professor Human Development & Family Studies The University of North Carolina
Incidence of Primary Liver Cancer in American Indians and Alaska Natives
 Incidence of Primary Liver Cancer in American Indians and Alaska Natives Stephanie C. Melkonian, PhD Epidemiologist Epidemiology and Applied Research Branch NAACCR Annual Conference June 21, 2017 Overview
Burden of Cancer in California
 Burden of Cancer in California California Cancer Reporting and Epidemiologic Surveillance Institute for Population Health Improvement UC Davis Health August 22, 2018 Outline 1. Incidence and Mortality
Obesity in Cleveland Center for Health Promotion Research at Case Western Reserve University. Weight Classification of Clevelanders
 Obesity in Cleveland 2005-2006 March 2008 Report Contents Weight Classification of Clevelanders Local, State and National Trends in the Prevalence of Obesity Obesity by Demographic Characteristics Nutrition,
Colorado Health Disparities Profiles
 Health Disparities Profiles includes: Larimer County Population Total Population Source: CDC/NCHS 2007-based, bridged-race population estimates, 2007. Social Determinants of Health 287,574 248,312 26,629
Service Area: Herkimer, Fulton & Montgomery Counties. 140 Burwell St. 301 N. Washington St. Little Falls, NY Herkimer, NY 13350
 2016 Community Service Plan & Community Health Improvement Plan & Herkimer County Public Health Service Area: Herkimer, Fulton & Montgomery Counties Bassett Healthcare Network s Little Falls Hospital Herkimer
School Physical Activity and Nutrition (SPAN)Survey Results for McLennan County
Survey Results for McLennan County") School Physical Activity and Nutrition (SPAN)Survey 2008 Results for McLennan County What is SPAN? SPAN is the School Physical Activity and Nutrition Project. The goal of SPAN is to monitor the prevalence
School Physical Activity and Nutrition (SPAN)Survey 2008 Results for McLennan County What is SPAN? SPAN is the School Physical Activity and Nutrition Project. The goal of SPAN is to monitor the prevalence
Association of Body Mass Index and Prescription Drug Use in Children from the Medical Expenditures Panel Survey,
 Association of Body Mass Index and Prescription Drug Use in Children from the Medical Expenditures Panel Survey, 2003-2006 Yvonne Lin MCH Research Festival June 10, 2009 BMI Changes with Age in Children
Research Article Prevalence and Trends of Adult Obesity in the US,
 ISRN Obesity, Article ID 185132, 6 pages http://dx.doi.org/.1155/14/185132 Research Article Prevalence and Trends of Adult Obesity in the US, 1999 12 Ruopeng An CollegeofAppliedHealthSciences,UniversityofIllinoisatUrbana-Champaign,GeorgeHuffHallRoom13,16South4thStreet,
WASHINGTON COUNTY COMMUNITY HEALTH SURVEY 2016
 WASHINGTON COUNTY COMMUNITY HEALTH SURVEY 2016 Commissioned by: Aurora Health Care Children s Hospital of Wisconsin Froedtert & Medical College In Partnership with: Center for Urban Population Health Washington
Behavioral Risk Factor Surveillance System (BRFSS)
") Behavioral Risk Factor Surveillance System (BRFSS) LINA BALLUZ, MPH, Sc.D. Chief Proposed Office of Surveillance, Epidemiology and Laboratory Services Behavior Surveillance Division Overview Background
Behavioral Risk Factor Surveillance System (BRFSS) LINA BALLUZ, MPH, Sc.D. Chief Proposed Office of Surveillance, Epidemiology and Laboratory Services Behavior Surveillance Division Overview Background
Colorectal Cancer Disparities: Addressing the Challenge
 Colorectal Cancer Disparities: Addressing the Challenge Inaugural Cancer Disparities Conference The Ohio State University Wexner Medical Center March 28, 2015 Durado Brooks, MD, MPH Cancer Disparities:
Colorado Health Disparities Profiles
 Health Disparities Profiles County includes: Jackson, Moffat, Rio Blanco, and Counties Population Total Population 22,382 43,638 4,861,515 21,015 39,473 3,508,736 904 3,224 909,833 140 263 228,718 210
Wellness County Profile ROGERS
 Wellness County Profile 2018 ROGERS OKLAHOMA MAPS This image cannot currently be displayed. ROGERS Insurance Coverage Population 91,766 Unemployment Rate (2013-2015) High School Dropouts: Class
Wellness County Profile STEPHENS
 Wellness County Profile 2018 STEPHENS OKLAHOMA MAPS STEPHENS Insurance Coverage Population 44,090 Unemployment Rate (2013-2015) High School Dropouts: Class of 16 Uninsured Insured 15.9% Stephens
Wellness County Profile JOHNSTON
 Wellness County Profile 2018 JOHNSTON OKLAHOMA MAPS JOHNSTON Insurance Coverage Population 11,087 Unemployment Rate (2013-2015) High School Dropouts: Class of 16 Uninsured Insured 19.1% Johnston
Wellness County Profile CRAIG
 Wellness County Profile 2018 CRAIG OKLAHOMA MAPS CRAIG Insurance Coverage Population 14,625 Unemployment Rate (2013-2015) High School Dropouts: Class of 16 Uninsured Insured 18.1% Craig 5.6
HEALTH CARE DISPARITIES. Bhuvana Ramaswamy MD MRCP The Ohio State University Comprehensive Cancer Center
 HEALTH CARE DISPARITIES Bhuvana Ramaswamy MD MRCP The Ohio State University Comprehensive Cancer Center Goals Understand the epidemiology of breast cancer Understand the broad management of breast cancer
Wellness County Profile GARFIELD
 Wellness County Profile 2018 GARFIELD OKLAHOMA MAPS GARFIELD Insurance Coverage Population 62,603 Unemployment Rate (2013-2015) High School Dropouts: Class of 16 Uninsured Insured 16.5% Garfield
Washington County Community Health Survey Report 2014
 Washington County Community Health Survey Report 2014 Commissioned by: Aurora Health Care Children s Hospital of Wisconsin Froedtert & Medical College of Wisconsin In Partnership with: Center for Urban
Wellness County Profile GARVIN
 Wellness County Profile 2018 GARVIN OKLAHOMA MAPS GARVIN Insurance Coverage Population 27,838 Unemployment Rate (2013-2015) High School Dropouts: Class of 16 Uninsured Insured 16.7% Garvin
Wellness County Profile BECKHAM
 Wellness County Profile 2018 BECKHAM OKLAHOMA MAPS BECKHAM Insurance Coverage Population 22,519 Unemployment Rate (2013-2015) High School Dropouts: Class of 16 Uninsured Insured 15.2% Beckham
Wellness County Profile SEMINOLE
 Wellness County Profile 2018 SEMINOLE OKLAHOMA MAPS SEMINOLE Insurance Coverage Population 25,207 Unemployment Rate (2013-2015) High School Dropouts: Class of 16 Uninsured Insured 18.9% Seminole
Characteristics of Philadelphia Census Tracts with High Prostate Cancer Risk
 Characteristics of Philadelphia Census Tracts with High Prostate Cancer Risk Charnita Zeigler-Johnson, PhD, MPH Thomas Jefferson University Philadelphia, PA Using Cancer Registry Data in Disparities Research
Wellness County Profile SEQUOYAH
 Wellness County Profile 2018 SEQUOYAH OKLAHOMA MAPS SEQUOYAH Insurance Coverage Population 41,294 Unemployment Rate (2013-2015) High School Dropouts: Class of 16 Uninsured Insured 18.1% Sequoyah
The Association Between Illicit Drug Use and Suicide Attempts Among Adolescents: Electronic Bullying as an Effect Modifier
 Georgia State University ScholarWorks @ Georgia State University Public Health Theses School of Public Health 5-12-2017 The Association Between Illicit Drug Use and Suicide Attempts Among Adolescents:
Wellness County Profile PAYNE
 Wellness County Profile 2018 PAYNE OKLAHOMA MAPS PAYNE Insurance Coverage Population 81,131 Unemployment Rate (2013-2015) High School Dropouts: Class of 16 Uninsured Insured 15.6% Payne 3.9
THE IMPACT OF MISSING STAGE AT DIAGNOSIS ON RESULTS OF GEOGRAPHIC RISK OF LATE- STAGE COLORECTAL CANCER
 THE IMPACT OF MISSING STAGE AT DIAGNOSIS ON RESULTS OF GEOGRAPHIC RISK OF LATE- STAGE COLORECTAL CANCER Recinda Sherman, MPH, PhD, CTR NAACCR Annual Meeting, Wed June 25, 2014 Outline 2 Background: Missing
Colorectal Cancer Screening
 Colorectal Cancer Screening Colorectal cancer is preventable. Routine screening can reduce deaths through the early diagnosis and removal of pre-cancerous polyps. Screening saves lives, but only if people
SPARTANBURG COUNTY BODY MASS INDEX (BMI) REPORT
 REPORT") SPARTANBURG COUNTY BODY MASS INDEX (BMI) REPORT 1 st, 3 rd, and 5 th GRADE STUDENTS SCHOOL YEAR 2013-2014 2 CHILDHOOD OBESITY TASK FORCE ADVISORY COMMITTEE PARTNERS 3 4 TABLE OF CONTENTS Preface.. 4 Project
SPARTANBURG COUNTY BODY MASS INDEX (BMI) REPORT 1 st, 3 rd, and 5 th GRADE STUDENTS SCHOOL YEAR 2013-2014 2 CHILDHOOD OBESITY TASK FORCE ADVISORY COMMITTEE PARTNERS 3 4 TABLE OF CONTENTS Preface.. 4 Project