A Cost-Effectiveness Study of Home-Based Stroke Rehabilitation
|
|
|
- Alannah Campbell
- 5 years ago
- Views:
Transcription
1 Western University Electronic Thesis and Dissertation Repository June 2015 A Cost-Effectiveness Study of Home-Based Stroke Rehabilitation Laura J. Allen The University of Western Ontario Supervisor Dr. Mark Speechley The University of Western Ontario Joint Supervisor Dr. Robert Teasell The University of Western Ontario Graduate Program in Epidemiology and Biostatistics A thesis submitted in partial fulfillment of the requirements for the degree in Master of Science Laura J. Allen 2015 Follow this and additional works at: Recommended Citation Allen, Laura J., "A Cost-Effectiveness Study of Home-Based Stroke Rehabilitation" (2015). Electronic Thesis and Dissertation Repository This Dissertation/Thesis is brought to you for free and open access by Scholarship@Western. It has been accepted for inclusion in Electronic Thesis and Dissertation Repository by an authorized administrator of Scholarship@Western. For more information, please contact tadam@uwo.ca.
2 A COST-EFFECTIVENESS STUDY OF HOME-BASED STROKE REHABILITATION (Thesis format: Integrated Article) by Laura Allen Graduate Program in Epidemiology & Biostatistics A thesis submitted in partial fulfillment of the requirements for the degree of Master of Science, Epidemiology & Biostatistics The School of Graduate and Postdoctoral Studies The University of Western Ontario London, Ontario, Canada Laura Allen, 2015
3 Abstract Stroke is often a severe and debilitating event that requires ongoing rehabilitation. The Community Stroke Rehabilitation Teams (CSRT) offer home-based stroke rehabilitation to individuals for whom further therapy is unavailable or inaccessible. The objective of this study was to evaluate the cost-effectiveness of the CSRT program compared with a No Therapy cohort. Data were collected on CSRT clients from January 2012 to February Comparator data were derived from a study of stroke survivors with limited access to rehabilitation. Literature derived values were used to inform a long-term projection. Using Markov modelling, we projected the model for 35 years. One-way, two-way, and Probabilistic Sensitivity Analyses were performed. Results demonstrate that the CSRT has a Net Monetary Benefit of $43,115 over No Therapy, and is both less costly and more effective. The CSRT model of care should be considered when evaluating potential stroke rehabilitation delivery methods. Keywords Stroke, Chronic, Rehabilitation, Community, Economic, Long-term, Markov model ii
4 Acknowledgments I would like to gratefully acknowledge my supervisors Dr. Mark Speechley and Dr. Robert Teasell for their support and encouragement throughout my Master s studies and thesis writing, and especially Dr. Ava John-Baptiste for her patience, dedication, and knowledge. I would also like to thank the Ontario Stroke Network for providing funding for this study, as well as Dr. Maureen Markle-Reid for generously providing her data for use in the analysis. Many thanks to the Community Stroke Rehabilitation Teams for their dedication to their clients and assistance in participant recruitment, and to Karen Heys and David Ure for their commitment to the project. I would also like to acknowledge Matthew Meyer and Marina Richardson for their work with the CSRTs and for their contributions to the study. This thesis is dedicated to my wonderful husband Jeff for his ongoing support and encouragement, and to our daughter, Leah, for being both a motivation and a much needed distraction from my thesis work. Finally, I would like to thank my wonderful parents, Luc and Denise Tetreault, for their unfailing support throughout my life. All parts of this thesis were written by Laura Allen, with assistance from Dr. M. Speechley, Dr. R. Teasell, and Dr. A. John-Baptiste. The analysis was completed under the support and guidance of Dr. A. John-Baptiste. iii
5 Table of Contents Abstract... ii Acknowledgments... iii Table of Contents... iv List of Tables... vii List of Figures... viii List of Appendices... ix Preface... x Introduction... 1 Stroke... 1 Stroke Rehabilitation Acute Stage Post-acute stage Chronic stage... 3 Stroke Care in Ontario, Canada The South West Local Health Integrated Network (LHIN)... 5 The Community Stroke Rehabilitation Teams Review of the Literature... 9 Home-Based Stroke Rehabilitation... 9 Current Evidence Supporting Home-Based Rehabilitation Evaluated Outcomes for Home-Based Rehabilitation General Conclusions on Home-Based Rehabilitation The Cost of Stroke in Canada iv
6 Economic Evaluations of Home-based Rehabilitation Gaps in the Current Evidence Objectives Hypothesis Methods Introduction to Economic Analysis Types of Economic Analysis Perspective Health Utility Measurement and QALYs The Value of Economic Modelling Challenges in Modelling Markov Models Uncertainty in models Detailed Methodology Markov Model Development Data Sources Health State Definitions Cost Inputs Transition Probabilities Utilities Cost-Utility Analysis Sensitivity Analysis Other Model Considerations v
7 Integrated Article Introduction Methods Results Discussion Chapter Discussion & Conclusions References Appendices Curriculum Vitae vi
8 List of Tables Table 4.1: Definition of health states in Markov model Table 5.1: Parameter data sources by timeframe Table 5.2: Baseline characteristics of CSRT participants Table 5.3: Results of one-way sensitivity analysis and threshold analysis Table 5.4: Results of two-way sensitivity analysis vii
9 List of Figures Figure 1.1: Possible routes of patient flow through the Ontario stroke system... 4 Figure 1.2: The South West Local Health Integrated Netork Figure 4.1: Example of a State Transition Diagram Figure 4.2: Decision tree for cost-utility analysis Figure 4.3: Markov model Figure 5.1: Decision tree and Markov model Figure 5.2: Incremental cost-effectiveness scatterplot viii
10 List of Appendices Appendix 1: Participant Flow through CSRT Economic Study Appendix 2: Breakdown of Costs for CSRT and No Therapy Cohorts (First two cycles) Appendix 3: Parameter values used in Markov model Appendix 4: Model parameters One & two-way sensitivity analysis Appendix 5: Parameter distributions in the Probabilistic Sensitivity Analysis Appendix 6: EQ-5D-5L Appendix 7: Stroke Impact Scale Appendix 8: Health and Social Services Utilization Survey Appendix 9: Western University REB approval notices ix
11 Preface The following thesis is presented in integrated article format. Although care has been taken to ensure clarity and concision, some repetition is inevitable. x
12 1 Introduction This chapter will provide a brief introduction to the topic of stroke. It will also provide a background to the efficacy of post stroke rehabilitation, the structure of stroke care in Ontario, and an introduction to the Community Stroke Rehabilitation Teams. Stroke Stroke, also known as a cerebrovascular accident or brain attack, occurs when the brain is deprived of blood supply (ischemic stroke) or when the blood-brain barrier is breached via vascular rupture (hemorrhagic stroke). 1 Stroke is a potentially severe and debilitating event that affects up to 50, 000 Canadians each year. 2 With better acute care, the number of individuals surviving a stroke is rising, with nearly 85% surviving their initial stroke, often with resulting impairments. 3 As such, stroke is the second leading cause of long-term disability in North America. 2 Stroke effects can range in severity, with resulting impairments varying from minor issues that may resolve within a short time, to severe and long lasting disabilities. The effects of stroke include physical disabilities, depression and anxiety, problems with language and communication, perceptual deficiencies, and declines in cognitive abilities, memory, and executive functioning. 1 Many of these outcomes improve substantially if the affected individual receives specialized rehabilitation. This rehabilitation may begin in the acute care setting, and often continues well into the post-acute and chronic phase. Specialized stroke rehabilitation is often an integral component of stroke recovery, and has been shown to result in improved longterm outcomes for the stroke survivor. 4
13 2 Stroke Rehabilitation The ultimate goal of stroke rehabilitation is to ensure that stroke survivors are able to reach their maximum recovery potential from physical, psychosocial and cognitive impairments in order for them to regain as much of their prior function as possible. 5 Rehabilitation often aims to improve function in activities of daily living (ADL), facilitate return to work in younger stroke survivors and those still employed, and improve physical independence, psychosocial, and cognitive wellbeing. 5 Stroke rehabilitation services often have an additional focus on the improvement of social wellbeing, emphasizing the importance of recreation and social activities in a person s overall quality of life. Both the efficacy and effectiveness of stroke rehabilitation have been examined in hundreds of studies. The Evidence Based Review of Stroke Rehabilitation (EBRSR) 4 cites over 1300 Randomized Controlled Trials (RCT) that evaluated therapies for deficits caused by stroke. Many of these studies focused on the efficacy of treatments for upper and lower limb physical rehabilitation, cognitive and language therapies, treatments for perceptual impairments, dysphagia and nutritional interventions, and the value of treatment strategies aimed at community reintegration. Thousands more observational studies exist, adding to the overwhelming evidence in favour of rehabilitation therapies following a stroke. These studies examined the effectiveness of treatments throughout the stroke recovery process, including during the post-acute and chronic stage, suggesting that rehabilitation should be an ongoing process Acute Stage Five published meta-analyses support the efficacy of specialized stroke rehabilitation services. All report a reduction in mortality for individuals treated by specialized stroke rehabilitation services compared with control groups who typically received traditional care Positive effects have been noted for reducing mortality (OR = 0.79, 95% CI ), poor functional outcomes (OR = 0.87; ), 10 combined death or dependency (OR = 0.82; ), 9 and combined death or institutional care (OR = 0.82; ). 9 One meta-analysis 8 also found an increased odds of a stroke survivor returning to their own home following discharge from a specialized stroke program (OR = 1.42; ). It has been widely demonstrated that successful stroke
14 3 rehabilitation can have an enormous influence on both the improvement in function and quality of life for not only the stroke survivor, but for family members and caregivers as well Post-acute stage Other studies have examined the impact of post-acute outpatient stroke rehabilitation. These studies are often more focused on therapies aimed at improving specific deficits. Although results have been somewhat conflicting, several studies have demonstrated effects of outpatient rehabilitation including increased independence in activities of daily living, improvement in social outcomes, 14 lower hospital readmission rates, 15 improvement in depression and anxiety symptoms, 16,17 fewer medical complications, 16 and greater functional improvement 17 compared with control groups receiving no further therapy Chronic stage Studies of recovery in the chronic phase of stroke are much fewer than the acute and post-acute stages. When evaluating outpatient rehabilitation in the chronic stage of stroke recovery (>6 months post stroke), significant improvements were noted in activities of daily living, 11,12 mobility, 18,19 and functional independence 20 compared with controls. However, in the majority of these studies, gains were no longer statistically significant between treatment and control groups at long-term follow up assessments (i.e. >6 months post baseline). Stroke Care in Ontario, Canada There are several treatment pathways a patient may take following acute stroke care. Figure 1.1 provides a visual representation of conventional patient flow through the stroke treatment system. The traditional tactic in stroke rehabilitation is immediate stroke treatment in an acute inpatient setting, often followed by transfer to a specialized inpatient stroke rehabilitation unit for individuals who would benefit from additional inpatient hospital treatment. From hospital, individuals are often discharged home when appropriate, or to Long Term Care in the case of severe impairments and lack of necessary caregiver support. Many individuals discharged home would benefit from additional outpatient hospital-based rehabilitation services. However, these
15 4 comprehensive outpatient services are often not available and, when present, tend to be available only in larger city centres and are, therefore, inaccessible to many. These individuals are often left with no further rehabilitation services. Acute Stroke Care Outpatient Rehabilitation Home-Based Rehabilitation Inpatient Rehabilitation LTC No Service Home-Based Rehabilitation Outpatient Rehabilitation LTC No Service Figure 1.1: Possible routes of patient flow through the Ontario stroke system Stroke rehabilitation services traditionally consist of multidisciplinary teams who provide comprehensive support to their patients. These teams are often made up of the following specialized services: - Physiotherapy: facilitate the improvement of mobility and physical activity 21 - Occupational therapy: identification, engagement, and improved function in activities of daily living 22 - Speech-language therapy: the treatment of language, speech, voice and communication disorders 23 - Therapeutic Recreational therapy: the incorporation of recreation and leisure as essential components to improved quality of life 24 - Registered Nurse: provision of basic medical support and health education Although these rehabilitation services are currently available to most individuals at the inpatient level, and many stroke survivors go on to attend outpatient rehabilitation clinics, there are many
16 5 who have no services available to them or are unable to access these services. In-home, community-based rehabilitation aims to fill this extensive and concerning gap. Current Canadian stroke rehabilitation guidelines exist to ensure that stroke survivors receive the best evidence based stroke rehabilitation care possible. The Canadian Best Practice Recommendations for Stroke Care are widely practiced and encompass guidelines specific to acute, inpatient, outpatient, and community-based rehabilitation. 25 The guidelines are updated periodically with recommendations supported by the literature and past studies of high methodological quality. They embrace rehabilitation as a multidimensional approach, incorporating medical, social, emotional, and vocational resources to optimize recovery. 26 It has been postulated that consistent access to this organized, multifaceted approach to stroke rehabilitation could save the Canadian health care system $8 billion over the next 20 years through both stroke prevention and reduction in disability. 27 The Canadian Best Practice Guidelines for Stroke Care (2013), Outpatient and Community- Based Rehabilitation, state that individuals with ongoing needs should continue to have access to specialized stroke services after leaving hospital and that [o]utpatient and/or communitybased rehabilitation services should be available and provided by a specialized interprofessional team, when needed by patients [ ]. 25 The guidelines further state that this rehabilitation should be provided in the most appropriate setting, including the person s own home The South West Local Health Integrated Network (LHIN) The South West LHIN, located in the province of Ontario, Canada, covers a large geographic area of approximately 21,639 square kilometers and encompasses Middlesex, Oxford, Eglin, Huron, Perth, Grey, Bruce, and a portion of Norfolk counties (Figure 1.2). It is home to nearly 1 million residents, including a large rural population. Over 23% of individuals living in this LHIN who experienced a stroke in 2013 are considered to be rural residents. 29 Stroke services in the South West LHIN are currently centered in 2 dedicated acute stroke hospitals. Hospital-based outpatient rehabilitation services are currently available at 14 sites. Despite this, over 35% of stroke patients, including 40% of acute patients, are discharged home with no further rehabilitation services. This rate may be as high as >50% in more rural areas. 30 Research has shown that less than 10% of stroke patients will make a full recovery, with the

17 6 remaining requiring ongoing rehabilitation. 2 Furthermore, 25% of stroke sufferers are left with minor disability, and 40% with major disability, requiring therapy. 2 This demonstrates a large service gap in access to rehabilitation services in individuals who would benefit from further rehab. 29 Figure 1.2: The South West Local Health Integrated Netork 31 The Community Stroke Rehabilitation Teams The Community Stroke Rehabilitation Teams (CSRT) were founded in 2009 and service the eight counties of the South West LHIN. These teams receive annual funding provided by the South West LHIN. They aim to provide Canadian Best Practice Recommendations for Stroke Rehabilitation 25 to adult stroke survivors living in their homes, and who are otherwise unable to
18 7 access traditional outpatient rehabilitation services due to mobility, transportation, or geographical limitations. Due to the large geographic area of the Southwest LHIN, the CSRT program comprises three individual teams centred in three cities across the LHIN. The Thames Valley team is located in London and serves Middlesex, Elgin, Norfolk, and Oxford counties; the Huron Perth team is located in Seaforth and provides therapy to clients in Huron and Perth counties, and the third team is centred in Owen Sound and serves Grey and Bruce counties. The CSRTs deliver an interdisciplinary approach to stroke rehabilitation by providing service individualized to each client. This may involve physical rehabilitation, social and emotional support, education, system navigation, and caregiver support. 32 Provision of these services may involve the support of a registered nurse, social worker, occupational therapist, physiotherapist, speech-language pathologist, therapeutic recreation therapist, or rehabilitation therapist. These therapists work together to provide a comprehensive program of rehabilitation to each individual, and provide this therapy directly in a person s home and around their community. It has been suggested that comprehensive and intensive rehabilitation is more effective than less intense programs of therapy. 5 The CSRTs are able to provide relatively intense rehabilitation, with type and frequency of visits individualized to each client, in a home setting. Although there is currently a lack of published data on the cost of this particular program relative to hospital-based outpatient services, or no rehabilitation service, anecdotal evidence from the CSRTs indicates that clients served by the CSRTs may access fewer health care resources over time. These include readmission to hospital, emergency room visits, general physician visits, and other social services. There may also be decreased costs to the patient as a result of fewer travel costs, private therapies accessed, and loss of employment wages, particularly accrued by family members who often must provide transportation to the outpatient facility. It is hypothesized that the upfront cost of the CSRTs to the health care system is greatly offset over time by cost savings in these other areas. Based on the lack of published evidence pertaining to the economic value of the CSRTs, the current study aimed to assess the cost-effectiveness of this particular program. The next sections
19 8 provide an evaluation of the existing literature on specialized stroke rehabilitation, in particular home-based stroke rehabilitation.
20 9 2 Review of the Literature Home-based stroke rehabilitation programs have been the subject of a number of studies around the world. This chapter provides a review of the evidence pertaining to the effectiveness of home-based rehabilitation. For the purposes of this review, studies of Early Supported Discharge (ESD) programs have generally not been included as ESD is not the mandate of the Community Stroke Rehabilitation Teams. Clients served by the CSRTs come from a range of referral sources, while Early Supported Discharge programs often act exclusively as a substitute for inpatient rehabilitation, treating patients in the acute phase of their stroke. The economic burden of stroke in Canada, and current evidence surrounding the cost-effectiveness of home-based rehabilitation, also will be reviewed. Home-Based Stroke Rehabilitation In the majority of health care systems, stroke care is initially offered in the inpatient hospital setting. Many individuals, upon discharge, are able to receive ongoing rehabilitation in the hospital-based outpatient setting. However, these outpatient services are not available to all stroke survivors with ongoing needs. In recent years, the idea of home-based rehabilitation has begun to garner support as a practical option for delivery of specialized stroke therapy services following discharge from hospital. This type of service is often directed at individuals who have ongoing rehabilitation needs and for whom traditional hospital-based outpatient rehabilitation services are not available, not accessible (i.e. transportation barriers), or simply as an alternative to traditional facility-based outpatient services. Home-based stroke rehabilitation teams, as the name suggests, provide services directly in a person s home and, in some cases, in their community. These teams most often limit their therapy setting to a person s household environment, however, some of these teams may also offer opportunities to go into the community for therapy sessions. This may include navigating the
21 10 grocery store with their therapist, practicing communication skills in the local coffee shop, or climbing and descending the stairs of the local post office. These home-based programs often structure their highly individualized therapies around a person s specific goals, and focus on improving activities of daily living to optimize function. This approach may be quite effective as a person s home is often the most appropriate and effective setting for this recovery to take place. In this way, stroke patients are better able to cope with, and overcome, barriers specific to their home and community environments. This clientcentred approach to stroke rehabilitation can be effective and is often valued highly by the stroke survivor. Home-based stroke rehabilitation programs differ greatly in their professional make up, client inclusion criteria, and organization of services. They may also vary in the intensity of therapies and length of services offered. Although it is well recognized that home-based stroke teams vary widely in professional makeup, studies examining the effectiveness of these teams do not often describe this in great detail. These teams most often consist of some combination of team coordinator, physiotherapist, occupational therapist, speech-language pathologist, social worker, nurse, and recreational therapist. In the majority of cases, however, teams consist of a physiotherapist and occupational therapist as their core component. In a systematic review by Winkel et al., 33 all eight of the included studies involved these two disciplines as a part of their multidisciplinary team structure. 33 Five of the examined studies also included a registered nurse as a part of their offered services, and a speechlanguage therapist was included in four teams. In two studies, social workers were permanent members of the rehabilitation team, but were included only on a consultation basis in several other programs. A number of studies also included the direct involvement of a physician. Upon further examination of the literature on in-home stroke rehabilitation teams, additional health care professionals such as psychologists, 34 dieticians, 34 therapy aides, and physical medicine physicians 34 also have been included as members of these interdisciplinary teams. Additionally, some in-home rehabilitation teams are offered in combination with personal support worker and other home care services, further influencing their functionality and impact. 26
22 11 The majority of home-based stroke rehabilitation programs described in the literature have wide eligibility criteria. Most programs offer therapy to any adult stroke survivor who has rehabilitation needs as a result of their stroke and is able to participate in therapy. 26,34-38 Other programs limit services to only those with acute stroke. 39,40 Some home-based stroke programs may offer services in the form of Early Supported Discharge (ESD) from hospital, which allows patients to return to their own homes with support days and even weeks sooner than may otherwise would have occurred in the absences of such a program. 33,40-42 The intensity of therapy provided to clients served by home-based stroke rehabilitation teams may also varies widely. In many cases, the amount and duration of therapy provided is highly individualized to each client. 26,37,40-42 Other structures consist of a predetermined maximum of anywhere from two 38 to five 34 sessions per week, and include a maximum duration of services. Programs may also incorporate a period of self-management in which stroke survivors are able to practice the skills they have acquired during the period of rehabilitation. 38 Current Evidence Supporting Home-Based Rehabilitation Although in-home rehabilitation provides a unique opportunity for recovery in the most useful and practical environment, evidence of the effectiveness of home-based stroke rehabilitation programs is still incomplete. Many of the currently available Randomized Controlled Trials and observational studies compare this type of care to hospital-based outpatient rehabilitation, with the majority of studies conducted in the United Kingdom, Australia, and Scandinavia. Furthermore, the majority of this literature compares this type of program with an Early Supported Discharge (ESD) approach to inpatient rehabilitation. Both inpatient rehabilitation and traditional outpatient services are efficacious in improving patient outcomes post stroke. 4 Many of the studies comparing home-based vs. hospital-based rehabilitation test the null hypothesis that one treatment approach is non inferior to the other. In other words, they aim to demonstrate that home-based rehabilitation is as effective as traditional outpatient-based services. It has been widely demonstrated that outpatient therapies are effective at improving a wide range of patient outcomes post stroke. 4 A significant difference between the treatment groups, although
23 12 important to consider, should be interpreted with caution as clinically meaningful differences specific to each outcome measured may differ from statistical significance. Likewise, clinically meaningful changes may be observed in one treatment group and not another without being statistically different Evaluated Outcomes for Home-Based Rehabilitation Functional Outcomes The majority of studies of the efficacy of in-home rehabilitation post stroke have looked at areas of disability, physical function, and improvement in activities of daily living (ADL) as primary outcomes. ADLs include basic activities such as grooming, toileting, and other forms of selfcare, household and other day-to-day tasks, as well as leisure activities. These outcomes are important measures of the disability level of an individual. A number of outcome measures are used to quantify disability following a stroke. The most commonly used internationally are the Barthel Index (BI), the modified Rankin Scale (mrs), and the Functional Independence Measure (FIM), although many more exist. 44 These measures have been the subjects of numerous validation studies, and cut-off scores for various disability levels are well established Increasingly, the Stroke Impact Scale (SIS) 50 is being used as a measure of function following stroke, particularly in North America. The short form of this measure, the SIS-16, is used to create a physical dimension score. This measure has been validated in comparison to both the mrs and the Barthel Index and has been shown to be able to distinguish among disability levels of both measures. 51,52 A person s level of disability in the months following stroke has been shown to have an impact on their continued recovery, independence in daily activities, and overall health related quality of life Disability and Activities of Daily Living Significant improvements in ADLs in home-based intervention groups have been observed in the majority of studies examining this outcome; however, in most cases the intervention group was compared with a control group receiving outpatient rehabilitation and researchers were not able to observe differences between the two cohorts ,39,40,57 In one study, although there were no significant differences between study groups, an earlier improvement was noted in the home intervention group. 58 Some studies have been able to demonstrate a significant improvement in
24 13 favour of home-based treatment groups when compared with hospital-based controls. Studies by both Gladman et al. 59 and Chaiyawat and Kulkantrakorn 17 showed greater improvement in independence in activities of daily living (Barthel Index, p<0.05 at six month follow up; Barthel Index, p=0.03 at two years). 17,59 In a one group, pre-post study design by Sirbu et al., 38 study investigators were also able to observe significant improvement in activities of daily living (Barthel Index, p=0.02). 38 There is a consensus that in-home rehabilitation is successful in increasing independence in activities of daily living. Motor Skills Improvement in motor function is also commonly assessed in the context of in-home rehabilitation. As is the case with improvements in ADLs, in-home rehabilitation programs are able to demonstrate significant improvements over time. However, when between group comparisons are examined, no superiority of home-based rehabilitation was observed over hospital-based therapy. This was the case in studies of manual dexterity, 39,40 assessments of motor processing skill, 34 motor impairment as measured by the Motricity Index and the Motor Assessment Scale, 35,39 and upper extremity motor control and dexterity on the Frenchay Arm Test. 39 Bjorkdahl et al. 58 were also not able to observe a between-group difference in motor function improvement, although an earlier improvement was noted in the in-home rehabilitation intervention group. 58 Conversely, in a one group pre-post-test, Sirbu 38 was not able to observe any significant improvement in motor functioning on the Motricity Index between time points. 38 Once again, motor function appears to improve in individuals receiving in-home therapy services post stroke. Mobility Along with motor function and independence in ADLs, mobility is typically assessed as a measure of overall physical functioning in the stroke patient. Once again, home-based therapy has repeatedly been demonstrated to show significant improvements in mobility, although it has not been shown to be superior to control participants receiving hospital-based services in measures of: walking capacity, 40 a timed test of standing to walking, 34 the 30 minute walk test, 58 tests of 10 minute walking speed, 39 and overall mobility. 57 A group of researchers using a one
25 14 group pretest-post-test design demonstrated a significant improvement in mobility on the Berg Balance Scale (p=0.05). 38 Overall Functional Recovery Overall function is also often assessed when examining the effectiveness of in-home rehabilitation. Although significant improvements are typically observed in overall health, daily activities, mobility, and social functioning, they have not been observed to be superior to improvements seen in individuals accessing traditional outpatient or community services. This has been observed in results from the Functional Independence Measure, 57 Nottingham Health Profile, 59 and National Institute of Health Stroke Scale. 58 Furthermore, when compared with individuals receiving limited community rehabilitation services, a recent Canadian study by Markle-Reid et al. 26 was not able to observe any superiority of the home-based intervention program on this particular outcome. Additionally, two studies have shown dominance of hospitalbased rehabilitation on improvements in overall measures of function as was observed in a study of young stroke survivors by Bjorkdahl et al. 58 Superiority of hospital over home-based rehabilitation in functional improvement was also observed by Crotty et al., 34 although authors acknowledge a substantial risk of bias with this result. 34 Finally, authors of two studies have compared in-home rehabilitation treatment groups with controls in the area of overall activity level. Ljungberg et al. 57 observed significant improvements in activity level, information level, and participation in the planning of program activities (all p<0.05) in home-based treatment groups. 57 Conversely, Anderson et al. 42 were not able to observe such an effect when examining the impact of in-home rehabilitation on activity level in the context of early supported discharge. 42 Overall, in-home rehabilitation has been widely demonstrated to be effective at improving physical outcomes of stroke patients including improving independence in activities of daily living, motor function, and mobility. There is conflicting evidence that home-based rehabilitation is able to improve an individual s overall function when compared with a hospital-based outpatient population.
26 Psychosocial Well-being The psychosocial wellbeing of stroke survivors is also often examined in studies assessing inhome rehabilitation programs. These studies typically look at the presence and severity of anxiety and depressive symptoms, but may also examine patient satisfaction, coping skills, and return to normal social functioning. In the majority of studies, as with physical and functional outcomes, improvement in the psychosocial domain was not found to have improved to a greater degree in a sample receiving in-home rehabilitation when compared with outpatient therapy services. However, in most cases, statistically significant improvements were observed in both groups on measures such as the Hospital Anxiety and Depression Scale, 35,36,39 and the Geriatric Depression Scale. 34 One study looking at in-home rehabilitation compared with a control group receiving limited services was not able to detect any difference in depression and anxiety symptoms. 26 Conversely, Chaiyawat and Kulkantrakorn 17 was the only study to detect a significant improvement in a treatment group compared with a control group who had limited access to poststroke rehabilitation services (p<0.01). 17 This suggests that home-based therapy is not inferior to hospital-based treatment in improving symptoms of depression and anxiety in stroke survivors, and may be superior to a no therapy alternative. An improvement in coping skills was examined in one study 40 in the context of Early Supported Discharge and was found not to be significantly better in the treatment group versus controls discharged early from inpatient rehabilitation. Reintegration to normal living was also examined by one group. There were no significant improvement in treatment subjects compared with controls who did not receive rehabilitation. 26 In an RCT by Lincoln et al., 37 participants receiving services from a community stroke rehabilitation program were significantly more satisfied with the emotional support they received from the team compared with controls receiving services outside the home setting as measured by a study assessment measuring emotional satisfaction with services (p=0.02). Similar results have been noted in a number of other studies. 41,60
27 Caregiver Burden Many home-based rehabilitation programs also provide support to family members and friends of stroke survivors, aiming to improve caregiver outcomes following stroke. These most often focus on psychosocial wellbeing, as well as overall health status. In an RCT by Lincoln et al., 37 caregivers of persons who suffered a stroke who received services from home-based rehabilitation programs reported considerably less burden (p<0.04), and reported more knowledge of stroke (p=0.03) than the hospital outpatient-based control group. Furthermore, these caregivers showed greater improvement on the Caregiver Strain Index (p=0.03) and reported a greater overall satisfaction with services (p=0.01). Although Lincoln et al. 37 were able to demonstrate less caregiver strain in treatment groups at a six month follow up, a study by Crotty et al. 34 did not show a similar effect. However, a significant result was observed in this study upon hospital discharge (p=0.047). Several other investigators have not been able to show any improvement in treatment groups over controls when examining caregiver outcomes. 34,35,37,39,42 Converse to outcomes of physical and psychosocial recovery in stroke patients, studies that examine improvements in caregiver outcomes have been able to show more benefit in favour of home-based treatment groups when compared with standard rehabilitation controls General Morbidity and Mortality A number of common outcome measures exist that assess overall general physical and cognitive wellbeing. Furthermore, general health outcomes may also be used to assess overall health status. As previously observed with other outcome domains, significant improvements in overall health status are generally are not observed when comparing home-based rehabilitation services with standard outpatient care or early supported discharge. However, in the majority of cases both intervention and control groups show significant improvement over time on measures such as the General Health Questionnaire, 37 EuroQol, 36,37 and the Short Form Health Survey (SF-36). 34,42 Markle-Reid et al., 26 whose study compared in-home rehabilitation with limited post stroke therapy services, was able to demonstrated an improvement in the treatment group on five out of eight subscales on the SF Although none of these comparisons reached statistical significance, both the physical and social subscales improved by a clinically meaningful amount.
28 17 Improvements in cognitive functioning are also often assessed. As before, very few studies have demonstrated any superiority of home-based rehabilitation when compared with traditional rehabilitation services, although statistically significant improvements in these outcomes are observed in both groups, particularly on the Mini Mental State Examination. 34,35,40,42 One study was not able to find superiority of at home rehabilitation in improving cognitive outcomes when compared to a no or limited therapy group. 17 Furthermore, one study found no improvement in cognition in either the intervention or the control group on the Barrow Neurological Institute Screen for Higher Cerebral Functions. 58 Conversely, a Randomized Controlled Trial by Ljungberg et al. 57 did show significant improvement in several cognitive domains when compared to a control group. Between admission and study end, significant improvements were observed in expression (p<0.01) and problem solving (p<0.05). Furthermore, between admission and 4 week follow up, significant improvements were seen in comprehension (p<0.05), problem solving (p<0.01), and memory (p<0.05) domains on tests of neurological status and cognitive functioning. 57 Rates of death, institutionalization, hospital readmissions, and recurrent stroke have also been reported by few studies. One study comparing home and hospital rehabilitation did not detect any significant difference between the two groups on death rates and rates of institutionalization. 59 Furthermore, when compared with no or limited therapy, investigators did not detect any significant difference in the rates of recurrent strokes or hospital readmissions in their study participants Other Benefits A number of additional benefits of community and in-home stroke rehabilitation have been cited throughout the literature. These include, but are not limited to, providing a means of early supported discharge from inpatient hospital care, and greater patient and caregiver satisfaction with the program. The potential for Early Supported Discharge (ESD), although not discussed in this review, may also lead to cost savings through shorter hospital stays, as well as an early return to independence and a higher rate of well-adjusted living as measured by the Return to Normal Living Index. 61 Both Anderson et al. 42 and Widen Holmqvist et al. 40 compared home-based rehabilitation with routine, inpatient hospital-based therapy. Both studies observed a significant reduction in the
29 18 length of hospital stay in individuals discharged to in-home rehabilitation (Holmqvist et al.: 14 vs. 29 days, p=0.0008). 40,42 It has also been reported that home-based rehabilitation can result in increased satisfaction in services for both patients and caregivers. A study conducted in Sweden by Von Koch, Wohlin- Wotricht, and Widen-Holmqvist 41 found that home-based therapy enabled patients and family to be involved in the planning process, and allowed for greater opportunity to set relevant and achievable rehabilitation goals through a greater understanding of the needs and context of the programs clients. This resulted in greater client and caregiver satisfaction. Ljungberg et al. 57 cited that further benefits include a person s opportunity to make their own choices, which may further lead to the potential to be more active and motivated Meta-Analysis Meta-analysis of outcomes related to in-home rehabilitation is a challenge due to heterogeneity between programs, therapy intensities, structures, services provided, and outcomes examined. In a meta-analysis of Randomized Controlled Trials comparing home-based and centre-based stroke rehabilitation facilities, home-based services were associated with greater client satisfaction, reduced caregiver strain, lower readmission rates, and increased function and ADLs in a broad summary of results. 33 Pooled analysis of functional outcome as measured by the Barthel Index also demonstrated a significant increase in functional independence compared with control groups by 6-8 weeks post intervention (p=0.03). Analysis of six month follow up scores also revealed significant improvements compared with controls on this measure (p=0.04). This review noted that home-based rehabilitation may be superior from a patient outcome perspective, in part because individuals have the opportunity to immediately transfer skills they have learned in their own living environment General Conclusions on Home-Based Rehabilitation A number of published studies have examined patient outcomes following home-based stroke rehabilitation. Although these studies vary in program structure, process, and outcomes assessed, they generally concur on the ability of home-based, specialized, interdisciplinary, stroke rehabilitation services to produce significantly positive outcomes in stroke patients similar to those seen in traditional hospital-based, outpatient programs. Although the majority of these
30 19 studies did not demonstrate superior improvements when compared to traditional services, the preponderance of analyses demonstrated significant improvements in level of disability, psychosocial well-being, caregiver outcomes, general health and well-being, and a variety of other positive benefits in study groups who received home-based rehabilitation compared to baseline. This supports the evidence base for the efficacy of home-based stroke rehabilitation. However, evaluations of ongoing programs are warranted to further validate the efficacy of this treatment approach. The Cost of Stroke in Canada The costs of stroke to the Canadian economy are enormous. An estimated $3.6 billion is incurred each year due to both the direct and indirect costs of stroke. 63 Although the majority of costs are related to acute and inpatient care, a substantial amount is attributed to post-acute rehabilitation, stroke prevention, and physician visits for both primary stroke follow up and attributed medical comorbidities such as depression, urinary tract infections, and pain. 64 A recent systematic review found an estimated % of individuals will be readmitted to hospital following post-acute care for all cause morbidity, and an additional 20% of stroke survivors will experience a recurrent stroke, 1 resulting in considerable added cost to the health care system. An estimated 80% of costs during the first six months following stroke are direct costs to the health system. 63 A recent Canadian study, The Economic BURden of Ischemic STroke Study (BURST), 65 examined the cost of ischemic stroke in Canada over a one year period. This study demonstrated that the average per person cost of a stroke in Canada over a one year period is approximately $75,000, with disabling stroke being almost twice the cost of nondisabling strokes. Furthermore, during the acute phase of recovery, nearly half (46.8%) of these costs are attributed to hospital admission with rehabilitation costs constituting a large portion (34%). Post discharge from hospital, indirect costs, such as lost productivity and out of pocket expenses, become the highest contributor (58.3% at 4-6 months, and 42.3% at 7-12 months post stroke). This high cost of stroke is an enormous burden to both the health care system and the stroke survivor during this one year period.
31 20 Recently, it has been postulated that optimization of stroke care systems in Canada throughout the stroke care continuum could dramatically impact stroke costs related to stroke, reducing the yearly economic burden of stroke by as much as $682 million annually, including $307.4 million in direct and $374.3 million in indirect costs. 66 This may be accomplished through the implementation of evidence based stroke care in the acute phase, through organized stroke units, and through home supported discharge. Furthermore, the estimated Quality Adjusted Life Years (QALY) lost annually to stroke could be decreased by as much QALYs. 66 Post stroke disability level also has a considerable impact on post stroke costs. This has been demonstrated by the BURST study 65 in a Canadian context as discussed above. Dawson et al. 67 also demonstrated an incremental increase in health care utilization costs with increased disability level as measured by the modified Rankin Scale. This impact of disability level on stroke costs has been demonstrated in a number of international studies, and is largely due to the increased use of care services, institutionalization, and hospital admissions by individuals experiencing more disability In addition to costs to the health care system, stroke patients and their families experience a negative economic impact. This may largely be due to loss of productivity in the form of lost wages for both the stroke survivors and their caregivers, at least during the period of acute recovery, and an estimated 27-81% of individuals are unable to return to work at all. 72 Travel costs for doctor visits and outpatient rehabilitation may also accumulate to a large degree. Furthermore, stroke patients may seek the services of private therapists, accruing personal costs for these services. The majority of these indirect costs are incurred during the post-acute phase, following discharge from inpatient stroke care. 63 Post-acute rehabilitation is vital to reduce the adverse effects of the stroke, improve quality of life, decrease the need for activity of daily living supports, support return to work, reduce the severity and number of stroke co-morbidities, and decrease the risk of recurrent stroke. 5 In effect, the reduction of these adverse consequences of stroke will help alleviate some of the burden of costs of stroke to both the health care system and to stroke survivors and their families.
32 21 Economic Evaluations of Home-based Rehabilitation Few economic reviews have examined the costs of home-based programs in the post-acute stage. The majority of these studies examined the costs of these programs in the context of an early supported discharge program. Far fewer looked at cost differences in comparison to hospitalbased outpatient programs. Most studies have found that home-based services are no more costly than outpatient hospitalbased programs, and in some cases are more cost-effective. Roderick et al. 73 looked at both health and social service costs accrued by participants during the study period and found that there were no statistically significant differences between those accessing in-home rehabilitation and individuals in an outpatient program. While similar overall health service costs were observed in the two groups, slightly higher social service costs were noted in the home-based group. Similar cost outcomes were also noted by Gladman et al., 74 with slightly lower health service costs observed in the hospital-based cohort. Bjorkdahl et al. 58 also examined the costs of home-based rehabilitation as an alternative to an outpatient hospital program. This study solely examined the costs of the two programs themselves, and did not include any additional health care costs. The authors found that the program cost of home rehabilitation was less than half (42%) of hospital based rehabilitation. Anderson et al. 42 conducted a systematic review of the economic impact of home-based rehabilitation programs, including those with an early supported discharge component, and found that, overall, home-based rehabilitation reduced hospital stays by 13 days (95% CI: -19 to -7 days). Furthermore, overall mean costs for community stroke rehabilitation care in combination with early discharge from hospital resulted in an overall mean cost reduction of 15% without compromising patient outcomes. 42 Recently, a Randomized Controlled Trial 26 was conducted in Ontario, Canada examining homebased stroke rehabilitation provided by the Community Care Access Centre (CCAC), an agency that coordinates home care services for individuals with activity of daily living difficulties. 75 This program has sometimes been called Enhanced CCAC and offers an interdisciplinary approach to in-home stroke rehabilitation. In this study, individuals were randomized to receive either the Enhanced or the traditional level of CCAC services, with minimal access to additional stroke services. Authors aimed to answer the question of whether this 12 month specialized stroke rehabilitation program improved quality of life and functioning, in addition to evaluating costs.
33 22 Assessments were completed at baseline and 12 month follow-up. Cost analysis of the program revealed a slightly although not significantly higher per person cost in the use of health services for the intervention group as measured by the Health and Social Services Utilization Survey. It was concluded that this program is a feasible approach to traditional outpatient services. It was noted, however, that a small sample size (N=101), may have resulted in an unrepresentative sample. Furthermore, a greater length of follow-up time may be important to detect differences in the cost of health resource utilization over the long-term. This Ontario based study is an excellent example of the cost-effectiveness of home-based stroke rehabilitation in the Canadian context. 26 In general, there is substantial heterogeneity of results when examining the effectiveness of home-based stroke rehabilitation programs in terms of patient outcomes in relation to cost savings. 76 This is likely due to the fact that the majority of studies examining home-based rehabilitation for stroke patients differ on aspects of the programs themselves, structure of the interdisciplinary teams, as well as the differences in health care system structures between countries around the world. Furthermore, studies generally have small sample sizes and limited follow up. This may also have implications for extrapolating the effectiveness of results and the cost implications to the Canadian context. Gaps in the Current Evidence Although there are a number of studies that support the effectiveness of home-based rehabilitation programs, few were able to demonstrate a great deal of added benefit when compared with traditional hospital-based rehabilitation services. This suggests that in-home rehabilitation is comparable to outpatient rehabilitation in its effectiveness; however, it does not provide a definitive indication of whether this approach is superior to no therapy. Given that home-based rehabilitation has been found to be likely non-inferior to hospital-based outpatient services, and hospital-based programs have been demonstrated to be effective at improving patient outcomes, it can be inferred that home-based programs are of benefit. For the large number of individuals who are discharged from inpatient stroke care with no further services, access to a home-based program may be of particular value and should be the subject of further study in this context.
34 23 This same problem is encountered when considering economic evaluations of such programs. No studies have been published evaluating the cost-effectiveness of a home-based stroke rehabilitation program in comparison to a cohort of individuals who are not able to access any further rehabilitation services. This is an important consideration as it is imperative from a policy and funding standpoint that such a program is, in fact, worth the resource contribution. Furthermore, no studies have been conducted examining the projection of long-term costs and benefits of such a program in any context. Studies in the current literature are also difficult to compare. Interdisciplinary team structures, length and intensity of services, and approaches implemented vary widely. Furthermore, characteristics of comparison groups in Randomized Controlled Trials vary just as widely, adding an additional challenge. Cost analyses that have been completed are also very heterogeneous, varying drastically across geographic and health care settings, and are often based on small sample sizes and diverse stroke populations. This makes it very difficult to extrapolate results of these studies to existing programs. This emphasizes the importance of evaluations of individual programs in terms of both program costs and outcomes, to assess the overall efficacy and costeffectiveness of specific program approaches.
35 24 3 Objectives The Community Stroke Rehabilitation Teams represent a unique model of care. Rehabilitation programs similar to the CSRT have yet to be fully evaluated in an economic context. In particular, comparisons to a cohort receiving No Therapy are limited. Comparison to a No Therapy population is relevant in the CSRT context as, for the majority of CSRT clients, alternate rehabilitation services are not available. Additionally, there are no long-term projections of cost-effectiveness of a home-based stroke rehabilitation program in any context. As such, the objectives of this analysis are: 1. To determine the long-term costs and consequences of a home-based stroke rehabilitation program, Ontario s Community Stroke Rehabilitation Teams. 2. To determine the long-term cost-effectiveness of the Community Stroke Rehabilitation Teams compared to a cohort receiving no further rehabilitation therapy. Hypothesis We hypothesize that a long-term projection of the costs and consequences of the CSRT model of care will reveal it to be cost-effective when compared with No Further therapy.
36 25 4 Methods The purpose of this chapter is to provide a brief background to the terms used and the rationale underlying economic evaluations of health care programs, devices, drugs and other interventions. This chapter will also provide a detailed methodology of the approaches taken to develop the economic model used in this analysis Introduction to Economic Analysis Economic evaluations are an important aspect of most decisions in health care. Drummond et al. define economic evaluation as the comparative analysis of alternate courses of action in terms of both their costs and consequences. 77(p.9) Modelling in economic evaluations is valuable to inform decision making processes, guide clinical practice, and optimize the use of health care resources Types of Economic Analysis There are four main types of economic evaluations: cost-minimization, cost-benefit, costeffectiveness, and cost-utility. While all four approaches can aid decision making and be invaluable to policy makers and decision support personnel, they differ in terms of their applications. Cost-minimization analyses simply look at the costs of a program, irrespective of any benefit or outcome it may produce. In cost-minimization analyses the underlying assumption is that there is no difference in health outcomes between the two comparators and thus only the cost difference is relevant. Cost-effectiveness analysis and cost-utility analysis differ from the cost-minimization analysis in that both costs and outcomes are compared between programs. In a cost-effectiveness analysis, outcomes are the same between programs, allowing for direct comparison, and outcomes are measured in natural units such as life years saved, blood pressure reductions, and hospital admissions. In a cost-utility analysis, outcomes incorporate a measure of utility, in order to calculate a Quality Adjusted Life Year (QALY) (See section 4.1.3). This enables direct
37 26 comparison of outcomes using a comprehensive summary measure that reflects both the length and quality of life. When conducting an economic evaluation, one must consider what information is available to determine the most appropriate form of analysis. 77 Finally, a costbenefit analysis incorporates the benefit gained from a program into the results of the analysis by using a monetary value of benefit. In cost-benefit analyses, willingness to pay for health outcomes signifies the value of the outcome Perspective Perspective is also an important consideration in cost analyses, as the perspective taken must aim to answer the research question of the evaluation. 78 Most economic evaluations take the perspective of the payer or funding body (payer perspective). In other cases, a wider perspective may be examined looking at the cost to society as a whole (societal perspective), which includes the costs to clients or patients. Each analysis may consider different sources of cost and potential benefits of a program in accordance with the specific objectives of each research question. 79 Direct costs refer to resources consumed by the program in the health sector. These are often costs to the health care system, or to the funding source. This term may also refer to expenses paid out of pocket by a patient such as travel and parking, assistive devices, and additional treatments required that are not covered by their health insurance. Patient costs are often separated into a separate category known as patient out of pocket costs. Indirect costs are those that do not typically have a direct monetary value, such as time gained or, conversely, lost from work. 77 Similarly, outcomes of interest of a particular program or treatment often depend on the target audience of the analysis. Direct patient consequences such as impact on function and quality of life may be of interest to society as a whole and to the individuals affected by the treatment. Conversely, outcomes related to the impacts of a program on a health system, such as the number of days spent in hospital or number of diagnostic tests performed, may be of more interest to a funding body and decision or policy makers Health Utility Measurement and QALYs Outcomes and effects of a particular treatment are important aspects of the evaluation of the impact of a program or intervention. The effectiveness of a program can be measured in several
38 27 ways: program specific outcome measures, generic outcome measures, and preference based measures. Preference based measures often use either standard gamble or time trade off methods to determine how much individuals would be willing to sacrifice to avoid a particular state of health, or how one type of outcome compares to another. 80 This results in a utility value anchored between 0 and 1.0, with 1.0 representing perfect health, and 0 typically representing death. 77 These measures are of particular value when conducting economic evaluations, as they can often be converted to a measure of quality of life in the form of a Quality Adjusted Life Year (QALY). 81 QALYs are calculated by multiplying the utility of a particular health state by the length of time spent in that health state. This is a widely used method that is clearly understood, easy to use and interpret, and has good face validity. 81 QALYs are also a useful tool as they consider both gains from reduced morbidity, as well as increased mortality. 77 Furthermore, the generation of a QALY allows for a more direct comparison of treatments for different health conditions that may also have different natural outcomes because it provides a comprehensive measure of benefit The Value of Economic Modelling Because it is usually not financially or logistically feasible to conduct long-term studies lasting decades, in the majority of cases it is necessary to construct a mathematical model to extrapolate the long-term costs and benefits of a program. This is especially the case with costly Randomized Controlled Trials. Modelling is a valuable approach to using information gained from short-term studies in the context of what is understood about the natural history of a disease. To do this, a common practice is to gather additional information from literature-based sources (observational and longitudinal studies), databases and registries, expert opinion, and from reasonable assumptions made by the authors of the study. 81 Furthermore, many observational studies do not include a control population and, as such, one must be constructed using literature based estimates. It is, however, important to consider the model objective, source quality, and relevance of the included information when incorporating it into the model. Furthermore, it is imperative to be transparent regarding all assumptions, and the methods of handling and transforming the incorporated data for use in the model should be described in detail. 81
39 Challenges in Modelling When identifying sources to be used to inform a model, it is rare to find information on the exact population of interest or study results provided in the most appropriate format. As such, one must aim to incorporate the most suitable sources, and transform any information into a usable format. It is crucial to remember that the research question, not the availability of data, should inform the model structure. 81 Finding a comparable population is a particular challenge. Variations in clinical practice, geographical considerations, availability of resources, and differing health systems and policies may impact treatment or program comparability. Study participant characteristics and strict study inclusion criteria may also impact the generalizability of a sample result. Furthermore, aspects of study design such as outcome measures used, time horizons, and health state definitions may differ from those required for modelling purposes. 81 Additionally, data of interest may not be in the most appropriate or consistent format for use in a specific model. This may require some recalculating on the part of the researcher building the economic model. Often, rates need to be transformed into probabilities, and probabilities from the literature need to be adjusted to the time frame of the model. Costs may need to be converted to a relevant currency and inflated to reflect the appropriate year. Extrapolating long-term effects from short term study data is another common approach. In long-term model projections, it is optimal to include a lifetime time horizon. 78 This is particularly important for chronic conditions. 81 It is important to state any assumptions made when transforming data in such a way, and to be transparent regarding approaches taken. 81 When developing a model, other considerations must be taken into account. Discounting of costs and utility values is a common approach to correct for real world applicability. Discounting takes into consideration that people generally value costs and outcomes more highly in the present than they will in the future. Discount rates differ for each country and range from 3-5% per year. 77,82 Opportunity costs must also be considered. Opportunity cost is an economic concept that indicates the best estimate of the value of a resource is the cost associated with the next best use of the resource. 77 The value of time loss due to illness is an opportunity cost. An individual could use the time for work or leisure. The opportunity cost of time is a cost from the economic perspective, but may not have monetary implications. For example, individuals are not paid for
40 29 leisure time, but lost leisure is considered important from an economic perspective because there is a lost opportunity to use this time in an alternative way Markov Models Markov modeling is a commonly used approach for projecting the long-term impacts of health care programs and interventions. This is of particular value when considering long-term and chronic diseases. This modeling approach allows individuals to transition between a set of mutually exclusive health states. Health states may be defined as a specific health outcome (i.e. cancer remission), physiological events, or even health indices such as quality of life. 78 The proportion of individuals in each health state at any given time throughout the time horizon of the model is determined by the starting distribution and the per cycle probability of transitioning amongst the health states - or remaining in the same health state - with each phase of the model. It is assumed that an individual can only make one transition during each cycle. 82 The majority of Markov Models contain at least one state that a person cannot leave, most often death. This is called an absorbing state, and is essential for the Markov process to terminate. The time horizon of the model is divided into equal increments of time called cycles. A cycle length is determined by considering what is clinically appropriate for what is being modeled and the specific research question. 81,82 Cycles may be measured in terms of hours, days, weeks, months, or even years. Each health state is assigned a specific cost and utility value. These values can change with each cycle of the model. For example, health resource use consumption may change over time, resulting in a lower cost per cycle. Total costs and QALYs are calculated based on the proportion of individuals in each health state over the life of the model. 77 The model is realized for each treatment that is being compared. This results in a total cost for each treatment, a total QALY and the incremental cost per QALY associated with improvements in health of one treatment compared to another. Markov models can be projected for a pre-specified length of time, providing an indication of the long-term impacts of a program. Markov models are often represented by state transition diagrams (Figure 4.1). Each circle represents a health state, with either uni or bi-directional arrows identifying the ways an individual may transition between states, or remain in the same health state. 82

41 30 Figure 4.1: Example of a State Transition Diagram Although models aim to mimic outcomes over the course of time, they cannot perfectly duplicate what happens in a real world situation. However, a model may incorporate several approaches to help correct for some of this real world variation. For example, it can be assumed that transitions will not occur exactly at the beginning of each new cycle but will occur at some point during the cycle. As such, half cycle corrections are often applied to models by adding one-half of the costs and QALYs accumulated in the first cycle prior to beginning the Markov simulation, and adding one-half of the costs and QALYs accumulated in the last cycle, at the end of the Markov simulation. In this way, an assumption is made that each transition will occur half way through each cycle, aiming to balance, on average, over or under-estimations of proportions of individuals in each state Uncertainty in models Given the challenges with developing economic models, it is imperative to quantify the amount of uncertainty present. This is particularly of value when using a variety of data sources. This is best done by completing extensive sensitivity analysis to assess parameter uncertainty. 81 One-way and two-way sensitivity analysis, also known as Deterministic Sensitivity Analysis (DSA), are appropriate ways of assessing uncertainty in the model parameters. This may refer to assumptions made by the modeler, the choice of the model structure, calculation techniques used (i.e. extrapolation methods), and variability between data sources. Parameter uncertainty refers to the variability around the model parameters including cost inputs, utility values, and transition probabilities. 81,83 DSA examines how sensitive the final model results are across a range of
42 31 parameter values for each input. A reasonable and justifiable range of values to assess the full extent of variability should be assigned to each model input. 81 Probabilistic Sensitivity Analysis (PSA) is most suitable for examining the joint parameter uncertainty in a model and to investigate overall robustness to changes in input values. PSA using Monte Carlo simulation is of particular value. In this way, sampling distributions are assigned to each parameter based on parameter characteristics. A number of microsimulations are then completed wherein a value is chosen at random from each parameter distribution and run through the model. 83 Detailed Methodology The economic evaluation method used in this thesis is a long-term projection of costs and consequences using Markov modelling, employing many of the economic evaluation techniques and considerations described above. This section describes in detail the use of these techniques to build the model. A version of the following will be included as a supplement to the manuscript to be submitted to Stroke Markov Model Development In order to project the long-term costs and effects of stroke, we developed a Markov Model. This model consists of a decision tree, comparing either intervention from the CSRT program, or a cohort who assumed to have received no further rehabilitation therapy services (Figure 4.2). The model consists of four possible health states which are described in Table 4.1: Nondisabled, Disabled, Long Term Care, or Death. The Markov Model itself is depicted in Figure 4.3. The model time horizon we used is 35 years with six month cycles. The perspective taken was societal as costs to the health care system, private insurance, and patient out of pocket expenses were considered. However, it should be noted that lost productivity and leisure time costs were not accounted for.
43 32 Stroke (discharged from hospital) Community Stroke Rehabilitation Team Markov Model No further therapy Markov Model Figure 4.2: Decision tree for cost-utility analysis Table 4.1: Definition of health states in Markov model Health State Description Non-disabled An individual is able to live completely independently, in their own home, while being completely independent in their activities of daily living Disabled An individual is able to live in their own home, but requires assistance for activities of daily living either from a family/ friend caregiver or from home care services (i.e. Community Care Access Centres) Long Term Care An individual resides in a Long Term Care or assisted living facility and is no longer capable of residing in their own home Death The final absorbing state in the model Non-disabled Long Term Care Disabled Death Figure 4.3: Markov model
44 Data Sources Because of the unique nature of the Community Stroke Rehabilitation Team program, as well as the context in which it operates, it was necessary to draw on a number of sources to populate the parameters of our Markov Model. The vast majority of Randomized Controlled Trials examining the effectiveness of home based programs, similar to that of the CSRT, often compare outcomes to those of a similar population receiving hospital based outpatient care. Because the aim of the CSRT program is to provide services to individuals who would not otherwise have access to any rehabilitation (or very limited access), it was not appropriate to draw on these sources as a comparator. As such, we relied mainly on large population based studies. Additionally, the one year time frame of the CSRT Economic Study was not sufficient to determine any long-term cost-effectiveness of the program. As such, the combination of primary and literature based sources also allowed us to project over the long-term using a model. A comprehensive search was undertaken using multiple electronic databases (i.e. PubMed, CINAHL) to identify articles on the natural history of stroke. Identifying longitudinal studies with similar stroke populations was the aim of these searches. Furthermore, studies reporting data to appropriately inform our model parameters were targeted (i.e. results presented by disability level). A summary of these sources by study time frame is presented in Table 5.1 in the following chapter. Four main sources were used to populate the parameters of the model: Community Stroke Rehabilitation Team Economic Evaluation Study Data (N=212) Details of the CSRT Economic study are provided in Chapter 5. Funding for this study was provided by the Ontario Stroke Network and the study was conducted in collaboration with the CSRTs. The original study design involved the recruitment of control subjects from elsewhere in the province of Ontario (i.e. outside of the South West LHIN). Hospitals across the province with large volumes of patients discharged with no access to further rehabilitation service were provided with recruitment training, and contacted on a weekly basis to provide support and obtain contact information for recruited patients. Patients who had no access to further rehabilitation, but who would benefit from additional therapy were it available, were targets of these recruitment efforts. Control participants were to be assessed in the same way as CSRT
45 34 study participants. Unfortunately, due to very low control participant recruitment, only CSRT participant data were available for analysis. Participant flow through the study is detailed in Appendix 1. Markle-Reid et al. (2011) - Interprofessional Rehabilitation for Stroke Survivors Using Home Care 26 (N= 101) This study, conducted by researchers at McMaster University in Ontario, Canada, was a Randomized Controlled Trials examining the effectiveness of a home based stroke rehabilitation program compared to traditional home-based care (i.e. Community Care Access Centre) with no rehabilitation. Participants were assessed at baseline and 12 month follow up on function and psychosocial outcomes (Stroke Impact Scale-16), as well as health service utilization using the Health and Social Services Utilization Survey. Individual level data were obtained for use in the present analysis. Because the control group in this study was similar to the intended control population in the original CSRT study design, data from the control group (n= 49) was incorporated into the Markov model. Canadian Community Health Survey (2010) 84 (N= 61,707) The Canadian Community Health Survey (CCHS) is a nationwide, cross sectional survey designed to collect information regarding health care usage and the health status of a representative Canadian population from diverse demographic and socioeconomic backgrounds. It includes information on individuals over the age of 12, and randomly samples the entire Canadian population across all 10 provinces and 3 territories. Individual level datasets are freely available. For the purposes of this study, only individuals replying yes to the question Do you suffer from the effects of a stroke? (CCC_151) were included in the analysis (N= 993). Literature Based Sources 1. Magalhaes et al Functional Status Three Months after the First Ischemic Stroke Is Associated With Long-Term Outcome: Data from a Community Based Cohort 85 (N= 380) This Portuguese population based study 85 examined first ever stroke survivors over a period of seven years. Patients were contacted at 3 months, 1 and 7 year follow up times, and long-term
46 35 functional status and survival was assessed. Deaths were reported by family members or derived from computerized patient files. 2. Oxford Vascular Study (N= 748 stroke patients) The Oxford Vascular Study is a UK population based study which followed patients for up to 5 years post stroke. Patients were assessed at 1, 6, 12, 24, and 60 months post stroke. A range of demographic characteristics and patient outcomes were assessed at each time point. Several publications have resulted from this study including articles examining quality of life in these individuals using the EQ-5D 86, as well as admission to Long Term Care facilities Perth Community Stroke Study 88 (N=328) The Perth Community Stroke Study is a population based study conducted in Perth, Australia. Patients with stroke were followed for a period of 10 years, and were assessed on disability, new stroke, and living arrangements. 4. Ontario Based study of LTC Residents 89,90 (N= 8,058) This study is an Ontario, Canada based study of LTC residents assessing the cost-effectiveness of various pressure ulcer prevention strategies. The study population included all residents in 89 Long Term Care facilities across Ontario. The Resident Assessment Instrument Minimum Data Set (RAI-MDS), which is collected on patients on a quarterly basis, was used to assess changes in physical functioning, cognition, health status, and quality of life. Costing data for this study were derived from the Ministry of Health and Long Term Care, Ontario Health Insurance Plan, Canadian Institute of Health Information Discharge Abstract Database, and the National Ambulatory Care Reporting System Health State Definitions Individual Level Study Data & Literature Based Sources Both the CSRT study and the study by Markle-Reid et al. 26 administered the Stroke Impact Scale- 16 (SIS-16) to participants. This measure was used to differentiate between Disabled and Non- Disabled health states. Several validation studies have demonstrated good ability of the SIS-16 to differentiate across levels of the modified Rankin Scale. 51,52 As such, a score of <75 on the SIS-
47 36 16 was considered to be Disabled, and 75 Non-Disabled. These cut-offs are consistent with definitions of disabled and non-disabled found throughout the stroke literature Throughout the literature, the modified Rankin Scale (mrs) is consistently used as a measure of disability following stroke. In all literature based model inputs, an mrs of 3 is considered to be Disabled, where as a score of <3 is Non-Disabled Canadian Community Health Survey The CCHS asks a number of questions relating to physical functioning and restriction of activities. The variable Participation and Activity Limitation (RACDPAL), classifies individuals based on the frequency with which they experience difficulty as a result of a longterm or chronic health problem (lasting >6 months). It is derived from five questions, all pertaining to restriction of activities. For the purposes of this study, a classification of never was considered to be a Non-Disabled individual, and a mean of the sometimes and often classifications were considered to be in the Disabled health state Cost Inputs Costing of health services employed the ingredients approach, in which the frequency of utilization of health services was multiplied by the price. A breakdown of costs for both the CSRT and No Therapy cohorts are detailed in Appendix 2. Community Stroke Rehabilitation Team Intervention Health care usage costs for the Community Stroke Rehabilitation Team were derived from data collected using the Health and Social Services Utilization Survey (HSSUS) at six and 12 month follow up. Cost estimates for health care usage were derived from the costing manual accompanying the HSSUS and are based on the Ontario Health Insurance Plan (OHIP) schedule of benefits and fees. Laboratory and diagnostic fees were provided in 2003 Canadian Dollars, and all other services in 2006 Canadian Dollars. As such, costs were inflated to reflect 2013 Canadian Dollars using the Ontario health and personal care consumer price index inflation rates 91. Where specific costing information was not available (i.e. community services, devices, medical supplies), the midpoint of the highest and lowest cost estimate from two online Canadian sources
48 37 was averaged. Travel costs to health care appointments incorporated the cost of parking, cost per kilometer to destination, hotel stays, and the cost of taxi service or public transit. Costs included for use in this analysis were physician visits (including Emergency Room (ER) visits and specialists), other health care professionals/ services, hospitalizations and surgeries, diagnostic tests and laboratory expenses, devices and special treatments, household help, and travel costs. Visit costs for the CSRT program were provided by the program itself. Each visit cost included a proportion of program overhead, therapist cost, as well as any associated therapist travel costs. Per visit cost calculations were specific to therapist type (physiotherapist, occupational therapist, speech-language pathologist, recreational therapist, rehabilitation therapist, social worker, or registered nurse), and CSRT location (Huron Perth, Thames Valley, or Grey Bruce). Because of the delay in contact between the initiation of CSRT services and baseline contact, as well as possible client recall bias, the number of visits a client had with CSRT care providers was derived from the CSRT administrative database. This data source contained all visits the client received during their time in the program. Participant costs at each time point were totaled, and means calculated for each health state. Costs were applied for the first two cycles in the CSRT arm. No Further Therapy Comparator Health care usage for the comparator group was derived from the study conducted by Markle- Reid et al. 26 at McMaster University. As with the CSRT study, frequency and type of health care usage were collected using the HSSUS. The same unit costs used to estimate CSRT health care costs were applied to this data. Because the HSSUS asks about health care usage (general practitioner/specialist visits, other health services etc.) in the past six months, and only 12 month follow up data were available, proportions of health care usage in the first vs. second six month periods from CSRT data were used to determine a cost estimate for the first six months. Hospitalization data for this study was available for the whole 12 month period, therefore costs for the first vs. second six month time period were similarly calculated from proportions of CSRT hospitalization costs during each time period. As with CSRT data, costs included for use in this analysis were physician visits (including ER and specialists), other health care usage,
49 38 hospitalizations and surgeries, diagnostic tests and laboratory expenses, devices and special treatments, household help, and travel costs. Participant costs at each time point were totaled, and means calculated for each health state. Costs were applied for the first two cycles in the comparator arm. Long Term Care (LTC) Cost for an individual living in Long Term Care were derived from an Ontario based economic study 90 of pressure ulcer interventions in LTC. Mean weekly costs of Long Term Care (nursing/ personal care, physician costs, other), hospitalizations, emergency department visits, and diagnostic tests were totaled to produce a six month cost estimate. Long Term Care costs were the same applied for the both the CSRT and comparator arm for the duration of the model Long-Term Projection Questions pertaining to health care utilization in the CCHS were isolated, and a cost per visit applied based on costing data used in CSRT study. Where specific health care professional information was not available, a mean cost was applied (i.e. the mean cost of a specialist). Because type of surgery received was not specified, the mean cost of outpatient surgery from CSRT data was applied to individuals stating they have received non-emergency surgery. This was felt to be appropriate as any additional costs of an overnight stay due to surgery would be captured in the number of nights as patient question (CHPG02). Cost of diagnostic tests, if received within the last year, were also calculated. Because some questions did not report the frequency of usage (i.e. diagnostic tests, surgery), these costs were applied only once. Questions pertaining to travel expenses, household help, and the cost of devices were not available. As such, the mean of all household help, travel expenses, and device costs from both CSRT data and the Markle Reid et al. 26 study were added to each estimate. Costs were totaled for each study participant, and means calculated for each health state. Cost were applied beginning in the third cycle of the model for both the CSRT and comparator arms.
50 Transition Probabilities All transition probabilities used in the model are detailed in Appendix 3. Community Stroke Rehabilitation Team Intervention Based on health state definitions, as determined by the SIS-16 data collected during the CSRT study, the proportion of individuals in each health state (Disabled and Non-Disabled) and transitioning between health states between baseline and six month follow up, and six and 12 month follow ups was determined. These probabilities were applied to the first two cycles of the model. No Further Therapy Comparator Based on health state definitions, as determined by the SIS-16 data collected during the Markle- Reid et al. 26 study, the proportion of individuals in each health state and transitioning between health states between baseline and 12 month follow up was determined. Because only the cumulative probability of transitioning between health states was available, this probability was converted into a per cycle rate using the formula: (Formula A) r = ln(-s(t))/ t Where r is the per-cycle rate, S(t) is the cumulative probability, and t is the number of cycles. This per cycle rate was then transformed back into a per cycle probability to reflect the cycle length of the model using the formula: (Formula B) p = 1 exp(-r*t) Where p is the per cycle probability, r is the per-cycle rate, and t is the number of cycles. These probabilities were applied to the first two cycles of the model. Long-Term Projection
51 40 We estimated the annual probability of death, admission to Long Term Care, and new disability, by converting cumulative survival to time t, to a per cycle rate (Formula A). We then converted the per cycle rate to a per cycle probability using the formula (Formula B) New Disability: A long-term estimate of functional decline was derived from the Perth Community Stroke Study. From a 10 year cumulative probability of new disability, an annual rate was calculated. Research on outcomes following stroke almost exclusively demonstrate functional decline as time post stroke onset increases. 88,92 Therefore, it was assumed that after 1 year, individuals would no longer transition from the Disabled to Nondisabled health state. This probability was applied following the third cycle of the model and projected forward for the duration of the model. Death and admission to LTC: Using Kaplan Meier survival data from two studies 85,87 cumulative survival (S(t)) values were transformed into per cycle probabilities. To extrapolate beyond the study period, a linear regression model was developed using all observed study data. This was done by taking the ln of each S(t), and regressing this on survival time (t) in months. The resulting intercept and β coefficient (λ) were entered into the equation S(t)= exp (-βo-β1(t)), varying the value of t for each extrapolated time point of interest to obtain the S(t) at that time point. These S(t) values were then used to calculate the per cycle probability. Calculated values of probability of death were used for the duration of the model. Death in LTC was determined using unpublished data from Hillmer (2008) of the six month cumulative incidence of mortality in LTC residents Utilities All utility values used in the model are detailed in Appendix 3. Community Stroke Rehabilitation Team Intervention Patient responses to the EQ-5D-5L were used to generate a health state profile that can then be converted to index based values. For the purposes of this study, the United States value set was used. Mean utility values for each health state were calculated for each time point. Utilities were applied to the CSRT arm for the first three cycles of the model
52 41 No Further Therapy Comparator Data from the Oxford Vascular Study were used to calculate a trend in health utilities over a 5 year period for both Disabled and Non-Disabled health states. This trend was then applied to the mean baseline CSRT utility for both Disabled and Non-Disabled health states in six month intervals and projected to the end of the study data (10 cycles of the model). This trend was applied to CSRT study data following the third cycle of the model. For the purposes of this model, health state utilities differed between the intervention and comparator arms for the first 10 cycles of the model. This was done to reflect the effect of the intervention on one s Health Related Quality of Life during the period of intervention, as well as the continued effect it may have on patient well-being. Following this period, utility values were constant between intervention and comparator arms. Long Term Care Mean utility values for all individuals in LTC were derived from the Ontario based study by Pham et al. (2011) and applied for the duration of the model. Long Term Projection Health utility indexes by five year age range are provided in the CCHS (2010). Beginning with the mean CSRT cohort age, and following the 5 year Oxford Vascular Study data, mean utilities for each health state and age range were projected forward for the remainder of the model Cost-Utility Analysis A cost-utility analysis was conducted to determine the incremental cost of the CSRT program per Quality Adjusted Life Year (QALY) gained as compared to a control group. Upon inputting model parameters determined using the above methods, the model was run in six month cycles for a total length of 35 years (70 cycles) or until death. The total expected value of cost and accumulated QALYs were estimated for each cohort. Costs and QALYs were compared for CSRT versus No Therapy.
53 Sensitivity Analysis One-way: To assess uncertainty in the model, one-way sensitivity analysis was completed on all parameters. Reasonable input ranges were determined from 95% confidence intervals for utilities and transition probabilities. Ranges for cost parameters were determined by taking 95% CI of the means and standard deviations of the log transformed costs for each cycle, and using the smallest and largest values for the upper and lower range value, respectively (Appendix 4). Further threshold analyses were conducted on all sensitive parameters to determine the exact value at which the treatments had equal costs. Two-way: In a two-way sensitivity analysis, two model parameters are changed simultaneously. For this model, two-way sensitivity analyses were conducted on key model parameters: the cost of being Disabled and the probability of transitioning between Disabled and Nondisabled health states; the cost of being Disabled and the probability of transitioning between Nondisabled and Disabled health states; and the cost of LTC and the probability of transitioning between Disabled and LTC. The Net Monetary Benefit (NMB) of each one-way and two-way sensitivity analysis was determined at a Willingness to Pay (WTP) threshold of $20,000 per QALY, which is a reasonably low value. In cost-effectiveness analysis the WTP threshold indicates the amount one is willing to pay to gain one QALY. The NMB is calculated using the formula: NMB = WTP*ΔQALY-ΔCost. A NMB of >0 was considered to be a desirable outcome because the health gain is achieved at a cost that is less than the willingness to pay threshold. Probabilistic Sensitivity Analysis: In probabilistic sensitivity analysis, parameter values are drawn from probability distributions (Appendix 5). Beta distributions were used for utility values and transition probabilities. A log normal distribution was used for costs. In a probabilistic sensitivity analysis, a value is chosen randomly from each distribution. The QALYs and cost are then calculated based on these sampled values. This sampling process was competed 10,000 times with 1,000 trials for the purposes of this model.
54 Other Model Considerations The model was projected for a total length of 35 years or until death (70 cycles of six months each). Costs and utilities were discounted at a rate of 3% per year (1.5% per six month cycle). A value of 3% was chosen to reflect the chronic nature of stroke disabilities. All analyses were conducted using TreeAge Pro 2013.
55 44 5 Integrated Article A version of this manuscript will be submitted to Stroke. Introduction Over 50,000 Canadians experience a stroke annually, often leading to residual deficits that require months or even years of recovery. 1 As such, stroke is the second major cause of longterm disability in North America. 2,3 It is estimated that over 50% of individuals who have experienced a stroke will have moderate to severe physical, cognitive, and psychosocial impairments, with these deficits often requiring intense rehabilitation throughout the acute, postacute, and chronic phases of recovery. 4 The costs of stroke to the Canadian economy are high. One estimate suggests that $3.6 billion per year are spent on both the direct and indirect costs of stroke in Canada. 5 Although the majority of direct costs are spent on acute and inpatient care, a large sum is attributed to post-acute rehabilitation, stroke prevention, and physician visits for routine follow up and management of medical comorbidities such as depression, urinary tract infections, and pain. 6 A recent systematic review found that an estimated 30-62% of individuals will be readmitted to hospital following post-acute care for all cause morbidity, and an additional 20% of stroke survivors will experience a recurrent stroke, resulting in considerable added cost to the health care system. 1 Substantial research has been performed on in-home rehabilitation programs after stroke. A meta-analysis of studies comparing home-based and centre-based stroke rehabilitation facilities found that home-based services were associated with greater client satisfaction, reduced caregiver strain, lower readmission rates, and improvement in Activities of Daily Living (ADLs). 7 Pooled analysis also demonstrated a significant increase in functional independence in the form of improved scores on the Barthel Index. Reviewers noted that home-based rehabilitation may be superior, in part, because individuals have the opportunity to immediately transfer skills they have learned in their own living environment. 7
56 45 To date, few economic reviews have been completed examining the costs of home-based rehabilitation programs. Most of these analyses compared the costs of home-based programs to hospital-based outpatient programs and found that home-based services were usually costeffective or no more costly than hospital-based programs, particularly in the context of early supported discharge from hospital. 8 A systematic review of costs for home-based rehabilitation programs found that, overall, domiciliary rehabilitation reduced hospital stay by 13 days (95% CI: -19 to -7 days) and, in combination with early discharge from hospital, resulted in an overall mean cost reduction of 15% compared to in-hospital rehabilitation without any compromise to patient outcomes. 9 However, there are mixed results when examining the effectiveness of community-based programs in terms of patient outcomes and cost. 10 There is a great deal of heterogeneity in the studies performed to date. Variation in programs, such as the professional makeup of the interdisciplinary teams, as well as differences in the health care systems in which they operate, make it difficult to generalize results to other populations. Consequently, extrapolation of results to a Canadian setting is difficult. In Ontario, Canada s most populous province, the availability of post-acute rehabilitation is limited. In 2014, over 35% of stroke patients, including 40% of acute patients, were discharged home with no further rehabilitation services. 11 This rate may be as high as >50% in more rural areas. 46 Research has shown that less than 10% of stroke patients will make a full recovery, with the remaining requiring ongoing rehabilitation. 1 Furthermore, 25% of stroke sufferers are left with minor disability, and 40% with major disability, requiring therapy. 1 These numbers suggest a system where a large subset of patients with stroke receive little or no rehabilitation after they leave the hospital. In many cases, further rehabilitation is not accessible due to issues of mobility, transportation, or geographical limitations in rural and remote areas. In many other instances, these services are not available at all or available in very limited capacity. Home-based rehabilitation aims to help fill this service gap. The Community Stroke Rehabilitation Teams (CSRT) are home-based rehabilitation teams which provide service to eight counties in Southwestern Ontario. They aim to provide care to adult stroke survivors living in their homes who are otherwise unable to access traditional outpatient rehabilitation services due to lack of accessibility or availability of services. The CSRTs deliver services individualized to each client based on the Canadian best-practice recommendations for
57 46 stroke. This may involve physical rehabilitation, social and emotional support, education, system navigation, community re-integration, and caregiver support. 12 Provision of these services is based on an interdisciplinary model with involvement of a registered nurse, occupational therapist, physiotherapist, speech-language pathologist, social worker, therapeutic recreation therapist, or rehabilitation therapist working together as necessary. Since implementation in 2009 the program has provided active services to over 3000 clients. The purpose of this study was to perform a 1-year prospective evaluation of utility outcomes and costs among clients of the Community Stroke Rehabilitation Teams. A Markov model was developed to compare the long-term cost-effectiveness of this community-based stroke rehabilitation team model to no formal rehabilitative care for patients recovering from stroke. Methods Patients admitted to the CSRT program consist of adult stroke survivors with specific and achievable rehabilitation goals who are motivated and able to participate in the program, and whose needs are best met by specialized stroke rehabilitation services in the community. Consecutive patients admitted to the CSRT program between January 2012 and February 2013 were approached by CSRT staff at their initial home visit, given a brief description of the study, and asked for written consent to provide their name and contact information to a member of the research team. As soon as possible, contact with the client or appropriate proxy was made via telephone to explain the study in detail and obtain verbal consent for participation. Proxy respondents were only accepted if the individual lived with, or had regular day-to-day contact with, the participant. Baseline assessments were completed over the phone and involved collection of patient information and initial assessment of the EuroQol 5D 5L (EQ-5D-5L) (Appendix 6) and Stroke Impact Scale (SIS) (Appendix 7) Follow up phone calls were performed six and 12 months after baseline assessment. During follow-up telephone interviews, participants were reassessed using the EQ-5D-5L and SIS, and were also administered the Health and Social Services Utilization Survey (HSSUS) (Appendix 8), 21 which consists of a range of questions
58 47 designed to capture the types and quantities of health and social services accessed by patients. Respondents were asked to provide healthcare utilization information for the first six months and the 6-12 month period after the baseline call separately. Ethics approval was obtained from the research ethics board at Western University (Appendix 9). Economic Model and Analysis A Markov Model was developed to project the long-term costs and impacts of this program (Figure 5.1). In this model, CSRT was compared with controls who were assumed to have received no, or limited, further rehabilitation services. The model consists of four possible health states: Nondisabled (able to live independently, completely independent in activities of daily living), Disabled (live in one s own home, requires assistance for activities of daily living), Long Term Care (resides in a Long Term Care or assisted living facility), or Death. The model time horizon we used was 35 years or until death, with six month stages. A societal perspective was taken, however, the costs of loss productivity and leisure time were not accounted for. 22 Stroke (discharged from hospital) Community Stroke Rehabilitation Team Markov Model #1 Nondisabled No further therapy Markov Model #2 Long Term Care Disabled Death Figure 5.1: Decision tree and Markov model Because of the unique nature of the Community Stroke Rehabilitation Team program, as well as the context in which it operates, it was necessary to draw on a number of sources to populate the parameters of our Markov Model. As the Community Stroke Rehabilitation Team Economic Study was single-armed, it was necessary to find information on health outcomes and utilities for a comparator population. As such, we relied mainly on large population based studies. Additionally, the one-year time frame of the CSRT Economic Study was not sufficient to provide long-term data to inform the cost-effectiveness of the program. Thus, the combination of primary
59 48 and literature based sources also allowed us to create a long-term projection model. A summary of these sources by study time frame is presented in Table 5.1. Four main sources were used to populate the parameters of the model: 1: Community Stroke Rehabilitation Team Economic Evaluation Study Data (N= 212) 2. Markle-Reid et al. (2011) 23 : Individual patient data were used in the present analysis. The control group (N= 49) in this study received limited rehabilitation following hospital discharge, and thus was the focus of all analyses using this data. 3: Canadian Community Health Survey (2010) 24 : The Canadian Community Health Survey (CCHS) was a cross sectional study of the Canadian population. Individual level data is accessible in freely available datasets. Only data from individuals replying yes to the question Do you suffer from the effects of a stroke? (CCC_151) were included in the analysis (N= 993). 4. Literature Based Sources: 1. Magalhaes et al. (2014) 25 (N= 380) 2. Oxford Vascular Study 26,27 (N= 748 with stroke) 3. Perth Community Stroke Study 28 (N= 328) 4. Ontario Based study of LTC Residents 29,30 (N= 8,058)
60 49 Table 5.1: Parameter data sources by timeframe Parameter Baseline 12 month follow-up 12 months + Long-term projection Utilities CSRT (Disabled/ Non) Comparator (Disabled/ Non) Community Stroke Rehabilitation Team Economic Study Oxford Vascular Study trend (using CSRT study baseline value) Oxford Vascular Study Canadian Community Health Survey (2010) Costs Transition Probabilities LTC CSRT (Disabled/ Non) Comparator (Disabled/ Non) LTC Between Disabled and Nondisabled Disabled and Nondisabled to LTC Disabled and Nondisabled to Death Community Stroke Rehabilitation Team Economic Study Markle-Reid et al. 23 CSRT: Community Stroke Rehabilitation Team Economic Study Control Group: Markle- Reid et al. (2011) Ontario based study of LTC residents Canadian Community Health Survey (2010) Ontario based study of LTC residents Perth Community Stroke Study Oxford Vascular Study Magalhaes et al. (2014) Ontario based study of LTC residents Health State Definitions Both the CSRT study and study by Markle-Reid et al. 23 administered the SIS or SIS-16 to participants. For CSRT participants, a SIS-16 score was derived from the full SIS. This measure has been found to discriminate well amongst disability levels on the modified Rankin Scale 17,31
61 50 and, as such, was used to differentiate between Disabled and Non-Disabled health states. A score of <75 on the SIS-16 was considered to be Disabled, and 75 Non-Disabled. These cut-offs are consistent with definitions of disabled and non-disabled found throughout the stroke literature including those used in our literature based sources The CCHS asks a number of questions relating to physical functioning and restriction of activities. For the variable Participation and Activity Limitation (RACDPAL), a classification of never was considered to be a Non-Disabled individual, and a mean of the sometimes and often classifications were considered to be Disabled. Cost Inputs Costing of health services employed the ingredients approach in which the frequency of utilization of health services was multiplied by the price. Health care usage costs for the Community Stroke Rehabilitation team and No Therapy arm, using individual level data from Markle Reid et al. 23 were derived from responses to the Health and Social Services Utilization Survey (HSSUS). Costs included physician visits (including Emergency Room visits and specialists), other health care professionals/ services, hospitalizations and surgeries, diagnostic tests and laboratory expenses, devices and special treatments, household help, and travel costs. Cost estimates are based on the Ontario Health Insurance Plan (OHIP) schedule of benefits and fees, and were inflated to 2013 Canadian Dollars using the Ontario health and personal care consumer price index inflation rates. 32 Costs of out of pocket and device expenses were determined using internet based sources for the price and participant self-report. Visit costs for the CSRT program were provided by the program. Each visit cost included a proportion of program overhead, therapist cost, as well as any associated therapist travel costs. Per visit cost calculations were specific to therapist type. Because of the delay in contact between the initiation of CSRT services and baseline contact, as well as possible client recall bias, the number of visits a client had with CSRT care providers was derived from administrative data. For the long term projection of costs, questions pertaining to health care utilization in the CCHS were isolated, and a cost per visit was applied based on costing data used in the CSRT study.
62 51 Information on travel expenses, household help, and the cost of devices were not available. As such, the mean of all household help, travel expenses, and device costs from both CSRT data and the Markle Reid et al. 23 study were added to each estimate. Mean weekly costs of Long Term Care (nursing/ personal care, physician costs, other), hospitalizations, emergency department visits, and diagnostic tests were totaled and a six month cost estimated from the weekly cost reported in an Ontario based study of LTC residents. 30,33 LTC costs were the same in both the CSRT and comparator arm for the duration of the model. Transition Probabilities Based on health state definitions, the proportion of individuals in each health state (Disabled and Nondisabled) and transitioning between health states between baseline and six month follow up, and six and 12 month follow ups was determined from the CSRT study data and No Therapy cohort using Markle-Reid et al. 23 study data. We estimated the annual probability of death from Magalhaes et al. 25 and admission to Long Term Care from the Oxford Vascular Study 26 by converting cumulative survival to time t, to a per cycle rate using the formula r= ln(-s(t)/t), where r is the per cycle rate, S(t) is the cumulative probability, and t is the number of cycles. We then converted the per cycle rate to a per cycle probability using the formula p = 1 exp(-r*t), where p is the per cycle probability, r is the per cycle rate, and t is the number of cycles. Data were extrapolated beyond the study period using regression analysis to estimate the trend in survival. Similarly, from a 10 year cumulative probability of new disability in the Perth Community Stroke Study, 28 a per cycle rate was calculated. Research on outcomes following stroke almost exclusively demonstrate functional decline as time post stroke onset increases. 88,92 Therefore, it was assumed that after one year, individuals would no longer improve disability levels (i.e. move from the Disabled to Nondisabled health state). Death in LTC was determined using unpublished data from Hillmer (2008) of the six month cumulative incidence of mortality in LTC residents. 30
63 52 Utilities CSRT study participant responses to the EQ-5D-5L were used to generate index based values. Mean utility values for each health state were calculated for each time point. For the No Therapy control arm, data from the Oxford Vascular Study were used to calculate a trend in health utilities over a 5 year period for both Disabled and Non-Disabled health states. This trend was then applied to the mean baseline CSRT utility for both Disabled and Non-Disabled in six month intervals and projected to the end of the study data. This trend was applied to CSRT study data following the first 12 months of the model. Following the first 10 cycles of the model, health utility indexes by five year age range were derived from CCHS data. Mean utility values for all individuals in LTC were derived from the Ontario based study of LTC residents 29 and applied to the duration of the model. Analysis A cost-utility analysis was completed to determine the incremental cost of the CSRT program per Quality Adjusted Life Year (QALY) gained when compared to No Therapy using Expected Value (EV) calculations. The total EV of cost and accumulated QALYs were estimated for each cohort. Scenario analyses were completed to assess the impact of transitioning from a Disabled to Nondisabled health state in the CSRT cohort. This was completed by setting all transition values equal to the No Therapy values and conducting an EV calculation. Scenario analyses were also completed on discount rates by examining expected value calculations at 0, 3, and 5% discounting values. To assess uncertainty in the model, one-way sensitivity analysis was completed on all parameters. Reasonable input ranges were determine from 95% confidence intervals for costs, utilities and transition probabilities. Threshold analyses were conducted on all sensitive parameters to determine the exact value at which the two cohorts were equal. Two-way sensitivity analyses were conducted on key model parameters: the cost of being Disabled and the probability of transitioning between the Disabled and Nondisabled health states;
64 53 the cost of being Disabled and the probability of transitioning between Nondisabled and Disabled health states; and the cost of LTC and the probability of transitioning between Disabled and LTC. The Net Monetary Benefit (NMB) of each one-way and two-way sensitivity analysis was determined at a Willingness to Pay (WTP) threshold of $20,000 per QALY. In cost-effectiveness analysis the WTP threshold indicates the amount one is willing to pay to gain one QALY. The NMB is calculated using the formula: NMB = WTP*ΔQALY-ΔCost. A NMB of >0 was considered to be a desirable outcome. A Probabilistic Sensitivity Analysis (PSA) was conducted to assess uncertainty in model parameters. Beta distributions were used for utility values and transition probabilities and Log Normal distributions for costs. In a probabilistic sensitivity analysis, a value is chosen randomly from each distribution. The expected value of the QALYs and cost are then calculated based on these sampled values. This sampling process was competed 10,000 times with 1,000 stochastic trials for each set of randomly drawn parameters. Costs and utilities after the first year were discounted at a rate of 3% per year. A value of 3% was chosen to reflect the chronic nature of stroke disabilities. All analyses were conducted using TreeAge Pro Results A total of 212 CSRT participants were recruited between January 2012 and February Demographic information for CSRT participants at baseline is provided in Table 5.2. Overall, clients in the CSRT program had fewer costs in the first two cycles of the model (first 12 months) when compared with No Therapy controls. Although Nondisabled individuals in the CSRT cohort had higher health utilities than No Therapy, this was not the case for Disabled individuals. This carried through for the first 10 cycles of the model following the trend observed in the Oxford Vascular Study 27, after which utility values in both cohorts were equal. During the first two cycles of the model, more individuals in the CSRT cohort improved, transitioning into the Nondisabled health state. Following the first two cycles of the model, all costs and transition
65 54 probabilities were the same for both CSRT and No Therapy cohorts. All parameter values used in the model can be found in Appendix 3. Table 5.2: Baseline characteristics of CSRT participants n= 164 Demographics Age - years (SD) 66.2 (12.6) Number of Males (%) 94 (59.1%) Place of Residence (%) House/Apartment 148 (90.2%) Seniors Apartment 6 (3.7%) Relative s House 3 (1.8%) Lives with family member or other support person 139 (87.4%) Family or other support available on a daily basis 124 (78.0%) Stroke Event and History Able to stand up and walk around on own after stroke (%) 82 (50%) Days Since Stroke (Mean, SD) 62 (17) Recurrent Event (%) Stroke 27 (17.0%) Transient Ischemic Attack 4 (2.5%) Stroke Risk Factors Diagnosed with Diabetes 50 (31.4%) Diagnosed with High Blood Pressure 112 (70.4%) Diagnosed with Heart Disease 36 (22.6%) Diagnosed with High Cholesterol 82 (50.3%) In an Expected Value calculation, the CSRT program cost $212,311 per QALYs ($19,127/QALY) and No Further Therapy cost $233,826 per QALYs ($23,277/QALY). This resulted in an incremental cost saving of $21,515 and incremental effect of 1.08 QALYs for the CSRT program when compared to No Therapy. At a WTP threshold of $20,000, CSRT had a Net Monetary Benefit of $43,115 when compared with the No Therapy. Scenario analyses revealed that for all scenarios the CSRT remained cost-effective when compared with No Therapy. Furthermore, the NMB remains >0 in all cases when compared with No Therapy. However, the cost per QALY exceeds $20,000 both when the CSRT probability of becoming Nondisabled is set equal to that of No Therapy, as well as when the discount rate is 0%, becoming $20,809/QALY and $21,352/QALY, respectively.
66 55 In the one-way sensitivity analyses, NMB was assessed over the plausible ranges of values for all cost, utility and transition probabilities. Results of the one-way sensitivity and subsequent threshold analysis are presented in Table 5.3. Results were found to be sensitive to 9 parameters: Cost of CSRT Nondisabled and Disabled, Disabled Utility for both CSRT and No Therapy, transitions of Nondisabled and Disabled to LTC, transition from Nondisabled to Disabled in both cohorts, and Disabled to Nondisabled in the No Therapy cohort. Table 5.3: Results of one-way sensitivity analysis and threshold analysis Parameter Cost Utility Transition Probabilities Parameter Value (Base case) Range (min, max) Sensitive (Y/N) Parameter Value at Threshold (NMB < 0) CSRT Nondisabled $4,769 $52, $23,775 Y $9,567 CSRT Disabled $9852 $43, $41,856 Y $10,764 No Therapy Nondisabled $9,032 $52, $23,775 N - No Therapy Disabled $10,761 $43, $41,856 N - LTC $29,905 $14,547, $43, 643 N - CSRT Nondisabled , 1.0 N - CSRT Disabled , 0.94 Y 0.22 No Therapy Nondisabled , 1.0 N - No Therapy Disabled , 1.0 Y 0.87 LTC , 0.69 N - Nondisabled to Death , 0.27 N - Disabled to Death , 0.36 N - Nondisabled to LTC , 0.21 Y 0.08 Disabled to LTC , 0.48 Y LTC to Death , 0.57 N - CSRT Nondisabled to Disabled , 0.44 Y 0.18 CSRT Disabled to Nondisabled , 0.61 N - No Therapy Nondisabled to Disabled , 0.90 Y 0.13 No Therapy Disabled to Nondisabled , 0.41 Y 0.10 *Range is 95% Confidence Interval Notes: Y, Yes; N, No; NMB, Net Monetary Benefit; LTC, Long Term Care
67 56 Two-way analyses (Table 5.4) revealed that the CSRT program has a NMB >0 in the majority of instances. This is not the case only when parameter values are at the minimum range value of transition probability and the maximum cost for CSRT Disabled to Nondisabled and costs of Nondisabled. Table 5.4: Results of two-way sensitivity analysis Net Monetary Benefit Min Max Cost LTC Disabled to LTC Min $211 -$10,614 Max $36,241 $66,185 CSRT Disabled to Nondisabled CSRT Disabled to Nondisabled CSRT Cost Nondisabled Min $31,302 -$19,150 Max $19,238 $1,753 CSRT Cost Disabled Min $20,830 $52,444 Max $14,906 $34,426 In the Probabilistic Sensitivity Analysis, the mean cost of CSRT was $212,012 (SD $6,657), and the mean utility was (SD 0.22). The mean costs of No Therapy was $233,347 (SD $7,436) and mean utility (SD 0.20). The NMB of the CSRT cohort was $9,558 (SD $6,688), whereas the No Therapy cohort had a negative NMB at -$33,149 (SD $6,855). The incremental NMB of CSRT compared to No Therapy was $42,535 (SD $9,578)). Results of the PSA are presented as an incremental cost-effectiveness scatterplot (Figure 5.2). The PSA revealed that Incremental Cost Effectiveness (ICE) of the CSRT program is superior in 100% of iterations when compared to No Further Therapy.
68 57 Figure 5.2: Incremental cost-effectiveness scatterplot Discussion Results of this analysis indicate that the CSRTs are a cost-effective model for providing homebased rehabilitation following stroke. The program was found to be both less costly (incremental cost = -$21,515) and more effective (incremental effect = 1.08), resulting in a NMB of $43,115 for the CSRT program compared with No Therapy. Furthermore, results of the Probabilistic Sensitivity Analysis indicate that the CSRT program is always cost-effective when compared to No Therapy at a WTP threshold of $20,000/ QALY. One-way and two-way sensitivity analyses showed that the NMB of the CSRT program is >0 in the majority of instances across a range of values. Results of the one-way sensitivity analysis indicate that there are several instances in which the results were sensitive; however, upon examination of threshold values, it can be observed that while the threshold values fall within the plausible range as defined by the 95% confidence interval, they may not always be plausible estimates of the mean value. For example, in the case of the Disabled utilities for both CSRT and No Therapy, the threshold values would provide low
69 58 and high estimates of the mean utility, respectively (0.22 and 0.87). Additionally, sensitivity analysis on transition probabilities revealed threshold values that would likely not be rational or sustainable given the time horizon of the model. The wide range of values is due, in part, to large 95% confidence intervals resulting from small sample sizes in our study data. Some threshold values were realistic estimates of the mean (for example, costs for CSRT Disabled and Nondisabled). This suggests that the result is sensitive to the cost of the CSRT intervention. The model results were driven by the greater proportion of CSRT individuals improving in function during the first two cycles of the model, resulting in a greater proportion of Nondisabled individuals in the CSRT cohort. The Nondisabled health state had a higher utility, lower cost, and lower probability of entering LTC than those in the Disabled health state. Individuals in the CSRT program also had lower costs than the No Therapy comparator for both Disabled and Nondisabled health states for the first two cycles of the model. This may be a result of the ability of the CSRT program to address stroke related concerns and facilitate referrals to other health professionals and services, reducing the number of additional health care visits, although this observation was not assessed in this analysis. As in many modelling studies, a number of sources were used to populate the parameters of this analysis. In general, populations were comparable across studies, however, study heterogeneity precluded the ability to closely compare participants. Additionally, as the studies included were conducted in various countries, differences also existed between health care contexts; however, Canadian based data were used for all costs, an important consideration given the unique nature of our health care system. Economic studies comparing home-based stroke rehabilitation to a control group receiving no therapy are almost nonexistent. Furthermore, cost studies of home-based rehabilitation do not examine cost-effectiveness in terms of a cost/ QALY. A meta-analysis of economic studies of adult rehabilitation by Brusco et al. 34 found few cost-utility and cost-effectiveness analyses of rehabilitation programs, with the majority having a cost-minimization focus. Of programs examining stroke, six out of 11 cost studies were classified as cost-effectiveness or cost-utility analyses, although none presented results in the form of a cost per QALY or reported a WTP threshold. In general, studies examining home-based rehabilitation have demonstrated improvements in function and quality of life 9,35,37,38 consistent with the findings in this study.
70 59 Although comparative studies of home-based stroke rehabilitation do not exist, the Willingness to Pay threshold used in this analysis ($20,000) can be considered conservative. WTP thresholds for stroke related therapies have been set at $50, ,000/ QALY Therefore, at any WTP higher than $20,000/ QALY, the NMB of the program will only increase. This may also have implications for greater generalizability to countries around the world with varying economic environments and health care systems. The results of this study are important to consider when evaluating options to deliver stroke rehabilitation services to any areas where access to rehabilitation is a concern for many. As our analysis suggests that the program is cost-saving compared with not providing any therapy, areas without services should consider implementing such a program. This could have huge impacts on the health care system as a whole as survival from stroke is becoming more prevalent, and many survivors have ongoing rehabilitation needs. Assessments should be conducted on similar programs in other settings to further evaluate the cost-effectiveness of such models of care. Furthermore, this type of service delivery may have applicability to other subsets of individuals needing rehabilitation, such as geriatric, Acquired Brain Injury, and post-surgical rehabilitation. Limitations There were several limitations to the present analysis. Although common in modelling studies, the use of multiple data sources limited this analysis somewhat. The lifetime horizon of the model required the extrapolation beyond the available study data in many cases. Additionally, a lack of congruent study timelines meant there was also a need to interpolate at times. This meant a number of assumptions needed to be made. However, these assumptions were justified and well considered. Finally, it is largely unknown how reasonable our study results are as there is no current literature to compare to; however, the trends and general outcome observed are consistent with effectiveness studies of home-based stroke rehabilitation. Conclusions The results of this analysis suggest that Community Stroke Rehabilitation Team model of care is cost-effective when compared to a No Therapy alternative. Individuals in this program are better able to improve functionally, leading to better health related quality of life, and to use fewer health care resources resulting in further cost savings. Although particularly applicable to the
71 60 Canadian context, these findings may have widespread applicability to areas around with underserved stroke populations. References 1. Heart and Stroke Foundation. Statistics. 2013; heartandstroke com/site/c ikiqlcmwjte/b /k 34A8/Statistics htm. Accessed September, Good D, Betterman K, Reichwein R. Stroke Rehabilitation. Continuum Lifelong Learning Neurol. 2011(12): Teasell R, Foley N, Salter K, et al. Evidence Based Review Of Stroke Rehabilitation, 16th Ed. 2013; Accessed January, Mayo N, Wood-Dauphinee S, Cote R, Durcan L, Carelton J. Activity, participation, and quality of life 6 months post stroke. Arch Phys Med Rehabil 2002(83): Canadian Stroke Network. Cost of caring for stroke patients double that of earlier estimate, study finds. Canadian Stroke Congress, Ostwald S. Medications, comorbiditeis and medical complications in stroke survivors: The CAReS study. Rehabil Nurs. 2006;31(1): Hillier S, Inglis-Jassiem G. Rehabilitation for community-dwelling people with stroke: home or centre based? A systematic review. Int J Stroke 2010;5: Roderick P, Low J, Day R, et al. Stroke rehabilitation after hospital discharge: a randomized trial comparing domiciliary and day-hospital care. Age and Ageing. 2001;30(4): Anderson C, Mhurchu C, Rubenach S, Clark M, Spencer C, Winsor A. Home or hospital for stroke rehabilitation? Results of a randomized controlled trial. Stroke. 2000(31): Moffa-Trotter M, Anemaet W. Cost effectiveness of home rehabilitation: a literature review. Topics in Geriatric Rehabilitation. 1999;14(4): Hall R, Khan F, O'Callaghan C, et al. Ontario Stoke Evaluaiton Report 2014: On Target for Stroke Prevention and Care. 2014; Reports/2014/Ontario-Stroke-Evaluation-Report-2014, 2014.
72 St. Josephs Health Care London. Community Stroke Rehabilitation Teams. 2012; Accessed February, The EuroQol Group. EuroQol-a new facility for the measurement of health-related quality of life. Health Policy 1990;16: Herdman M, Gudex C, Lloyd A, et al. Development and preliminary testing of the new five-level version of EQ-5D (EQ-5D-5L). Qual Life Res. 2001;20: Hunger M, Sabariego C, Stollenwerk B, Cieza A, Leidl R. Validity, reliability and responsiveness of the EQ-5D in German stroke patients undergoing rehabilitation. Qual Life Res 2012;21: Duncan P, Bode W, Lai R, Perera S. Rasch analysis of a new stroke-specific outcome scale: The Stroke Impact Scale. Arch Phys Med Rehabil 2003;84: Duncan P, Lai S, Bode R, Perera S, DeRosa J. Stroke Impact Scale-16: A brief assessment of physical function. Neurology. 2003;60(2): Duncan P, Wallace D, Lai S, Johnson D, Embretson S, Laster L. The stroke impact scale version 2.0. Evaluation of reliability, validity, and sensitivity to change. Stroke. 1999;30: Kwon S, Duncan P, Studenski S, Perera S, Lai S, Reker D. Measuring stroke impact with SIS: construct validity of SIS telephone administration. Qual Life Res. 2006;15: Duncan P, Lai S, Tyler D, Perera S, Reker D, Studenski S. Evaluation of proxy responses to the Stroke Impact Scale. Stroke. 2002;33: Browne G, Garni A, Roberts J. The Health and Social Service Utilization Survey. McMaster University Canadian Agency for Drugs and Technologies in Health. Guidelines for the Economic Evaluation of Health Technologies: Canada. 2006; Accessed February, Markle-Reid M, Orridge C, Weir R, et al. Interprofessional stroke rehabilitation for stroke survivors using home care. Can J Neurol Sci. 2011;38: Canadian Community Health Survey. Annual Component. Government of Canada; Magalhães R, Abreu P, Correia M, Whiteley W, Silva M, Sandercock P. Functional Status Three Months after the First Ischemic Stroke Is Associated with Long-Term
73 62 Outcome: Data from a Community-Based Cohort. Cerebrovascular Diseases. 2014;38(1): Luengo-Fernandez R, Paul N, Gray A, et al. Population-based study of disability and institutionalization after transient ischemic attack and stroke: 10-year results of the Oxford Vascular Study. Stroke. 2013;44(10): Luengo-Fernandez R, Gray A, Bull L, et al. Quality of life after TIA and stroke: Ten-year results of the Oxford Vascular Study. Neurology. 2013;81(18): Hardie K, Hankey G, Jamrozik K, Broadhurst R, Anderson C. Ten-year risk of first recurrent stroke and disability after first-ever stroke in the Perth Community Stroke Study. Stroke. 2004;35(3): Pham B, Stern A. Improving the Quality of Pressure Ulcer Care With Prevention: A Cost- Effectiveness Analysis. Medical care. 2012;50(2): Bayoumi A, John-Baptiste A, Hong Chen M, et al. The cost-effectiveness of prevention strategies for pressue ulcers in long-term care homes in Ontario: Projections of the Ontario Pressure Ulcer Model. Toronto Health Economics and Technology Assessment Collaborative; Lai S, Perera S, Duncan P, Bode R. Physical and social functioning after stroke: comparison of the Stroke Impact Scale and Short Form-36. Stroke; a journal of cerebral circulation. 2003;34(2): Statistics Canada. Consumer Price Index, health and personal care, by province. 2013; statcan gc ca/tables-tableaux/sum-som/l01/cst01/econ161g-eng htm. Accessed September, Pham C, Caffrey O, Ben-Tovim D, Hakendorf P, Crotty M, Karnon J. Evaluating the effects of variation in clinical practice: a risk adjusted cost-effectiveness (RAC-E) analysis of acute stroke services. BMC Health Serv Res. 2012;12: Brusco N, Taylor N, Watts J, Shields N. Economic evaluation of adult rehabilitation: a systematic review and meta-analysis of randomized controlled trials in a variety of settings. Arch Phys Med Rehabil. 2014;95(1): e Crotty M, Halbert J, Harding J, Miller M. Home versus day rehabilitation: a randomised controlled trial. Age Ageing 2008;37:
74 Wolfe C, Tilling K, Rudd A. The effectiveness of commumity-based rehabilitation for stroke patients who remain at home: a pilot randomized trial. Clinical Rehabilitation. 2000;14: Parker S, Oliver P, Pennington M, et al. Rehabilitation of older patients: day hospital compared with rehabilitation at home. Clinical outcomes. Age Ageing 2011;40: Lincoln N, Walker M, Dixon A, Knights P. Evaluation of a multiprofessional community stroke team: a randomized controlled trial. Clinical Rehabilitation. 2004;18: Baskett J, Broad J, Reekie G, Hocking C, Green G. Shared responsibility for ongoing rehabilitation: a new approach to home-based therapy after stroke. Clinical Rehabilitation. 1999;13: Gladman J, Whynes D, Lincoln N. Cost Comparison of Domiciliary and Hospital-based Stroke Rehabilitation. Age and Ageing. 1994;23(3): Bjorkdahl A, Nilsson A, Grimby G, Sunnerhagen K. Does a short period of rehabilitation in the home setting facilitate functioning after stroke? A randomized controlled trial. Clinical Rehabilitation. 2006;20: Ehlers L, Andersen G, Clausen L, Bech M, Kjolby M. Cost-effectiveness of intravenous thrombolysis with alteplase within a 3-hour window after acute ischemic stroke. Stroke. 2007;38(1): Boudreau D, Guzauskas G, Chen E, et al. Cost-effectiveness of recombinant tissue-type plasminogen activator within 3 hours of acute ischemic stroke: current evidence. Stroke. 2014;45(10): Sandercock P, Berge E, Dennis M, et al. Cost-effectiveness of thrombolysis with recombinant tissue plasminogen activator for acute ischemic stroke assessed by a model based on UK NHS costs. Stroke. 2004;35(6): Bowen A, Hesketh A, Patchick E, et al. Clinical effectiveness, cost-effectiveness and service users' perceptions of early, well-resourced communication therapy following a stroke: a randomised controlled trial (the ACT NoW Study). Health technology assessment (Winchester, England). 2012;16(26): Willems, D. Southwestern Ontario Stroke Rehabilitation Action Planning Report. Southwestern Ontario Stroke Strategy, 2006
75 64 Chapter 6 6 Discussion & Conclusions Results of this analysis indicate that the CSRTs are both less costly and more effective than a No Therapy cohort, and have a positive NMB of $43,115 when compared with No Therapy. Probabilistic Sensitivity Analysis results indicate that, at a WTP threshold of $20,000/QALY, the CSRT program is always superior to No Therapy. Furthermore, one and two-way sensitivity analyses indicate that in the majority of cases, the NMB of the CSRT program is greater than that of No Therapy, even at the minimum and maximum of the reasonable range of values. Results of the one-way sensitivity analysis showed that there are nine instances in which results were sensitive. Upon further examination of threshold values for which the CSRT program no longer has a NMB>0, it can be observed that some of these values are not necessarily reasonable. This is particularly true when considering that the one-way sensitivity analysis does not take into account time dependencies, due to limitations in the software used to implement the model. This is of particular concern in a long-term model with an aging population. This may be the case for CSRT and No Therapy Disabled utility value thresholds, for which values are unreasonably low, and high, respectively. For the CSRT Disabled utility, a value of 0.22 is quite small and is, in fact, much lower than the mean utility of LTC. Conversely, the threshold value for the No therapy Disabled utility is 0.87, which is much higher than mean value of the higher Nondisabled health state. Several of the sensitive transition probability values may also be considered unreasonable. The threshold value of the transition probability of Nondisabled to LTC appears to be excessively high, being eight times that of the point estimate. This is also true for CSRT Nondisabled to Disabled transition, for which the threshold value is over 2.5 times that of the long-term projection transition probability estimate. These irrational threshold values may be attributed to small sample sizes in some data sources and, in turn, large 95% confidence intervals that were used to inform our reasonable range values. Several sensitivity analysis thresholds are more rational and should be more carefully considered. Variations in the costs of the CSRT program for both Nondisabled and Disabled health states indicate a NMB<0 at values higher than the point estimates used. However, these threshold numbers are not outside the realm of what may be considered reasonable. Similarly, transition
76 65 probability thresholds for Disabled to LTC, and No Therapy Nondisabled to Disabled and Disabled to Nondisabled are within realistic limits. However, when considering the longitudinal nature of the model and the aging nature of the study population, the sustainability of these threshold values over time is less plausible. Although there are several parameters to which the model is sensitive, the cost/ QALY remains below common WTP thresholds. A pessimistic scenario analysis, in which the benefit of CSRT was restricted to preventing further declines in disability, rather than improving disability levels was still associated with a cost per QALY of $20,809/QALY, which is well below commonly accepted thresholds. As such, the CSRT program would still be an attractive option even if its benefits were assumed to be more modest. Furthermore, the inability of the one-way sensitivity analysis to incorporate the time dependency of variables suggests that the PSA is a better characterization of parameter uncertainty as the software allowed for incorporating time dependent distributions. The transition between Disabled and Nondisabled health states during the first two cycles of the model, that is, during CSRT services, shows an influence on the long-term projection. These are the only two cycles in which transition probabilities differ between the CSRT and No Therapy cohorts. During this time period, a greater number of CSRT individuals are improving functionally, thereby leaving the Disabled health state and entering Nondisabled, resulting in a higher proportion of individuals in the Nondisabled health state in the CSRT cohort than in the No Therapy cohort. This has long-term impacts as these individuals have a higher utility, are less costly, and are less likely to enter LTC. This is also observed in the one-way SA as the transition probability of moving from Disabled to Nondisabled in the No Therapy cohort approaches the maximum value of the reasonable range. As observed in the one-way SA, keeping people out of LTC has an enormous impact on long-term cost-effectiveness. This suggests that therapy provided to CSRT clients allows them to improve in their health status and has subsequent longterm impacts on the overall costs and QALYs gained in these individuals. Because the CSRT program improves the health state of more individuals early on, a scenario analysis was completed to assess the extent of this benefit on the overall model. When this benefit is removed from the model, and Disabled CSRT individuals are given the same probability of transitioning to Nondisabled as the No Therapy cohort, the CSRT program remains
77 66 cost-effective compared to No Therapy; however, the cost/ QALY exceeds the WTP value of $20,000. However, as noted previously, the cost per QALY remains below commonly accepted thresholds. Additional efficiencies of the CSRTs are observed during the first 12 months of the program which may contribute to its long-term cost-effectiveness. Mean cost values in the CSRT cohort were lower than that of the No Therapy group for both Disabled and Nondisabled individuals, even when program costs were included, for the first two cycles of the model. This is somewhat counterintuitive as one would expect that these mean costs would be higher given the cost of the program itself. It appears that CSRT clients may use fewer health care resources. This may, in part, be due to the ability of the CSRT to address stroke related health concerns, thereby reducing the need for additional health care visits, as well as facilitating referrals to health care providers when necessary. This consolidation of services offers the potential for overall health care cost savings. In addition to lower costs, Nondisabled individuals also experience higher health utilities than the No Therapy cohort, contributing to the program s cost-effectiveness. Conversely, Disabled individuals have lower health utilities. The increased potential for CSRT individuals to improve in health status, in combination with the cost and health utility benefits of this program, which are observed during the first two cycles of the model only, has a significant long-term impact on the cost-effectiveness of this program over a No Therapy comparator. As is the case in modelling, the reliability and validity of the model is of importance. Debugging of the model was completed to appraise its internal validity and to ensure that there were no programming errors or inefficiencies in the model structure. The extent of model and parameter uncertainty were also evaluated using several types of sensitivity analysis. Although results were generally not sensitive to variation of parameter values, the time dependency of many of the variables may have not been taken into account in the one and two-way sensitivity analysis. This will likely have led to inflated costs and utility values in these analyses. The time dependency of many of the variables, however, was accounted for in the expected value calculations, as well as the PSA through the incorporation of time dependent distributions in many cases. Although we strove to conduct the most rigorous analysis possible, as in many studies, there were limitations. Although common in many modelling studies, the use of multiple data sources limited this analysis somewhat. Prominently, the linking of CSRT and No Therapy effectiveness
78 67 variables of was of particular challenge. As such, inconsistencies in sensitivity analysis may have been possible, with CSRT values selected from parameter distributions being low relative to No Therapy values. This could have been avoided through the use of relative risk estimates as opposed to means as point estimates, however, relative risk values are difficult to determine with multiple, somewhat heterogeneous, data sources. Additionally, the impact of specific events, such as hospitalizations and severe illnesses, were not considered. These events may have an influence on health outcomes and costs that would be important to consider in a model. One additional limitation was the lifetime horizon of the model and a lack of long-term data to inform such a projection. Of data included in this analysis, the longest study timeline was 10 years. This required us to extrapolate beyond study data for all parameters. Although care was taken to use the most appropriate methods, the understudied lifetime natural history of stroke, in combination with an aging cohort, resulted in uncertainty about the accuracy of the estimates. Although we strove to find the most appropriate sources to inform this model, discrepancies between study populations were present to some degree. Although our comparator cohort is labeled No Therapy, in truth it was largely unknown how much rehabilitation individuals in these studies received. Because many were large population based studies, it is reasonable to assume that some of these individuals did, in fact, receive post stroke rehabilitation; however, the amount and intensity of this therapy likely varied widely. Furthermore, during the first 12 months (2 cycles) of the model, the time during which stroke rehabilitation is most likely to be of benefit, 93 model parameters for both CSRT and No Therapy were largely informed by individual level study data, for which amount of and type of therapy received was known. Participant demographics also varied between study populations with the mean age of populations ranging from ,87 years of age. This is slightly older than the CSRT sample, which had a mean age of 66.2 years. Age has been demonstrated to impact one s ability to functionally recover from stroke, 94 however, it is unknown to what degree this may have affected the results. The ratio of males to females also differed, with the proportion male ranging between % 26. The proportion of the CSRT study sample who were male fell within this range at 59.1%. Other characteristics that may have an effect on recovery from stroke such as medical comorbidities, number of recurrent stoke events, and stroke type and severity, were more difficult to compare between study populations.
79 68 The context in which these studies were conducted compared to the setting in which the CSRTs operate is also important to consider. All cost data used in this analysis were Canadian based, an important consideration given the unique nature of our economy and health care system. Furthermore, No Therapy comparator costs for the first 12 months of the study were determined using individual level, and Ontario based, data from a cohort similar to the CSRTs, but with limited rehabilitation access. Additionally, the same health service utilization survey was used for both this study and the CSRT study. These consistencies were important in maintaining methodological rigor in this analysis. All LTC parameters were also derived from an Ontario based study. Although studies used in the long-term projection were conducted in countries other than Canada, they all have a similarly high standard of health care and quality of living, 95 however, access to health care services may differ between these countries and Canada due to the unique geographic nature of our country. Study characteristics of the literature based sources included in this analysis should also be considered. Consistency in outcome measures used to determine costs, utilities, and transition probabilities differed to some degree. To measure utility, the EQ-5D was used for the first 10 cycles of the model for both cohorts. However, for the long-term projection, utility values derived from the Health Utilities Index were used. Although these measures differ, model cycles during which they were applied were consistent between cohorts. Health state definitions did differ between primary data sources and literature based data sources as primary data sources used the SIS-16 and literature based the modified Rankin Scale (mrs); however, studies have found a good ability of the SIS-16 to discriminate between disability levels of the mrs. 51,52 Furthermore, transition probabilities for the first 12 months of the model were determined using the SIS-16 for both cohorts. Health state definitions for CCHS data were a greater challenge, and so the most conceptually appropriate variable, self-reported disability, was used to distinguish between those who may be considered Disabled and Nondisabled; however, there was no literature on the validity of this measure. In addition to the need to use results from differing outcome measures, discrepancies between studies in follow up time points and study time lines required both interpolation and extrapolation of results to populate the model. The lifetime horizon of this model (35 years or until death) also poses some limitations. In particular, different measures used to determine health states over the life of the model may have
80 69 led to some misclassification in health states. This is of particular concern with data from the CCHS as selection of a health state classification was based on opinion and was not supported by the literature. However, measures used for health state classifications were consistent between CSRT and comparator arms for the entirety of the model, and so any misclassifications would have been the same between the two cohorts. Furthermore, this would have been assessed to some degree in the extensive sensitivity analysis. Extrapolation beyond the available study data also poses some concerns with the long time frame used in the model. However, the greatest impact to the final model results are observed during the first few cycles as previously discussed. The model also incorporates discounting of costs and utilities. Therefore, as the timeline of the model progresses, the costs and utilities incurred impact the results to a lesser degree. Furthermore, lifetime horizons are typical in modelling and are recommended by the Guidelines for the Economic Evaluation of Health Technologies: Canada 81, particularly for chronic conditions such as stroke. The scope of this analysis was fairly broad, and so results may be of interest to a range of groups. Direct costs to the health care system were largely captured, in addition to a number of publically funded health care programs and services. Out of pocket expenses were also captured in the form of costs of devices, travel to appointments, and household help. This analysis did not capture lost productivity, and so cannot be considered a comprehensive societal perspective. Additionally, some health care costs may not have been captured including medication costs, as well as many publically and privately funded programs and health care providers in the long-term projection, as use of many of these services were not captured by the CCHS survey; however, we did attempt to account for some of these services and items by incorporating costs captured in the CSRT and Markle-Reid et al. 26 study data into CCHS cost means. The results of this analysis are difficult to compare to existing research. Although there are economic studies of similar home-based rehabilitation programs, none examine costeffectiveness nor do they examine long-term projections. Many of these studies offer results in terms of program costs or only consider health care costs incurred during time spent in the program. 42,58,73,74 Furthermore, variations in health care systems add an additional layer of complexity, making direct comparisons difficult and often inappropriate. Existing studies, in many cases, compare home-based program costs with those of hospital based outpatient
81 70 programs, which is also not applicable to the CSRT program context. Furthermore, many of these comparisons to outpatient programs offer mixed results in terms of the cost saving potential of inhome rehabilitation. One study, Markle-Reid et al., 26 did compare a home-based stroke rehabilitation program with a usual care cohort receiving limited therapy. In this case, there was no significant difference in costs between the two cohorts over the 12 month study period. This is an Ontario based study and, as such, should be considered when examining the results of the present analysis. Furthermore, individual level data from that study were used to inform our analysis. Although this study by Markle Reid et al. 26 did not find significant differences between groups, 12 months costs in the usual care group were slightly lower than the intervention group. This is contradictory to our results in which health care costs were lower in the CSRT program cohort. However, the Markle-Redi et al. 26 study did not examine cost differences between health states, nor was a long-term projection or cost-effectiveness analysis completed. In line with much of the research that has been completed on home-based stroke rehabilitation programs, the present study was able to demonstrate a benefit in terms of improved function 34-37,39,57,59 and quality of life 34-36,42 in stroke survivors accessing such programs. A relatively large proportion of CSRT clients were able to improve in their physical function, as was demonstrated by 27% and 10% improving from being Disabled to Nondisabled during the first and second six months of the study period, respectively. Furthermore, the mean utility value in the Nondisabled health state is much higher than in the Disabled health state, suggesting an associated improvement in health related quality of life. These results are in concordance with much of the published literature on the benefits of continued rehabilitation following hospital discharge. Although cost-effectiveness studies on home-based stroke rehabilitation have not been published, evaluations of other forms of stroke therapies are more prevalent. The majority of these studies focus on the acute treatment of stroke patients such as Tissue Plasminogen Activator (tpa) and Thrombolysis. Many of these treatments are aimed at minimizing damage to the brain in the immediate event of a stroke. In the majority of these cases, a Willingness To Pay threshold of $50,000/ QALY was used. In general, WTP values are between $50,000 and $100,000 for acute stroke treatments. 89, Cost-effectiveness analyses of post stroke therapies are scarcer, and the majority are presented as cost minimization analyses. 101 One study of an Early Supported Discharge program presented a WTP threshold of 30,000/ QALY (approximately $56,000
82 71 CAD), with most scenarios considered cost-effective at just over 20,000/ QALY (approximately $37,000 CAD). 102 Additional studies of post stroke rehabilitation therapies demonstrated costeffectiveness at WTP thresholds of $50,000/ QALY. 103,104 Although many of these studies were conducted outside of the Canadian context, these WTP thresholds suggest that our WTP threshold of $20,000/ QALY was likely quite conservative. The commonly used benchmarked WTP threshold of $50,000/ QALY is quite arbitrary. 105 There is much debate as to its origins and applicability in today s economic context. Some argue that a reasonable WTP should be based on the context and availability of resources, 105 and not a predefined standard. The World Health Organization suggests that one to three times the Gross Domestic Product (GDP) per capita of a country may be considered as a reasonable WTP threshold, with a WTP of one time the GDP per capita being considered highly cost-effective. 106 The Canadian GDP per capita is approximately $47,000, 107 thus a reasonable WTP range would be $47, ,000/ QALY. The CSRTs are cost-effective compared to No Therapy in 100% of iterations with a WTP of $20,000. By this standard, the CSRT program would be considered highly cost-effective. The results of the cost-effectiveness analysis should be taken into account when considering rehabilitation options, particularly in underserviced areas. The CSRT program is both more effective and less costly when compared with No Therapy, resulting in a positive NMB. Although there is a cost associated with the program delivery, it appears that the improvement in quality of life and over all physical functioning of individuals served by the program leads to an overall cost savings. Furthermore, this program is highly cost-effective at <$20,000/ QALY gained, a relatively low and conservative WTP threshold. This could have huge implications for the health care system given the increasing prevalence of stroke survivors, and resultantly, stroke related disabilities. Canada in particular has many underserved, rural, and remote areas given its vast geography. In the majority of cases, individuals living in these areas are either unable to access much needed additional rehabilitation services, or receive very limited therapies. Results of this analysis demonstrate the need to provide treatment to these individuals, both to improve their own quality of life, as well as leading to cost-savings for the health care system as a whole. This analysis has demonstrated that it is, in fact, more costly to not provide these stroke survivors with further rehabilitation on discharge from hospital than it is to provide them with services.
83 72 The results of this analysis are largely generalizable to other settings. Although the geographic context of South Western Ontario is well suited to this type of program with a large rural population, there are many areas across Canada and the world where access to rehabilitation services post stroke is a challenge for many. A home-based stroke rehabilitation program modelled after the CSRTs may be a feasible option in these areas. Although the results of this study are based on a variety of sources and a number of assumptions, we are confident that it is representative of what may have been observed in a real world setting. The CSRT program has been providing rehabilitation services to stroke survivors since 2009, and has improved the health related quality of life for many of them. Many of these individuals would otherwise be left without any rehabilitation services following discharge from hospital. The CSRT model of care is unique and has demonstrated lasting health and economic benefits by supporting the rehabilitation of stroke survivors in their own home as demonstrated in this analysis. The CSRT program is continuing to evolve to better provide services to their clients and further improve efficiencies in care delivery. The introduction of technologies, such as rehabilitation through video-communication, is currently being evaluated, and should help to improve the function, efficiency and, ultimately, cost-effectiveness of these teams. Ongoing evaluation of client outcomes should be conducted to ensure continued progress and to help inform the development of similar programs around Canada and the world. This model suggests that the CSRT program is cost-effective compared to No Further Therapy. Clients accessing the CSRT program appear to use fewer health care resources during the first 12 months of service provision, incur less costs, and accumulate more QALYs over the long-term. Furthermore, we were able to demonstrate this cost-effectiveness while maintaining a conservative estimate of costs, utilities, and transition probabilities. The Community Stroke Rehabilitation Team model of care is a feasible and effective method of rehabilitation service delivery post stroke.
84 73 7 References 1. Heart & Stroke Foundation. Stroke. 2013; Accessed February 10, Heart and Stroke Foundation. Statistics. 2013; heartandstroke com/site/c ikiqlcmwjte/b /k 34A8/Statistics htm. Accessed September, The US Centers for Disease Control and Prevention. Stroke Statistics. 2005; Accessed March 12, Teasell R, Foley N, Salter K, et al. Evidence Based Review Of Stroke Rehabilitation, 16th Ed. 2013; Accessed January, Good D, Betterman K, Reichwein R. Stroke Rehabilitation. Continuum Lifelong Learning Neurol. 2011(12): Langhorne P, Williams B, Gilchrist W, Howie K. Do stroke units save lives? Lancet 1993;342: Ottenbacher K, Jannell S. The results of clinical trials in stroke rehabilitation research. Arch Neurol 1993;50: Noonani H, Brady B, McGrahan L, Teasell R, Skidmore B, Doherty T. Stroke rehabilitation services; systematic revies of the clinical and economic evidence. Canadian Coordinating Office for Health Technological Assessment; Stroke Unit Trialists'. Organised inpatient (stroke unit) care for stroke. Chochrane Collaboration Databases Syst Rev. 2007; Seenan P, Long M, Langhorne P. Stroke units in their natural habitat: systematic review of observational studies. Stroke 2007;38: Logan P, Ahern J, Gladman J, Lincoln N. A randomized controlled trial of enhanced Social Service occupational therapy for stroke patients. Clin Rehabil : Walker M, Hawkins K, Glandman J, Lincoln N. Randomised controlled trial of occupational therapy at home: results at 1 year. Journal of Neurol Neurosurg Psychiartry 2001;70:
85 Corr S, Bayer A. Occupational therapy for stroke patients after hospital discharge- a randomized controlled trial. Clin Rehabil. 1995;9: Forster A, Young J. Specialist nurse support for patients with stroke in the community: a randomised controlled trial. BMJ. 1996;312: Andersen H, Schultz-Larsen K, Kreiner S, Forchhammer B, Eriksen K, Brown A. Can readmission after stroke be prevented? Results of a randomized clinical study: a post discharge follow-up service for stroke survivors. Stroke 2000;31: Ricauda N, Bo M, Molaschi M, et al. Home hospitalization service for acute uncomplicated first ischemic stroke in elderly patients: a randomized trial. J Am Geriatr Soc. 2004;52: Chaiyawat P, Kulkantrakorn K. Randomized controlled trial of home rehabilitation for patients with ischemic stroke: impact upon disability and elderly depression. Psychogeriatrics. 2012;12: Green J, Forster A, Bogle S, Young J. Physiotherapy for patients with mobility problems more than 1 year after stroke: a randomised controlled trial. Lancet. 2002;359: Wade D, Collen F, Robb G, Warlow C. Physiotherapy intervention late after stroke and mobility. BMJ. 1992;304: Werner R, Kessler S. Effectiveness of an intensive outpatient rehabilitation program for postacute stroke patients. Am J Phys Med Rehabil 1996;75: Canadian Physiotherapy Association. Description of Physiotherapy. 2012; Accessed February, Canadian Association of Occupational Therapists. What is occupational therapy?. 2012; Accessed February, Canadian Association of Speech Language Pathologists and Audiologists. Fact Sheet. 2000; Accessed February, Canadian TR Association. Therapeutic Recreation (TR) Specialist. 2013; Recreation-Specialists-%281%29.aspx. Accessed February, Heart and Stroke Foundation. Canadian Best Practice Guidelines for Stroke Rehabilitation: Outpatient and Community-Based Stroke Rehabilitation (Including ESD)
86 ; Accessed February 28, Markle-Reid M, Orridge C, Weir R, et al. Interprofessional stroke rehabilitation for stroke survivors using home care. Can J Neurol Sci. 2011;38: Canadian Stroke Network. New stroke services distinction measures delivery of stoke care. 2010; Accessed February, Canadian Best Practice Recommendations for Stroke Care. Initial Stroke Rehabilitation Assessment 2013; Hall R, Khan F, O'Callaghan C, et al. Ontario Stoke Evaluaiton Report 2014: On Target for Stroke Prevention and Care. 2014; Reports/2014/Ontario-Stroke-Evaluation-Report-2014, Willems D. Southwestern Ontario Stroke Rehabilitation Action Planning Day Report. Southwestern Ontario Stroke Strategy; South West Health Line. About our Region. 2015; Accessed March, St. Josephs Health Care London. Community Stroke Rehabilitation Teams. 2012; Accessed February, Winkel A, Ekdahl C, Gard G. Early discharge to therapy-based rehabilitation at home in patients with stroke: a systematic review. Physical Therapy Reviews. 2008;13(3): Crotty M, Halbert J, Harding J, Miller M. Home versus day rehabilitation: a randomised controlled trial. Age Ageing 2008;37: Wolfe C, Tilling K, Rudd A. The effectiveness of commumity-based rehabilitation for stroke patients who remain at home: a pilot randomized trial. Clinical Rehabilitation. 2000;14: Parker S, Oliver P, Pennington M, et al. Rehabilitation of older patients: day hospital compared with rehabilitation at home. Clinical outcomes. Age Ageing 2011;40: Lincoln N, Walker M, Dixon A, Knights P. Evaluation of a multiprofessional community stroke team: a randomized controlled trial. Clinical Rehabilitation. 2004;18:40-47.
87 Sirbu E. Evaluation of a home-based physical therapy program in ischemic stroke patients. Timisoara Physical Education and Rehabilitation Journal 2012; Baskett J, Broad J, Reekie G, Hocking C, Green G. Shared responsibility for ongoing rehabilitation: a new approach to home-based therapy after stroke. Clinical Rehabilitation. 1999;13: Widen Holmqvist L, vonkoch L, Kostulas V, et al. A randomized controlled trial of rehabilitation at home after stroke in Southwest Stockholm. Stroke. 1998;29: VonKoch L, Widen Holmqvist L, Wohlin Wottrich A, Tham K, depedro-cuesta J. Rehabilitation at home after stroke: a descriptive study of an individualized intervention. Clin Rehabil. 2000;14: Anderson C, Mhurchu C, Rubenach S, Clark M, Spencer C, Winsor A. Home or hospital for stroke rehabilitation? Results of a randomized controlled trial. Stroke. 2000(31): Schumi J, Wittes J. Through the looking glass: understanding non-inferiority. Trials. 2011(12). 44. Salter K, Foley N, Bhogal S, Teasell R. The most frequently cited outcome measures among randomized controlled trials evaluating stroke rehabilitation therapies. Stroke. 2004;35(6):E Quinn T, Dawson J, Walters M, Lees K. Reliability of the modified Rankin Scale: a systematic review. Stroke; a journal of cerebral circulation. 2009;40(10): Banks J, Marotta C. Outcomes validity and reliability of the modified Rankin scale: implications for stroke clinical trials: a literature review and synthesis. Stroke. 2007;38(3): Hsueh I, Lin J, Jeng J, Hsieh C. Comparison of the psychometric characteristics of the functional independence measure, 5 item Barthel index, and 10 item Barthel index in patients with stroke. Journal of neurology, neurosurgery, and psychiatry. 2002;73(2): Wolfe C, Taub N, Woodrow E, Burney P. Assessment of scales of disability and handicap for stroke patients. Stroke. 1991;22(10): Stroke Engine. Assessments. 2014; Accessed February, 2015.
88 Duncan P, Bode W, Lai R, Perera S. Rasch analysis of a new stroke-specific outcome scale: The Stroke Impact Scale. Arch Phys Med Rehabil 2003;84: Lai S, Perera S, Duncan P, Bode R. Physical and social functioning after stroke: comparison of the Stroke Impact Scale and Short Form-36. Stroke; a journal of cerebral circulation. 2003;34(2): Duncan P, Lai S, Bode R, Perera S, DeRosa J. Stroke Impact Scale-16: A brief assessment of physical function. Neurology. 2003;60(2): Mulder T, Donders A, Schoonderwaldt H, Hochstenbach J, van Limbeek J. Long term outcome after stroke : a disability-orientated approach. International Journal of Rehabilitation Research. 1996;19(3): Patel M, Tilling K, Lawrence E. Relationships between long-term stroke disability, handicap and health-related quality of life. Age and Ageing [H.W.Wilson - SSA]. 2006;35(3): Hankey G, Jamrozik K, Broadhurst R, Forbes S, Anderson C. Long-term disability after first-ever stroke and related prognostic factors in the Perth Community Stroke Study, Stroke. 2002;33(4): Hartman-Maeir A, Soroker N, Ring H, Avni N, Katz N. Activities, participation and satisfaction one-year post stroke. Disability & Rehabilitation. 2007;29(7): Ljungberg C, Hanson E, Lövgren M. A home rehabilitation program for stroke patients: a pilot study. Scand J Caring Sci. 2001(15): Bjorkdahl A, Nilsson A, Grimby G, Sunnerhagen K. Does a short period of rehabilitation in the home setting facilitate functioning after stroke? A randomized controlled trial. Clinical Rehabilitation. 2006;20: Gladman J, Forster A, Young J. Hospital and home based rehabilitation after discharge from hospital for stroke patients: analysis of two trials. Age Ageing. 1995;24: Mayo NE, Wood-Dauphinee S, Côté R, et al. There's no place like home : an evaluation of early supported discharge for stroke. Stroke; a journal of cerebral circulation. 2000;31(5): Mayo N, Wood-Dauphinee S, Côté R, et al. There's no place like home : an evaluation of early supported discharge for stroke. Stroke; a journal of cerebral circulation. 2000;31(5):
89 Hillier S, Inglis-Jassiem G. Rehabilitation for community-dwelling people with stroke: home or centre based? A systematic review. Int J Stroke 2010;5: Canadian Stroke Network. Cost of caring for stroke patients double that of earlier estimate, study finds. Canadian Stroke Congress Kwon S, Duncan P, Studenski S, Perera S, Lai S, Reker D. Measuring stroke impact with SIS: construct validity of SIS telephone administration. Qual Life Res. 2006;15: Mittman N, Seung S, Hill M, et al. Impact of disability status on ischemic stroke costs in Canada in the first year. Can J Neurol Sci. 2012; Krueger H, Lindsay P, Cote R, Kapral M, Kaczorowski J, Hill M. Cost avoidance associated with optimal stroke care in Canada. Stroke. 2012;43(8): Dawson J, Lees J, Chang T, et al. Association between disability measures and healthcare costs after initial treatment for acute stroke. Stroke. 2007;38(6): Kavanagh S, Knapp M, Patel A. Costs and disability among stroke patients. Journal of public health medicine. 1999;21(4): Martínez-Vila E, Irimia P. The Cost of Stroke. Cerebrovascular Diseases. 2003;17(Suppl. 1): Persson J, Ferraz-Nunes J, Karlberg I. Economic burden of stroke in a large county in Sweden. BMC health services research. 2012;12(1): Youman P, Wilson K, Harraf F, Kalra L. The Economic Burden of Stroke in the United Kingdom. PharmacoEconomics. 2003;21(Suppl. 1): Treger I, Shames J, Giaquinto S, Ring H. Return to work in stroke patients. Disability and Rehabilitation. 2007;29(17): Roderick P, Low J, Day R, et al. Stroke rehabilitation after hospital discharge: a randomized trial comparing domiciliary and day-hospital care. Age and Ageing. 2001;30(4): Gladman J, Whynes D, Lincoln N. Cost Comparison of Domiciliary and Hospital-based Stroke Rehabilitation. Age and Ageing. 1994;23(3): Community Care Access Centre. What we do. 2012; Accessed February, Moffa-Trotter M, Anemaet W. Cost effectiveness of home rehabilitation: a literature review. Topics in Geriatric Rehabilitation. 1999;14(4):1-33.
90 Drummond M, Sculpher M, Torrance G, O'Brien B, Stoddart G. Methods for the Economic Evaluation of Health Care Programmes. 3rd ed. New York: Oxford University Press; Roberts M, Russell L, Paltiel A, et al. Conceptualizing a model: a report of the ISPOR- SMDM Modeling Good Research Practices Task Force--2. Value in health : the journal of the International Society for Pharmacoeconomics and Outcomes Research. 2012;15(6): Dunet D. CDC Coffee Break: Introduction to Economic Evalution 2012; Accessed February 18, Neumann P, Goldie S, Weinstein M. Preference-based measures in economic evaluation in health care. Annual Review of Public Health. 2000;21: Canadian Agency for Drugs and Technologies in Health. Guidelines for the Economic Evaluation of Health Technologies: Canada. 2006; Accessed February, Sonnenberg F, Beck J. Markov Models in Medical Decision Making: A Practical Guide. Medical Decision Making. 1993;13(4): Briggs A, Weinstein M, Fenwick E, Karnon J, Sculpher M, Paltiel A. Model parameter estimation and uncertainty analysis: a report of the ISPOR-SMDM Modeling Good Research Practices Task Force Working Group-6. Medical decision making : an international journal of the Society for Medical Decision Making. 2012;32(5): Canadian Community Health Survey. Annual Component. Government of Canada; Magalhães R, Abreu P, Correia M, Whiteley W, Silva M, Sandercock P. Functional Status Three Months after the First Ischemic Stroke Is Associated with Long-Term Outcome: Data from a Community-Based Cohort. Cerebrovascular Diseases. 2014;38(1): Luengo-Fernandez R, Gray A, Bull L, et al. Quality of life after TIA and stroke: Ten-year results of the Oxford Vascular Study. Neurology. 2013;81(18): Luengo-Fernandez R, Paul N, Gray A, et al. Population-based study of disability and institutionalization after transient ischemic attack and stroke: 10-year results of the Oxford Vascular Study. Stroke. 2013;44(10):
91 Hardie K, Hankey G, Jamrozik K, Broadhurst R, Anderson C. Ten-year risk of first recurrent stroke and disability after first-ever stroke in the Perth Community Stroke Study. Stroke. 2004;35(3): Pham C, Caffrey O, Ben-Tovim D, Hakendorf P, Crotty M, Karnon J. Evaluating the effects of variation in clinical practice: a risk adjusted cost-effectiveness (RAC-E) analysis of acute stroke services. BMC Health Serv Res. 2012;12: Bayoumi A, John-Baptiste A, Hong Chen M, et al. The cost-effectiveness of prevention strategies for pressue ulcers in long-term care homes in Ontario: Projections of the Ontario Pressure Ulcer Model. Toronto Health Economics and Technology Assessment Collaborative; Statistics Canada. Consumer Price Index, health and personal care, by province. 2013; statcan gc ca/tables-tableaux/sum-som/l01/cst01/econ161g-eng htm. Accessed September, Dhamoon MS, Moon YP, Paik MC, et al. Long-term functional recovery after first ischemic stroke: the Northern Manhattan Study. Stroke. 2009;40(8): Salter K, Jutai J, Foley N, Bhogal S, Bayona N, Teasell R. Effect of time to rehabilitation on functional outcome in stroke. Journal of Rehabilitation Medicine. 2006;38(2): Kwakkel G, Kollen B. Predicting activities after stroke: what is clinically relevant? Int J Stroke. 2013;8(1): Organisation for Economic Co-operation and Development. OECD Better Life Index. 2015; Accessed March 10, Ehlers L, Andersen G, Clausen L, Bech M, Kjolby M. Cost-effectiveness of intravenous thrombolysis with alteplase within a 3-hour window after acute ischemic stroke. Stroke. 2007;38(1): Nguyen-Huynh M, Johnston S. Is mechanical clot removal or disruption a cost-effective treatment for acute stroke? AJNR. American journal of neuroradiology. 2011;32(2): Patil C, Long E, Lansberg M. Cost-effectiveness analysis of mechanical thrombectomy in acute ischemic stroke. Journal of neurosurgery. 2009;110(3): Boudreau D, Guzauskas G, Chen E, et al. Cost-effectiveness of recombinant tissue-type plasminogen activator within 3 hours of acute ischemic stroke: current evidence. Stroke. 2014;45(10):
92 Boudreau D, Guzauskas G, Villa K, Fagan S, Veenstra D. A model of cost-effectiveness of tissue plasminogen activator in patient subgroups 3 to 4.5 hours after onset of acute ischemic stroke. Annals of emergency medicine. 2013;61(1): Brusco N, Taylor N, Watts J, Shields N. Economic evaluation of adult rehabilitation: a systematic review and meta-analysis of randomized controlled trials in a variety of settings. Arch Phys Med Rehabil. 2014;95(1): e Saka O, Serra V, Samyshkin Y, McGuire A, Wolfe C. Cost-effectiveness of stroke unit care followed by early supported discharge. Stroke. 2009;40(1): Grieve R, Porsdal V, Hutton J, Wolfe C. A comparison of the cost-effectiveness of stroke care provided in London and Copenhagen. International journal of technology assessment in health care. 2000;16(2): Bowen A, Hesketh A, Patchick E, et al. Clinical effectiveness, cost-effectiveness and service users' perceptions of early, well-resourced communication therapy following a stroke: a randomised controlled trial (the ACT NoW Study). Health technology assessment (Winchester, England). 2012;16(26): Neumann P, Cohen J, Weinstein M. Updating cost-effectiveness--the curious resilience of the $50,000-per-QALY threshold. The New England journal of medicine. 2014;371(9): Marseille E, Larson E, Kazi D, Kahn J, Rosen S. Thresholds for the cost effectiveness of interventions: alternative approaches. Policy & Practice 2015; Employment and Social Development Canada. Financial Security - Standards of Living 2013; Accessed March, 2015.
93 82 Appendices Appendix 1: Participant Flow through CSRT Economic Study 212 CSRT Patients Referred 15 Control Patients Referred - Recruited after study end date (n=3) - Secondary Stroke/Discharged to LTC (n=1) - Did not have a stroke (n=3) - Passed away (n=2) - Unable to contact (n=6) - Declined to participate (n=30) - Unable to contact before February 2 8 th, 2013 (n=3) Total (n=48) - Declined to participate (n=2) - Unable to contact (n=1) - Did not meet inclusion criteria (n=1) - Discharged to LTC (n=1) Total (n=5) 164 CSRT Baseline Calls completed 10 Control Baseline Calls completed - Did not have a stroke (n=2) - Declined to continue (n=11) - Number not in service (n=2) - Unable to contact (n=15) - Passed away (n=3) - Scheduled for after July 31 st, 2013 (n=12) - Unable to contact before July 31 st, 2013 (n=9) - Discharged from team (n=1) - Declined CSRT services (n=1) Total (n = 56) - Declined to continue (n=1) - Number not in service (n=2) - Unable to contact (n=1) - Scheduled for after July 31 st, 2013 (n=2) Total (n = 6) 108 CSRT 6 Month Calls completed 4 Control 6 Month Calls completed - Declined to continue (n=3) - Unable to contact (n=1) - Unable to contact before July 31 st, 2013 (n=8) - Recurrent stroke (n=1) - Scheduled for after July 31 st, 2013 (n=58) Total (n=71) - Unable to contact before July 31 st, 2013 (n=4) Total (n=4) 37 CSRT 12 Month Calls Completed 0 Control 12 Month Calls Completed
94 83 Appendix 2: Breakdown of Costs for CSRT and No Therapy Cohorts (First two cycles) CSRT No Therapy Category Cycle Nondisabled Disabled Nondisabled Disabled CSRT Program Primary Health Care Other Health Services Lab Tests Hospitalizations Devices Household Help Travel *All costs in 2013 CAD
95 84 Appendix 3: Parameter values used in Markov model Costs and Utility Parameter Values Value Parameter Stage CSRT Nondisabled CSRT Disabled No Therapy Nondisabled No Therapy Disabled LTC Costs * ,520.39* * 10, ,520.39* 29, Utility *Truncated at final value
96 85 Transition Probability Parameter Values Stage CSRT Nondisabled to Disabled * CSRT Disabled to Nondisabled * No Therapy Nondisabled to Disabled * No Therapy Disabled to Nondisabled * Nondisabled to Death Nondisabled to LTC Disabled to Death Disabled to LTC LTC to Death 0.07* *Truncated at final value
97 Appendix 4: Model parameters One & two-way sensitivity analysis Parameter Cost Utilities Probabilities CSRT No Therapy CSRT No Therapy CSRT No Therapy *Ranges are 95% Confidence Intervals Point Estimate 95% CI Nondisabled $4769 $52, Disabled $9852 $43, LTC $29,905 $14,547, $43,643 Nondisabled $9032 $52, Disabled $10,761 $43, LTC $29,905 $14,547, $43,643 Nondisabled , 1.0 Disabled , 0.94 LTC , 0.69 Nondisabled , 1.0 Disabled , 1.0 LTC , 0.69 Nondisabled to Death , 0.27 Nondisabled to LTC , 0.21 Nondisabled to Disabled , 0.44 Disabled to Death , 0.36 Disabled to LTC , 0.48 Disabled to Nondisabled , 0.61 LTC to death , 0.57 Nondisabled to Death , 0.27 Nondisabled to LTC , 0.21 Nondisabled to 0.18 Disabled 0.0, 0.90 Disabled to Death , 0.36 Disabled to LTC , 0.48 Disabled to 0.06 Nondisabled 0.0, 0.41 LTC to death , 0.57
98 87 Appendix 5: Parameter distributions in the Probabilistic Sensitivity Analysis Parameter Cost Utilities Transition Probabilities CSRT No Therapy CSRT No Therapy CSRT Nondisabled Distribution Type Log Normal Point Estimate Variation SD of logs= 1.09 SD of logs= 1.08 SD of logs= 1.53 Log Normal 8.78 SD of logs= 0.95 Disabled SD of logs= 0.99 SD of logs= 1.7 LTC Log Normal 9.62 SD of logs= 1.15 Nondisabled Log Normal SD of logs= 0.97 SD of logs= 8.3 SD of logs= 1.53 Log Normal 8.38 SD of logs= 1.45 Disabled SD of logs= 1.44 SD of logs= 1.7 LTC Log Normal 9.62 SD of logs= 1.15 Nondisabled Beta 0.79 α= 7.30 β= 1.50 Disabled Beta 0.56 α= 3.91 β= 2.10 LTC Beta 0.36 α= 2.51 β= 4.46 Nondisabled Beta α= 7.30 β= 1.50 Disabled Beta 0.65 α= 3.91 β= 2.11 LTC Beta 0.36 α= 2.51 β= 4.46 Nondisabled to Death Nondisabled to LTC Nondisabled to Disabled Disabled to Death Disabled to LTC Disabled to Nondisabled Beta Beta Beta Beta Beta Beta α= α= α= α= α= β= β= Β= β= β= α= β= No Therapy LTC to death Beta 0.07 α= β= Nondisabled to Beta α= Death β= Nondisabled to Beta α= LTC β= Nondisabled to Beta α= β= Disabled

99 88 Appendix 6: EQ-5D-5L Health Questionnaire English version for Canada
100 89 Under each heading, please tick the ONE box that best describes your health TODAY MOBILITY I have no problems in walking about I have slight problems in walking about I have moderate problems in walking about I have severe problems in walking about I am unable to walk about SELF-CARE I have no problems washing or dressing myself I have slight problems washing or dressing myself I have moderate problems washing or dressing myself I have severe problems washing or dressing myself I am unable to wash or dress myself USUAL ACTIVITIES (e.g. work, study, housework, family or leisure activities) I have no problems doing my usual activities I have slight problems doing my usual activities I have moderate problems doing my usual activities I have severe problems doing my usual activities I am unable to do my usual activities PAIN / DISCOMFORT I have no pain or discomfort I have slight pain or discomfort I have moderate pain or discomfort I have severe pain or discomfort I have extreme pain or discomfort ANXIETY / DEPRESSION I am not anxious or depressed I am slightly anxious or depressed I am moderately anxious or depressed I am severely anxious or depressed I am extremely anxious or depressed
101 90 We would like to know how good or bad your health is TODAY. The best health you can imagine 100 This scale is numbered from 0 to means the best health you can imagine. 0 means the worst health you can imagine. Mark an X on the scale to indicate how your health is TODAY. Now, please write the number you marked on the scale in the box below YOUR HEALTH TODAY = The worst health you can imagine
102 91 Appendix 7: Stroke Impact Scale (*denotes question from SIS-16) Stroke Impact Scale VERSION 3.0 The purpose of this questionnaire is to evaluate how stroke has impacted your health and life. We want to know from YOUR POINT OF VIEW how stroke has affected you. We will ask you questions about impairments and disabilities caused by your stroke, as well as how stroke has affected your quality of life. Finally, we will ask you to rate how much you think you have recovered from your stroke.
103 92 Stroke Impact Scale These questions are about the physical problems which may have occurred as a result of your stroke. 1. In the past week, how would A lot of Quite a bit Some A little No you rate the strength of your... strength of strength strength strength strength at a. Arm that was most affected by your stroke? b. Grip of your hand that was most affected by your stroke? c. Leg that was most affected by your stroke? d. Foot/ankle that was most affected by your stroke? all
104 93 These questions are about your memory and thinking. 2. In the past week, how difficult Not A little Somewhat Very Extremely difficult at difficult difficult difficult difficult was it for you to... all a. Remember things that people just told you? b. Remember things that happened the day before? c. Remember to do things (e.g. keep scheduled appointments or take medication)? d. Remember the day of the week? e. Concentrate? f. Think quickly? g. Solve everyday problems?
105 94 These questions are about how you feel, about changes in your mood and about your ability to control your emotions since your stroke. 3. In the past week, how often did None of A little of Some of Most of All of the you... the time the time the time the time time a. Feel sad? b. Feel that there is nobody you are close to? c. Feel that you are a burden to others? d. Feel that you have nothing to look forward to? e. Blame yourself for mistakes that you made? f. Enjoy things as much as ever? g. Feel quite nervous? h. Feel that life is worth living? i. Smile and laugh at least once a day?
106 95 The following questions are about your ability to communicate with other people, as well as your ability to understand what you read and what you hear in a conversation. 4. In the past week, how difficult Not A little Somewhat Very Extremely difficult at difficult difficult difficult difficult was it to... all a. Say the name of someone who was in front of you? b. Understand what was being said to you in a conversation? c. Reply to questions? d. Correctly name objects? e. Participate in a conversation with a group of people? f. Have a conversation on the telephone? g. Call another person on the telephone, including selecting the correct phone number and dialing?
107 96 The following questions ask about activities you might do during a typical day. 5. In the past 2 weeks, how difficult Not difficult A little Somewhat Very Could not was it to... at all difficult difficult difficult do at all a. Cut your food with a knife and fork? b. Dress the top part of your body?* c. Bathe yourself?* d. Clip your toenails? e. Get to the toilet on time?* f. Control your bladder (not have an accident)?* g. Control your bowels (not have an accident)?* h. Do light household tasks/chores (e.g. dust, make a bed, take out garbage, do the dishes)? i. Go shopping?* j. Do heavy household chores (e.g vacuum, laundry or yard work)?*
108 97 The following questions are about your ability to be mobile, at home and in the community. 6. In the past 2 weeks, how difficult Not A little Somewhat Very Could was it to... difficult difficult at all difficult difficult not do at all a. Stay sitting without losing your balance?* b. Stay standing without losing your balance?* c. Walk without losing your balance?* d. Move from a bed to a chair?* e. Walk one block?* f. Walk fast?* g. Climb one flight of stairs?* h. Climb several flights of stairs? i. Get in and out of a car?*
109 98 The following questions are about your ability to use your hand that was MOST AFFECTED by your stroke. 7. In the past 2 weeks, how difficult Not A little Somewhat Very Could not was it to use your hand that was most difficult difficult difficult difficult do at all affected by your stroke to... at all a. Carry heavy objects (e.g. bag of groceries)?* b. Turn a doorknob? c. Open a can or jar? d. Tie a shoe lace? e. Pick up a dime?
110 99 The following questions are about how stroke has affected your ability to participate in the activities that you usually do, things that are meaningful to you and help you to find purpose in life. 8. During the past 4 weeks, how None of A little of Some of Most of All of the much of the time have you been the time the time the time the time time limited in... a. Your work (paid, voluntary or other) b. Your social activities? c. Quiet recreation (crafts, reading)? d. Active recreation (sports, outings, travel)? e. Your role as a family member and/or friend? f. Your participation in spiritual or religious activities? g. Your ability to control your life as you wish? h. Your ability to help others?
111 Stroke Recovery On a scale of 0 to 100, with 100 representing full recovery and 0 representing no recovery, how much have you recovered from your stroke? 100 Full Recovery

112 Appendix 8: Health and Social Services Utilization Survey 101
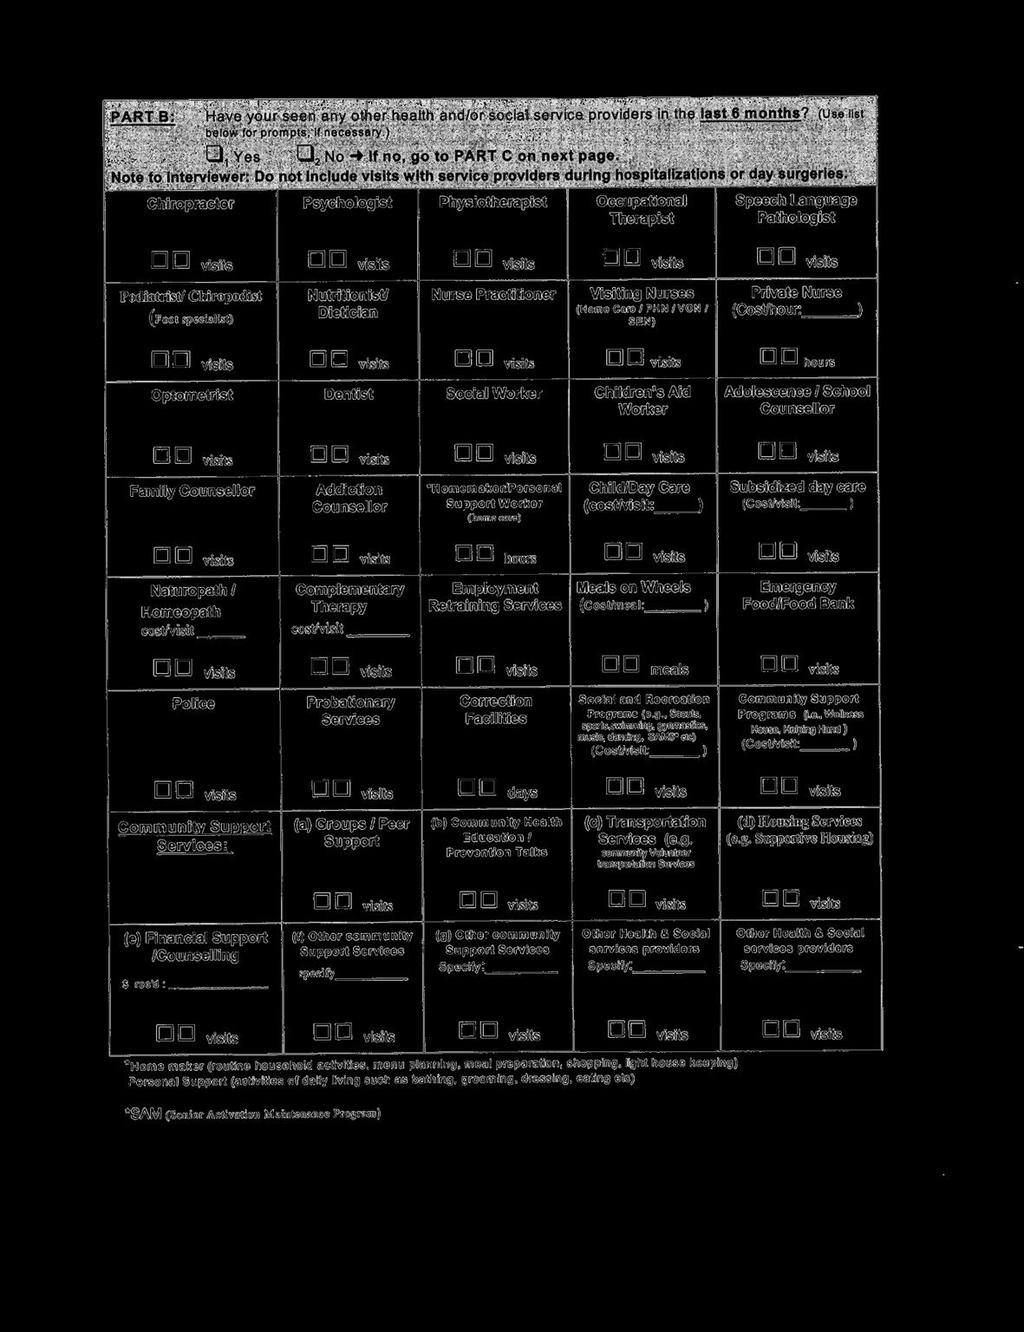
113 102

114 103

115 104

116 105

117 106

118 107

119 108

120 109
Final Report to the Ontario Stroke Network
 Final Report to the Ontario Stroke Network Laura Allen, M.Sc. (cand.) Marina Richardson M.Sc. Matthew Meyer, Ph.D. (cand.) Deb Willems, M.Sc. (PT) Robert Teasell, MD September 12 th, 2013 1 Table of Contents
Dave Ure, OT Reg. (Ont.), CPA, CMA Coordinator
, CPA, CMA Coordinator") Dave Ure, OT Reg. (Ont.), CPA, CMA Coordinator Development of the model In response to the request for proposal issued by the Ministry of Health and Long-Term Care in September 2001, the Southwestern Ontario
Dave Ure, OT Reg. (Ont.), CPA, CMA Coordinator Development of the model In response to the request for proposal issued by the Ministry of Health and Long-Term Care in September 2001, the Southwestern Ontario
Standards of excellence
 The Accreditation Canada Stroke Distinction program was launched in March 2010 to offer a rigorous and highly specialized process above and beyond the requirements of Qmentum. The comprehensive Stroke
Stroke Rehab Definitions Framework Self-Assessment Tool Acute Integrated Stroke Unit
 rth & East GTA Stroke Network Stroke Rehab Definitions Framework Self-Assessment Tool Acute Integrated Stroke Unit Purpose of the Self-Assessment Tool: The GTA Rehab Network and the GTA regions of the
GERIATRIC DAY HOSPITAL
 GERIATRIC DAY HOSPITAL MISSION To provide interdisciplinary assessment, consultation and rehabilitation services to community dwelling older adults and their families. To optimize their health and functional
Stroke Rehabilitation Pilot Project Southwestern Ontario. A Regional Stroke Rehabilitation System: From Vision to Reality
 Stroke Rehabilitation Pilot Project Southwestern Ontario A Regional Stroke Rehabilitation System: From Vision to Reality Submitted to: Ministry of Health and Long-Term Care December 2, 2004 Submitted by:
A thesis submitted in partial fulfillment of the requirements for the degree in Master of Science
 Western University Scholarship@Western Electronic Thesis and Dissertation Repository April 2017 Assessing the Impact of Caregiver Outcomes on Function and Reintegration of Stroke Survivors Participating
OUR BRAINS!!!!! Stroke Facts READY SET.
 HealthSouth Rehabilitation Hospital Huntington Dr. Timothy Saxe, Medical Director READY SET. OUR BRAINS!!!!! Stroke Facts 795,000 strokes each year- 600,000 new strokes 5.5 million stroke survivors Leading
OHTAC Recommendation
 OHTAC Recommendation Constraint-Induced Movement Therapy for Rehabilitation of Arm Dysfunction After Stroke in Adults. Presented to the Ontario Health Technology Advisory Committee in May 27, 2011 November
Hips & Knees Priority Action Team
 Hips & Knees Priority Action Team Current State Data Refresh September 5, 27 Overview Population Profile Health Status Utilization of Hip & Knee Total Joint Services 1 1 Population Profile 2 SouthWest
Needs Assessment and Plan for Integrated Stroke Rehabilitation in the GTA February, 2002
 Funding for this project has been provided by the Ministry of Health and Long-Term Care as part of the Ontario Integrated Stroke Strategy 2000. It should be noted that the opinions expressed are those
Comprehensive Service Level Audit of Stroke Care across the Continuum in Central LHIN March 31, 2013
 Comprehensive Service Level Audit of Stroke Care across the Continuum in Central LHIN March 31, 2013 Research Team: Paul Holyoke, Ph.D. Justine Toscan, M.Sc. Research funded by: This report was created
Evaluation of the functional independence for stroke survivors in the community
 Asian J Gerontol Geriatr 2009; 4: 24 9 Evaluation of the functional independence for stroke survivors in the community ORIGINAL ARTICLE CKC Chan Bsc, DWC Chan Msc, SKM Wong MBA, MAIS, BA, PDOT ABSTRACT
SPINAL CORD INJURY Rehab Definitions Framework Self-Assessment Tool Outpatient/ambulatory rehab Survey for Spinal Cord Injury (SCI)
") SPINAL CORD INJURY Rehab s Framework Self-Assessment Tool Outpatient/ambulatory rehab Survey for Spinal Cord Injury (SCI) INTRODUCTION: In response to a changing rehab landscape in which rehabilitation
SPINAL CORD INJURY Rehab s Framework Self-Assessment Tool Outpatient/ambulatory rehab Survey for Spinal Cord Injury (SCI) INTRODUCTION: In response to a changing rehab landscape in which rehabilitation
Summary of Fall Prevention Initiatives in the Greater Toronto Area (GTA)
") Summary of Fall Prevention Initiatives in the Greater Toronto Area (GTA) Purpose This summary serves as an accompanying document to the Inventory of Fall Prevention Initiatives in the GTA and provides
Summary of Fall Prevention Initiatives in the Greater Toronto Area (GTA) Purpose This summary serves as an accompanying document to the Inventory of Fall Prevention Initiatives in the GTA and provides
Community Stroke Rehabilitation Models in Ontario. Laura Allen
 Community Stroke Rehabilitation Models in Ontario Laura Allen 2016 Community Stroke Rehabilitation Models in Ontario Laura Allen, Project Lead Linda Kelloway, Ontario Stroke Network, Best Practice Leader
EMU A NEW MODEL OF EMERGENCY CARE FOR THE FRAIL & ELDERLY
 EMU A NEW MODEL OF EMERGENCY CARE FOR THE FRAIL & ELDERLY Geriatrics, General practice, Emergency medicine, Interface medicine SUMMARY An integrated, community emergency service specifically designed for
SPINAL CORD INJURY Rehab Definitions Framework Self-Assessment Tool inpatient rehab Survey for Spinal Cord Injury (SCI)
") SPINAL CORD INJURY Rehab s Framework Self-Assessment Tool inpatient rehab Survey for Spinal Cord Injury (SCI) INTRODUCTION: In response to a changing rehab landscape in which rehabilitation is offered
SPINAL CORD INJURY Rehab s Framework Self-Assessment Tool inpatient rehab Survey for Spinal Cord Injury (SCI) INTRODUCTION: In response to a changing rehab landscape in which rehabilitation is offered
Low Tolerance Long Duration (LTLD) Stroke Demonstration Project
 Stroke Demonstration Project") Low Tolerance Long Duration (LTLD) Stroke Demonstration Project Interim Summary Report October 25 Table of Contents 1. INTRODUCTION 3 1.1 Background.. 3 2. APPROACH 4 2.1 LTLD Stroke Demonstration Project
Low Tolerance Long Duration (LTLD) Stroke Demonstration Project Interim Summary Report October 25 Table of Contents 1. INTRODUCTION 3 1.1 Background.. 3 2. APPROACH 4 2.1 LTLD Stroke Demonstration Project
Report into the Impact of ACFI on Resident Care
 Report into the Impact of ACFI on Resident Care 2014 Foreword Prior to March 2008, Residential Aged Care Facilities (RACFs) received no direct funding for physiotherapy interventions. Physiotherapists
restoring hope rebuilding lives
 Spinal Cord Injury Brain Injury Stroke Neurologic Diseases Orthopedic Conditions Amputation Cancer Cardiac Recovery The patient experience: 2015 in review restoring hope rebuilding lives Advancing care
Critical Review: Group Therapy for Post-Stroke Aphasia Rehabilitation
 Critical Review: Group Therapy for Post-Stroke Aphasia Rehabilitation Kristina Howatt Gerber M.Cl.Sc SLP Candidate University of Western Ontario: School of Communication Sciences and Disorders This critical
Transitions in Mental Health
 Transitions in Mental Health Slide 1: This PowerPoint focuses on mental health and how the concepts are applicable across many different populations and life span transitions. Slide 2: There are many lifestyle
CRITICALLY APPRAISED PAPER (CAP)
") CRITICALLY APPRAISED PAPER (CAP) Dahl, A., Askim, T., Stock, R., Langørgen, E., Lydersen, S., & Indredavik, B. (2008). Short- and long-term outcome of constraint-induced movement therapy after stroke:
CRITICALLY APPRAISED PAPER (CAP) Dahl, A., Askim, T., Stock, R., Langørgen, E., Lydersen, S., & Indredavik, B. (2008). Short- and long-term outcome of constraint-induced movement therapy after stroke:
Implementing Best Practice Rehabilitative Care for Patients with Hip Fracture & Total Joint Replacement
 Implementing Best Practice Rehabilitative Care for Patients with Hip Fracture & Total Joint Replacement A Toolkit for Implementing the RCA s TJR and Hip Fracture Best Practice Frameworks January 2018 Purpose
N&E GTA Stroke Region & Network Stakeholder Summary of Rehabilitation Standards Survey
 N&E GTA Region & Network Stakeholder Summary of ilitation Standards Survey This document provides a summary of the data from the Regional Partner Self Assessment Tool developed and administered by the
A Family Affair: Effects of Brain Injury on Family Dynamics
 A Family Affair: Effects of Brain Injury on Family Dynamics Dr. Kyle Haggerty, PhD By: Kyle Haggerty Bancroft NeuroRehab TBI Stats The Centers for Disease Control and Prevention reported that in 2010 that
Functional Independent Recovery among Stroke Patients at King Hussein Medical Center
 Functional Independent Recovery among Stroke Patients at King Hussein Medical Center Ali Al-Hadeed MD*, Amjad Banihani MD**, Tareq Al-Marabha MD* ABSTRACT Objective: To describe the functional independent
National Stroke Association s Guide to Choosing Stroke. Rehabilitation Services
 National Stroke Association s Guide to Choosing Stroke Rehabilitation Services Rehabilitation, often referred to as rehab, is an important part of stroke recovery. Through rehab, you: Re-learn basic skills
Stroke Network. Stroke Rehabilitation Unit Orientation
 Stroke Network Stroke Rehabilitation Unit Orientation 2016 Stroke Network Stroke Rehabilitation Unit Orientation 2016 Introduction This program is an initiative made available to nurses in Southwestern
$1.4 Million Allocated to Cardiac Rehabilitation Services!
 $1.4 Million Allocated to Cardiac Rehabilitation Services! Cardiac Rehabilitation in New Brunswick- A Province on the Move! Background The incidence of cardiovascular disease (CVD) in New Brunswick (NB)
Rehabilitation - Reducing costs and hospital stay. Dr Elizabeth Aitken Consultant Physician
 Rehabilitation - Reducing costs and hospital stay Dr Elizabeth Aitken Consultant Physician What factors affect outcome? Comorbidities Cardiac Respiratory Neurological Nutritional issues Diabetes Anaemia
Ontario s Seniors Strategy: Where We Stand. Where We Need to Go
 Ontario s Seniors Strategy: Where We Stand. Where We Need to Go Dr. Samir K. Sinha MD, DPhil, FRCPC Provincial Lead, Ontario s Seniors Strategy Director of Geriatrics Mount Sinai and the University Health
PURPOSE OF THE SELF-ASSESSMENT TOOLS:
 Pulmonary Rehab s Framework Self-Assessment Tool Inpatient Rehab Survey for Pulmonary Rehab INTRODUCTION: In response to a changing rehab landscape in which rehabilitation is offered in many different
Outcomes in GEM models of geriatric care: How do we measure success? Disclosure. Objectives. Geriatric Grand Rounds
 Geriatric Grand Rounds Tuesday, October 7, 2008 12:00 noon Dr. Bill Black Auditorium Glenrose Rehabilitation Hospital Outcomes in GEM models of geriatric care: How do we measure success? In keeping with
NATIONAL REHABILITATION HOSPITAL SPINAL CORD SYSTEM OF CARE (SCSC) OUTPATIENT SCOPE OF SERVICE
 OUTPATIENT SCOPE OF SERVICE") NATIONAL REHABILITATION HOSPITAL SPINAL CORD SYSTEM OF CARE (SCSC) OUTPATIENT SCOPE OF SERVICE Introduction: The Spinal Cord System of Care (SCSC) at the National Rehabilitation Hospital (NRH) provides
NATIONAL REHABILITATION HOSPITAL SPINAL CORD SYSTEM OF CARE (SCSC) OUTPATIENT SCOPE OF SERVICE Introduction: The Spinal Cord System of Care (SCSC) at the National Rehabilitation Hospital (NRH) provides
COUNTRY REPORT OF VIET NAM AT THE 12 TH ASEAN & JAPAN HIGH LEVEL OFFICIALS MEETING ON CARING SOCIETIES
 COUNTRY REPORT OF VIET NAM AT THE 12 TH ASEAN & JAPAN HIGH LEVEL OFFICIALS MEETING ON CARING SOCIETIES 21-23 OCTOBER 2014 I. AGEING POPULATION IN VIETNAM 1. Vietnam is one of 10 countries with the world
Quality of Life after. A Critical Illness: A review of the literature
 1 Quality of Life after A Critical Illness: A review of the literature 1998 2003 by Harriet Adamson BN MAdEd A Thesis submitted in fulfillment of the requirements for the degree Master of Nursing (Honours)
CRITICALLY APPRAISED PAPER (CAP)
") CRITICALLY APPRAISED PAPER (CAP) Desrosiers, J., Noreau, L., Rochette, A., Carbonneau, H., Fontaine, L., Viscogliosi, C., & Bravo, G. (2007). Effect of a home leisure education program after stroke: A
CRITICALLY APPRAISED PAPER (CAP) Desrosiers, J., Noreau, L., Rochette, A., Carbonneau, H., Fontaine, L., Viscogliosi, C., & Bravo, G. (2007). Effect of a home leisure education program after stroke: A
2016 Report Card Gwen Neilsen Anderson Rehabilitation Center Inpatient Rehabilitation Unit. stlukesonline.org
 2016 Report Card Gwen Neilsen Anderson Rehabilitation Center Inpatient Rehabilitation Unit stlukesonline.org Why the Gwen Neilsen Anderson Rehabilitation Center? The Gwen Neilsen Anderson Rehabilitation
SW LHIN Stroke Capacity Assessment and Best Practice Implementation Project. Presenters: IDEAS Applied Learning Project
 SW LHIN Stroke Capacity Assessment and Best Practice Implementation Project Presenters: Paula Gilmore (Southwestern Ontario Stroke Network) Kelly Simpson (South West LHIN) IDEAS Participants: Cathy Vandersluis,
I tell my patients, If I can do it, you can do it. Lea Stewart
 I tell my patients, If I can do it, you can do it. Lea Stewart Baylor Institute for Rehabilitation Lea Stewart A traffic accident threw Lea Stewart around the back of a pick-up truck, leaving the life-long
ASSESS & RESTORE SHARED PROVINCIAL INDICATORS AND TECHNICAL SPECIFICATIONS
 Shared Provincial s & ASSESS & RESTORE SHARED PROVINCIAL INDICATORS AND TECHNICAL SPECIFICATIONS January 2018 0 P a g e J a n u a r y 2 0 1 8 Shared Provincial s & BACKGROUND To evaluate the impact of
Division of Medicine. Department of Geriatric Medicine. Staff. Jerry Ciocon, M.D., F.A.C.P., F.A.C.A., A.G.S.F. Diana J. Galindo, M.D.
 Division of Medicine Department of Geriatric Medicine Staff Jerry Ciocon, M.D., F.A.C.P., F.A.C.A., A.G.S.F. Diana J. Galindo, M.D. 1 Chairman s Letter We are all getting older, and providing the care
NATIONAL REHABILITATION HOSPITAL (NRH) THE SPINAL CORD SYSTEM OF CARE (SCSC) PROGRAMME INPATIENT SCOPE OF SERVICE
 THE SPINAL CORD SYSTEM OF CARE (SCSC) PROGRAMME INPATIENT SCOPE OF SERVICE") NATIONAL REHABILITATION HOSPITAL (NRH) THE SPINAL CORD SYSTEM OF CARE (SCSC) PROGRAMME INPATIENT SCOPE OF SERVICE NATIONAL REHABILITATION HOSPITAL SCOPE OF SERVICE FOR THE SPINAL CORD SYSTEM OF CARE PROGRAMME
NATIONAL REHABILITATION HOSPITAL (NRH) THE SPINAL CORD SYSTEM OF CARE (SCSC) PROGRAMME INPATIENT SCOPE OF SERVICE NATIONAL REHABILITATION HOSPITAL SCOPE OF SERVICE FOR THE SPINAL CORD SYSTEM OF CARE PROGRAMME
THE IMPACT OF MOVING TO STROKE REHABILITATION BEST PRACTICES IN ONTARIO FINAL REPORT
 THE IMPACT OF MOVING TO STROKE REHABILITATION BEST PRACTICES IN ONTARIO FINAL REPORT eference Group 9/10/2012 ACKNOWLEDGEMENTS This study was supported by the Institute for Clinical Evaluative Sciences
Healthy Body, Healthy Mind
 Volume 3 Spring 2016 The Firelands S.P.O.T. Inside this issue: 2 Speech Therapy Corner REPORT 3 Physical Therapy Corner Your quarterly guide to new information, insights, and events from Speech, Physical,
PREVIOUS EMPLOYMENT. Associate OT : CJ Occupational Therapy * Assessment and treatment for adults with neurological conditions
 CURRICULUM VITAE Katie Hanagarth Green Owl Therapy Office 3, 36 Greenhill Street Stratford-upon-Avon CV37 6LE Tel: 01789 413960 / 07966 573317 Email: katie@greenowltherapy.co.uk - Web: www.greenowltherapy.co.uk
I tell my patients, If I can do it, you can do it. Lea Stewart
 I tell my patients, If I can do it, you can do it. Lea Stewart Baylor Institute for Rehabilitation Lea Stewart A traffic accident threw Lea Stewart around the back of a pick-up truck, leaving the life-long
General Medical Rehabilitation
 General Medical Rehabilitation Outcomes Report 20 Rehabilitation Hospital is part of the Rehabilitation system of care, a post-acute provider of neuro-rehabilitation for over 45 years. Our 160-bed acute,
Provincial Interprofessional Stroke Core Competency Framework with a TR Focus
 Provincial Interprofessional Stroke Core Competency Framework with a TR Focus Thursday June 1st, 2017 3:00 4:00 p.m. T14 Provincial TR Stroke Core Competencies Presenters Keli Cristofaro R/TRO Stroke Community
Casa Colina Centers for Rehabilitation: A unique physician-directed model of care that works
 Casa Colina Centers for Rehabilitation: A unique physician-directed model of care that works Emily R. Rosario, PhD Why is Casa Colina unique? Continuum of care offering medical and rehabilitation services
Neurodegenerative diseases Includes multiple sclerosis, Parkinson s disease, postpolio syndrome, rheumatoid arthritis, lupus
 TIRR Memorial Hermann is a nationally recognized rehabilitation hospital that returns lives interrupted by neurological illness, trauma or other debilitating conditions back to independence. Some of the
Long-Term Care Home Financial Policy
 Ministry of Health and Long-Term Care Long-Term Care Home Financial Policy Contact : Policy: LTCH Physiotherapy Funding Policy Original Publish Date August 1, 2013 Amended on: April 1, 2015 PHYSIOTHERAPY
This Year in Review highlights some of the many initiatives undertaken within each strategic direction.
 This year s Annual Achievement Report provides a high level overview of the many successes in Toronto s stroke system. Through strategic leadership, the North & East GTA and the Toronto West Stroke Networks
Ministry of Children and Youth Services. Follow-up to VFM Section 3.01, 2013 Annual Report RECOMMENDATION STATUS OVERVIEW
 Chapter 4 Section 4.01 Ministry of Children and Youth Services Autism Services and Supports for Children Follow-up to VFM Section 3.01, 2013 Annual Report RECOMMENDATION STATUS OVERVIEW # of Status of
Why New Thinking is Needed for Older Adults across the Rehabilitation Continuum
 Why New Thinking is Needed for Older Adults across the Rehabilitation Continuum Samir K. Sinha MD, DPhil, FRCPC Director of Geriatrics Mount Sinai and the University Health Network Hospitals Assistant
GRADE Tables and Summary of Findings for the recommendations of Rehabilitation in health systems
 GRADE Tables and Summary of Findings for the recommendations of Rehabilitation in health systems REHABILITATION SERVICE DELIVERY For the following PICO questions, Population includes any person who requires
Mood Disorders Society of Canada Mental Health Care System Study Summary Report
 Mood Disorders Society of Canada Mental Health Care System Study Summary Report July 2015 Prepared for the Mood Disorders Society of Canada by: Objectives and Methodology 2 The primary objective of the
The Burden of Chronic Pain
 When Pain Won t t Go Away Then what? An evaluation of Acceptance Commitment Therapy (ACT( ACT) ) in a pain management program using Program Assessment Tool (PAT) Marion Swetenham, Clinical Psychologist,
Inpatient Rehab in Acute Care or Rehab Hospitals* Dedicated Rehab Unit
 Outpatient & Community I n p a t I e n t Institutional Setting Inpatient Rehab in Acute Care or Rehab Hospitals* Acute Care Integrated Specialized Units Transitional Care in Acute Care, LTC or CCC Not
October 22, N Mittmann, SJ Seung, M Sharma, BURST Investigators
 October 22, 2009 N Mittmann, SJ Seung, M Sharma, BURST Investigators Objectives To understand the burden of stroke To describe a prospective study evaluating stroke resources To understand the relationship
Human and Fiscal Implications of Heart Disease and Stroke
 1 Texas Council on Cardiovascular Disease and Stroke Report for the 84 th Regular Texas Legislative Session Heart Disease and Stroke in Texas: A Call to Action Enacted by the 76 th Legislature (House Bill
Champlain Assessment/Outcome Measures Forum February 22, 2010
 Champlain Assessment/Outcome Measures Forum February 22, 2010 Welcome Table Configurations Each table has a card with the name of the discipline(s) and the mix of professions Select the discipline of interest
Case studies: palliative care in Vital Signs 2014: The State of Safety and Quality in Australian Health Care
 University of Wollongong Research Online Australian Health Services Research Institute Faculty of Business 2014 Case studies: palliative care in Vital Signs 2014: The State of Safety and Quality in Australian
Of those with dementia have a formal diagnosis or are in contact with specialist services. Dementia prevalence for those aged 80+
 Dementia Ref HSCW 18 Why is it important? Dementia presents a significant and urgent challenge to health and social care in County Durham, in terms of both numbers of people affected and the costs associated
Neurological Alliance of Ireland Pre-Budget Submission 2018
 Neurological Alliance of Ireland Pre-Budget Submission 2018 1 The Neurological Alliance of Ireland (NAI) is asking the Government to support people with neurological conditions in Ireland in the Budget
Aiming for Excellence in Stroke Care
 Training Centre in Sub-acute Care (TRACS WA) Aiming for Excellence in Stroke Care A tool for quality improvement in stroke care Developed by TRAining Centre in Subacute Care (TRACS WA) February 2016 For
Inputs from Medical Unit, Ministry of Social Security and Ministry of Health Mauritius1
 1. In your country/region, how is long-term care for older persons defined and provided for in legal and policy frameworks? What types of support and service are covered? Long term care for older persons
Can occupational therapy intervention focused on activities of daily living increase quality of life in people who have had a stroke?
 Pacific University CommonKnowledge Physical Function CATs OT Critically Appraised Topics 2008 Can occupational therapy intervention focused on activities of daily living increase quality of life in people
Background. Ready 4 Rehabilitation in AHS
 Ready 4 Rehabilitation in AHS Ready 4 Rehabilitation in all Foundational Strategies: 1. Our Patients 2. Our People 3. Research & Innovation 4. Information Management & Technology Background Albertans want
THE ESSENTIAL BRAIN INJURY GUIDE
 THE ESSENTIAL BRAIN INJURY GUIDE Outcomes Section 9 Measurements & Participation Presented by: Rene Carfi, LCSW, CBIST Senior Brain Injury Specialist Brain Injury Alliance of Connecticut Contributors Kimberly
Northeast Rehabilitation Hospital Network
 Northeast Rehabilitation Hospital Network Rebuilding lives through hope, compassion and dedication to excellence NORTHEAST REHABILITATION HOSPITAL NETWORK www.northeastrehab.com Northeast Rehab Hospital
Specialty Rehabilitation Fact Sheet
 TIRR Memorial Hermann is a nationally recognized rehabilitation hospital that returns lives interrupted by neurological illness, trauma or other debilitating conditions back to independence. Some of the
NZ Organised Stroke Rehabilitation Service Specifications (in-patient and community)
") NZ Organised Stroke Rehabilitation Service Specifications (in-patient and community) Prepared by the National Stroke Network to outline minimum and strongly recommended standards for DHBs. Date: December
NZ Organised Stroke Rehabilitation Service Specifications (in-patient and community) Prepared by the National Stroke Network to outline minimum and strongly recommended standards for DHBs. Date: December
Overview Stroke Post Acute Episode of Care
 Overview Stroke Post Acute Episode of Care Dr. Mark Bayley Dr. Leanne Casaubon OSN Forum January 9, 2015 Key Principles The scope of the handbook includes both hospital care and post acute, community care
Neurodegenerative diseases Includes multiple sclerosis, Parkinson s disease, postpolio syndrome, rheumatoid arthritis, lupus
 TIRR Memorial Hermann is a nationally recognized rehabilitation hospital that returns lives interrupted by neurological illness, trauma or other debilitating conditions back to independence. Some of the
Background: Traditional rehabilitation after total joint replacement aims to improve the muscle strength of lower limbs,
 REVIEWING THE EFFECTIVENESS OF BALANCE TRAINING BEFORE AND AFTER TOTAL KNEE AND TOTAL HIP REPLACEMENT: PROTOCOL FOR A SYSTEMATIC RE- VIEW AND META-ANALYSIS Background: Traditional rehabilitation after
ACTIVE TAMESIDE STRATEGY, GROWTH AND DEVELOPMENT
 Report to: HEALTH AND WELLBEING BOARD Date: 19 January 2017 Board Member / Reporting Officer: Subject: Report Summary: Recommendations: Links to Health and Wellbeing Strategy: Policy Implications: Financial
LIFE-CHANGING CARE INPATIENT CARE
 LIFE-CHANGING CARE INPATIENT CARE Helping Patients Get the Most out of Rehab When a stroke, accident or other traumatic incident turns a person s world upside down, there s a place in Indiana where he
Criteria for Registering as a Developmental Paediatrician
 Criteria for Registering as a Developmental Paediatrician A doctor can apply to be registered as a Developmental Paediatrician if he/she fulfils ALL the following requirements: 1 A recognised basic medical
Surgery saved my life. Rehab is restoring my future.
 The Best Way Back Baylor Institute for Rehabilitation offers care for the most challenging and medically complex patients, including those with traumatic brain injury, traumatic spinal cord injury and
Inpatient Acute Rehabilitation
 Inpatient Acute Rehabilitation A massive stroke. A major illness. A debilitating injury. At first, you can t imagine how life will ever be the same. Affiliated with the renowned Dignity Health Neurological
ARE STROKE UNITS COST EFFECTIVE? EVIDENCE FROM A NEW ZEALAND STROKE INCIDENCE AND POPULATION-BASED STUDY
 ARE STROKE UNITS COST EFFECTIVE? EVIDENCE FROM A NEW ZEALAND STROKE INCIDENCE AND POPULATION-BASED STUDY Braden Te Ao, Ph.D. Centre for Health Services Research & Policy, University of Auckland, National
Geriatric Emergency Management PLUS Program Costing Analysis at the Ottawa Hospital
 Geriatric Emergency Management PLUS Program Costing Analysis at the Ottawa Hospital Regional Geriatric Program of Eastern Ontario March 2015 Geriatric Emergency Management PLUS Program - Costing Analysis
A snapshot of inpatient oncology rehabilitation: Patient profiles and rehab outcomes Rehabilitation Rounds, University of Toronto April 5, 2012
 A snapshot of inpatient oncology rehabilitation: Patient profiles and rehab outcomes Rehabilitation Rounds, University of Toronto April 5, 2012 Sara McEwen, PT, PhD Research Scientist, St. John s Rehab
Behavioural Symptoms of Dementia
 Quality Standards Behavioural Symptoms of Dementia Care for Patients in Hospitals and Residents in Long-Term Care Homes Let s make our health system healthier Summary This quality standard addresses care
The Hand Hub. Mary P Galea Departments of Medicine and Rehabilitation Medicine (Royal Melbourne Hospital) The University of Melbourne
 The University of Melbourne") The Hand Hub Mary P Galea Departments of Medicine and Rehabilitation Medicine (Royal Melbourne Hospital) The University of Melbourne What prompted this project? 30%-60% of stroke survivors fail to regain
The Hand Hub Mary P Galea Departments of Medicine and Rehabilitation Medicine (Royal Melbourne Hospital) The University of Melbourne What prompted this project? 30%-60% of stroke survivors fail to regain
December 1, 2014 Webinar: Draft Definitions Framework for Community Based Levels of Rehabilitative Care Presenters: Charissa Levy, Executive Director
 December 1, 2014 Webinar: Draft Definitions Framework for Community Based Levels of Rehabilitative Care Presenters: Charissa Levy, Executive Director Sue Balogh, Project Manager Webinar Overview 1. Welcome
Comprehensive Assessment of the Frail Older Patient
 Comprehensive Assessment of the Frail Older Patient Executive Summary Comprehensive geriatric assessment (CGA) is a multidimensional and usually interdisciplinary diagnostic process designed to determine
Please make sure that you complete a self-assessment survey for each type of rehab program that your organization provides.
 Oncology Rehab s Framework Self-Assessment Tool Inpatient Rehab Survey for Oncology Rehab INTRODUCTION: In response to a changing rehab landscape in which rehabilitation is offered in many different settings
Spring 2011: Central East LHIN Options paper developed
 Glenna Raymond, Chair, RSGS Governance Authority Victoria van Hemert, RSGS Executive Director 1 Spring 2011: Central East LHIN Options paper developed Called for new entity to oversee and improve the coordination
Public Policy Agenda 2016
 Public Policy Agenda 2016 1 in 26 Americans will have epilepsy over the course of their lifetime. Nearly three million children and adults in the United States have epilepsy. Epilepsy is defined as an
Occupational therapy after stroke
 Call the Stroke Helpline: 0303 3033 100 or email: info@stroke.org.uk Occupational therapy after stroke This guide explains how occupational therapy can help your recovery and rehabilitation after a stroke.
Neurodegenerative Diseases, Debilitating Conditions and Multiple Trauma Program (Neuromuscular Rehab)
") Neurodegenerative Diseases, Debilitating Conditions and Multiple Trauma Program (Neuromuscular Rehab) TIRR Memorial Hermann is a nationally recognized rehabilitation hospital that returns lives interrupted
Neurodegenerative Diseases, Debilitating Conditions and Multiple Trauma Program (Neuromuscular Rehab) TIRR Memorial Hermann is a nationally recognized rehabilitation hospital that returns lives interrupted
Core Competencies for Peer Workers in Behavioral Health Services
 Core Competencies for Peer Workers in Behavioral Health Services Category I: Engages peers in collaborative and caring relationships This category of competencies emphasized peer workers' ability to initiate
Copyright is owned by the Author of the thesis. Permission is given for a copy to be downloaded by an individual for the purpose of research and
 Copyright is owned by the Author of the thesis. Permission is given for a copy to be downloaded by an individual for the purpose of research and private study only. The thesis may not be reproduced elsewhere
MSK Rehab Definitions Framework - hip fractures Self assessment Survey Outpatient Rehab
 MSK Rehab Definitions Framework - hip fractures Self assessment Survey Outpatient Rehab In response to a changing rehab landscape in which rehabilitation is offered in many different settings with variations
CRITICALLY APPRAISED PAPER (CAP)
") CRITICALLY APPRAISED PAPER (CAP) Logan, D. E., Carpino, E. A., Chiang, G., Condon, M., Firn, E., Gaughan, V. J.,... Berde, C. B. (2012). A day-hospital approach to treatment of pediatric complex regional
CRITICALLY APPRAISED PAPER (CAP) Logan, D. E., Carpino, E. A., Chiang, G., Condon, M., Firn, E., Gaughan, V. J.,... Berde, C. B. (2012). A day-hospital approach to treatment of pediatric complex regional
AdvaMed Medtech Value Assessment Framework in Practice
 AdvaMed Medtech Value Assessment Framework in Practice Application of the Medtech Value Assessment Framework to Cymedica s e-vive System Value Framework Overview In response to the growing need to demonstrate