Statistics 571: Statistical Methods Summer 2003 Final Exam Ramón V. León
|
|
|
- Claud Sullivan
- 5 years ago
- Views:
Transcription
1 Name: Statistics 571: Statistical Methods Summer 2003 Final Exam Ramón V. León This exam is closed-book and closed-notes. However, you can use up to twenty pages of personal notes as an aid in answering your questions. Please be concise in your answers 1. Suppose you have a sample of 25 measurements and you wish to estimate the standard error of the sample median. How would you use the bootstrap procedure to do this? 2. Under what circumstances would one prefer to use the Spearman s or Kendall s rank correlation coefficient over the Pearson correlation coefficient? 3. For what type of statistical problem would one use the Kruskal-Wallis test? How about the Friedman test? 4. One can test that the median of distribution has a given value using either the sign test or the Wilcoxon signed rank test. What added assumption about the distribution of the observations is needed to use the Wilcoxon signed rank test?
, which had three settings, and the welding time (total time of the")
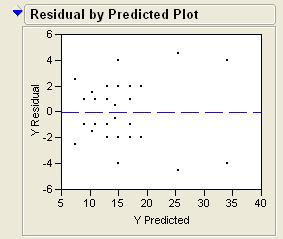
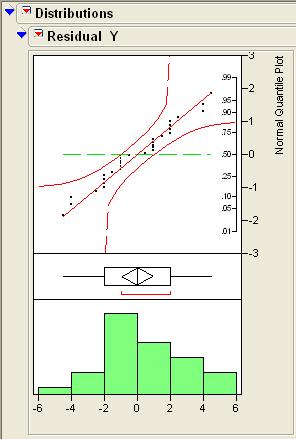
2 5. An experiment was conducted to investigate the strength of a weld in a steel bar. Two factors were varied: the gauge bar setting (the distance the well die travels during the automatic weld cycle), which had three settings, and the welding time (total time of the automatic weld cycle), which was fixed at five levels. The weld strength data are shown in the JMP table below:


3 Interpret the following JMP output: (Comment next to the JMP outputs)
4
5 6. Explain why the experiment described in Question 5 above is a Completely Randomized Design (CRD) rather than a Randomized Block Design (RBD). What assumptions is one making about the order in which the thirty experimental runs were made? 7. In the multiple comparison of means what is the difference in the type I error rate between the least significance difference (LSD) method and the Tukey method? 8. Why does a Variance Inflation Factor (VIF) greater than ten indicate the presence of multicollinearity?
6 9. What is the difference between an outlier and an influential observation? What methods are used to use to tell if one has an outlier or an influential observation? 10. Explain what is the prediction error sum of squares (PRESS) and how it is used? 11. Explain the difference between the two sampling models used in two-way count data. 12. In the univariate continuous distribution context what is difference between a confidence interval, a prediction interval, and a tolerance interval?
7 13. Hospitals are graded based on their success rates in treating different categories of patients. We want to compare two hospitals A, which is a university affiliated research hospital, and B, which is a general community hospital with respect to success rates for a certain complicated surgery. The data classified by low risk patients and high risk patients are shown in the following table. Low Risk High Risk Success Failure Total Success Failure Total Hospital A Hospital A Hospital B Hospital B Total Total a. Calculate the success rates for each category of patients for both hospitals. Which hospital is better? Success Rates Hospital Low High A B b. Aggregate the data over the two categories of patients and calculate the overall success rates for both hospitals. Now which hospital is better? Hospital A B Success Rate c. Explain the discrepancy between the results obtained in (a) and (b). d. What are the adjusted (standardized) success rates for each hospital? Success Rates Risk Hospital A Hospital B Total Low High 80% 20% 60% 10%
8 14. A sample of employed men aged 18 and 67 were asked if they had carried out work on their home in the preceding year for which they would have previously employed a craftsman. The following table gives the summary of responses of 906 homeowners. Age Work Home Repair < Row Total Skilled Yes No Unskilled Yes No Office Yes No Column Totals How would you analyze these data if you are interested in determining if home repair and age are associated?
isc ove ring i Statistics sing SPSS
 isc ove ring i Statistics sing SPSS S E C O N D! E D I T I O N (and sex, drugs and rock V roll) A N D Y F I E L D Publications London o Thousand Oaks New Delhi CONTENTS Preface How To Use This Book Acknowledgements
What you should know before you collect data. BAE 815 (Fall 2017) Dr. Zifei Liu
 Dr. Zifei Liu") What you should know before you collect data BAE 815 (Fall 2017) Dr. Zifei Liu Zifeiliu@ksu.edu Types and levels of study Descriptive statistics Inferential statistics How to choose a statistical test
What you should know before you collect data BAE 815 (Fall 2017) Dr. Zifei Liu Zifeiliu@ksu.edu Types and levels of study Descriptive statistics Inferential statistics How to choose a statistical test
STA 3024 Spring 2013 EXAM 3 Test Form Code A UF ID #
 STA 3024 Spring 2013 Name EXAM 3 Test Form Code A UF ID # Instructions: This exam contains 34 Multiple Choice questions. Each question is worth 3 points, for a total of 102 points (there are TWO bonus
Statistics as a Tool. A set of tools for collecting, organizing, presenting and analyzing numerical facts or observations.
 Statistics as a Tool A set of tools for collecting, organizing, presenting and analyzing numerical facts or observations. Descriptive Statistics Numerical facts or observations that are organized describe
SUMMER 2011 RE-EXAM PSYF11STAT - STATISTIK
 SUMMER 011 RE-EXAM PSYF11STAT - STATISTIK Full Name: Årskortnummer: Date: This exam is made up of three parts: Part 1 includes 30 multiple choice questions; Part includes 10 matching questions; and Part
Correlation and Regression
 Dublin Institute of Technology ARROW@DIT Books/Book Chapters School of Management 2012-10 Correlation and Regression Donal O'Brien Dublin Institute of Technology, donal.obrien@dit.ie Pamela Sharkey Scott
Analysis and Interpretation of Data Part 1
 Analysis and Interpretation of Data Part 1 DATA ANALYSIS: PRELIMINARY STEPS 1. Editing Field Edit Completeness Legibility Comprehensibility Consistency Uniformity Central Office Edit 2. Coding Specifying
CHILD HEALTH AND DEVELOPMENT STUDY
 CHILD HEALTH AND DEVELOPMENT STUDY 9. Diagnostics In this section various diagnostic tools will be used to evaluate the adequacy of the regression model with the five independent variables developed in
HS Exam 1 -- March 9, 2006
 Please write your name on the back. Don t forget! Part A: Short answer, multiple choice, and true or false questions. No use of calculators, notes, lab workbooks, cell phones, neighbors, brain implants,
NEUROBLASTOMA DATA -- TWO GROUPS -- QUANTITATIVE MEASURES 38 15:37 Saturday, January 25, 2003
 NEUROBLASTOMA DATA -- TWO GROUPS -- QUANTITATIVE MEASURES 38 15:37 Saturday, January 25, 2003 Obs GROUP I DOPA LNDOPA 1 neurblst 1 48.000 1.68124 2 neurblst 1 133.000 2.12385 3 neurblst 1 34.000 1.53148
Choosing the Correct Statistical Test
 Choosing the Correct Statistical Test T racie O. Afifi, PhD Departments of Community Health Sciences & Psychiatry University of Manitoba Department of Community Health Sciences COLLEGE OF MEDICINE, FACULTY
Overview of Non-Parametric Statistics
 Overview of Non-Parametric Statistics LISA Short Course Series Mark Seiss, Dept. of Statistics April 7, 2009 Presentation Outline 1. Homework 2. Review of Parametric Statistics 3. Overview Non-Parametric
ANOVA in SPSS (Practical)
") ANOVA in SPSS (Practical) Analysis of Variance practical In this practical we will investigate how we model the influence of a categorical predictor on a continuous response. Centre for Multilevel Modelling
ANOVA in SPSS (Practical) Analysis of Variance practical In this practical we will investigate how we model the influence of a categorical predictor on a continuous response. Centre for Multilevel Modelling
HOW STATISTICS IMPACT PHARMACY PRACTICE?
 HOW STATISTICS IMPACT PHARMACY PRACTICE? CPPD at NCCR 13 th June, 2013 Mohamed Izham M.I., PhD Professor in Social & Administrative Pharmacy Learning objective.. At the end of the presentation pharmacists
11/18/2013. Correlational Research. Correlational Designs. Why Use a Correlational Design? CORRELATIONAL RESEARCH STUDIES
 Correlational Research Correlational Designs Correlational research is used to describe the relationship between two or more naturally occurring variables. Is age related to political conservativism? Are
Business Research Methods. Introduction to Data Analysis
 Business Research Methods Introduction to Data Analysis Data Analysis Process STAGES OF DATA ANALYSIS EDITING CODING DATA ENTRY ERROR CHECKING AND VERIFICATION DATA ANALYSIS Introduction Preparation of
Daniel Boduszek University of Huddersfield
 Daniel Boduszek University of Huddersfield d.boduszek@hud.ac.uk Introduction to Correlation SPSS procedure for Pearson r Interpretation of SPSS output Presenting results Partial Correlation Correlation
Theme 14 Ranking tests
 Slide 14.1 Theme 14 Ranking tests Slide 14.2 Overview The tests which we have considered so far assumed that the data on our variables is normally distributed What do we do if this assumption has been
WELCOME! Lecture 11 Thommy Perlinger
 Quantitative Methods II WELCOME! Lecture 11 Thommy Perlinger Regression based on violated assumptions If any of the assumptions are violated, potential inaccuracies may be present in the estimated regression
Table of Contents. Plots. Essential Statistics for Nursing Research 1/12/2017
 Essential Statistics for Nursing Research Kristen Carlin, MPH Seattle Nursing Research Workshop January 30, 2017 Table of Contents Plots Descriptive statistics Sample size/power Correlations Hypothesis
Theoretical Exam. Monday 15 th, Instructor: Dr. Samir Safi. 1. Write your name, student ID and section number.
 بسم االله الرحمن الرحيم COMPUTER & DATA ANALYSIS Theoretical Exam FINAL THEORETICAL EXAMINATION Monday 15 th, 2007 Instructor: Dr. Samir Safi Name: ID Number: Instructor: INSTRUCTIONS: 1. Write your name,
Selecting the Right Data Analysis Technique
 Selecting the Right Data Analysis Technique Levels of Measurement Nominal Ordinal Interval Ratio Discrete Continuous Continuous Variable Borgatta and Bohrnstedt state that "the most of central constructs
Multiple Regression Analysis
 Multiple Regression Analysis Basic Concept: Extend the simple regression model to include additional explanatory variables: Y = β 0 + β1x1 + β2x2 +... + βp-1xp + ε p = (number of independent variables
CHAPTER 4: FINDINGS 4.1 Introduction This chapter includes five major sections. The first section reports descriptive statistics and discusses the
 CHAPTER 4: FINDINGS 4.1 Introduction This chapter includes five major sections. The first section reports descriptive statistics and discusses the respondent s representativeness of the overall Earthwatch
REVIEW PROBLEMS FOR FIRST EXAM
 M358K Sp 6 REVIEW PROBLEMS FOR FIRST EXAM Please Note: This review sheet is not intended to tell you what will or what will not be on the exam. However, most of these problems have appeared on or are very
Chapter 7: Correlation
 Chapter 7: Correlation Smart Alex s Solutions Task 1 A student was interested in whether there was a positive relationship between the time spent doing an essay and the mark received. He got 45 of his
Quantitative Methods in Computing Education Research (A brief overview tips and techniques)
") Quantitative Methods in Computing Education Research (A brief overview tips and techniques) Dr Judy Sheard Senior Lecturer Co-Director, Computing Education Research Group Monash University judy.sheard@monash.edu
Quantitative Methods in Computing Education Research (A brief overview tips and techniques) Dr Judy Sheard Senior Lecturer Co-Director, Computing Education Research Group Monash University judy.sheard@monash.edu
11/24/2017. Do not imply a cause-and-effect relationship
 Correlational research is used to describe the relationship between two or more naturally occurring variables. Is age related to political conservativism? Are highly extraverted people less afraid of rejection
Statistics Guide. Prepared by: Amanda J. Rockinson- Szapkiw, Ed.D.
 This guide contains a summary of the statistical terms and procedures. This guide can be used as a reference for course work and the dissertation process. However, it is recommended that you refer to statistical
One-Way ANOVAs t-test two statistically significant Type I error alpha null hypothesis dependant variable Independent variable three levels;
 1 One-Way ANOVAs We have already discussed the t-test. The t-test is used for comparing the means of two groups to determine if there is a statistically significant difference between them. The t-test
Study Guide #2: MULTIPLE REGRESSION in education
 Study Guide #2: MULTIPLE REGRESSION in education What is Multiple Regression? When using Multiple Regression in education, researchers use the term independent variables to identify those variables that
1.4 - Linear Regression and MS Excel
 1.4 - Linear Regression and MS Excel Regression is an analytic technique for determining the relationship between a dependent variable and an independent variable. When the two variables have a linear
AMSc Research Methods Research approach IV: Experimental [2]
![AMSc Research Methods Research approach IV: Experimental [2]](/thumbs/96/127502980.jpg "AMSc Research Methods Research approach IV: Experimental [2]") AMSc Research Methods Research approach IV: Experimental [2] Marie-Luce Bourguet mlb@dcs.qmul.ac.uk Statistical Analysis 1 Statistical Analysis Descriptive Statistics : A set of statistical procedures
AMSc Research Methods Research approach IV: Experimental [2] Marie-Luce Bourguet mlb@dcs.qmul.ac.uk Statistical Analysis 1 Statistical Analysis Descriptive Statistics : A set of statistical procedures
THE STATSWHISPERER. Introduction to this Issue. Doing Your Data Analysis INSIDE THIS ISSUE
 Spring 20 11, Volume 1, Issue 1 THE STATSWHISPERER The StatsWhisperer Newsletter is published by staff at StatsWhisperer. Visit us at: www.statswhisperer.com Introduction to this Issue The current issue
ExperimentalPhysiology
 Exp Physiol 97.5 (2012) pp 557 561 557 Editorial ExperimentalPhysiology Categorized or continuous? Strength of an association and linear regression Gordon B. Drummond 1 and Sarah L. Vowler 2 1 Department
2.75: 84% 2.5: 80% 2.25: 78% 2: 74% 1.75: 70% 1.5: 66% 1.25: 64% 1.0: 60% 0.5: 50% 0.25: 25% 0: 0%
 Capstone Test (will consist of FOUR quizzes and the FINAL test grade will be an average of the four quizzes). Capstone #1: Review of Chapters 1-3 Capstone #2: Review of Chapter 4 Capstone #3: Review of
Chapter 14: More Powerful Statistical Methods
 Chapter 14: More Powerful Statistical Methods Most questions will be on correlation and regression analysis, but I would like you to know just basically what cluster analysis, factor analysis, and conjoint
Biology 345: Biometry Fall 2005 SONOMA STATE UNIVERSITY Lab Exercise 8 One Way ANOVA and comparisons among means Introduction
 Biology 345: Biometry Fall 2005 SONOMA STATE UNIVERSITY Lab Exercise 8 One Way ANOVA and comparisons among means Introduction In this exercise, we will conduct one-way analyses of variance using two different
List of Figures. List of Tables. Preface to the Second Edition. Preface to the First Edition
 List of Figures List of Tables Preface to the Second Edition Preface to the First Edition xv xxv xxix xxxi 1 What Is R? 1 1.1 Introduction to R................................ 1 1.2 Downloading and Installing
Statistical analysis DIANA SAPLACAN 2017 * SLIDES ADAPTED BASED ON LECTURE NOTES BY ALMA LEORA CULEN
 Statistical analysis DIANA SAPLACAN 2017 * SLIDES ADAPTED BASED ON LECTURE NOTES BY ALMA LEORA CULEN Vs. 2 Background 3 There are different types of research methods to study behaviour: Descriptive: observations,
SPSS output for 420 midterm study
 Ψ Psy Midterm Part In lab (5 points total) Your professor decides that he wants to find out how much impact amount of study time has on the first midterm. He randomly assigns students to study for hours,
Basic Biostatistics. Chapter 1. Content
 Chapter 1 Basic Biostatistics Jamalludin Ab Rahman MD MPH Department of Community Medicine Kulliyyah of Medicine Content 2 Basic premises variables, level of measurements, probability distribution Descriptive
PSY 216: Elementary Statistics Exam 4
 Name: PSY 16: Elementary Statistics Exam 4 This exam consists of multiple-choice questions and essay / problem questions. For each multiple-choice question, circle the one letter that corresponds to the
Daniel Boduszek University of Huddersfield
 Daniel Boduszek University of Huddersfield d.boduszek@hud.ac.uk Introduction to Multiple Regression (MR) Types of MR Assumptions of MR SPSS procedure of MR Example based on prison data Interpretation of
POL 242Y Final Test (Take Home) Name
 Name") POL 242Y Final Test (Take Home) Name_ Due August 6, 2008 The take-home final test should be returned in the classroom (FE 36) by the end of the class on August 6. Students who fail to submit the final
POL 242Y Final Test (Take Home) Name_ Due August 6, 2008 The take-home final test should be returned in the classroom (FE 36) by the end of the class on August 6. Students who fail to submit the final
Types of Statistics. Censored data. Files for today (June 27) Lecture and Homework INTRODUCTION TO BIOSTATISTICS. Today s Outline
 Lecture and Homework INTRODUCTION TO BIOSTATISTICS. Today s Outline") INTRODUCTION TO BIOSTATISTICS FOR GRADUATE AND MEDICAL STUDENTS Files for today (June 27) Lecture and Homework Descriptive Statistics and Graphically Visualizing Data Lecture #2 (1 file) PPT presentation
INTRODUCTION TO BIOSTATISTICS FOR GRADUATE AND MEDICAL STUDENTS Files for today (June 27) Lecture and Homework Descriptive Statistics and Graphically Visualizing Data Lecture #2 (1 file) PPT presentation
Statistical Summaries. Kerala School of MathematicsCourse in Statistics for Scientists. Descriptive Statistics. Summary Statistics
 Kerala School of Mathematics Course in Statistics for Scientists Statistical Summaries Descriptive Statistics T.Krishnan Strand Life Sciences, Bangalore may be single numerical summaries of a batch, such
Day 11: Measures of Association and ANOVA
 Day 11: Measures of Association and ANOVA Daniel J. Mallinson School of Public Affairs Penn State Harrisburg mallinson@psu.edu PADM-HADM 503 Mallinson Day 11 November 2, 2017 1 / 45 Road map Measures of
Preliminary Report on Simple Statistical Tests (t-tests and bivariate correlations)
") Preliminary Report on Simple Statistical Tests (t-tests and bivariate correlations) After receiving my comments on the preliminary reports of your datasets, the next step for the groups is to complete
Preliminary Report on Simple Statistical Tests (t-tests and bivariate correlations) After receiving my comments on the preliminary reports of your datasets, the next step for the groups is to complete
Survey research (Lecture 1) Summary & Conclusion. Lecture 10 Survey Research & Design in Psychology James Neill, 2015 Creative Commons Attribution 4.
 Summary & Conclusion. Lecture 10 Survey Research & Design in Psychology James Neill, 2015 Creative Commons Attribution 4.") Summary & Conclusion Lecture 10 Survey Research & Design in Psychology James Neill, 2015 Creative Commons Attribution 4.0 Overview 1. Survey research 2. Survey design 3. Descriptives & graphing 4. Correlation
Summary & Conclusion Lecture 10 Survey Research & Design in Psychology James Neill, 2015 Creative Commons Attribution 4.0 Overview 1. Survey research 2. Survey design 3. Descriptives & graphing 4. Correlation
Survey research (Lecture 1)
") Summary & Conclusion Lecture 10 Survey Research & Design in Psychology James Neill, 2015 Creative Commons Attribution 4.0 Overview 1. Survey research 2. Survey design 3. Descriptives & graphing 4. Correlation
Summary & Conclusion Lecture 10 Survey Research & Design in Psychology James Neill, 2015 Creative Commons Attribution 4.0 Overview 1. Survey research 2. Survey design 3. Descriptives & graphing 4. Correlation
Research Manual STATISTICAL ANALYSIS SECTION. By: Curtis Lauterbach 3/7/13
 Research Manual STATISTICAL ANALYSIS SECTION By: Curtis Lauterbach 3/7/13 TABLE OF CONTENTS INTRODUCTION 1 STATISTICAL ANALYSIS 1 Overview 1 Dependent Variable 1 Independent Variable 1 Interval 1 Ratio
Figure: Presentation slides:
 Joni Lakin David Shannon Margaret Ross Abbot Packard Auburn University Auburn University Auburn University University of West Georgia Figure: http://www.auburn.edu/~jml0035/eera_chart.pdf Presentation
Summary & Conclusion. Lecture 10 Survey Research & Design in Psychology James Neill, 2016 Creative Commons Attribution 4.0
 Summary & Conclusion Lecture 10 Survey Research & Design in Psychology James Neill, 2016 Creative Commons Attribution 4.0 Overview 1. Survey research and design 1. Survey research 2. Survey design 2. Univariate
STATISTICS AND RESEARCH DESIGN
 Statistics 1 STATISTICS AND RESEARCH DESIGN These are subjects that are frequently confused. Both subjects often evoke student anxiety and avoidance. To further complicate matters, both areas appear have
Intro to SPSS. Using SPSS through WebFAS
 Intro to SPSS Using SPSS through WebFAS http://www.yorku.ca/computing/students/labs/webfas/ Try it early (make sure it works from your computer) If you need help contact UIT Client Services Voice: 416-736-5800
Using a Likert-type Scale DR. MIKE MARRAPODI
 Using a Likert-type Scale DR. MIKE MARRAPODI Topics Definition/Description Types of Scales Data Collection with Likert-type scales Analyzing Likert-type Scales Definition/Description A Likert-type Scale
Analysis of Variance: repeated measures
 Analysis of Variance: repeated measures Tests for comparing three or more groups or conditions: (a) Nonparametric tests: Independent measures: Kruskal-Wallis. Repeated measures: Friedman s. (b) Parametric
Supporting Information
 1 2 3 4 5 6 7 8 9 10 11 12 13 14 15 16 17 18 19 20 21 22 23 24 25 26 27 28 29 30 31 32 33 34 35 36 37 38 39 40 Supporting Information Variances and biases of absolute distributions were larger in the 2-line
NORTH SOUTH UNIVERSITY TUTORIAL 2
 NORTH SOUTH UNIVERSITY TUTORIAL 2 AHMED HOSSAIN,PhD Data Management and Analysis AHMED HOSSAIN,PhD - Data Management and Analysis 1 Correlation Analysis INTRODUCTION In correlation analysis, we estimate
Business Statistics Probability
 Business Statistics The following was provided by Dr. Suzanne Delaney, and is a comprehensive review of Business Statistics. The workshop instructor will provide relevant examples during the Skills Assessment
Chapter 1: Review of Basic Concepts
 Chapter 1: Review of Basic Concepts Multiple Choice 1. A researcher uses a six-sided dice to determine group membership. The sampling method being used is: a. random sample. b. stratified sample. c. convenience
SOME NOTES ON STATISTICAL INTERPRETATION
 1 SOME NOTES ON STATISTICAL INTERPRETATION Below I provide some basic notes on statistical interpretation. These are intended to serve as a resource for the Soci 380 data analysis. The information provided
7 Statistical Issues that Researchers Shouldn t Worry (So Much) About
 About") 7 Statistical Issues that Researchers Shouldn t Worry (So Much) About By Karen Grace-Martin Founder & President About the Author Karen Grace-Martin is the founder and president of The Analysis Factor.
7 Statistical Issues that Researchers Shouldn t Worry (So Much) About By Karen Grace-Martin Founder & President About the Author Karen Grace-Martin is the founder and president of The Analysis Factor.
Application of Local Control Strategy in analyses of the effects of Radon on Lung Cancer Mortality for 2,881 US Counties
 Application of Local Control Strategy in analyses of the effects of Radon on Lung Cancer Mortality for 2,881 US Counties Bob Obenchain, Risk Benefit Statistics, August 2015 Our motivation for using a Cut-Point
Immunological Data Processing & Analysis
 Immunological Data Processing & Analysis Hongmei Yang Center for Biodefence Immune Modeling Department of Biostatistics and Computational Biology University of Rochester June 12, 2012 Hongmei Yang (CBIM
Daniel Boduszek University of Huddersfield
 Daniel Boduszek University of Huddersfield d.boduszek@hud.ac.uk Introduction to Logistic Regression SPSS procedure of LR Interpretation of SPSS output Presenting results from LR Logistic regression is
STATISTICS INFORMED DECISIONS USING DATA
 STATISTICS INFORMED DECISIONS USING DATA Fifth Edition Chapter 4 Describing the Relation between Two Variables 4.1 Scatter Diagrams and Correlation Learning Objectives 1. Draw and interpret scatter diagrams
Research Manual COMPLETE MANUAL. By: Curtis Lauterbach 3/7/13
 Research Manual COMPLETE MANUAL By: Curtis Lauterbach 3/7/13 TABLE OF CONTENTS INTRODUCTION 1 RESEARCH DESIGN 1 Validity 1 Reliability 1 Within Subjects 1 Between Subjects 1 Counterbalancing 1 Table 1.
Contents. Part 1 Introduction. Part 2 Cross-Sectional Selection Bias Adjustment
 From Analysis of Observational Health Care Data Using SAS. Full book available for purchase here. Contents Preface ix Part 1 Introduction Chapter 1 Introduction to Observational Studies... 3 1.1 Observational
Chapter 1: Explaining Behavior
 Chapter 1: Explaining Behavior GOAL OF SCIENCE is to generate explanations for various puzzling natural phenomenon. - Generate general laws of behavior (psychology) RESEARCH: principle method for acquiring
25. Two-way ANOVA. 25. Two-way ANOVA 371
 25. Two-way ANOVA The Analysis of Variance seeks to identify sources of variability in data with when the data is partitioned into differentiated groups. In the prior section, we considered two sources
Global Clinical Trials Innovation Summit Berlin October 2016
 Global Clinical Trials Innovation Summit Berlin 20-21 October 2016 BIOSTATISTICS A FEW ESSENTIALS: USE AND APPLICATION IN CLINICAL RESEARCH Berlin, 20 October 2016 Dr. Aamir Shaikh Founder, Assansa Here
Applications. DSC 410/510 Multivariate Statistical Methods. Discriminating Two Groups. What is Discriminant Analysis
 DSC 4/5 Multivariate Statistical Methods Applications DSC 4/5 Multivariate Statistical Methods Discriminant Analysis Identify the group to which an object or case (e.g. person, firm, product) belongs:
Statistics for EES Factorial analysis of variance
 Statistics for EES Factorial analysis of variance Dirk Metzler http://evol.bio.lmu.de/_statgen 1. July 2013 1 ANOVA and F-Test 2 Pairwise comparisons and multiple testing 3 Non-parametric: The Kruskal-Wallis
Results & Statistics: Description and Correlation. I. Scales of Measurement A Review
 Results & Statistics: Description and Correlation The description and presentation of results involves a number of topics. These include scales of measurement, descriptive statistics used to summarize
Hungry Mice. NP: Mice in this group ate as much as they pleased of a non-purified, standard diet for laboratory mice.
 Hungry Mice When laboratory mice (and maybe other animals) are fed a nutritionally adequate but near-starvation diet, they may live longer on average than mice that eat a normal amount of food. In this
bivariate analysis: The statistical analysis of the relationship between two variables.
 bivariate analysis: The statistical analysis of the relationship between two variables. cell frequency: The number of cases in a cell of a cross-tabulation (contingency table). chi-square (χ 2 ) test for
Math 215, Lab 7: 5/23/2007
 Math 215, Lab 7: 5/23/2007 (1) Parametric versus Nonparamteric Bootstrap. Parametric Bootstrap: (Davison and Hinkley, 1997) The data below are 12 times between failures of airconditioning equipment in
To understand and systematically evaluate research, it is first imperative
 3 Basics of Statistical Methods To understand and systematically evaluate research, it is first imperative to have an understanding of several basic statistical methods and related terminology. Mendenhall
Online Introduction to Statistics
 APPENDIX Online Introduction to Statistics CHOOSING THE CORRECT ANALYSIS To analyze statistical data correctly, you must choose the correct statistical test. The test you should use when you have interval
Averages and Variation
 Chapter 3 Averages and Variation Name Section 3.1 Measures of Central Tendency: Mode, Median, and Mean Objective: In this lesson you learned how to compute, interpret, and explain mean, median, and mode.
BIOSTATS 540 Fall 2017 Exam 1 Page 1 of 12
 BIOSTATS 540 Fall 2017 Exam 1 Page 1 of 12 BIOSTATS 540 - Introductory Biostatistics Fall 2017 Examination 1 Units 1&2 Summarizing Data & Data Visualization Due: Tuesday October 10, 2017 Last Date for
Testing Means. Related-Samples t Test With Confidence Intervals. 6. Compute a related-samples t test and interpret the results.
 10 Learning Objectives Testing Means After reading this chapter, you should be able to: Related-Samples t Test With Confidence Intervals 1. Describe two types of research designs used when we select related
Kidane Tesfu Habtemariam, MASTAT, Principle of Stat Data Analysis Project work
 1 1. INTRODUCTION Food label tells the extent of calories contained in the food package. The number tells you the amount of energy in the food. People pay attention to calories because if you eat more
SUPPLEMENTAL MATERIAL
 1 SUPPLEMENTAL MATERIAL Response time and signal detection time distributions SM Fig. 1. Correct response time (thick solid green curve) and error response time densities (dashed red curve), averaged across
STATISTICS IN CLINICAL AND TRANSLATIONAL RESEARCH
 09/07/11 1 Overview and Descriptive Statistics a. Application of statistics in biomedical research b. Type of data c. Graphic representation of data d. Summary statistics: central tendency and dispersion
Choosing a Significance Test. Student Resource Sheet
 Choosing a Significance Test Student Resource Sheet Choosing Your Test Choosing an appropriate type of significance test is a very important consideration in analyzing data. If an inappropriate test is
Prepared by: Assoc. Prof. Dr Bahaman Abu Samah Department of Professional Development and Continuing Education Faculty of Educational Studies
 Prepared by: Assoc. Prof. Dr Bahaman Abu Samah Department of Professional Development and Continuing Education Faculty of Educational Studies Universiti Putra Malaysia Serdang At the end of this session,
The University of North Carolina at Chapel Hill School of Social Work
 The University of North Carolina at Chapel Hill School of Social Work SOWO 918: Applied Regression Analysis and Generalized Linear Models Spring Semester, 2014 Instructor Shenyang Guo, Ph.D., Room 524j,
Section 6: Analysing Relationships Between Variables
 6. 1 Analysing Relationships Between Variables Section 6: Analysing Relationships Between Variables Choosing a Technique The Crosstabs Procedure The Chi Square Test The Means Procedure The Correlations
Chapter 19: Categorical outcomes: chi-square and loglinear analysis
 Chapter 19: Categorical outcomes: chi-square and loglinear analysis Labcoat Leni s Real Research The impact of sexualized images on women s self-evaluations Problem Daniels, E., A. (2012). Journal of Applied
PONDICHERRY UNIVERSITY DEPARTMENT OF STATISTICS POST GRADUATE DIPLOMA IN STATISTICAL AND RESEARCH METHODS (SEMESTER PATTERN)
") PONDICHERRY UNIVERSITY DEPARTMENT OF STATISTICS POST GRADUATE DIPLOMA IN STATISTICAL AND RESEARCH METHODS (SEMESTER PATTERN) Effective from 2012-2013 (onwards) PONDICHERRY UNIVERSITY POST GRADUATE DIPLOMA
PONDICHERRY UNIVERSITY DEPARTMENT OF STATISTICS POST GRADUATE DIPLOMA IN STATISTICAL AND RESEARCH METHODS (SEMESTER PATTERN) Effective from 2012-2013 (onwards) PONDICHERRY UNIVERSITY POST GRADUATE DIPLOMA
Regression. Page 1. Variables Entered/Removed b Variables. Variables Removed. Enter. Method. Psycho_Dum
 Regression Model Variables Entered/Removed b Variables Entered Variables Removed Method Meds_Dum,. Enter Psycho_Dum a. All requested variables entered. b. Dependent Variable: Beck's Depression Score Model
Students will understand the definition of mean, median, mode and standard deviation and be able to calculate these functions with given set of
 Students will understand the definition of mean, median, mode and standard deviation and be able to calculate these functions with given set of numbers. Also, students will understand why some measures
Describe what is meant by a placebo Contrast the double-blind procedure with the single-blind procedure Review the structure for organizing a memo
 Please note the page numbers listed for the Lind book may vary by a page or two depending on which version of the textbook you have. Readings: Lind 1 11 (with emphasis on chapters 10, 11) Please note chapter
Using SPSS for Correlation
 Using SPSS for Correlation This tutorial will show you how to use SPSS version 12.0 to perform bivariate correlations. You will use SPSS to calculate Pearson's r. This tutorial assumes that you have: Downloaded
Supplementary Figure 1 Information on transgenic mouse models and their recording and optogenetic equipment. (a) 108 (b-c) (d) (e) (f) (g)
 108 (b-c) (d) (e) (f) (g)") Supplementary Figure 1 Information on transgenic mouse models and their recording and optogenetic equipment. (a) In four mice, cre-dependent expression of the hyperpolarizing opsin Arch in pyramidal cells
Supplementary Figure 1 Information on transgenic mouse models and their recording and optogenetic equipment. (a) In four mice, cre-dependent expression of the hyperpolarizing opsin Arch in pyramidal cells
Supplemental Tables. Macroalgal. Porewater. Porewater. Water column. Water column. Water column chl a. Porewater.
 Supplemental Tables Supplemental Table 1. Test statistics for all response variables measured in clam and control mesocosms in 2009 and 2010. All results are from non-parametric Wilcoxon rank sum tests,
Evidence-Based Medicine Journal Club. A Primer in Statistics, Study Design, and Epidemiology. August, 2013
 Evidence-Based Medicine Journal Club A Primer in Statistics, Study Design, and Epidemiology August, 2013 Rationale for EBM Conscientious, explicit, and judicious use Beyond clinical experience and physiologic