Business Research Methods. Introduction to Data Analysis
|
|
|
- Adam Mitchell Gordon
- 6 years ago
- Views:
Transcription

1
2 Business Research Methods Introduction to Data Analysis

3 Data Analysis Process
4 STAGES OF DATA ANALYSIS EDITING CODING DATA ENTRY ERROR CHECKING AND VERIFICATION DATA ANALYSIS
5 Introduction Preparation of Data Editing, Handling Blank responses, Coding, Categorization and Data Entry These activities ensure accuracy of the data and its conversion from raw form to reduced data Exploring, Displaying and Examining data Breaking down, inspecting and rearranging data to start the search for meaningful descriptions, patterns and relationship.
6 Editing The Process Of Checking And Adjusting The Data For Omissions For Legibility For Consistency And Readying Them For Coding And Storage
7 Editing FIELD EDITING IN-HOUSE EDITING

8 Reasons for Editing Accurate Consistent Arranged for simplification Criteria Uniformly entered Complete
9 Birth Year Recorded By Interviewer 1873? 1973 MORE LIKELY
10 Coding Involves assigning numbers or other symbols to answers so the responses can be grouped into a limited number of classes or categories. Example: M for Male and F for Female 1 for Male and 2 for Female Numeric vs Alphanumeric Numeric versus Alphanumeric Open ended questions Check accuracy by using 10% of responses

11 Coding Rules Exhaustive Appropriate to the research problem Categories should be Mutually exclusive Derived from one classification principle
12 Appropriateness Let s say your population is students at institutions of higher learning What is you age group? years years years Above 45 years
13 Exhaustiveness What is your race? Malay Chinese Indians Others
14 Mutual Exclusivity What is your occupation type? Professional Managerial Sales Crafts Operatives Unemployed Clerical Housewife Others
15 Single Dimension What is your occupation type? Professional Crafts Managerial Sales Clerical Housewife Operatives Unemployed Others
16 Coding Open-ended Responses


17 Coding Open Ended Questions
18 Handling Blank Responses How do we take care of missing responses? If > 25% missing, throw out the questionnaire Other ways of handling Use the midpoint of the scale Ignore (system missing) Mean of those responding Mean of the respondent Random number
19 Code Book Identifies each variable Provides a variable s description Identifies each code name and position on storage medium

20 Sample SPSS Codebook


21 Data Entry Keyboarding Database Programs Digital/ Barcodes Optical Recognition Voice recognition
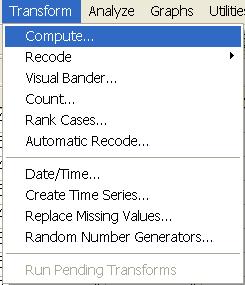
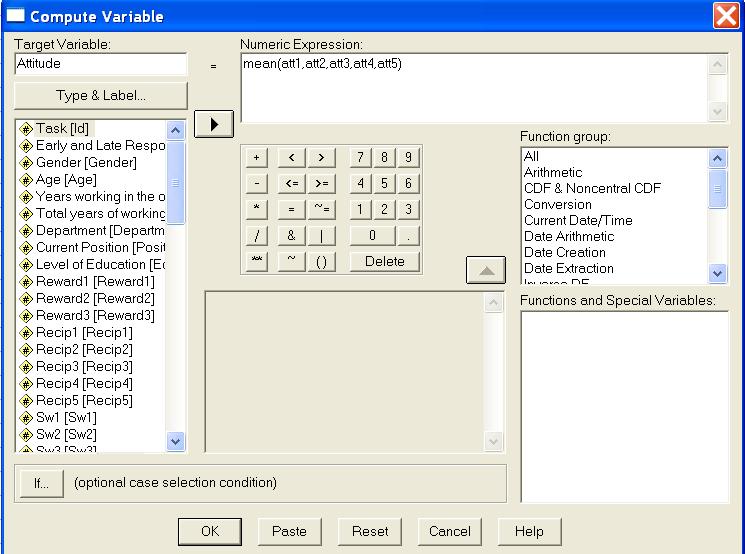
22 Data Transformation Weights Assigning numbers to responses on a pre-determined rule Respecification of the Variable Transforming existing data to form new variables or items Recode Compute
23 Scale Transformation Reason for Transformation to improve interpretation and compatibility with other data sets to enhance symmetry and stabilize spread improve linear relationship between the variables (Standardized score) X z i - s X
24 Characteristics of Distributions
25 Summarizing Distributions with Shape
26 Parameter & Statistics Variable Population Sample Mean µ X Proportion p Variance 2 s 2 Standard deviation s Size N n Standard error of the mean x S x


27 Statistical Testing Procedures State null hypothesis Interpret the test Stages Choose statistical test Obtain critical test value Compute difference value Select level of significance
28 Hypotheses Null H0: = 50 mpg H0: < 50 mpg H0: > 50 mpg Alternate HA: 50 mpg HA: > 50 mpg HA: < 50 mpg
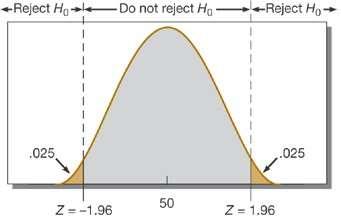
29 Accept/Reject
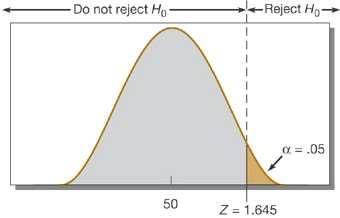
30 Accept/Reject
31 How to Select a Test Two-Sample Tests k-sample Tests Measurement Scale One-Sample Case Related Samples Independent Samples Related Samples Independent Samples Nominal Binomial McNemar Fisher exact test Cochran Q x 2 for k samples x 2 one-sample test x 2 two-samples test Ordinal Kolmogorov-Smirnov one-sample test Runs test Sign test Wilcoxon matched-pairs test Median test Mann-Whitney U Kolmogorov- Smirnov Wald-Wolfowitz Friedman twoway ANOVA Median extension Kruskal-Wallis one-way ANOVA Interval and Ratio t-test t-test for paired samples t-test Repeatedmeasures ANOVA One-way ANOVA Z test Z test n-way ANOVA
32 Research Model 5 items Attitude 5 items 3 items 4 items Subjective norm 4 items Perceived Behavioral Control Intention to Share Information Actual Sharing of Information
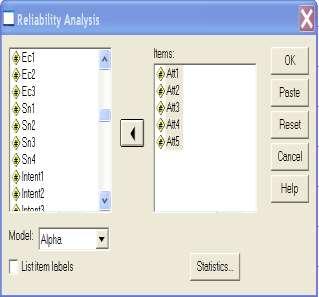
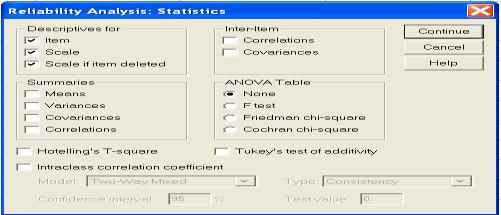
33 Reliability - Command
34 Reliability Question: How reliable are our instruments? Reliability Statistics Cronbach's Alpha N of Items Item-T otal Statistics Att1 Att2 Att3 Att4 Att5 Scale Mean if Item Deleted Scale Variance if Corrected Item-T otal Cronbach's Alpha if Item Item Deleted Correlation Deleted
35 Reliability Reliability Statistics Cronbach's Alpha N of Items Item-T otal Statistics Sn1 Sn2 Sn3 Sn4 Scale Mean if Item Deleted Scale Variance if Corrected Item-T otal Cronbach's Alpha if Item Item Deleted Correlation Deleted
36 Reliability Reliability Statistics Cronbach's Alpha N of Items Item-Total Statistics Pbc1 Pbc2 Pbc3 Pbc4 Scale Mean if Item Deleted Scale Variance if Corrected Item-Total Cronbach's Alpha if Item Item Deleted Correlation Deleted
37 Reliability Reliability Statistics Cronbach's Alpha N of Items Item-Total Statistics Intent1 Intent2 Intent3 Intent4 Intent5 Scale Mean if Item Deleted Scale Variance if Corrected Item-Total Cronbach's Alpha if Item Item Deleted Correlation Deleted
38 Table in Report Variable N of Item Item Alpha Deleted Attitude SN Pbcontrol Intention Actual
39 Example - Recoding Perceived Enjoyment PE1 PE2 PE3 PE4 PE5 The actual process of using Instant Messenger is pleasant I have fun using Instant Messenger Using Instant Messenger bores me Using Instant Messenger provides me with a lot of enjoyment I enjoy using Instant Messenger
40 Recoding
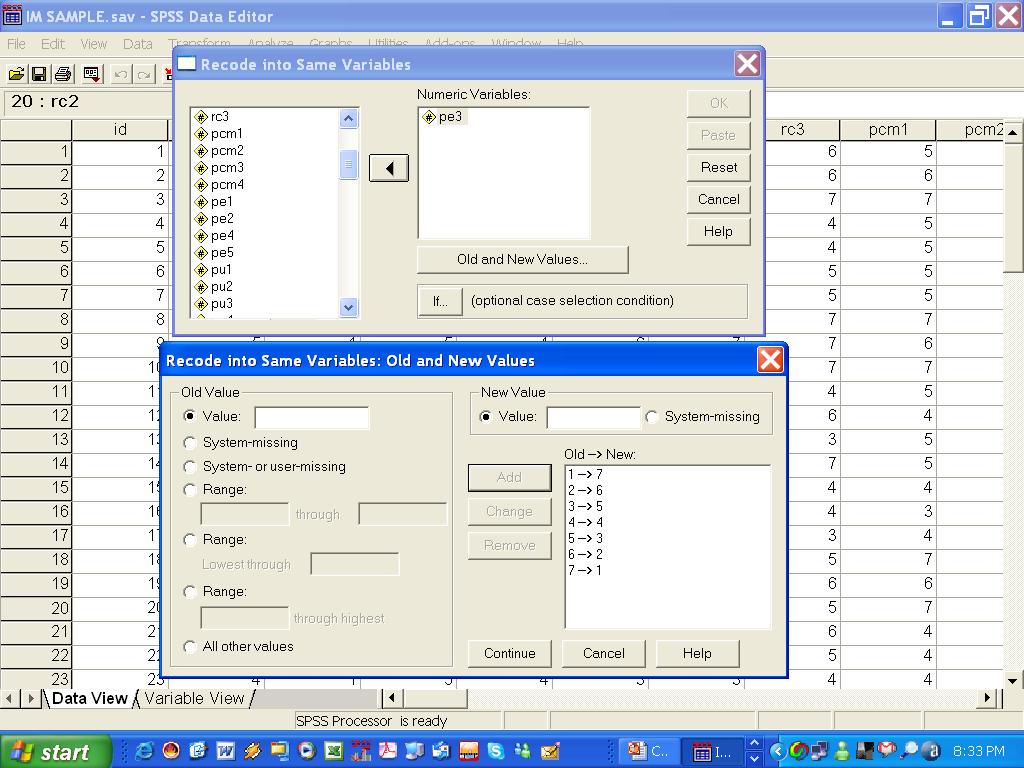
41 Recoding

42 Data before Transformation
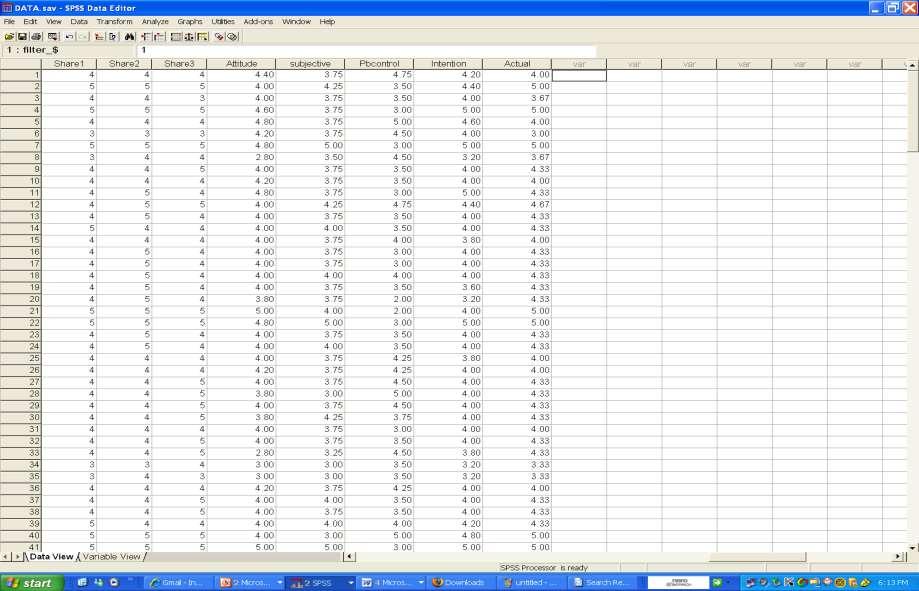
43 Data after Transformation
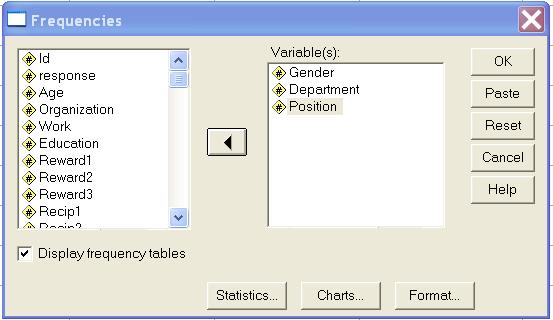
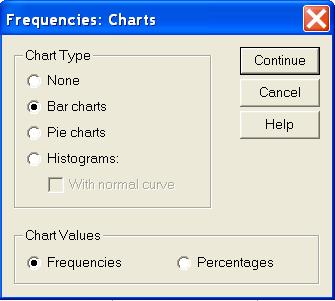
44 Frequencies - Command
45 Frequencies Question: 1. Is our sample representative? 2. Data entry error Valid Male Female Total Gender Cumulative Frequency Percent Valid Percent Percent Current Position Valid Technician Engineer Sr Engineer Manager Above manager Total Cumulative Frequency Percent Valid Percent Percent
46 Table in Report Gender Male Female Position Technician Engineer Sr Engineer Manager Above manager Frequency Percentage
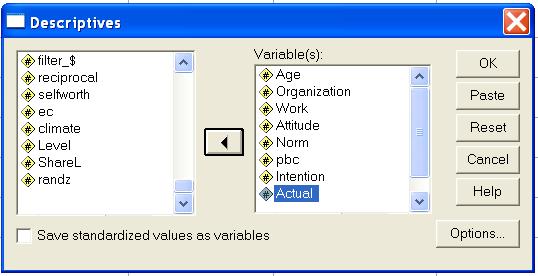
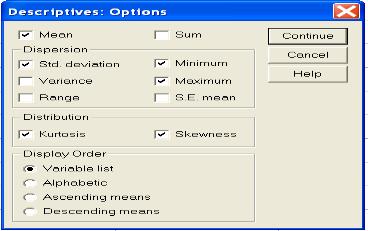
47 Descriptives - Command
48 Descriptives Age Years working in the organization Total years of working experience Attitude subjective Pbcontrol Intention Actual Valid N (listwise) Question: Descriptive Statistics N Minimum Maximum Mean Std. Skewness Kurtosis Statistic Statistic Statistic Statistic Deviation Statistic Statistic Std. Error Statistic Std. Error Is there variation in our data? 2. What is the level of the phenomenon we are measuring?
49 Table in Report Attitude Subjective Norm Behavioral Control Intention Actual Mean Std. Deviation


50 Chi Square Test - Command
51 Crosstabulation Question: Is level of sharing dependent on gender? Gender * Intention Level Cr osstabulation Gender Total Male Female Count % within Gender % within Intention Level % of Total Count % within Gender % within Intention Level % of Total Count % within Gender % within Intention Level % of Total Intention Level Low High Total % 23.6% 100.0% 70.5% 94.4% 75.0% 57.3% 17.7% 75.0% % 4.2% 100.0% 29.5% 5.6% 25.0% 24.0% 1.0% 25.0% % 18.8% 100.0% 100.0% 100.0% 100.0% 81.3% 18.8% 100.0% Pearson Chi-Square Continuity Correction a Likelihood Ratio Fisher's Exact T est Linear-by-Linear Association N of Valid Cases Chi-Square Tests Asymp. Sig. Value df (2-sided) b a. Computed only for a 2x2 table Exact Sig. (2-sided) Exact Sig. (1-sided) b. 0 cells (.0%) have expected count less than 5. The minimum expected count is

52 T-test - Command
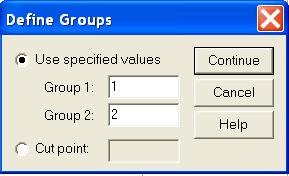
53 t-test (2 Independent) Question: Does intention to share vary by gender? Intention Gender Male Female Group Statistics Std. Std. Error N Mean Deviation Mean Independent Samples Test Intention Equal variances assumed Equal variances not assumed Levene's Test for Equality of Variances F Sig. t df Sig. (2-tailed) t-test for Equality of Means Mean Difference 95% Confidence Interval of the Std. Error Difference Difference Lower Upper

54 Paired t-test - Command
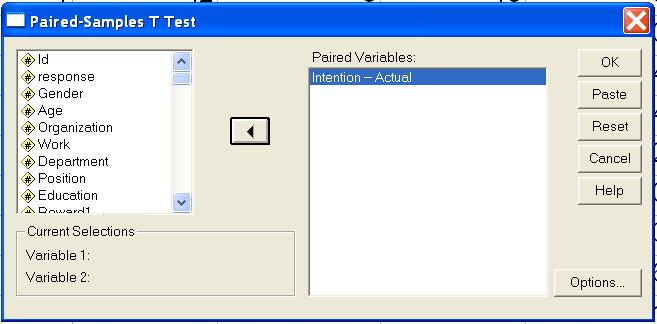
55 t-test (2 Dependent) Question: Are there differences between intention to share and actual sharing behavior? Pair 1 Intention Actual Paired Samples Statistics Std. Std. Error Mean N Deviation Mean Paired Samples Correlations Pair 1 Intention & Actual N Correlation Sig Paired Samples Test Pair 1 Intention - Actual Paired Differences 95% Conf idence Interval of the Std. Std. Error Dif ference Mean Deviation Mean Lower Upper t df Sig. (2-tailed)

56 One Way ANOVA - Command
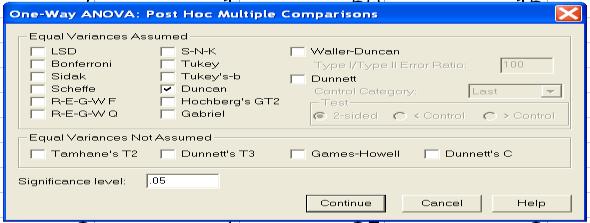
57 One way ANOVA (k independent) Question: Does intention vary by position? ANOVA Intention Between Groups Within Groups Total Sum of Squares df Mean Square F Sig Duncan a,b Current Po sition Engine er Manag er Te chnician Sr Engineer Above manager Sig. Intention Subset for alpha =.05 N Means for groups in homogeneous subsets are displayed. a. Uses Harmonic Mean Sample Size = b. The group sizes are unequal. The harmonic mean of the group sizes is used. Type I error levels are not guaranteed.
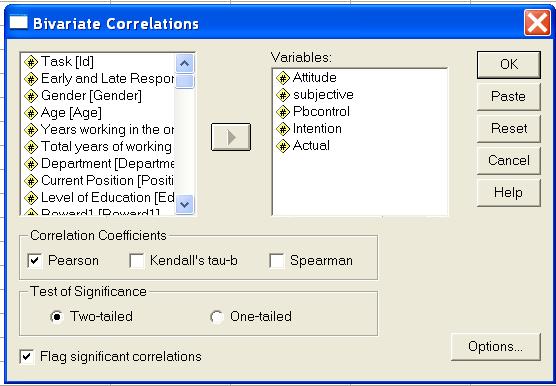
58 Correlation - Command
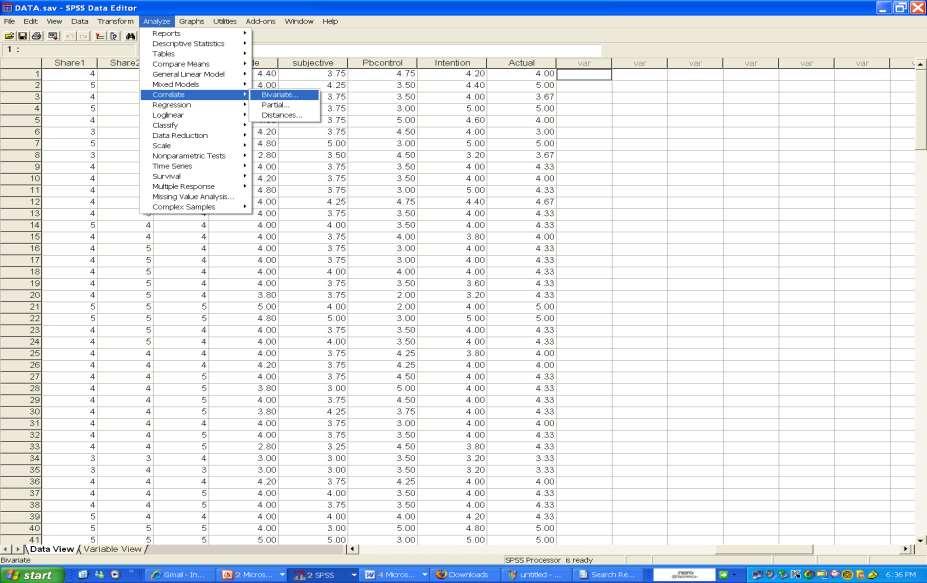
59 Correlation (Interval/ratio) Question: Are the variables related? Attitude subjective Pbcontrol Intention Actual Pearson Correlation Sig. (2-tailed) N Pearson Correlation Sig. (2-tailed) N Pearson Correlation Sig. (2-tailed) N Pearson Correlation Sig. (2-tailed) N Pearson Correlation Sig. (2-tailed) N Correlations **. Correlation is significant at the 0.01 level (2-tailed). Attitude subjective Pbcontrol Intention Actual 1.697**.212**.808**.606** ** **.552** ** ** **.653**.281** 1.817** **.552** **
60 Table Presentation Attitude subjective Pbcontrol Intention Attitude subjective Pbcontrol Intention Actual 1.740** 1.201** **.662**.326** 1 Actual.660**.553** ** 1 *p< 0.05, **p< 0.01
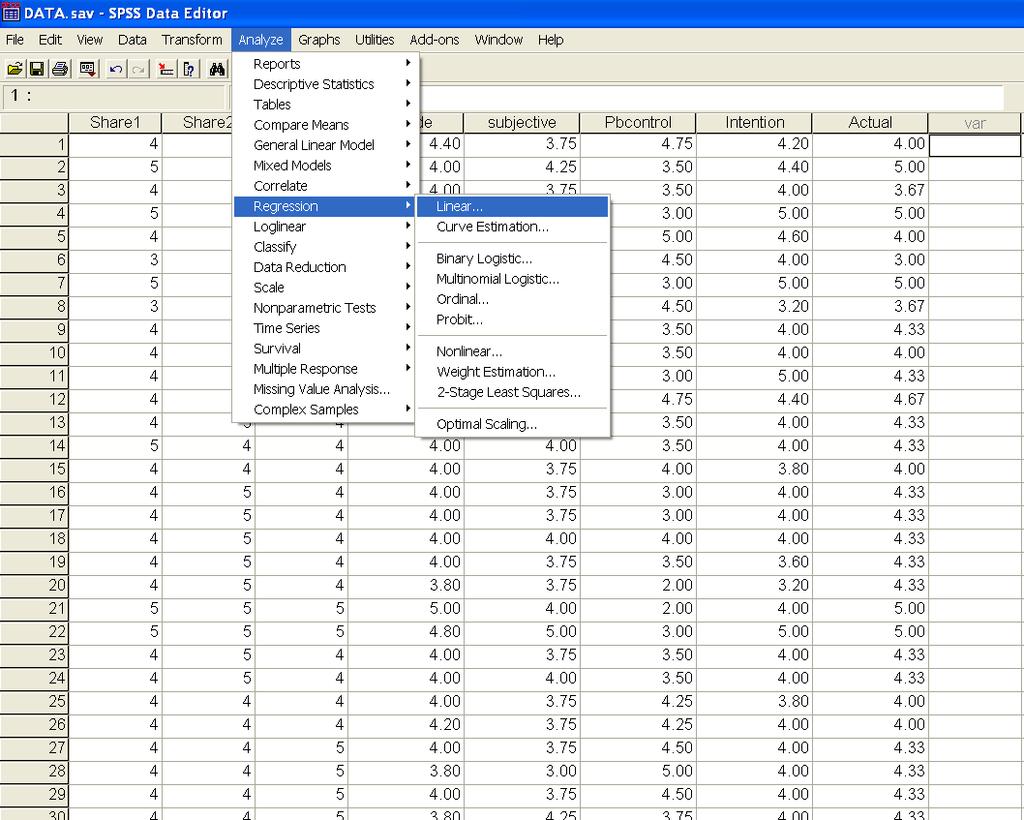
61 Command
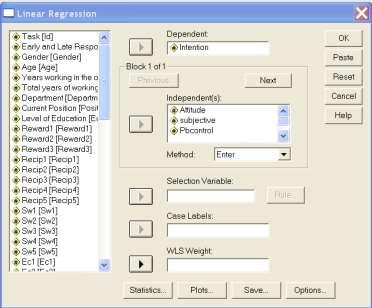
62 Multiple Regression Question: Which variables can explain the intention to share? Model 1 Variables Entered/Removed b Variables Variables Entered Removed Method Pbcontrol, subjective, Attitude a. Enter a. All requested variables entered. b. Dependent Variable: Intention Model 1 Model Summary b Adjusted Std. Error of Durbin- R R Square R Square the Estimate Watson.832 a a. Predictors: (Constant), Pbcontrol, subjective, Attitude b. Dependent Variable: Intention
63 Multiple Regression Model 1 Model 1 Regression Residual Total ANOVA b Sum of Squares df Mean Square F Sig a a. Predictors: (Constant), Pbcontrol, subjective, Attitude b. Dependent Variable: Intention (Constant) Attitude subjective Pbcontrol Unstandardized Coefficients a. Dependent Variable: Intention Coefficients a Standardized Coefficients Collinearity Statistics B Std. Error Beta t Sig. Tolerance VIF
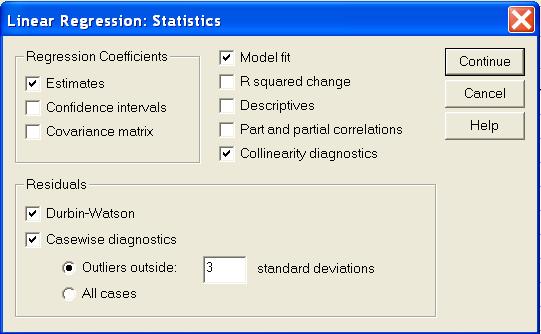
64 Assumptions (Multicollinearity) Collinearity Diagnostics a Model 1 Dimension a. Dependent Variable: Intention Condition Variance Proportions Eigenvalue Index (Constant) Attitude subjective Pbcontrol
65 Assumptions (Outliers) Case Number Casewise Diagnostics a Predicted Std. Residual Intention Value Residual a. Dependent Variable: Intention
66
67 After Removing Outliers Model 1 Model 1 Model Summary b Adjusted Std. Error of Durbin- R R Square R Square the Estimate Watson.900 a a. Predictors: (Constant), Pbcontrol, subjective, Attitude b. Dependent Variable: Intention Model 1 Regression Residual Total (Constant) Attitude subjective Pbcontrol Unstandardized Coefficients a. Dependent Variable: Intention ANOVA b Sum of Squares df Mean Square F Sig a a. Predictors: (Constant), Pbcontrol, subjective, Attitude b. Dependent Variable: Intention Coefficients a Standardized Coefficients Collinearity Statistics B Std. Error Beta t Sig. Tolerance VIF
68 Assumptions Advanced Diagnostics (Hair et al., 2006) Predicted Value Std. Predicted Value Standard Error of Predicted Value Adjusted Predicted Value Residual Std. Residual Stud. Residual Deleted Residual Stud. Deleted Residual Mahal. Distance Cook's Distance Centered Leverage Value a. Dependent Variable: Intention Residuals Statistics a Std. Minimum Maximum Mean Deviation N
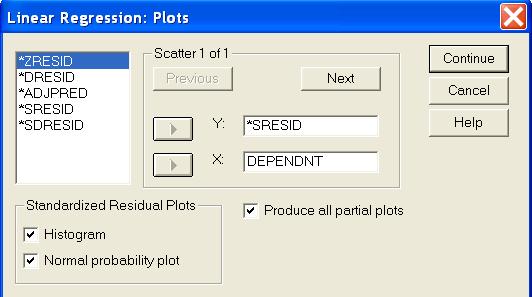
69 Frequency Assumptions (Normality) Histogram Dependent Variable: Intention Mean = -1.99E-17 Std. Dev. = N = 192 Regression Standardized Residual
70 Expected Cum Prob Assumptions (Normality of the Error term) Normal P-P Plot of Regression Standardized Residual Dependent Variable: Intention Observed Cum Prob 1.0
71 Regression Studentized Residual Assumptions (Constant Variance) Scatterplot Dependent Variable: Intention Intention
72 Intention Assumptions (Linearity) Partial Regression Plot Dependent Variable: Intention Attitude
73 Intention Assumptions (Linearity) Partial Regression Plot Dependent Variable: Intention subjective
74 Intention Assumptions (Linearity) Partial Regression Plot Dependent Variable: Intention Pbcontrol 0 1
75 Table Presentation Variable Attitude Subjective Norm Perceived Control R 2 Adjusted R 2 F Value D-W Dependent = Intention Standardized Beta 0.607** 0.238** 0.105** *p< 0.05, **p< 0.01

76
Selecting the Right Data Analysis Technique
 Selecting the Right Data Analysis Technique Levels of Measurement Nominal Ordinal Interval Ratio Discrete Continuous Continuous Variable Borgatta and Bohrnstedt state that "the most of central constructs
Item-Total Statistics
 64 Reliability Case Processing Summary N % Cases Valid 46 00.0 Excluded a 0.0 46 00.0 a. Listwise deletion based on all variables in the procedure. Reliability Statistics Cronbach's Alpha N of Items.869
Data Analysis Using SPSS. By: Akmal Aini Othman
 Data Analysis Using SPSS By: Akmal Aini Othman The key to GOOD descriptive research is knowing exactly what you want to measure and selecting a survey method in which every respondent is willing to cooperate
Data Analysis for Project. Tutorial
 Data Analysis for Project Tutorial Research Model Topic 2 Remanufactured Products Environmental Concern Attitude towards Recycling H2 (+) H1 (+) Subjective Norm Perceived Moral Obligation Convenience Perceived
Analysis and Interpretation of Data Part 1
 Analysis and Interpretation of Data Part 1 DATA ANALYSIS: PRELIMINARY STEPS 1. Editing Field Edit Completeness Legibility Comprehensibility Consistency Uniformity Central Office Edit 2. Coding Specifying
Quantitative Methods in Computing Education Research (A brief overview tips and techniques)
") Quantitative Methods in Computing Education Research (A brief overview tips and techniques) Dr Judy Sheard Senior Lecturer Co-Director, Computing Education Research Group Monash University judy.sheard@monash.edu
Quantitative Methods in Computing Education Research (A brief overview tips and techniques) Dr Judy Sheard Senior Lecturer Co-Director, Computing Education Research Group Monash University judy.sheard@monash.edu
MMI 409 Spring 2009 Final Examination Gordon Bleil. 1. Is there a difference in depression as a function of group and drug?
 MMI 409 Spring 2009 Final Examination Gordon Bleil Table of Contents Research Scenario and General Assumptions Questions for Dataset (Questions are hyperlinked to detailed answers) 1. Is there a difference
Statistics as a Tool. A set of tools for collecting, organizing, presenting and analyzing numerical facts or observations.
 Statistics as a Tool A set of tools for collecting, organizing, presenting and analyzing numerical facts or observations. Descriptive Statistics Numerical facts or observations that are organized describe
LAMPIRAN A KUISIONER
 LAMPIRAN A KUISIONER LAMPIRAN B UJI RELIABILITAS DAN UJI VALIDITAS A. Kecerdasan Emosional a. Putaran Pertama Case Processing Summary N % Cases Valid 60 100.0 Excluded a 0.0 60 100.0 a. Listwise deletion
Theoretical Exam. Monday 15 th, Instructor: Dr. Samir Safi. 1. Write your name, student ID and section number.
 بسم االله الرحمن الرحيم COMPUTER & DATA ANALYSIS Theoretical Exam FINAL THEORETICAL EXAMINATION Monday 15 th, 2007 Instructor: Dr. Samir Safi Name: ID Number: Instructor: INSTRUCTIONS: 1. Write your name,
bivariate analysis: The statistical analysis of the relationship between two variables.
 bivariate analysis: The statistical analysis of the relationship between two variables. cell frequency: The number of cases in a cell of a cross-tabulation (contingency table). chi-square (χ 2 ) test for
What you should know before you collect data. BAE 815 (Fall 2017) Dr. Zifei Liu
 Dr. Zifei Liu") What you should know before you collect data BAE 815 (Fall 2017) Dr. Zifei Liu Zifeiliu@ksu.edu Types and levels of study Descriptive statistics Inferential statistics How to choose a statistical test
What you should know before you collect data BAE 815 (Fall 2017) Dr. Zifei Liu Zifeiliu@ksu.edu Types and levels of study Descriptive statistics Inferential statistics How to choose a statistical test
Prepared by: Assoc. Prof. Dr Bahaman Abu Samah Department of Professional Development and Continuing Education Faculty of Educational Studies
 Prepared by: Assoc. Prof. Dr Bahaman Abu Samah Department of Professional Development and Continuing Education Faculty of Educational Studies Universiti Putra Malaysia Serdang At the end of this session,
Study Guide #2: MULTIPLE REGRESSION in education
 Study Guide #2: MULTIPLE REGRESSION in education What is Multiple Regression? When using Multiple Regression in education, researchers use the term independent variables to identify those variables that
Skala Stress. Putaran 1 Reliability. Case Processing Summary. N % Excluded a 0.0 Total
 Skala Stress Putaran 1 Reliability Case Processing Summary N % Cases Valid Excluded a 0.0 Total a. Listwise deletion based on all variables in the procedure. Reliability Statistics Cronbach's Alpha N of
Business Statistics Probability
 Business Statistics The following was provided by Dr. Suzanne Delaney, and is a comprehensive review of Business Statistics. The workshop instructor will provide relevant examples during the Skills Assessment
Introduction to Quantitative Methods (SR8511) Project Report
 Project Report") Introduction to Quantitative Methods (SR8511) Project Report Exploring the variables related to and possibly affecting the consumption of alcohol by adults Student Registration number: 554561 Word counts
Introduction to Quantitative Methods (SR8511) Project Report Exploring the variables related to and possibly affecting the consumption of alcohol by adults Student Registration number: 554561 Word counts
SUMMER 2011 RE-EXAM PSYF11STAT - STATISTIK
 SUMMER 011 RE-EXAM PSYF11STAT - STATISTIK Full Name: Årskortnummer: Date: This exam is made up of three parts: Part 1 includes 30 multiple choice questions; Part includes 10 matching questions; and Part
Applied Statistical Analysis EDUC 6050 Week 4
 Applied Statistical Analysis EDUC 6050 Week 4 Finding clarity using data Today 1. Hypothesis Testing with Z Scores (continued) 2. Chapters 6 and 7 in Book 2 Review! = $ & '! = $ & ' * ) 1. Which formula
isc ove ring i Statistics sing SPSS
 isc ove ring i Statistics sing SPSS S E C O N D! E D I T I O N (and sex, drugs and rock V roll) A N D Y F I E L D Publications London o Thousand Oaks New Delhi CONTENTS Preface How To Use This Book Acknowledgements
List of Figures. List of Tables. Preface to the Second Edition. Preface to the First Edition
 List of Figures List of Tables Preface to the Second Edition Preface to the First Edition xv xxv xxix xxxi 1 What Is R? 1 1.1 Introduction to R................................ 1 1.2 Downloading and Installing
Here are the various choices. All of them are found in the Analyze menu in SPSS, under the sub-menu for Descriptive Statistics :
 Descriptive Statistics in SPSS When first looking at a dataset, it is wise to use descriptive statistics to get some idea of what your data look like. Here is a simple dataset, showing three different
Statistical analysis DIANA SAPLACAN 2017 * SLIDES ADAPTED BASED ON LECTURE NOTES BY ALMA LEORA CULEN
 Statistical analysis DIANA SAPLACAN 2017 * SLIDES ADAPTED BASED ON LECTURE NOTES BY ALMA LEORA CULEN Vs. 2 Background 3 There are different types of research methods to study behaviour: Descriptive: observations,
ANOVA in SPSS (Practical)
") ANOVA in SPSS (Practical) Analysis of Variance practical In this practical we will investigate how we model the influence of a categorical predictor on a continuous response. Centre for Multilevel Modelling
ANOVA in SPSS (Practical) Analysis of Variance practical In this practical we will investigate how we model the influence of a categorical predictor on a continuous response. Centre for Multilevel Modelling
HOW STATISTICS IMPACT PHARMACY PRACTICE?
 HOW STATISTICS IMPACT PHARMACY PRACTICE? CPPD at NCCR 13 th June, 2013 Mohamed Izham M.I., PhD Professor in Social & Administrative Pharmacy Learning objective.. At the end of the presentation pharmacists
Before we get started:
 Before we get started: http://arievaluation.org/projects-3/ AEA 2018 R-Commander 1 Antonio Olmos Kai Schramm Priyalathta Govindasamy Antonio.Olmos@du.edu AntonioOlmos@aumhc.org AEA 2018 R-Commander 2 Plan
THE UNIVERSITY OF SUSSEX. BSc Second Year Examination DISCOVERING STATISTICS SAMPLE PAPER INSTRUCTIONS
 C8552 THE UNIVERSITY OF SUSSEX BSc Second Year Examination DISCOVERING STATISTICS SAMPLE PAPER INSTRUCTIONS Do not, under any circumstances, remove the question paper, used or unused, from the examination
Readings Assumed knowledge
 3 N = 59 EDUCAT 59 TEACHG 59 CAMP US 59 SOCIAL Analysis of Variance 95% CI Lecture 9 Survey Research & Design in Psychology James Neill, 2012 Readings Assumed knowledge Howell (2010): Ch3 The Normal Distribution
STATISTICS AND RESEARCH DESIGN
 Statistics 1 STATISTICS AND RESEARCH DESIGN These are subjects that are frequently confused. Both subjects often evoke student anxiety and avoidance. To further complicate matters, both areas appear have
Basic Biostatistics. Chapter 1. Content
 Chapter 1 Basic Biostatistics Jamalludin Ab Rahman MD MPH Department of Community Medicine Kulliyyah of Medicine Content 2 Basic premises variables, level of measurements, probability distribution Descriptive
Describe what is meant by a placebo Contrast the double-blind procedure with the single-blind procedure Review the structure for organizing a memo
 Please note the page numbers listed for the Lind book may vary by a page or two depending on which version of the textbook you have. Readings: Lind 1 11 (with emphasis on chapters 10, 11) Please note chapter
Still important ideas
 Readings: OpenStax - Chapters 1 11 + 13 & Appendix D & E (online) Plous - Chapters 2, 3, and 4 Chapter 2: Cognitive Dissonance, Chapter 3: Memory and Hindsight Bias, Chapter 4: Context Dependence Still
Describe what is meant by a placebo Contrast the double-blind procedure with the single-blind procedure Review the structure for organizing a memo
 Business Statistics The following was provided by Dr. Suzanne Delaney, and is a comprehensive review of Business Statistics. The workshop instructor will provide relevant examples during the Skills Assessment
Unit 1 Exploring and Understanding Data
 Unit 1 Exploring and Understanding Data Area Principle Bar Chart Boxplot Conditional Distribution Dotplot Empirical Rule Five Number Summary Frequency Distribution Frequency Polygon Histogram Interquartile
WELCOME! Lecture 11 Thommy Perlinger
 Quantitative Methods II WELCOME! Lecture 11 Thommy Perlinger Regression based on violated assumptions If any of the assumptions are violated, potential inaccuracies may be present in the estimated regression
Overview of Lecture. Survey Methods & Design in Psychology. Correlational statistics vs tests of differences between groups
 Survey Methods & Design in Psychology Lecture 10 ANOVA (2007) Lecturer: James Neill Overview of Lecture Testing mean differences ANOVA models Interactions Follow-up tests Effect sizes Parametric Tests
Statistics is the science of collecting, organizing, presenting, analyzing, and interpreting data to assist in making effective decisions
 Readings: OpenStax Textbook - Chapters 1 5 (online) Appendix D & E (online) Plous - Chapters 1, 5, 6, 13 (online) Introductory comments Describe how familiarity with statistical methods can - be associated
Subescala D CULTURA ORGANIZACIONAL. Factor Analysis
 Subescala D CULTURA ORGANIZACIONAL Factor Analysis Descriptive Statistics Mean Std. Deviation Analysis N 1 3,44 1,244 224 2 3,43 1,258 224 3 4,50,989 224 4 4,38 1,118 224 5 4,30 1,151 224 6 4,27 1,205
Small Group Presentations
 Admin Assignment 1 due next Tuesday at 3pm in the Psychology course centre. Matrix Quiz during the first hour of next lecture. Assignment 2 due 13 May at 10am. I will upload and distribute these at the
CHILD HEALTH AND DEVELOPMENT STUDY
 CHILD HEALTH AND DEVELOPMENT STUDY 9. Diagnostics In this section various diagnostic tools will be used to evaluate the adequacy of the regression model with the five independent variables developed in
0= Perempuan, 1= Laki-Laki
 Responden Menurut Umur Descriptive Statistics N Minimum Maximum Mean Std. Deviation Umur 34 21 56 28,12 6,763 Valid N (listwise) 34 Responden Menurut Jenis Kelamin 0= Perempuan, 1= Laki-Laki Jenis_Kelamin
Understandable Statistics
 Understandable Statistics correlated to the Advanced Placement Program Course Description for Statistics Prepared for Alabama CC2 6/2003 2003 Understandable Statistics 2003 correlated to the Advanced Placement
Health Consciousness of Siena Students
 Health Consciousness of Siena Students Corey Austin, Siena College Kevin Flood, Siena College Allison O Keefe, Siena College Kim Reuter, Siena College EXECUTIVE SUMMARY We decided to research the health
CHAPTER TWO REGRESSION
 CHAPTER TWO REGRESSION 2.0 Introduction The second chapter, Regression analysis is an extension of correlation. The aim of the discussion of exercises is to enhance students capability to assess the effect
Statistics: A Brief Overview Part I. Katherine Shaver, M.S. Biostatistician Carilion Clinic
 Statistics: A Brief Overview Part I Katherine Shaver, M.S. Biostatistician Carilion Clinic Statistics: A Brief Overview Course Objectives Upon completion of the course, you will be able to: Distinguish
Ecological Statistics
 A Primer of Ecological Statistics Second Edition Nicholas J. Gotelli University of Vermont Aaron M. Ellison Harvard Forest Sinauer Associates, Inc. Publishers Sunderland, Massachusetts U.S.A. Brief Contents
Daniel Boduszek University of Huddersfield
 Daniel Boduszek University of Huddersfield d.boduszek@hud.ac.uk Introduction to Multiple Regression (MR) Types of MR Assumptions of MR SPSS procedure of MR Example based on prison data Interpretation of
Describe what is meant by a placebo Contrast the double-blind procedure with the single-blind procedure Review the structure for organizing a memo
 Please note the page numbers listed for the Lind book may vary by a page or two depending on which version of the textbook you have. Readings: Lind 1 11 (with emphasis on chapters 5, 6, 7, 8, 9 10 & 11)
Table of Contents. Plots. Essential Statistics for Nursing Research 1/12/2017
 Essential Statistics for Nursing Research Kristen Carlin, MPH Seattle Nursing Research Workshop January 30, 2017 Table of Contents Plots Descriptive statistics Sample size/power Correlations Hypothesis
Daniel Boduszek University of Huddersfield
 Daniel Boduszek University of Huddersfield d.boduszek@hud.ac.uk Introduction to Correlation SPSS procedure for Pearson r Interpretation of SPSS output Presenting results Partial Correlation Correlation
Statistics Guide. Prepared by: Amanda J. Rockinson- Szapkiw, Ed.D.
 This guide contains a summary of the statistical terms and procedures. This guide can be used as a reference for course work and the dissertation process. However, it is recommended that you refer to statistical
EPS 625 INTERMEDIATE STATISTICS TWO-WAY ANOVA IN-CLASS EXAMPLE (FLEXIBILITY)
") EPS 625 INTERMEDIATE STATISTICS TO-AY ANOVA IN-CLASS EXAMPLE (FLEXIBILITY) A researcher conducts a study to evaluate the effects of the length of an exercise program on the flexibility of female and male
EPS 625 INTERMEDIATE STATISTICS TO-AY ANOVA IN-CLASS EXAMPLE (FLEXIBILITY) A researcher conducts a study to evaluate the effects of the length of an exercise program on the flexibility of female and male
RESULTS. Chapter INTRODUCTION
 8.1 Chapter 8 RESULTS 8.1 INTRODUCTION The previous chapter provided a theoretical discussion of the research and statistical methodology. This chapter focuses on the interpretation and discussion of the
STA 3024 Spring 2013 EXAM 3 Test Form Code A UF ID #
 STA 3024 Spring 2013 Name EXAM 3 Test Form Code A UF ID # Instructions: This exam contains 34 Multiple Choice questions. Each question is worth 3 points, for a total of 102 points (there are TWO bonus
Example of Interpreting and Applying a Multiple Regression Model
 Example of Interpreting and Applying a Multiple Regression We'll use the same data set as for the bivariate correlation example -- the criterion is 1 st year graduate grade point average and the predictors
Subescala B Compromisso com a organização escolar. Factor Analysis
 Subescala B Compromisso com a organização escolar Factor Analysis Descriptive Statistics Mean Std. Deviation Analysis N 1 4,42 1,108 233 2 4,41 1,001 233 3 4,99 1,261 233 4 4,37 1,055 233 5 4,48 1,018
Choosing the Correct Statistical Test
 Choosing the Correct Statistical Test T racie O. Afifi, PhD Departments of Community Health Sciences & Psychiatry University of Manitoba Department of Community Health Sciences COLLEGE OF MEDICINE, FACULTY
SPSS output for 420 midterm study
 Ψ Psy Midterm Part In lab (5 points total) Your professor decides that he wants to find out how much impact amount of study time has on the first midterm. He randomly assigns students to study for hours,
Learning Objectives 9/9/2013. Hypothesis Testing. Conflicts of Interest. Descriptive statistics: Numerical methods Measures of Central Tendency
 Conflicts of Interest I have no conflict of interest to disclose Biostatistics Kevin M. Sowinski, Pharm.D., FCCP Last-Chance Ambulatory Care Webinar Thursday, September 5, 2013 Learning Objectives For
Regression Including the Interaction Between Quantitative Variables
 Regression Including the Interaction Between Quantitative Variables The purpose of the study was to examine the inter-relationships among social skills, the complexity of the social situation, and performance
9/4/2013. Decision Errors. Hypothesis Testing. Conflicts of Interest. Descriptive statistics: Numerical methods Measures of Central Tendency
 Conflicts of Interest I have no conflict of interest to disclose Biostatistics Kevin M. Sowinski, Pharm.D., FCCP Pharmacotherapy Webinar Review Course Tuesday, September 3, 2013 Descriptive statistics:
Still important ideas
 Readings: OpenStax - Chapters 1 13 & Appendix D & E (online) Plous Chapters 17 & 18 - Chapter 17: Social Influences - Chapter 18: Group Judgments and Decisions Still important ideas Contrast the measurement
Collecting & Making Sense of
 Collecting & Making Sense of Quantitative Data Deborah Eldredge, PhD, RN Director, Quality, Research & Magnet Recognition i Oregon Health & Science University Margo A. Halm, RN, PhD, ACNS-BC, FAHA Director,
Applications. DSC 410/510 Multivariate Statistical Methods. Discriminating Two Groups. What is Discriminant Analysis
 DSC 4/5 Multivariate Statistical Methods Applications DSC 4/5 Multivariate Statistical Methods Discriminant Analysis Identify the group to which an object or case (e.g. person, firm, product) belongs:
CHAPTER VI RESEARCH METHODOLOGY
 CHAPTER VI RESEARCH METHODOLOGY 6.1 Research Design Research is an organized, systematic, data based, critical, objective, scientific inquiry or investigation into a specific problem, undertaken with the
NEUROBLASTOMA DATA -- TWO GROUPS -- QUANTITATIVE MEASURES 38 15:37 Saturday, January 25, 2003
 NEUROBLASTOMA DATA -- TWO GROUPS -- QUANTITATIVE MEASURES 38 15:37 Saturday, January 25, 2003 Obs GROUP I DOPA LNDOPA 1 neurblst 1 48.000 1.68124 2 neurblst 1 133.000 2.12385 3 neurblst 1 34.000 1.53148
Multiple Regression Using SPSS/PASW
 MultipleRegressionUsingSPSS/PASW The following sections have been adapted from Field (2009) Chapter 7. These sections have been edited down considerablyandisuggest(especiallyifyou reconfused)thatyoureadthischapterinitsentirety.youwillalsoneed
Dr. SANDHEEP S. (MBBS MD DPH) Dr. BENNY PV (MBBS MD DPH) (DATA ANALYSIS USING SPSS ILLUSTRATED WITH STEP-BY-STEP SCREENSHOTS)
 Dr. BENNY PV (MBBS MD DPH) (DATA ANALYSIS USING SPSS ILLUSTRATED WITH STEP-BY-STEP SCREENSHOTS)") Dr. SANDHEEP S. (MBBS MD DPH) Dr. BENNY PV (MBBS MD DPH) (DATA ANALYSIS USING SPSS ILLUSTRATED WITH STEP-BY-STEP SCREENSHOTS) Biostatistics in a Nut Shell For Medical Researchers i Publishing-in-support-of,
Dr. SANDHEEP S. (MBBS MD DPH) Dr. BENNY PV (MBBS MD DPH) (DATA ANALYSIS USING SPSS ILLUSTRATED WITH STEP-BY-STEP SCREENSHOTS) Biostatistics in a Nut Shell For Medical Researchers i Publishing-in-support-of,
This tutorial presentation is prepared by. Mohammad Ehsanul Karim
 STATA: The Red tutorial STATA: The Red tutorial This tutorial presentation is prepared by Mohammad Ehsanul Karim ehsan.karim@gmail.com STATA: The Red tutorial This tutorial presentation is prepared by
WDHS Curriculum Map Probability and Statistics. What is Statistics and how does it relate to you?
 WDHS Curriculum Map Probability and Statistics Time Interval/ Unit 1: Introduction to Statistics 1.1-1.3 2 weeks S-IC-1: Understand statistics as a process for making inferences about population parameters
PRINCIPLES OF STATISTICS
 PRINCIPLES OF STATISTICS STA-201-TE This TECEP is an introduction to descriptive and inferential statistics. Topics include: measures of central tendency, variability, correlation, regression, hypothesis
APÊNDICE 6. Análise fatorial e análise de consistência interna
 APÊNDICE 6 Análise fatorial e análise de consistência interna Subescala A Missão, a Visão e os Valores A ação do diretor Factor Analysis Descriptive Statistics Mean Std. Deviation Analysis N 1 4,46 1,056
Lampiran 4. Validitas dan Reliabilitas Prosoial Variabel Prososial (Putaran Pertama)
") 86 Lampiran 4. Validitas dan Reliabilitas Prosoial Variabel Prososial (Putaran Pertama) Case Processing Summary N % Cases Valid 31 100.0 Excluded a 0.0 Total 31 100.0 a. Listwise deletion based on all
86 Lampiran 4. Validitas dan Reliabilitas Prosoial Variabel Prososial (Putaran Pertama) Case Processing Summary N % Cases Valid 31 100.0 Excluded a 0.0 Total 31 100.0 a. Listwise deletion based on all
What Causes Stress in Malaysian Students and it Effect on Academic Performance: A case Revisited
 Advanced Journal of Technical and Vocational Education 1 (1): 155-160, 2017 eissn: 2550-2174 RMP Publications, 2017 What Causes Stress in Malaysian Students and it Effect on Academic Performance: A case
11/18/2013. Correlational Research. Correlational Designs. Why Use a Correlational Design? CORRELATIONAL RESEARCH STUDIES
 Correlational Research Correlational Designs Correlational research is used to describe the relationship between two or more naturally occurring variables. Is age related to political conservativism? Are
Using a Likert-type Scale DR. MIKE MARRAPODI
 Using a Likert-type Scale DR. MIKE MARRAPODI Topics Definition/Description Types of Scales Data Collection with Likert-type scales Analyzing Likert-type Scales Definition/Description A Likert-type Scale
Simple Linear Regression One Categorical Independent Variable with Several Categories
 Simple Linear Regression One Categorical Independent Variable with Several Categories Does ethnicity influence total GCSE score? We ve learned that variables with just two categories are called binary
AMSc Research Methods Research approach IV: Experimental [2]
![AMSc Research Methods Research approach IV: Experimental [2]](/thumbs/96/127502980.jpg "AMSc Research Methods Research approach IV: Experimental [2]") AMSc Research Methods Research approach IV: Experimental [2] Marie-Luce Bourguet mlb@dcs.qmul.ac.uk Statistical Analysis 1 Statistical Analysis Descriptive Statistics : A set of statistical procedures
AMSc Research Methods Research approach IV: Experimental [2] Marie-Luce Bourguet mlb@dcs.qmul.ac.uk Statistical Analysis 1 Statistical Analysis Descriptive Statistics : A set of statistical procedures
Overview of Non-Parametric Statistics
 Overview of Non-Parametric Statistics LISA Short Course Series Mark Seiss, Dept. of Statistics April 7, 2009 Presentation Outline 1. Homework 2. Review of Parametric Statistics 3. Overview Non-Parametric
Simple Linear Regression
 Simple Linear Regression Assoc. Prof Dr Sarimah Abdullah Unit of Biostatistics & Research Methodology School of Medical Sciences, Health Campus Universiti Sains Malaysia Regression Regression analysis
POST GRADUATE DIPLOMA IN BIOETHICS (PGDBE) Term-End Examination June, 2016 MHS-014 : RESEARCH METHODOLOGY
 Term-End Examination June, 2016 MHS-014 : RESEARCH METHODOLOGY") No. of Printed Pages : 12 MHS-014 POST GRADUATE DIPLOMA IN BIOETHICS (PGDBE) Term-End Examination June, 2016 MHS-014 : RESEARCH METHODOLOGY Time : 2 hours Maximum Marks : 70 PART A Attempt all questions.
No. of Printed Pages : 12 MHS-014 POST GRADUATE DIPLOMA IN BIOETHICS (PGDBE) Term-End Examination June, 2016 MHS-014 : RESEARCH METHODOLOGY Time : 2 hours Maximum Marks : 70 PART A Attempt all questions.
Chapter 1: Exploring Data
 Chapter 1: Exploring Data Key Vocabulary:! individual! variable! frequency table! relative frequency table! distribution! pie chart! bar graph! two-way table! marginal distributions! conditional distributions!
Chapter 10: Moderation, mediation and more regression
 Chapter 10: Moderation, mediation and more regression Smart Alex s Solutions Task 1 McNulty et al. (2008) found a relationship between a person s Attractiveness and how much Support they give their partner
1. Below is the output of a 2 (gender) x 3(music type) completely between subjects factorial ANOVA on stress ratings
 x 3(music type) completely between subjects factorial ANOVA on stress ratings") SPSS 3 Practice Interpretation questions A researcher is interested in the effects of music on stress levels, and how stress levels might be related to anxiety and life satisfaction. 1. Below is the output
SPSS 3 Practice Interpretation questions A researcher is interested in the effects of music on stress levels, and how stress levels might be related to anxiety and life satisfaction. 1. Below is the output
MULTIPLE LINEAR REGRESSION 24.1 INTRODUCTION AND OBJECTIVES OBJECTIVES
 24 MULTIPLE LINEAR REGRESSION 24.1 INTRODUCTION AND OBJECTIVES In the previous chapter, simple linear regression was used when you have one independent variable and one dependent variable. This chapter
Covered in Research Design/Grant Writing. Covered in Writing for Scientific Publication. (c) Alan Schwartz, UIC DME,
 Alan Schwartz, UIC DME,") MHPE 494: Data Analysis Alan Schwartz, PhD Matt Lineberry, PhD Department of Medical Education College of Medicine University of Illinois at Chicago Welcome! Your name, specialty, institution, position
MHPE 494: Data Analysis Alan Schwartz, PhD Matt Lineberry, PhD Department of Medical Education College of Medicine University of Illinois at Chicago Welcome! Your name, specialty, institution, position
THE STATSWHISPERER. Introduction to this Issue. Doing Your Data Analysis INSIDE THIS ISSUE
 Spring 20 11, Volume 1, Issue 1 THE STATSWHISPERER The StatsWhisperer Newsletter is published by staff at StatsWhisperer. Visit us at: www.statswhisperer.com Introduction to this Issue The current issue
MULTIPLE OLS REGRESSION RESEARCH QUESTION ONE:
 1 MULTIPLE OLS REGRESSION RESEARCH QUESTION ONE: Predicting State Rates of Robbery per 100K We know that robbery rates vary significantly from state-to-state in the United States. In any given state, we
Student name: SOCI 420 Advanced Methods of Social Research Fall 2017
 SOCI 420 Advanced Methods of Social Research Fall 2017 EXAM 1 RUBRIC Instructor: Ernesto F. L. Amaral, Assistant Professor, Department of Sociology Date: October 12, 2017 (Thursday) Section 904: 2:20 3:35pm
Explore. sexcntry Sex according to country. [DataSet1] D:\NORA\NORA Main File.sav
![Explore. sexcntry Sex according to country. [DataSet1] D:\NORA\NORA Main File.sav](/thumbs/82/84761267.jpg "Explore. sexcntry Sex according to country. [DataSet1] D:\NORA\NORA Main File.sav") EXAMINE VARIABLES=nc228 BY sexcntry /PLOT BOXPLOT HISTOGRAM NPPLOT /COMPARE GROUPS /STATISTICS DESCRIPTIVES /CINTERVAL 95 /MISSING LISTWISE /NOTOTAL. Explore Notes Output Created Comments Input Missing
EXAMINE VARIABLES=nc228 BY sexcntry /PLOT BOXPLOT HISTOGRAM NPPLOT /COMPARE GROUPS /STATISTICS DESCRIPTIVES /CINTERVAL 95 /MISSING LISTWISE /NOTOTAL. Explore Notes Output Created Comments Input Missing
ANSWERS TO EXERCISES AND REVIEW QUESTIONS
 ANSWERS TO EXERCISES AND REVIEW QUESTIONS PART THREE: PRELIMINARY ANALYSES Before attempting these questions read through Chapters 6, 7, 8, 9 and 10 of the SPSS Survival Manual. Descriptive statistics
Tutorial 3: MANOVA. Pekka Malo 30E00500 Quantitative Empirical Research Spring 2016
 Tutorial 3: Pekka Malo 30E00500 Quantitative Empirical Research Spring 2016 Step 1: Research design Adequacy of sample size Choice of dependent variables Choice of independent variables (treatment effects)
Readings: Textbook readings: OpenStax - Chapters 1 11 Online readings: Appendix D, E & F Plous Chapters 10, 11, 12 and 14
 Readings: Textbook readings: OpenStax - Chapters 1 11 Online readings: Appendix D, E & F Plous Chapters 10, 11, 12 and 14 Still important ideas Contrast the measurement of observable actions (and/or characteristics)
Announcement. Homework #2 due next Friday at 5pm. Midterm is in 2 weeks. It will cover everything through the end of next week (week 5).
.") Announcement Homework #2 due next Friday at 5pm. Midterm is in 2 weeks. It will cover everything through the end of next week (week 5). Political Science 15 Lecture 8: Descriptive Statistics (Part 1) Data
Announcement Homework #2 due next Friday at 5pm. Midterm is in 2 weeks. It will cover everything through the end of next week (week 5). Political Science 15 Lecture 8: Descriptive Statistics (Part 1) Data
On the purpose of testing:
 Why Evaluation & Assessment is Important Feedback to students Feedback to teachers Information to parents Information for selection and certification Information for accountability Incentives to increase
Correlation and Regression
 Dublin Institute of Technology ARROW@DIT Books/Book Chapters School of Management 2012-10 Correlation and Regression Donal O'Brien Dublin Institute of Technology, donal.obrien@dit.ie Pamela Sharkey Scott
Validity, Reliability and Classical Assumptions
 , Reliability and Classical Assumptions Presented by Mahendra AN Sources: www-psych.stanford.edu/~bigopp/.ppt http://ets.mnsu.edu/darbok/ethn402-502/reliability.ppt http://5martconsultingbandung.blogspot.com/2011/01/uji-asumsi-klasik.html
SPSS output for 420 midterm study
 Ψ Psy Midterm Part In lab (5 points total) Your professor decides that he wants to find out how much impact amount of study time has on the first midterm. He randomly assigns students to study for hours,
Statistics is the science of collecting, organizing, presenting, analyzing, and interpreting data to assist in making effective decisions
 Readings: OpenStax Textbook - Chapters 1 5 (online) Appendix D & E (online) Plous - Chapters 1, 5, 6, 13 (online) Introductory comments Describe how familiarity with statistical methods can - be associated
CHAPTER ONE CORRELATION
 CHAPTER ONE CORRELATION 1.0 Introduction The first chapter focuses on the nature of statistical data of correlation. The aim of the series of exercises is to ensure the students are able to use SPSS to