THE UNIVERSITY OF SUSSEX. BSc Second Year Examination DISCOVERING STATISTICS SAMPLE PAPER INSTRUCTIONS
|
|
|
- Marlene Washington
- 6 years ago
- Views:
Transcription
1 C8552 THE UNIVERSITY OF SUSSEX BSc Second Year Examination DISCOVERING STATISTICS SAMPLE PAPER INSTRUCTIONS Do not, under any circumstances, remove the question paper, used or unused, from the examination room; they will be collected before you may leave. Time allowed: 2 Hours Answer ALL questions in the answer book provided /Turn over
2 1. A record company executive was interested in the effects of subliminal messages on records having had many of his artists sued for allegedly having evil messages on their records (e.g. Ozzy Osbourne) that incited daft people to do stupid things like kill themselves. So, he took a record by Westlife and inserted different types of subliminal message onto different versions: (1) a control record didn t have any message (no message); (2) a second record had a friendly message that said Be happy and at one with your being (Friendly); (3) the third had the satanic message surrender your soul to beelzibub (Satan); (4) the fourth had another satanic message that instructed them to do a violent act Surrender your soul to the dark lord and sacrifice some goats while you re at it (Goats); and (5) a final record had the same satanic message about goats but it was played backwards (Backwards). He played the different types of record to different groups of teenagers. The outcome that the executive measured was the number of goats that each listener sacrificed. The SPSS Output is reproduced after the question. (a) What does Cohen s d represent? Compute and interpret Cohen s d for the difference in the number of goat s sacrificed in the Satan group and the No Message group [5 marks] (b) There are some numbers missing from the ANOVA summary table. Calculate these three values (residual sum of squares and mean squares and the F-ratio). [3 marks]. (c) Is the assumption of homogeneity of variance met? [3 marks] (d) What conclusions could we make about the effects of subliminal messages on records? [2 marks] (e) The executive made 3 predictions: (1) having no message, or a friendly message, would have less effect than having some kind of satanic message; (2) the backward satanic message would have more impact than the two non-backward messages; (3) the satanic message that specifically told people to kill goats would have more effect than the satanic message that did not. Suggest some planned contrasts (with the appropriate group codings) that could be done to test these hypotheses. [4 marks] (f) What do you understand by the term mean squares (i.e. conceptually speaking what does the mean squares in an ANOVA table represent)? [3 marks] 95% Confidence Interval for Mean N Mean Std. Deviation Std. Error Lower Bound Upper Bound No Message Friendly Satan Goats Backward Total /Turn over
3 Number of Goats Sacrificed Levene Statistic df1 df2 Sig Number of Goats Sacrificed ANOVA Sum of Squares df Mean Square F Sig. Between Groups Within Groups 31 Total Robust Tests of Equality of Means Number of Goats Sacrificed Statistic a df1 df2 Sig. Welch Brown-Forsythe a. Asymptotically F distributed. 2. An experiment was done to look at the positive arousing effects of imagery on different people. A sample of statistics lecturers was compared against a group of students. Both groups received presentations of positive images (e.g. cats and bunnies), neutral images (e.g. duvets and lightbulbs), and negative images (e.g. corpses and vivisection photographs). Positive arousal was measured physiologically (high values indicate positive arousal) both before and after each batch of images. The order in which participants saw the batches of positive, neutral and negative images was randomised to avoid order effects. It was hypothesised that positive images would increase positive arousal, negative images would reduce positive arousal and that neutral images would have no effect. Differences between the participant groups (lecturers and students) were not expected. The SPSS Output is reproduced after the question. (a) What type of analysis has been carried out (briefly describe the design in answering this question)? [2 marks] (b) With reference to the current experiment, what are the relative pros and cons of repeated measures experimental designs compared to independent (aka between-group) ones? [5 marks] (c) Are any assumptions broken and if so what impact does that have? [3 marks] (d) Interpret the output in full: do students and statistics lecturers differ in the type of stimuli that arouse them? Are statistics lecturers more aroused than 3 /Turn over
4 students in general? Do the images vary in the degree to which they affect physiological arousal? [10 marks] Descriptive Statistics Arousal Before Positive Imagery Arousal Before Neutral Imagery Arousal Before Negative Imagery Arousal After Positive Imagery Arousal After Neutral Imagery Arousal After Negative Imagery Group Statistics Lecturers Total Statistics Lecturers Total Statistics Lecturers Total Statistics Lecturers Total Statistics Lecturers Total Statistics Lecturers Total Mean Std. Deviation N Mauchly's Test of Sphericity b Measure: MEASURE_1 Within Subjects Effect TIME IMAGERY TIME * IMAGERY Epsilon a Approx. Greenhous Mauchly's W Chi-Square df Sig. e-geisser Tests the null hypothesis that the error covariance matrix of the orthonormalized transformed dependent variables is proportional to an identity matrix. a. May be used to adjust the degrees of freedom for the averaged tests of significance. Corrected tests are displayed in the Tests of Within-Subjects Effects table. b. Design: Intercept+GROUP Within Subjects Design: TIME+IMAGERY+TIME*IMAGERY 4 /Turn over
5 Tests of Within-Subjects Effects Measure: MEASURE_1 Source TIME TIME * GROUP Error(TIME) IMAGERY IMAGERY * GROUP Error(IMAGERY) TIME * IMAGERY TIME * IMAGERY * GROUP Error(TIME*IMAGERY) Type III Sum of Squares df Mean Square F Sig Arousal Before Positive Imagery Arousal Before Neutral Imagery Arousal Before Negative Imagery Arousal After Positive Imagery Arousal After Neutral Imagery Arousal After Negative Imagery Levene's Test of Equality of Error Variances a F df1 df2 Sig Tests the null hypothesis that the error variance of the dependent variable is equal across groups. a. Design: Intercept+GROUP Within Subjects Design: TIME+IMAGERY+TIME*IMAGERY 5 /Turn over
6 Measure: MEASURE_1 Transformed Variable: Average Source Intercept GROUP Error Tests of Between-Subjects Effects Type III Sum of Squares df Mean Square F Sig Mean Arousal Before Imagery Figure 1: Mean arousal before and after imagery Time After Imagery 6 /Turn over
7 Mean Arousal Statistics Lecturers Group Figure 2: Mean arousal for statistics lecturers and students 8 Mean Arousal Negative Neutral Positive Type of Imagery Figure 3: Mean arousal for different types of imagery 7 /Turn over
8 10 Mean Arousal Group Statistics Lecturers 2 Before Imagery After Imagery Time Figure 4: Mean arousal before and after imagery in statistics lecturers and students Mean Arousal 5 0 Group Statistics Lecturers Negative Neutral Positive Time Figure 5: Mean arousal after different types of imagery in statistics lecturers and students 8 /Turn over
9 14 12 Mean Arousal Imagery Negative Neutral Positive 4 2 Before Imagery Time After Imagery Figure 6: Mean arousal before and after different types of imagery 15 Statistics Lecturers 10 Mean Arousal 5 0 Imagery Negative Neutral Positive 5 10 Before Imagery After Imagery Time Before Imagery After Imagery Figure 7: Mean arousal before and after different types of imagery in statistics lecturers and students 9 /Turn over
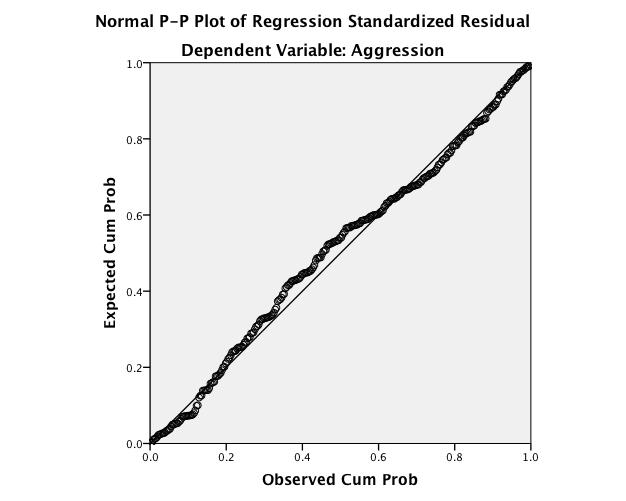
10 3. A study was carried out to explore the relationship between aggression and several potential predicting factors in 300 children that had an older sibling. Variables measured were Parenting Style (high score = strict, low score = liberal), Computer Games (high score = more time spent playing computer games), Television (high score = more time spent watching television), E- numbers (high score = more e-numbers in the child s diet), and Sibling Aggression (high score = more aggression seen in their older sibling). The SPSS Output is reproduced after the question. (a) What is a bootstrap confidence interval and when would you use one? [3 marks] (b) What factors predict aggression and which do not (quote the relevant statistics)? Which is the most substantial predictor? [6 marks] (c) The R 2 statistic is the squared correlation coefficient between which two variables? How would you interpret the four values of R 2 in this output? [4 marks] (d) What assumption does the Durbin-Watson statistic help us to assess? Describe what you understand the assumption to mean and whether it has been met in these data. [3 marks] (e) What assumption does the scatterplot in this output assess? Describe what you understand the assumption to mean and whether it has been met in these data. [4 marks] Variables Entered/Removed a Model Variables Entered Variables Removed Method 1 Sibling Aggression, Parenting Style b. Enter 2 Computer Games b. Enter 3 E-Numbers b. Enter 4 Television b. Enter a. Dependent Variable: Aggression b. All requested variables entered. Model Summary e Change Statistics Model R R Square Adjusted R Square Std. Error of the Estimate R Square Change F Change df1 df2 Sig. F Change Durbin- Watson a b c d a. Predictors: (Constant), Sibling Aggression, Parenting Style b. Predictors: (Constant), Sibling Aggression, Parenting Style, Computer Games c. Predictors: (Constant), Sibling Aggression, Parenting Style, Computer Games, E-Numbers d. Predictors: (Constant), Sibling Aggression, Parenting Style, Computer Games, E-Numbers, Television e. Dependent Variable: Aggression 10 /Turn over
11 ANOVA a Model Sum of Squares df Mean Square F Sig. Regression b Residual Total Regression c Residual Total Regression d Residual Total Regression e Residual Total a. Dependent Variable: Aggression b. Predictors: (Constant), Parenting Style, Sibling Aggression c. Predictors: (Constant), Parenting Style, Sibling Aggression, Computer Games d. Predictors: (Constant), Parenting Style, Sibling Aggression, Computer Games, E-Numbers e. Predictors: (Constant), Parenting Style, Sibling Aggression, Computer Games, E-Numbers, Television 11 /Turn over
12 Coefficients a Unstandardized Coefficients Standardized Coefficients 95.0% Confidence Interval for B Collinearity Statistics Model B Std. Error Beta t Sig. Lower Bound Upper Bound Tolerance VIF (Constant) Sibling Aggression Parenting Style (Constant) Sibling Aggression Parenting Style Computer Games (Constant) Sibling Aggression Parenting Style Computer Games E-Numbers (Constant) Sibling Aggression Parenting Style Computer Games E-Numbers Television a. Dependent Variable: Aggression 12 /Turn over
13 Bootstrap for Coefficients Bootstrap a Model B Bias Std. Error Sig. (2- tailed) BCa 95% Confidence Interval Lower Upper (Constant) Sibling Aggression Parenting Style (Constant) Sibling Aggression Parenting Style Computer Games (Constant) Sibling Aggression Parenting Style Computer Games E-Numbers (Constant) Sibling Aggression E Parenting Style Computer Games E-Numbers E Television a. Unless otherwise noted, bootstrap results are based on 1000 bootstrap samples Casewise Diagnostics a Case Number Std. Residual Aggression Predicted Value Residual a. Dependent Variable: Aggression 13 /Turn over

14 14 /Turn over

15 15 /Turn over
16 FORMULAE dd = XX!"#$%&'$()*+ XX!"#$%"& ss!"#$%"& dd =!!!!! ss!! =!!!!!!!!!!!!!!!!!!!!!!! MS = SS df F = MS M MS R RR! = SS M SS T rr =!!!!!!" rr =!(!,!)!(!,!)!!" R df T = N 1 df M = k 1 df R = df T df M zz = XX XX ss END OF PAPER 16 /Turn over
Sample Exam Paper Answer Guide
 Sample Exam Paper Answer Guide Notes This handout provides perfect answers to the sample exam paper. I would not expect you to be able to produce such perfect answers in an exam. So, use this document
Advanced ANOVA Procedures
 Advanced ANOVA Procedures Session Lecture Outline:. An example. An example. Two-way ANOVA. An example. Two-way Repeated Measures ANOVA. MANOVA. ANalysis of Co-Variance (): an ANOVA procedure whereby the
Analysis of Variance: repeated measures
 Analysis of Variance: repeated measures Tests for comparing three or more groups or conditions: (a) Nonparametric tests: Independent measures: Kruskal-Wallis. Repeated measures: Friedman s. (b) Parametric
Repeated Measures ANOVA and Mixed Model ANOVA. Comparing more than two measurements of the same or matched participants
 Repeated Measures ANOVA and Mixed Model ANOVA Comparing more than two measurements of the same or matched participants Data files Fatigue.sav MentalRotation.sav AttachAndSleep.sav Attitude.sav Homework:
SPSS output for 420 midterm study
 Ψ Psy Midterm Part In lab (5 points total) Your professor decides that he wants to find out how much impact amount of study time has on the first midterm. He randomly assigns students to study for hours,
Overview of Lecture. Survey Methods & Design in Psychology. Correlational statistics vs tests of differences between groups
 Survey Methods & Design in Psychology Lecture 10 ANOVA (2007) Lecturer: James Neill Overview of Lecture Testing mean differences ANOVA models Interactions Follow-up tests Effect sizes Parametric Tests
SPSS output for 420 midterm study
 Ψ Psy Midterm Part In lab (5 points total) Your professor decides that he wants to find out how much impact amount of study time has on the first midterm. He randomly assigns students to study for hours,
SUMMER 2011 RE-EXAM PSYF11STAT - STATISTIK
 SUMMER 011 RE-EXAM PSYF11STAT - STATISTIK Full Name: Årskortnummer: Date: This exam is made up of three parts: Part 1 includes 30 multiple choice questions; Part includes 10 matching questions; and Part
Item-Total Statistics
 64 Reliability Case Processing Summary N % Cases Valid 46 00.0 Excluded a 0.0 46 00.0 a. Listwise deletion based on all variables in the procedure. Reliability Statistics Cronbach's Alpha N of Items.869
Chapter 11: Comparing several means
 Chapter 11: Comparing several means Smart Alex s Solutions Task 1 To test how different teaching methods affected students knowledge I took three statistics courses where I taught the same material. For
Readings Assumed knowledge
 3 N = 59 EDUCAT 59 TEACHG 59 CAMP US 59 SOCIAL Analysis of Variance 95% CI Lecture 9 Survey Research & Design in Psychology James Neill, 2012 Readings Assumed knowledge Howell (2010): Ch3 The Normal Distribution
Business Research Methods. Introduction to Data Analysis
 Business Research Methods Introduction to Data Analysis Data Analysis Process STAGES OF DATA ANALYSIS EDITING CODING DATA ENTRY ERROR CHECKING AND VERIFICATION DATA ANALYSIS Introduction Preparation of
Daniel Boduszek University of Huddersfield
 Daniel Boduszek University of Huddersfield d.boduszek@hud.ac.uk Introduction to Multiple Regression (MR) Types of MR Assumptions of MR SPSS procedure of MR Example based on prison data Interpretation of
C.3 Repeated Measures ANOVA
 C. Repeated Measures ANOVA A study was conducted to find the effect of yoga on lowering the total serum cholesterol level in newly diagnosed patients of hypercholesterolemia. Thirty patients were selected
Subescala D CULTURA ORGANIZACIONAL. Factor Analysis
 Subescala D CULTURA ORGANIZACIONAL Factor Analysis Descriptive Statistics Mean Std. Deviation Analysis N 1 3,44 1,244 224 2 3,43 1,258 224 3 4,50,989 224 4 4,38 1,118 224 5 4,30 1,151 224 6 4,27 1,205
Study Guide #2: MULTIPLE REGRESSION in education
 Study Guide #2: MULTIPLE REGRESSION in education What is Multiple Regression? When using Multiple Regression in education, researchers use the term independent variables to identify those variables that
Subescala B Compromisso com a organização escolar. Factor Analysis
 Subescala B Compromisso com a organização escolar Factor Analysis Descriptive Statistics Mean Std. Deviation Analysis N 1 4,42 1,108 233 2 4,41 1,001 233 3 4,99 1,261 233 4 4,37 1,055 233 5 4,48 1,018
Chapter 10: Moderation, mediation and more regression
 Chapter 10: Moderation, mediation and more regression Smart Alex s Solutions Task 1 McNulty et al. (2008) found a relationship between a person s Attractiveness and how much Support they give their partner
Chapter 12: Analysis of covariance, ANCOVA
 Chapter 12: Analysis of covariance, ANCOVA Smart Alex s Solutions Task 1 A few years back I was stalked. You d think they could have found someone a bit more interesting to stalk, but apparently times
EPS 625 INTERMEDIATE STATISTICS TWO-WAY ANOVA IN-CLASS EXAMPLE (FLEXIBILITY)
") EPS 625 INTERMEDIATE STATISTICS TO-AY ANOVA IN-CLASS EXAMPLE (FLEXIBILITY) A researcher conducts a study to evaluate the effects of the length of an exercise program on the flexibility of female and male
EPS 625 INTERMEDIATE STATISTICS TO-AY ANOVA IN-CLASS EXAMPLE (FLEXIBILITY) A researcher conducts a study to evaluate the effects of the length of an exercise program on the flexibility of female and male
MMI 409 Spring 2009 Final Examination Gordon Bleil. 1. Is there a difference in depression as a function of group and drug?
 MMI 409 Spring 2009 Final Examination Gordon Bleil Table of Contents Research Scenario and General Assumptions Questions for Dataset (Questions are hyperlinked to detailed answers) 1. Is there a difference
WELCOME! Lecture 11 Thommy Perlinger
 Quantitative Methods II WELCOME! Lecture 11 Thommy Perlinger Regression based on violated assumptions If any of the assumptions are violated, potential inaccuracies may be present in the estimated regression
Chapter 9: Comparing two means
 Chapter 9: Comparing two means Smart Alex s Solutions Task 1 Is arachnophobia (fear of spiders) specific to real spiders or will pictures of spiders evoke similar levels of anxiety? Twelve arachnophobes
Chapter 9: Answers. Tests of Between-Subjects Effects. Dependent Variable: Time Spent Stalking After Therapy (hours per week)
") Task 1 Chapter 9: Answers Stalking is a very disruptive and upsetting (for the person being stalked) experience in which someone (the stalker) constantly harasses or obsesses about another person. It can
Task 1 Chapter 9: Answers Stalking is a very disruptive and upsetting (for the person being stalked) experience in which someone (the stalker) constantly harasses or obsesses about another person. It can
Regression. Page 1. Variables Entered/Removed b Variables. Variables Removed. Enter. Method. Psycho_Dum
 Regression Model Variables Entered/Removed b Variables Entered Variables Removed Method Meds_Dum,. Enter Psycho_Dum a. All requested variables entered. b. Dependent Variable: Beck's Depression Score Model
Simple Linear Regression
 Simple Linear Regression Assoc. Prof Dr Sarimah Abdullah Unit of Biostatistics & Research Methodology School of Medical Sciences, Health Campus Universiti Sains Malaysia Regression Regression analysis
Chapter 6: Non-parametric models
 Chapter 6: Non-parametric models Smart Alex s Solutions Task 1 A psychologist was interested in the cross- species differences between men and dogs. She observed a group of dogs and a group of men in a
ANOVA in SPSS (Practical)
") ANOVA in SPSS (Practical) Analysis of Variance practical In this practical we will investigate how we model the influence of a categorical predictor on a continuous response. Centre for Multilevel Modelling
ANOVA in SPSS (Practical) Analysis of Variance practical In this practical we will investigate how we model the influence of a categorical predictor on a continuous response. Centre for Multilevel Modelling
Example of Interpreting and Applying a Multiple Regression Model
 Example of Interpreting and Applying a Multiple Regression We'll use the same data set as for the bivariate correlation example -- the criterion is 1 st year graduate grade point average and the predictors
Comparing 3 Means- ANOVA
 Comparing 3 Means- ANOVA Evaluation Methods & Statistics- Lecture 7 Dr Benjamin Cowan Research Example- Theory of Planned Behaviour Ajzen & Fishbein (1981) One of the most prominent models of behaviour
Chapter 7: Correlation
 Chapter 7: Correlation Smart Alex s Solutions Task 1 A student was interested in whether there was a positive relationship between the time spent doing an essay and the mark received. He got 45 of his
Research paper. One-way Analysis of Variance (ANOVA) Research paper. SPSS output. Learning objectives. Alcohol and driving ability
 Research paper. SPSS output. Learning objectives. Alcohol and driving ability") Research paper Alcohol and driving ability One-way Analysis of Variance (ANOVA) Thirty-six people took part in an experiment to discover the effects of alcohol on drinking ability. They were randomly assigned
Research paper Alcohol and driving ability One-way Analysis of Variance (ANOVA) Thirty-six people took part in an experiment to discover the effects of alcohol on drinking ability. They were randomly assigned
APÊNDICE 6. Análise fatorial e análise de consistência interna
 APÊNDICE 6 Análise fatorial e análise de consistência interna Subescala A Missão, a Visão e os Valores A ação do diretor Factor Analysis Descriptive Statistics Mean Std. Deviation Analysis N 1 4,46 1,056
Correlation and Regression
 Dublin Institute of Technology ARROW@DIT Books/Book Chapters School of Management 2012-10 Correlation and Regression Donal O'Brien Dublin Institute of Technology, donal.obrien@dit.ie Pamela Sharkey Scott
CHAPTER TWO REGRESSION
 CHAPTER TWO REGRESSION 2.0 Introduction The second chapter, Regression analysis is an extension of correlation. The aim of the discussion of exercises is to enhance students capability to assess the effect
Statistics as a Tool. A set of tools for collecting, organizing, presenting and analyzing numerical facts or observations.
 Statistics as a Tool A set of tools for collecting, organizing, presenting and analyzing numerical facts or observations. Descriptive Statistics Numerical facts or observations that are organized describe
PSY 216: Elementary Statistics Exam 4
 Name: PSY 16: Elementary Statistics Exam 4 This exam consists of multiple-choice questions and essay / problem questions. For each multiple-choice question, circle the one letter that corresponds to the
Research paper. Split-plot ANOVA. Split-plot design. Split-plot design. SPSS output: between effects. SPSS output: within effects
 Research paper Effects of alcohol and caffeine on driving ability Split-plot ANOVA conditions: No alcohol; no caffeine alcohol; no caffeine No alcohol; caffeine Alcohol; caffeine Driving in simulator Error
Regression Including the Interaction Between Quantitative Variables
 Regression Including the Interaction Between Quantitative Variables The purpose of the study was to examine the inter-relationships among social skills, the complexity of the social situation, and performance
1. Below is the output of a 2 (gender) x 3(music type) completely between subjects factorial ANOVA on stress ratings
 x 3(music type) completely between subjects factorial ANOVA on stress ratings") SPSS 3 Practice Interpretation questions A researcher is interested in the effects of music on stress levels, and how stress levels might be related to anxiety and life satisfaction. 1. Below is the output
SPSS 3 Practice Interpretation questions A researcher is interested in the effects of music on stress levels, and how stress levels might be related to anxiety and life satisfaction. 1. Below is the output
Business Statistics Probability
 Business Statistics The following was provided by Dr. Suzanne Delaney, and is a comprehensive review of Business Statistics. The workshop instructor will provide relevant examples during the Skills Assessment
0= Perempuan, 1= Laki-Laki
 Responden Menurut Umur Descriptive Statistics N Minimum Maximum Mean Std. Deviation Umur 34 21 56 28,12 6,763 Valid N (listwise) 34 Responden Menurut Jenis Kelamin 0= Perempuan, 1= Laki-Laki Jenis_Kelamin
Simple Linear Regression One Categorical Independent Variable with Several Categories
 Simple Linear Regression One Categorical Independent Variable with Several Categories Does ethnicity influence total GCSE score? We ve learned that variables with just two categories are called binary
Multiple Regression Using SPSS/PASW
 MultipleRegressionUsingSPSS/PASW The following sections have been adapted from Field (2009) Chapter 7. These sections have been edited down considerablyandisuggest(especiallyifyou reconfused)thatyoureadthischapterinitsentirety.youwillalsoneed
Chapter 13: Factorial ANOVA
 Chapter 13: Factorial ANOVA Smart Alex s Solutions Task 1 People s musical tastes tend to change as they get older. My parents, for example, after years of listening to relatively cool music when I was
One-Way Independent ANOVA
 One-Way Independent ANOVA Analysis of Variance (ANOVA) is a common and robust statistical test that you can use to compare the mean scores collected from different conditions or groups in an experiment.
12/31/2016. PSY 512: Advanced Statistics for Psychological and Behavioral Research 2
 PSY 512: Advanced Statistics for Psychological and Behavioral Research 2 Introduce moderated multiple regression Continuous predictor continuous predictor Continuous predictor categorical predictor Understand
Chapter 11 Multiple Regression
 Chapter 11 Multiple Regression PSY 295 Oswald Outline The problem An example Compensatory and Noncompensatory Models More examples Multiple correlation Chapter 11 Multiple Regression 2 Cont. Outline--cont.
Small Group Presentations
 Admin Assignment 1 due next Tuesday at 3pm in the Psychology course centre. Matrix Quiz during the first hour of next lecture. Assignment 2 due 13 May at 10am. I will upload and distribute these at the
European Journal of Physical Education and Sport, 2016, Vol.(14), Is. 4
, Is. 4") Copyright 2016 by Academic Publishing House Researcher Published in the Russian Federation European Journal of Physical Education and Sport Has been issued since 2013. ISSN: 2310-0133 E-ISSN: 2409-1952
Copyright 2016 by Academic Publishing House Researcher Published in the Russian Federation European Journal of Physical Education and Sport Has been issued since 2013. ISSN: 2310-0133 E-ISSN: 2409-1952
isc ove ring i Statistics sing SPSS
 isc ove ring i Statistics sing SPSS S E C O N D! E D I T I O N (and sex, drugs and rock V roll) A N D Y F I E L D Publications London o Thousand Oaks New Delhi CONTENTS Preface How To Use This Book Acknowledgements
Analysis of Variance (ANOVA)
") Research Methods and Ethics in Psychology Week 4 Analysis of Variance (ANOVA) One Way Independent Groups ANOVA Brief revision of some important concepts To introduce the concept of familywise error rate.
Research Methods and Ethics in Psychology Week 4 Analysis of Variance (ANOVA) One Way Independent Groups ANOVA Brief revision of some important concepts To introduce the concept of familywise error rate.
HS Exam 1 -- March 9, 2006
 Please write your name on the back. Don t forget! Part A: Short answer, multiple choice, and true or false questions. No use of calculators, notes, lab workbooks, cell phones, neighbors, brain implants,
Two-Way Independent Samples ANOVA with SPSS
 Two-Way Independent Samples ANOVA with SPSS Obtain the file ANOVA.SAV from my SPSS Data page. The data are those that appear in Table 17-3 of Howell s Fundamental statistics for the behavioral sciences
CRITERIA FOR USE. A GRAPHICAL EXPLANATION OF BI-VARIATE (2 VARIABLE) REGRESSION ANALYSISSys
 REGRESSION ANALYSISSys") Multiple Regression Analysis 1 CRITERIA FOR USE Multiple regression analysis is used to test the effects of n independent (predictor) variables on a single dependent (criterion) variable. Regression tests
Multiple Regression Analysis 1 CRITERIA FOR USE Multiple regression analysis is used to test the effects of n independent (predictor) variables on a single dependent (criterion) variable. Regression tests
One-Way ANOVAs t-test two statistically significant Type I error alpha null hypothesis dependant variable Independent variable three levels;
 1 One-Way ANOVAs We have already discussed the t-test. The t-test is used for comparing the means of two groups to determine if there is a statistically significant difference between them. The t-test
The SAGE Encyclopedia of Educational Research, Measurement, and Evaluation Multivariate Analysis of Variance
 The SAGE Encyclopedia of Educational Research, Measurement, Multivariate Analysis of Variance Contributors: David W. Stockburger Edited by: Bruce B. Frey Book Title: Chapter Title: "Multivariate Analysis
Data Analysis in Practice-Based Research. Stephen Zyzanski, PhD Department of Family Medicine Case Western Reserve University School of Medicine
 Data Analysis in Practice-Based Research Stephen Zyzanski, PhD Department of Family Medicine Case Western Reserve University School of Medicine Multilevel Data Statistical analyses that fail to recognize
ANALYSIS OF VARIANCE (ANOVA): TESTING DIFFERENCES INVOLVING THREE OR MORE MEANS
: TESTING DIFFERENCES INVOLVING THREE OR MORE MEANS") ANALYSIS OF VARIANCE (ANOVA): TESTING DIFFERENCES INVOLVING THREE OR MORE MEANS REVIEW Testing hypothesis using the difference between two means: One-sample t-test Independent-samples t-test Dependent/Paired-samples
ANALYSIS OF VARIANCE (ANOVA): TESTING DIFFERENCES INVOLVING THREE OR MORE MEANS REVIEW Testing hypothesis using the difference between two means: One-sample t-test Independent-samples t-test Dependent/Paired-samples
Repeated Measures ANOVA
 Introduction Repeated Measures ANOVA Repeated measures is a term used when the same participants participate in all conditions of an experiment. So, for example, you might want to test the effects of alcohol
What Causes Stress in Malaysian Students and it Effect on Academic Performance: A case Revisited
 Advanced Journal of Technical and Vocational Education 1 (1): 155-160, 2017 eissn: 2550-2174 RMP Publications, 2017 What Causes Stress in Malaysian Students and it Effect on Academic Performance: A case
THE STATSWHISPERER. Introduction to this Issue. Doing Your Data Analysis INSIDE THIS ISSUE
 Spring 20 11, Volume 1, Issue 1 THE STATSWHISPERER The StatsWhisperer Newsletter is published by staff at StatsWhisperer. Visit us at: www.statswhisperer.com Introduction to this Issue The current issue
HPS301 Exam Notes- Contents
 HPS301 Exam Notes- Contents Week 1 Research Design: What characterises different approaches 1 Experimental Design 1 Key Features 1 Criteria for establishing causality 2 Validity Internal Validity 2 Threats
CHAPTER ONE CORRELATION
 CHAPTER ONE CORRELATION 1.0 Introduction The first chapter focuses on the nature of statistical data of correlation. The aim of the series of exercises is to ensure the students are able to use SPSS to
Final Exam PS 217, Spring 2004
 Final Exam PS 217, Spring 24 1. What is the relationship between power and effect size? That is, when you are considering a research design in which there is a large effect size, what are the implications
Between Groups & Within-Groups ANOVA
 Between Groups & Within-Groups ANOVA BG & WG ANOVA Partitioning Variation making F making effect sizes Things that influence F Confounding Inflated within-condition variability Integrating stats & methods
ID# Final Exam PS 217, Spring 2002 (You must use your Skidmore ID#!)
") ID# Final Exam PS 217, Spring 2002 (You must use your Skidmore ID#!) OK, here s the last stats exam the one that you ve been anxiously awaiting. As always, you should adhere to the Skidmore Honor Code.
ID# Final Exam PS 217, Spring 2002 (You must use your Skidmore ID#!) OK, here s the last stats exam the one that you ve been anxiously awaiting. As always, you should adhere to the Skidmore Honor Code.
MULTIPLE LINEAR REGRESSION 24.1 INTRODUCTION AND OBJECTIVES OBJECTIVES
 24 MULTIPLE LINEAR REGRESSION 24.1 INTRODUCTION AND OBJECTIVES In the previous chapter, simple linear regression was used when you have one independent variable and one dependent variable. This chapter
PSYCHOLOGY 320L Problem Set #4: Estimating Sample Size, Post Hoc Tests, and Two-Factor ANOVA
 PSYCHOLOGY 320L Problem Set #4: Estimating Sample Size, Post Hoc Tests, and Two-Factor ANOVA Name: Score: 1. Suppose you are planning an experiment for a class project with a group of students and you
Still important ideas
 Readings: OpenStax - Chapters 1 11 + 13 & Appendix D & E (online) Plous - Chapters 2, 3, and 4 Chapter 2: Cognitive Dissonance, Chapter 3: Memory and Hindsight Bias, Chapter 4: Context Dependence Still
(C) Jamalludin Ab Rahman
 Jamalludin Ab Rahman") SPSS Note The GLM Multivariate procedure is based on the General Linear Model procedure, in which factors and covariates are assumed to have a linear relationship to the dependent variable. Factors. Categorical
SPSS Note The GLM Multivariate procedure is based on the General Linear Model procedure, in which factors and covariates are assumed to have a linear relationship to the dependent variable. Factors. Categorical
Two-Way Independent ANOVA
 Two-Way Independent ANOVA Analysis of Variance (ANOVA) a common and robust statistical test that you can use to compare the mean scores collected from different conditions or groups in an experiment. There
Multiple Regression Analysis
 Multiple Regression Analysis Basic Concept: Extend the simple regression model to include additional explanatory variables: Y = β 0 + β1x1 + β2x2 +... + βp-1xp + ε p = (number of independent variables
Readings: Textbook readings: OpenStax - Chapters 1 11 Online readings: Appendix D, E & F Plous Chapters 10, 11, 12 and 14
 Readings: Textbook readings: OpenStax - Chapters 1 11 Online readings: Appendix D, E & F Plous Chapters 10, 11, 12 and 14 Still important ideas Contrast the measurement of observable actions (and/or characteristics)
Daniel Boduszek University of Huddersfield
 Daniel Boduszek University of Huddersfield d.boduszek@hud.ac.uk Introduction to Logistic Regression SPSS procedure of LR Interpretation of SPSS output Presenting results from LR Logistic regression is
Biology 345: Biometry Fall 2005 SONOMA STATE UNIVERSITY Lab Exercise 5 Residuals and multiple regression Introduction
 Biology 345: Biometry Fall 2005 SONOMA STATE UNIVERSITY Lab Exercise 5 Residuals and multiple regression Introduction In this exercise, we will gain experience assessing scatterplots in regression and
Midterm Exam MMI 409 Spring 2009 Gordon Bleil
 Midterm Exam MMI 409 Spring 2009 Gordon Bleil Table of contents: (Hyperlinked to problem sections) Problem 1 Hypothesis Tests Results Inferences Problem 2 Hypothesis Tests Results Inferences Problem 3
11/18/2013. Correlational Research. Correlational Designs. Why Use a Correlational Design? CORRELATIONAL RESEARCH STUDIES
 Correlational Research Correlational Designs Correlational research is used to describe the relationship between two or more naturally occurring variables. Is age related to political conservativism? Are
Manuscript Presentation: Writing up APIM Results
 Manuscript Presentation: Writing up APIM Results Example Articles Distinguishable Dyads Chung, M. L., Moser, D. K., Lennie, T. A., & Rayens, M. (2009). The effects of depressive symptoms and anxiety on
Lecture 20: Chi Square
 Statistics 20_chi.pdf Michael Hallstone, Ph.D. hallston@hawaii.edu Lecture 20: Chi Square Introduction Up until now, we done statistical test using means, but the assumptions for means have eliminated
CLINICAL RESEARCH METHODS VISP356. MODULE LEADER: PROF A TOMLINSON B.Sc./B.Sc.(HONS) OPTOMETRY
 OPTOMETRY") DIVISION OF VISION SCIENCES SESSION: 2005/2006 DIET: 1ST CLINICAL RESEARCH METHODS VISP356 LEVEL: MODULE LEADER: PROF A TOMLINSON B.Sc./B.Sc.(HONS) OPTOMETRY MAY 2006 DURATION: 2 HRS CANDIDATES SHOULD
DIVISION OF VISION SCIENCES SESSION: 2005/2006 DIET: 1ST CLINICAL RESEARCH METHODS VISP356 LEVEL: MODULE LEADER: PROF A TOMLINSON B.Sc./B.Sc.(HONS) OPTOMETRY MAY 2006 DURATION: 2 HRS CANDIDATES SHOULD
LAMPIRAN A KUISIONER
 LAMPIRAN A KUISIONER LAMPIRAN B UJI RELIABILITAS DAN UJI VALIDITAS A. Kecerdasan Emosional a. Putaran Pertama Case Processing Summary N % Cases Valid 60 100.0 Excluded a 0.0 60 100.0 a. Listwise deletion
MULTIPLE OLS REGRESSION RESEARCH QUESTION ONE:
 1 MULTIPLE OLS REGRESSION RESEARCH QUESTION ONE: Predicting State Rates of Robbery per 100K We know that robbery rates vary significantly from state-to-state in the United States. In any given state, we
The t-test: Answers the question: is the difference between the two conditions in my experiment "real" or due to chance?
 The t-test: Answers the question: is the difference between the two conditions in my experiment "real" or due to chance? Two versions: (a) Dependent-means t-test: ( Matched-pairs" or "one-sample" t-test).
Health Consciousness of Siena Students
 Health Consciousness of Siena Students Corey Austin, Siena College Kevin Flood, Siena College Allison O Keefe, Siena College Kim Reuter, Siena College EXECUTIVE SUMMARY We decided to research the health
Simple Linear Regression the model, estimation and testing
 Simple Linear Regression the model, estimation and testing Lecture No. 05 Example 1 A production manager has compared the dexterity test scores of five assembly-line employees with their hourly productivity.
Problem #1 Neurological signs and symptoms of ciguatera poisoning as the start of treatment and 2.5 hours after treatment with mannitol.
 Ho (null hypothesis) Ha (alternative hypothesis) Problem #1 Neurological signs and symptoms of ciguatera poisoning as the start of treatment and 2.5 hours after treatment with mannitol. Hypothesis: Ho:
Research Methods in Forest Sciences: Learning Diary. Yoko Lu December Research process
 Research Methods in Forest Sciences: Learning Diary Yoko Lu 285122 9 December 2016 1. Research process It is important to pursue and apply knowledge and understand the world under both natural and social
Data Analysis for Project. Tutorial
 Data Analysis for Project Tutorial Research Model Topic 2 Remanufactured Products Environmental Concern Attitude towards Recycling H2 (+) H1 (+) Subjective Norm Perceived Moral Obligation Convenience Perceived
A Study on the Impact of Extrovert Personality Traits on the It Working Professionals Stock Investment Decision
 A Study on the Impact of Extrovert Personality Traits on the It Working Professionals Stock Investment Decision Mr. R. Gowri Shankar Research Scholar Bharathiar University Coimabatore. Dr. Tomy K. Kallarakal.
CLINICAL RESEARCH METHODS VISP356. MODULE LEADER: PROF A TOMLINSON B.Sc./B.Sc.(HONS) OPTOMETRY
 OPTOMETRY") DIVISION OF VISION SCIENCES SESSION: 2006/2007 DIET: 1ST CLINICAL RESEARCH METHODS VISP356 LEVEL: MODULE LEADER: PROF A TOMLINSON B.Sc./B.Sc.(HONS) OPTOMETRY MAY 2007 DURATION: 2 HRS CANDIDATES SHOULD
DIVISION OF VISION SCIENCES SESSION: 2006/2007 DIET: 1ST CLINICAL RESEARCH METHODS VISP356 LEVEL: MODULE LEADER: PROF A TOMLINSON B.Sc./B.Sc.(HONS) OPTOMETRY MAY 2007 DURATION: 2 HRS CANDIDATES SHOULD
Quantitative Methods in Computing Education Research (A brief overview tips and techniques)
") Quantitative Methods in Computing Education Research (A brief overview tips and techniques) Dr Judy Sheard Senior Lecturer Co-Director, Computing Education Research Group Monash University judy.sheard@monash.edu
Quantitative Methods in Computing Education Research (A brief overview tips and techniques) Dr Judy Sheard Senior Lecturer Co-Director, Computing Education Research Group Monash University judy.sheard@monash.edu
Describe what is meant by a placebo Contrast the double-blind procedure with the single-blind procedure Review the structure for organizing a memo
 Business Statistics The following was provided by Dr. Suzanne Delaney, and is a comprehensive review of Business Statistics. The workshop instructor will provide relevant examples during the Skills Assessment
CHILD HEALTH AND DEVELOPMENT STUDY
 CHILD HEALTH AND DEVELOPMENT STUDY 9. Diagnostics In this section various diagnostic tools will be used to evaluate the adequacy of the regression model with the five independent variables developed in
Daniel Boduszek University of Huddersfield
 Daniel Boduszek University of Huddersfield d.boduszek@hud.ac.uk Introduction to Correlation SPSS procedure for Pearson r Interpretation of SPSS output Presenting results Partial Correlation Correlation
Daniel Boduszek University of Huddersfield
 Daniel Boduszek University of Huddersfield d.boduszek@hud.ac.uk Introduction to Multinominal Logistic Regression SPSS procedure of MLR Example based on prison data Interpretation of SPSS output Presenting
Chapter 11. Experimental Design: One-Way Independent Samples Design
 11-1 Chapter 11. Experimental Design: One-Way Independent Samples Design Advantages and Limitations Comparing Two Groups Comparing t Test to ANOVA Independent Samples t Test Independent Samples ANOVA Comparing
CLASSICAL AND. MODERN REGRESSION WITH APPLICATIONS
 - CLASSICAL AND. MODERN REGRESSION WITH APPLICATIONS SECOND EDITION Raymond H. Myers Virginia Polytechnic Institute and State university 1 ~l~~l~l~~~~~~~l!~ ~~~~~l~/ll~~ Donated by Duxbury o Thomson Learning,,
Age (continuous) Gender (0=Male, 1=Female) SES (1=Low, 2=Medium, 3=High) Prior Victimization (0= Not Victimized, 1=Victimized)
 Gender (0=Male, 1=Female) SES (1=Low, 2=Medium, 3=High) Prior Victimization (0= Not Victimized, 1=Victimized)") Criminal Justice Doctoral Comprehensive Exam Statistics August 2016 There are two questions on this exam. Be sure to answer both questions in the 3 and half hours to complete this exam. Read the instructions
Criminal Justice Doctoral Comprehensive Exam Statistics August 2016 There are two questions on this exam. Be sure to answer both questions in the 3 and half hours to complete this exam. Read the instructions
Introduction to Multilevel Models for Longitudinal and Repeated Measures Data
 Introduction to Multilevel Models for Longitudinal and Repeated Measures Data Today s Class: Features of longitudinal data Features of longitudinal models What can MLM do for you? What to expect in this