Introduction. Lecture 1. What is Statistics?
|
|
|
- Alexandrina Armstrong
- 5 years ago
- Views:
Transcription


1 Lecture 1 Introduction What is Statistics? Statistics is the science of collecting, organizing and interpreting data. The goal of statistics is to gain information and understanding from data. A statistic is a number in context. Statistical inference is making a decision or a conclusion based on the data.


2 What is data? Data are numerical facts with context and we need to understand the context if we are to make sense of the numbers. How to examine data? Any set of data contains information about some group of individuals. Individuals are the objects upon which we collect data. Individuals can be people, animals, and many other things. Sometimes when the objects that we want to study are not people, we often call them cases.

3 The information is organized in variables. A variable is any characteristic of an individual. A variable can take different values for different individuals. Types of variables: Categorical variable: a variable that places an individual into one of two or more groups or categories. Quantitative variable: a variable that takes numerical values for which arithmetic operations such as adding and averaging make sense. The distribution of a variable tells us what values it takes and how often it takes these values.
4 Example: Table below shows part of a data set for students enrolled in an introductory statistics class. ID Total Grade Gender PrevStat Year B F Yes B M Yes C M No A M No B F No 4 A population is a set of individuals that we are interested in studying. A sample is a subset of the individuals of a population.

5 Questions to ask when planning a statistical study: Why? What purpose do the data have? Do we hope to answer some specific questions? Do we want to draw conclusions about individuals other than the ones we actually have data for? Who? What individuals do the data describe? How many individuals appear in the data? What? How many variables do the data contain? What are the exact definitions of these variables? What are the units of measurements in which each variable is recorded? Weights for example, might be recorded in pounds, or in kg. Additional questions you might want to ask yourself: When? Where? How?

6 For the example above: How to collect data? Generally, data can be obtained in four different ways. Published source Designed experiment Survey Observational study

7 How to explore your data? Two basic strategies for exploration of data set: Begin by examining each variable by itself. Then move on to study the relationships among the variables. Each time begin with graphs. Then add numerical summaries of specified aspects of the data.
 Percent Less than high school 4.6 12.1 High school graduate 11.6 30.5 Some college 7.4 19.")
8 Displaying Distributions with Graphs Categorical variables The distribution of a categorical variable lists the categories and gives either the count or percent of individuals who fall in each category. Example: How well educated are 30-something young adults? Education Count (millions) Percent Less than high school High school graduate Some college Associate degree Bachelor s degree Advanced degree
 A bar chart displays the distribution of a categorical variable, showing the")
 A pie chart helps us see what part of")
9 There are two ways to display these data: - a bar chart (StatCrunch->Graphics->Bar Plot) A bar chart displays the distribution of a categorical variable, showing the counts for each category next to each other for easy comparison. - a pie chart (StatCrunch->Graphics->Pie Chart) A pie chart helps us see what part of the whole each group forms.
10 Two-way Table For two categorical variables the raw data are summarized in a two-way table that gives counts of observations for each combination of values of the variables. Example: A survey of 17,096 students in U.S. four-year colleges collected information on drinking behaviour and alcohol-related problems. The researchers defined frequent binge drinking as having five and more drinks in a row three or more times in the past two weeks. Here is the two-way table classifying students by gender and whether or not they are frequent binge drinkers: Gender is a column variable. Binge drinking is a row variable. Gender: Frequent binge drinker: Men Women Yes 1,630 1,684 No 5,550 8,232 Combinations of values for two variables are called cells.
11 We can expand the table by adding the totals for each row, for each column, and the total number of all the observations: Gender: Frequent binge drinker: Men Women Total Yes 1,630 1,684 3,314 No 5,550 8,232 13,782 Total 7,180 9,916 17,096 Joint Distribution For each cell, we can compute a proportion by dividing the cell entry by the total sample size. The collection of these proportions is the joint distribution of the two categorical variables. Gender: Frequent binge drinker: Men Women Yes No Because this is a distribution, the sum of the proportions should be 1. For this example the sum is The difference is due to roundoff error.
12 Marginal Distribution A marginal distribution is the distribution of a single variable in a two-way table. Gender: Frequent binge drinker: Men Women Total Yes 1,630 1,684 3,314 No 5,550 8,232 13,782 Total 7,180 9,916 17,096 For example, the marginal distribution of gender is Men Women Proportion or Men Women Percent 42% 58% And here is the marginal distribution of frequent binge drinking: Yes No Percent 19.4% 80.6%
13 Relationships among the variables are described by calculating appropriate percents from the counts given. Example: What percent of the women in our sample are frequent binge drinkers? Gender: Frequent binge drinker: Men Women Total Yes 1,630 1,684 3,314 No 5,550 8,232 13,782 Total 7,180 9,916 17,096 Here we condition on the value of our 'gender' variable: women.
14 Conditional Distribution When we condition on the value of one variable and calculate the distribution of the other variable, we obtain a conditional distribution. Gender: Frequent binge drinker: Men Women Total Yes 1,630 1,684 3,314 No 5,550 8,232 13,782 Total 7,180 9,916 17,096 For example, the conditional distribution of binge drinking of women is Yes No Percent 17.0% 83.0% Similarly, the conditional distribution of binge drinking for men is Conclusion: Yes No Percent 22.7% 77.3%
15 Contingency Table: StatCrunch->Stat->Tables->Contingency Contingency table results: Rows: Frequent binge drinker Columns: Gender Cell format Count (Row percent) (Column percent) (Total percent) Men Women Total Yes 1630 (49.19%) (22.7%) (9.534%) 1684 (50.81%) (16.98%) (9.85%) 3314 (100.00%) (19.38%) (19.38%) No 5550 (40.27%) (77.3%) (32.46%) 8232 (59.73%) (83.02%) (48.15%) (100.00%) (80.62%) (80.62%) Total 7180 (42%) (100.00%) (42%) 9916 (58%) (100.00%) (58%) (100.00%) (100.00%) (100.00%)
16 What is independence? If the conditional distribution of one variable does not depend on the other variable (hence, each conditional distribution resembles the marginal distribution), these two variables are said to be independent. For our example:

17 Segmented Bar Charts Example: What activities are preferred by women/men? Each bar is divided into segments, such that the length of each segment indicates proportion or percentage of observations in a second variable. Conclusion:
18 Simpson s Paradox Example: Smoking and 20yr survival rate for 1314 English women: Dead Alive Total Smoker Non-Smoker Let us involve some basic math: What would you conclude? Is it better to be a smoker?

19 Unlikely... What happened here has a name: Simpson's Paradox. To see how it works let's conduct the following experiment:

20 We have two tables. There are two boxes on each table: a brown one and a gray one. Scenario 1 Scenario 2 You are given one chance to extract a gold ball from the boxes. Which box will you choose for each table? Table 1: Table 2: In both cases we would choose the brown box.

21 Now we put all the balls from the brown boxes into one big brown box, and all the balls from the gray boxes into one big gray box: Suddenly, we get a reversed conclusion. Now we would choose the gray box!
22 Definition: An association that holds for all of several groups can reverse direction when the data are combined to form a single group. This reversal is called Simpson s paradox. History: Simpson s paradox is named after Edward Simpson, who first described this paradox in the 1951 paper "The Interpretation of Interaction in Contingency Tables." Pearson and Yule each observed a similar paradox half a century earlier than Simpson, so Simpson s paradox is sometimes also referred to as the Simpson-Yule effect. Anytime that data is aggregated, watch out for this paradox to show up. Now let's look at the real life example.
 and failures (no change)")
23 Example: We want to test two drugs. We give each drug to a group of people and then count the number of successes (improvements) and failures (no change) for each group. Success Failure Total Drug Drug Conclusion:
24 What we find out next is that the data were aggregated over gender. The conclusion of the study has been reversed.
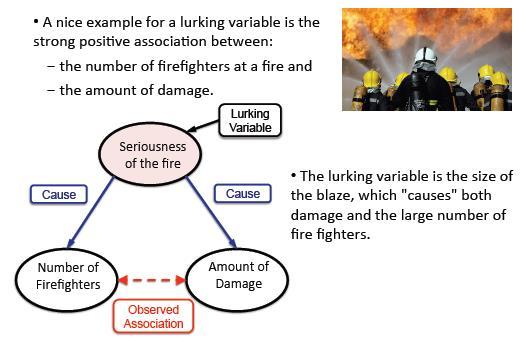
25 Lurking Variable
26
27
Name AP Statistics UNIT 1 Summer Work Section II: Notes Analyzing Categorical Data
 Name AP Statistics UNIT 1 Summer Work Date Section II: Notes 1.1 - Analyzing Categorical Data Essential Understanding: How can I represent the data when it is treated as a categorical variable? I. Distribution
Lecture 10: Chapter 5, Section 2 Relationships (Two Categorical Variables)
") Lecture 10: Chapter 5, Section 2 Relationships (Two Categorical Variables) Two-Way Tables Summarizing and Displaying Comparing Proportions or Counts Confounding Variables Cengage Learning Elementary Statistics:
Lecture 10: Chapter 5, Section 2 Relationships (Two Categorical Variables) Two-Way Tables Summarizing and Displaying Comparing Proportions or Counts Confounding Variables Cengage Learning Elementary Statistics:
Medical Statistics 1. Basic Concepts Farhad Pishgar. Defining the data. Alive after 6 months?
 Medical Statistics 1 Basic Concepts Farhad Pishgar Defining the data Population and samples Except when a full census is taken, we collect data on a sample from a much larger group called the population.
Unit 7 Comparisons and Relationships
 Unit 7 Comparisons and Relationships Objectives: To understand the distinction between making a comparison and describing a relationship To select appropriate graphical displays for making comparisons
Chapter 1. Picturing Distributions with Graphs
 Chapter 1 Picturing Distributions with Graphs Statistics Statistics is a science that involves the extraction of information from numerical data obtained during an experiment or from a sample. It involves
Part 1. For each of the following questions fill-in the blanks. Each question is worth 2 points.
 Part 1. For each of the following questions fill-in the blanks. Each question is worth 2 points. 1. The bell-shaped frequency curve is so common that if a population has this shape, the measurements are
Unit 1 Exploring and Understanding Data
 Unit 1 Exploring and Understanding Data Area Principle Bar Chart Boxplot Conditional Distribution Dotplot Empirical Rule Five Number Summary Frequency Distribution Frequency Polygon Histogram Interquartile
Pearson Education Limited Edinburgh Gate Harlow Essex CM20 2JE England and Associated Companies throughout the world
 Pearson Education Limited Edinburgh Gate Harlow Essex CM20 2JE England and Associated Companies throughout the world Visit us on the World Wide Web at: www.pearsoned.co.uk Pearson Education Limited 2014
STATISTICS & PROBABILITY
 STATISTICS & PROBABILITY LAWRENCE HIGH SCHOOL STATISTICS & PROBABILITY CURRICULUM MAP 2015-2016 Quarter 1 Unit 1 Collecting Data and Drawing Conclusions Unit 2 Summarizing Data Quarter 2 Unit 3 Randomness
Chapter 1: Exploring Data
 Chapter 1: Exploring Data Section 1.1 The Practice of Statistics, 4 th edition - For AP* STARNES, YATES, MOORE Chapter 1 Exploring Data Introduction: Data Analysis: Making Sense of Data 1.1 1.2 Displaying
General Biostatistics Concepts
 General Biostatistics Concepts Dongmei Li Department of Public Health Sciences Office of Public Health Studies University of Hawai i at Mānoa Outline 1. What is Biostatistics? 2. Types of Measurements
Introduction to Statistics
 Introduction to Statistics Topics 1-5 Nellie Hedrick Statistics Statistics is the Study of Data, it is science of reasoning from data. What does it mean by the term data? You will find that data vary and
Probability and Statistics. Chapter 1
 Probability and Statistics Chapter 1 Individuals and Variables Individuals and Variables Individuals are objects described by data. Individuals and Variables Individuals are objects described by data.
Graphic Organizers. Compare/Contrast. 1. Different. 2. Different. Alike
 1 Compare/Contrast When you compare and contrast people, places, objects, or ideas, you are looking for how they are alike and how they are different. One way to organize your information is to use a Venn
Observational studies; descriptive statistics
 Observational studies; descriptive statistics Patrick Breheny August 30 Patrick Breheny University of Iowa Biostatistical Methods I (BIOS 5710) 1 / 38 Observational studies Association versus causation
Math for Liberal Arts MAT 110: Chapter 5 Notes
 Math for Liberal Arts MAT 110: Chapter 5 Notes Statistical Reasoning David J. Gisch Fundamentals of Statistics Two Definitions of Statistics Statistics is the science of collecting, organizing, and interpreting
Data and Statistics 101: Key Concepts in the Collection, Analysis, and Application of Child Welfare Data
 TECHNICAL REPORT Data and Statistics 101: Key Concepts in the Collection, Analysis, and Application of Child Welfare Data CONTENTS Executive Summary...1 Introduction...2 Overview of Data Analysis Concepts...2
Chapter 1: Exploring Data
 Chapter 1: Exploring Data Key Vocabulary:! individual! variable! frequency table! relative frequency table! distribution! pie chart! bar graph! two-way table! marginal distributions! conditional distributions!
Statistics and Probability
 Statistics and a single count or measurement variable. S.ID.1: Represent data with plots on the real number line (dot plots, histograms, and box plots). S.ID.2: Use statistics appropriate to the shape
Lecture 15 Chapters 12&13 Relationships between Two Categorical Variables
 Lecture 15 Chapters 12&13 Relationships between wo Categorical ariables abulating and Summarizing able of Expected Counts Statistical Significance for wo-way ables Constructing & Assessing a wo-way able
(a) 50% of the shows have a rating greater than: impossible to tell
 50% of the shows have a rating greater than: impossible to tell") KEY 1. Here is a histogram of the Distribution of grades on a quiz. How many students took the quiz? 15 What percentage of students scored below a 60 on the quiz? (Assume left-hand endpoints are included
KEY 1. Here is a histogram of the Distribution of grades on a quiz. How many students took the quiz? 15 What percentage of students scored below a 60 on the quiz? (Assume left-hand endpoints are included
Introductory Statistics Day 7. Conditional Probability
 Introductory Statistics Day 7 Conditional Probability Activity 1: Risk Assessment In the book Gut Feelings, the author describes a study where he asked 24 doctors to estimate the following probability.
Statistical Methods Exam I Review
 Statistical Methods Exam I Review Professor: Dr. Kathleen Suchora SI Leader: Camila M. DISCLAIMER: I have created this review sheet to supplement your studies for your first exam. I am a student here at
Two-sample Categorical data: Measuring association
 Two-sample Categorical data: Measuring association Patrick Breheny October 27 Patrick Breheny University of Iowa Biostatistical Methods I (BIOS 5710) 1 / 40 Introduction Study designs leading to contingency
STATISTICS INFORMED DECISIONS USING DATA
 STATISTICS INFORMED DECISIONS USING DATA Fifth Edition Chapter 4 Describing the Relation between Two Variables 4.1 Scatter Diagrams and Correlation Learning Objectives 1. Draw and interpret scatter diagrams
OCW Epidemiology and Biostatistics, 2010 David Tybor, MS, MPH and Kenneth Chui, PhD Tufts University School of Medicine October 27, 2010
 OCW Epidemiology and Biostatistics, 2010 David Tybor, MS, MPH and Kenneth Chui, PhD Tufts University School of Medicine October 27, 2010 SAMPLING AND CONFIDENCE INTERVALS Learning objectives for this session:
August 26, Dept. Of Statistics, University of Illinois at Urbana-Champaign. Introductory lecture: A brief survey of what to
 Dept. Of Statistics, University of Illinois at Urbana-Champaign August 26, 2013 Lies, Damned lies and Statistics British Prime Minister Benjamin Disraeli (18041881) said : There are three kinds of lies:
STP226 Brief Class Notes Instructor: Ela Jackiewicz
 CHAPTER 2 Organizing Data Statistics=science of analyzing data. Information collected (data) is gathered in terms of variables (characteristics of a subject that can be assigned a numerical value or nonnumerical
5 14.notebook May 14, 2015
 Objective: I can represent categorical data using a two way frequency table Entry: A marketing company is trying to determine how much diversity there is in the age of people who drink different soft drinks.
Chapter 7: Descriptive Statistics
 Chapter Overview Chapter 7 provides an introduction to basic strategies for describing groups statistically. Statistical concepts around normal distributions are discussed. The statistical procedures of
10. Introduction to Multivariate Relationships
 10. Introduction to Multivariate Relationships Bivariate analyses are informative, but we usually need to take into account many variables. Many explanatory variables have an influence on any particular
Stratified Tables. Example: Effect of seat belt use on accident fatality
 Stratified Tables Often, a third measure influences the relationship between the two primary measures (i.e. disease and exposure). How do we remove or control for the effect of the third measure? Issues
M 140 Test 1 A Name SHOW YOUR WORK FOR FULL CREDIT! Problem Max. Points Your Points Total 60
 M 140 Test 1 A Name SHOW YOUR WORK FOR FULL CREDIT! Problem Max. Points Your Points 1-10 10 11 3 12 4 13 3 14 10 15 14 16 10 17 7 18 4 19 4 Total 60 Multiple choice questions (1 point each) For questions
Analysis of Categorical Data from the Ashe Center Student Wellness Survey
 Lab 6 Analysis of Categorical Data from the Ashe Center Student Wellness Survey Before starting this lab, you should be familiar with: the difference between categorical and quantitative variables, and
What is Data? Part 2: Patterns & Associations. INFO-1301, Quantitative Reasoning 1 University of Colorado Boulder
 What is Data? Part 2: Patterns & Associations INFO-1301, Quantitative Reasoning 1 University of Colorado Boulder August 29, 2016 Prof. Michael Paul Prof. William Aspray Overview This lecture will look
STA Module 1 Introduction to Statistics and Data
 STA 2023 Module 1 Introduction to Statistics and Data 1 Learning Objectives Upon completing this module, you should be able to: 1. Classify a statistical study as either descriptive or inferential. 2.
Measuring the User Experience
 Measuring the User Experience Collecting, Analyzing, and Presenting Usability Metrics Chapter 2 Background Tom Tullis and Bill Albert Morgan Kaufmann, 2008 ISBN 978-0123735584 Introduction Purpose Provide
Population. Sample. AP Statistics Notes for Chapter 1 Section 1.0 Making Sense of Data. Statistics: Data Analysis:
 Section 1.0 Making Sense of Data Statistics: Data Analysis: Individuals objects described by a set of data Variable any characteristic of an individual Categorical Variable places an individual into one
CHAPTER 2. MEASURING AND DESCRIBING VARIABLES
 4 Chapter 2 CHAPTER 2. MEASURING AND DESCRIBING VARIABLES 1. A. Age: name/interval; military dictatorship: value/nominal; strongly oppose: value/ ordinal; election year: name/interval; 62 percent: value/interval;
9. Interpret a Confidence level: "To say that we are 95% confident is shorthand for..
 Mrs. Daniel AP Stats Chapter 8 Guided Reading 8.1 Confidence Intervals: The Basics 1. A point estimator is a statistic that 2. The value of the point estimator statistic is called a and it is our "best
Lesson 9 Presentation and Display of Quantitative Data
 Lesson 9 Presentation and Display of Quantitative Data Learning Objectives All students will identify and present data using appropriate graphs, charts and tables. All students should be able to justify
DATA TO INSIGHT: AN INTRODUCTION TO DATA ANALYSIS THE UNIVERSITY OF AUCKLAND
 DATA TO INSIGHT: AN INTRODUCTION TO DATA ANALYSIS THE UNIVERSITY OF AUCKLAND WEEK 3 3.2 RELATIONSHIPS BETWEEN CATEGORICAL VARIABLES Hi again. In this video, you'll learn how to plot data on two categorical
Demonstrating Client Improvement to Yourself and Others
 Demonstrating Client Improvement to Yourself and Others Understanding and Using your Outcome Evaluation System (Part 2 of 3) Greg Vinson, Ph.D. Senior Researcher and Evaluation Manager Center for Victims
Results & Statistics: Description and Correlation. I. Scales of Measurement A Review
 Results & Statistics: Description and Correlation The description and presentation of results involves a number of topics. These include scales of measurement, descriptive statistics used to summarize
Examining Relationships Least-squares regression. Sections 2.3
 Examining Relationships Least-squares regression Sections 2.3 The regression line A regression line describes a one-way linear relationship between variables. An explanatory variable, x, explains variability
HOMEWORK 4 Due: next class 2/8
 HOMEWORK 4 Due: next class 2/8 1. Recall the class data we collected concerning body image (about right, overweight, underweight). Following the body image example in OLI, answer the following question
Intro to SPSS. Using SPSS through WebFAS
 Intro to SPSS Using SPSS through WebFAS http://www.yorku.ca/computing/students/labs/webfas/ Try it early (make sure it works from your computer) If you need help contact UIT Client Services Voice: 416-736-5800
7. Bivariate Graphing
 1 7. Bivariate Graphing Video Link: https://www.youtube.com/watch?v=shzvkwwyguk&index=7&list=pl2fqhgedk7yyl1w9tgio8w pyftdumgc_j Section 7.1: Converting a Quantitative Explanatory Variable to Categorical
Popper If data follows a trend that is not linear, we cannot make a prediction about it.
 - Popper 12 1. If data follows a trend that is not linear, we cannot make a prediction about it. 5.5 Non-Linear Methods Many times a scatter-plot reveals a curved pattern instead of a linear pattern. We
Methodology for Non-Randomized Clinical Trials: Propensity Score Analysis Dan Conroy, Ph.D., inventiv Health, Burlington, MA
 PharmaSUG 2014 - Paper SP08 Methodology for Non-Randomized Clinical Trials: Propensity Score Analysis Dan Conroy, Ph.D., inventiv Health, Burlington, MA ABSTRACT Randomized clinical trials serve as the
Statistics: Interpreting Data and Making Predictions. Interpreting Data 1/50
 Statistics: Interpreting Data and Making Predictions Interpreting Data 1/50 Last Time Last time we discussed central tendency; that is, notions of the middle of data. More specifically we discussed the
Study Guide #2: MULTIPLE REGRESSION in education
 Study Guide #2: MULTIPLE REGRESSION in education What is Multiple Regression? When using Multiple Regression in education, researchers use the term independent variables to identify those variables that
CHAPTER 3 DATA ANALYSIS: DESCRIBING DATA
 Data Analysis: Describing Data CHAPTER 3 DATA ANALYSIS: DESCRIBING DATA In the analysis process, the researcher tries to evaluate the data collected both from written documents and from other sources such
q2_2 MULTIPLE CHOICE. Choose the one alternative that best completes the statement or answers the question.
 q2_2 MULTIPLE CHOICE. Choose the one alternative that best completes the statement or answers the question. A sporting goods retailer conducted a customer survey to determine its customers primary reason
Measuring association in contingency tables
 Measuring association in contingency tables Patrick Breheny April 8 Patrick Breheny Introduction to Biostatistics (171:161) 1/25 Hypothesis tests and confidence intervals Fisher s exact test and the χ
bivariate analysis: The statistical analysis of the relationship between two variables.
 bivariate analysis: The statistical analysis of the relationship between two variables. cell frequency: The number of cases in a cell of a cross-tabulation (contingency table). chi-square (χ 2 ) test for
Handout 16: Opinion Polls, Sampling, and Margin of Error
 Opinion polls involve conducting a survey to gauge public opinion on a particular issue (or issues). In this handout, we will discuss some ideas that should be considered both when conducting a poll and
APPENDIX N. Summary Statistics: The "Big 5" Statistical Tools for School Counselors
 APPENDIX N Summary Statistics: The "Big 5" Statistical Tools for School Counselors This appendix describes five basic statistical tools school counselors may use in conducting results based evaluation.
An Introduction to Research Statistics
 An Introduction to Research Statistics An Introduction to Research Statistics Cris Burgess Statistics are like a lamppost to a drunken man - more for leaning on than illumination David Brent (alias Ricky
Popper If data follows a trend that is not linear, we cannot make a prediction about it. a. True b. False
 Popper 12 1. If data follows a trend that is not linear, we cannot make a prediction about it. a. True b. False 5.5 Non-Linear Methods Many times a scatter-plot reveals a curved pattern instead of a linear
PRINCIPLES OF STATISTICS
 PRINCIPLES OF STATISTICS STA-201-TE This TECEP is an introduction to descriptive and inferential statistics. Topics include: measures of central tendency, variability, correlation, regression, hypothesis
GCSE PSYCHOLOGY UNIT 2 FURTHER RESEARCH METHODS
 GCSE PSYCHOLOGY UNIT 2 FURTHER RESEARCH METHODS GCSE PSYCHOLOGY UNIT 2 SURVEYS SURVEYS SURVEY = is a method used for collecting information from a large number of people by asking them questions, either
Statistics Success Stories and Cautionary Tales
 Course Goals STATISTICS 8 Professor Jessica Utts http://www.ics.uci.edu/~jutts/8 Help you understand and appreciate how statistics affects your daily life. Teach you tools for understanding statistics
Unit 1-Characteristics of Life, Scientific Method and Microscopes
 Unit 1-Characteristics of Life, Scientific Method and Microscopes Section 1.1 Characteristics of Life Look at the following pictures and decide if the object is alive or not. Explain what criteria you
Statistics for Psychology
 Statistics for Psychology SIXTH EDITION CHAPTER 3 Some Key Ingredients for Inferential Statistics Some Key Ingredients for Inferential Statistics Psychologists conduct research to test a theoretical principle
Joseph W Hogan Brown University & AMPATH February 16, 2010
 Joseph W Hogan Brown University & AMPATH February 16, 2010 Drinking and lung cancer Gender bias and graduate admissions AMPATH nutrition study Stratification and regression drinking and lung cancer graduate
Department of Statistics TEXAS A&M UNIVERSITY STAT 211. Instructor: Keith Hatfield
 Department of Statistics TEXAS A&M UNIVERSITY STAT 211 Instructor: Keith Hatfield 1 Topic 1: Data collection and summarization Populations and samples Frequency distributions Histograms Mean, median, variance
How Causal Heterogeneity Can Influence Statistical Significance in Clinical Trials
 How Causal Heterogeneity Can Influence Statistical Significance in Clinical Trials Milo Schield, W. M. Keck Statistical Literacy Project. Minneapolis, MN. Abstract: Finding that an association is statistically
Psy201 Module 3 Study and Assignment Guide. Using Excel to Calculate Descriptive and Inferential Statistics
 Psy201 Module 3 Study and Assignment Guide Using Excel to Calculate Descriptive and Inferential Statistics What is Excel? Excel is a spreadsheet program that allows one to enter numerical values or data
Understandable Statistics
 Understandable Statistics correlated to the Advanced Placement Program Course Description for Statistics Prepared for Alabama CC2 6/2003 2003 Understandable Statistics 2003 correlated to the Advanced Placement
Aim #1a: How do we analyze and interpret different types of data?
 Aim #1a: How do we analyze and interpret different types of data? Data (information) may appear in various forms such as a map, graph, chart, table, timelines, political cartoons, visuals, and reading
MITOCW conditional_probability
 MITOCW conditional_probability You've tested positive for a rare and deadly cancer that afflicts 1 out of 1000 people, based on a test that is 99% accurate. What are the chances that you actually have
5 Listening to the data
 D:\My Documents\dango\text\ch05v15.doc Page 5-1 of 27 5 Listening to the data Truth will ultimately prevail where there is pains taken to bring it to light. George Washington, Maxims 5.1 What are the kinds
Frequency Distributions
 Frequency Distributions In this section, we look at ways to organize data in order to make it more user friendly. It is difficult to obtain any meaningful information from the data as presented in the
3 CONCEPTUAL FOUNDATIONS OF STATISTICS
 3 CONCEPTUAL FOUNDATIONS OF STATISTICS In this chapter, we examine the conceptual foundations of statistics. The goal is to give you an appreciation and conceptual understanding of some basic statistical
Two-Way Independent ANOVA
 Two-Way Independent ANOVA Analysis of Variance (ANOVA) a common and robust statistical test that you can use to compare the mean scores collected from different conditions or groups in an experiment. There
Distributions and Samples. Clicker Question. Review
 Distributions and Samples Clicker Question The major difference between an observational study and an experiment is that A. An experiment manipulates features of the situation B. An experiment does not
Guidelines for Incorporating & Strengthening Perspective-Taking & Self-Authorship into Division of Student Life Programs
 Guidelines for Incorporating & Strengthening Perspective-Taking & Self-Authorship into Division of Student Life Programs Your program or service has been identified as potentially high impact in helping
STA Module 1 The Nature of Statistics. Rev.F07 1
 STA 2023 Module 1 The Nature of Statistics Rev.F07 1 Learning Objectives 1. Classify a statistical study as either descriptive or inferential. 2. Identify the population and the sample in an inferential
STA Rev. F Module 1 The Nature of Statistics. Learning Objectives. Learning Objectives (cont.
 STA 2023 Module 1 The Nature of Statistics Rev.F07 1 Learning Objectives 1. Classify a statistical study as either descriptive or inferential. 2. Identify the population and the sample in an inferential
STAT 201 Chapter 3. Association and Regression
 STAT 201 Chapter 3 Association and Regression 1 Association of Variables Two Categorical Variables Response Variable (dependent variable): the outcome variable whose variation is being studied Explanatory
AP STATISTICS 2009 SCORING GUIDELINES
 AP STATISTICS 2009 SCORING GUIDELINES Question 1 Intent of Question The primary goals of this question were to assess a student s ability to (1) construct an appropriate graphical display for comparing
WDHS Curriculum Map Probability and Statistics. What is Statistics and how does it relate to you?
 WDHS Curriculum Map Probability and Statistics Time Interval/ Unit 1: Introduction to Statistics 1.1-1.3 2 weeks S-IC-1: Understand statistics as a process for making inferences about population parameters
Chapter 8: Estimating with Confidence
 Chapter 8: Estimating with Confidence Key Vocabulary: point estimator point estimate confidence interval margin of error interval confidence level random normal independent four step process level C confidence
Planning and Carrying Out an Investigation. Name:
 Planning and Carrying Out an Investigation Name: Part A: Asking Questions (NGSS Practice #1) Topic or Phenomenon: 1. What am I wondering? What questions do I have about the topic/phenomenon? (why, when,
Working Together To Outrun Cancer
 Lesson: Talking to Students About Cancer Curriculum Connection: Language Arts / Health Education Grade Level: Primary Time: Approximately 40-60 minutes Lesson Snapshot Sometimes teachers wonder how they
LPI : Leadership Practices Inventory
 LPI : Leadership Practices Inventory JAMES M. KOUZES & BARRY Z. POSNER Individual Feedback Report Prepared for Amanda Lopez CONTENTS The Five Practices of Exemplary Leadership and the LPI Report...............................
Smoking Calculator. Study Guide
 www.nosmokes.com.au Smoking Calculator Information for teachers Study Guide The Smoking Calculator is an online tool which illustrates the real cost of cigarettes; both financially and to your health.
Chapter 2: The Organization and Graphic Presentation of Data Test Bank
 Essentials of Social Statistics for a Diverse Society 3rd Edition Leon Guerrero Test Bank Full Download: https://testbanklive.com/download/essentials-of-social-statistics-for-a-diverse-society-3rd-edition-leon-guerrero-tes
6 Relationships between
 CHAPTER 6 Relationships between Categorical Variables Chapter Outline 6.1 CONTINGENCY TABLES 6.2 BASIC RULES OF PROBABILITY WE NEED TO KNOW 6.3 CONDITIONAL PROBABILITY 6.4 EXAMINING INDEPENDENCE OF CATEGORICAL
LPI : Leadership Practices Inventory
 LPI : Leadership Practices Inventory JAMES M. KOUZES & BARRY Z. POSNER Individual Feedback Report Prepared for Amanda Lopez LPI Sample Report CONTENTS The Five Practices of Exemplary Leadership and the
Psychology Research Process
 Psychology Research Process Logical Processes Induction Observation/Association/Using Correlation Trying to assess, through observation of a large group/sample, what is associated with what? Examples:
Chapter 4. More On Bivariate Data. More on Bivariate Data: 4.1: Transforming Relationships 4.2: Cautions about Correlation
 Chapter 4 More On Bivariate Data Chapter 3 discussed methods for describing and summarizing bivariate data. However, the focus was on linear relationships. In this chapter, we are introduced to methods
MATH 1040 Skittles Data Project
 Laura Boren MATH 1040 Data Project For our project in MATH 1040 everyone in the class was asked to buy a 2.17 individual sized bag of skittles and count the number of each color of candy in the bag. The
Quitting. Study Guide. Information for teachers. The accompanying factsheets: The main resource:
 www.nosmokes.com.au Quitting Study Guide Information for teachers This section looks at quitting. It explains the process of addiction and looks at changing your thinking about smoking. It explores ways
1 Version SP.A Investigate patterns of association in bivariate data
 Claim 1: Concepts and Procedures Students can explain and apply mathematical concepts and carry out mathematical procedures with precision and fluency. Content Domain: Statistics and Probability Target
A Correlation of. to the. Common Core State Standards for Mathematics Grade 2
 A Correlation of 2012 to the Introduction This document demonstrates how in Number, Data, and Space 2012 meets the indicators of the,. Correlation references are to the unit number and are cited at the
How to describe bivariate data
 Statistics Corner How to describe bivariate data Alessandro Bertani 1, Gioacchino Di Paola 2, Emanuele Russo 1, Fabio Tuzzolino 2 1 Department for the Treatment and Study of Cardiothoracic Diseases and
9 research designs likely for PSYC 2100
 9 research designs likely for PSYC 2100 1) 1 factor, 2 levels, 1 group (one group gets both treatment levels) related samples t-test (compare means of 2 levels only) 2) 1 factor, 2 levels, 2 groups (one
CCM6+7+ Unit 12 Data Collection and Analysis
 Page 1 CCM6+7+ Unit 12 Packet: Statistics and Data Analysis CCM6+7+ Unit 12 Data Collection and Analysis Big Ideas Page(s) What is data/statistics? 2-4 Measures of Reliability and Variability: Sampling,