Data, Metrics, and Evaluation. Dora Barilla, DrPH, MPH Michael Knecht, MDiv
|
|
|
- Harriet Atkinson
- 5 years ago
- Views:
Transcription

1 Data, Metrics, and Evaluation Dora Barilla, DrPH, MPH Michael Knecht, MDiv

2


3

4 Imagine Increased flexibility and being proactive

5 Imagine Holistic in understanding the community s problems and capacity

6 Imagine Approaching information as an asset not a cost

7 Imagine Increase our communication and interaction with our communities
8 Community Health Management System Vision: Create a real- )me community health management system to provide geographically enabled health u)liza)on informa)on to influence strategic resource, pa)ent care, and popula)on health decisions.


9 Health Data View Census Demographics Health Status Indicators Service Utilization Provider Network Design Variability Market Potential


10 Moving the Community Needle Low High Under Over Health Status Minimal Optimum Provider Supply Community Resources

11 Community Health Management System Welcome Dora Barilla Today is Thursday, July 26, 2012 Health Status Admissions Re-Admissions Health Indicators Page 1 Page 2 Page 3 Print Help Log Out Mortality Rates Admissions Type % of Tot Status Medicare 23% Medicaid 12% BlueCross 5% Uninsured 1% Re-Admissions Chronic Disease Management Re-admissions ED Treat & Street? 9??????? 230,00 7,587 1,945,112 89,778 1,200, , , ,112 3,346,782 75% 65% 65% 65% 71% 70% 75% 69% Stroke Suicide Heart Disease Cancer Respiratory Disease Injury Diabetes Hypertension ED Visits by Cause Asthma Diabetes Expected ER Caseloads Hypertension Mental Health At-a-Glance (last 24 hrs)-ed only Substance Abuse/Violence Frequent Flyers 4 Priority Areas Health Indicators M&M Billed Charges $1,223,600 Loma Linda University and Loma Linda University Health System has identified three priority areas in No-Pay Charges $707,250 the Inland Empire for to help improve the health of the communities most in need of health ED Visits Sent Home 69 % improvement. $19,500 Together we are much greater than the sum of our parts and thank you for helping us Discharges w 6+ Meds 85% move $33,000 towards greater collaboration. Homeless ED Patient 2 1. San Bernardino Low Birth Weight Life Expectancy Infant Mortality Rate Religion RFEI Obesity/BMI


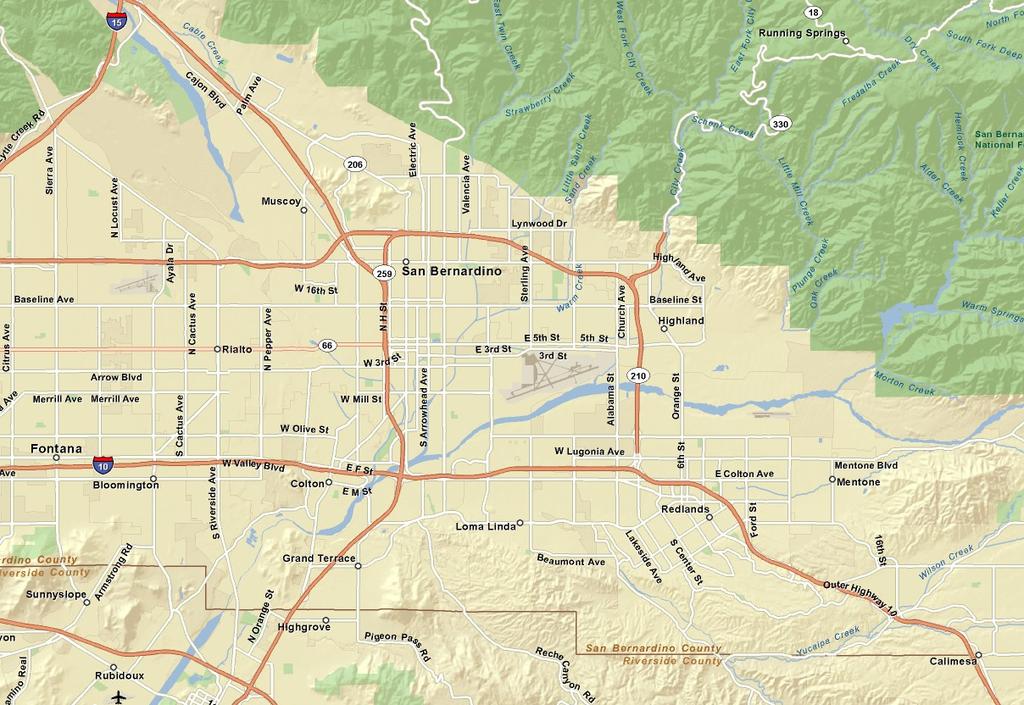
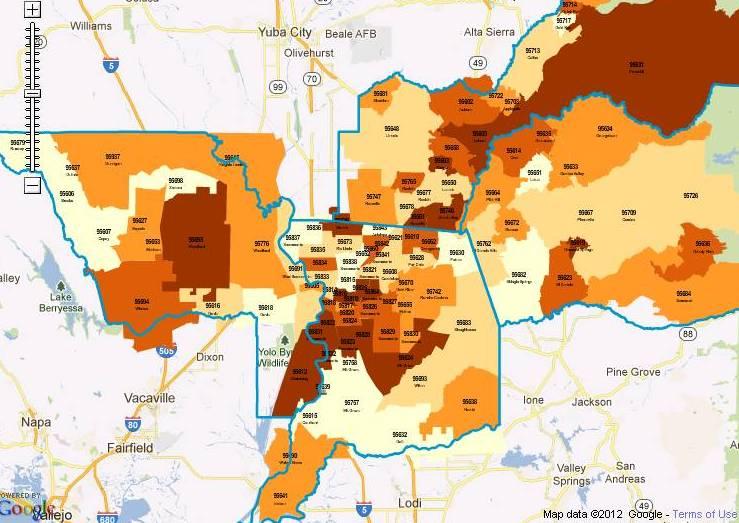
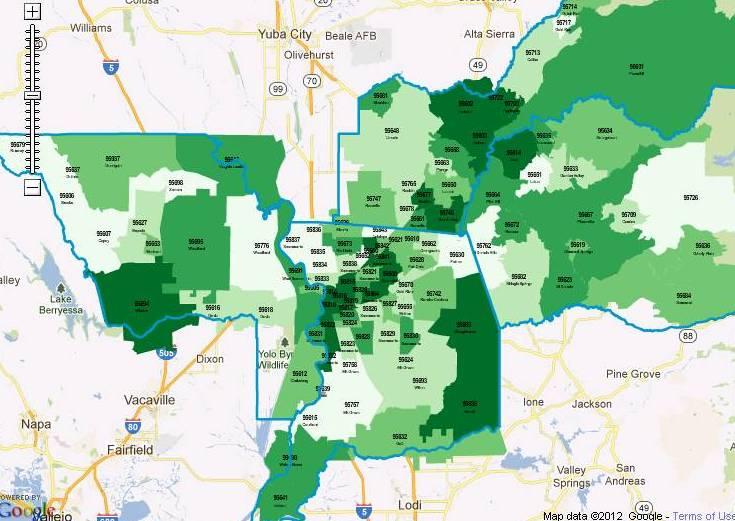
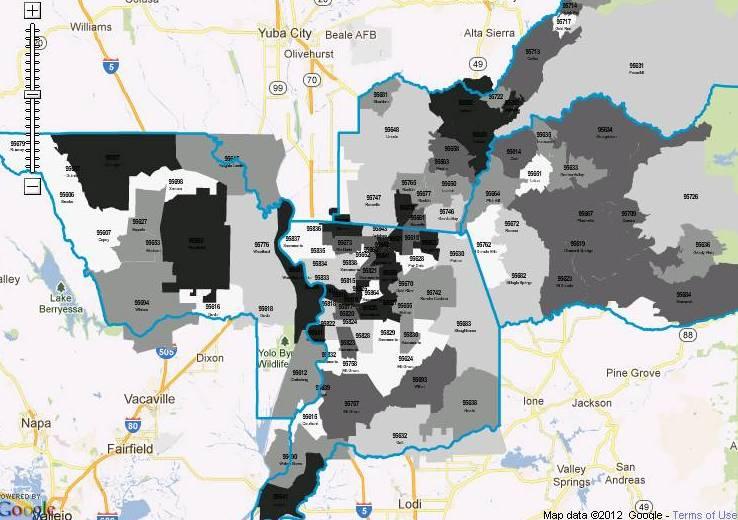
12 Healthy Living Map
13
14
15

16
17

18
19
20

21
 AA AP AT AAD FA S HI P GY I GR PC OB E Alcohol Consumption by Adults Air Pollution Rate Alcohol Consumption by Teens Average Age at Death (in years) Rate of Felony Arrests Smoking Percent")
22 Model Specification AAD it = + 1 AA it + 2 AT it + 3H GR it + 4 FA it + 5 HI it + 6 P it + 7 GY it + 8 I it + 9 PC it + 10 OB it + 11 E it + 12 S it + 13 AP it + it Variable Description (By County ) AA AP AT AAD FA S HI P GY I GR PC OB E Alcohol Consumption by Adults Air Pollution Rate Alcohol Consumption by Teens Average Age at Death (in years) Rate of Felony Arrests Smoking Percent with Health Insurance Percent of Poverty Graduation Year Per Capita Personal Income Percent of High School Graduates Prenatal Care Rate Obesity Rates Exercise Rates Jason Gurtovoy

23 Regression Results County Level AAD = -.006FA +.016E P -.015PC +.028GR AA +.003I -.025AT HI -.027OB +.866GY -. 15AP R 2 =.5529 χ 2 = p-value < 0.000

24 Ranking (Top 8) R Policy Variables (Effect on Average Age at Death) Coeffi cient P-Value 1 Graduation Rate Obesity Graduation Year Alcohol Consumption by Adults 5 Alcohol Consumption by Teens Income Health Insurance Air Pollution


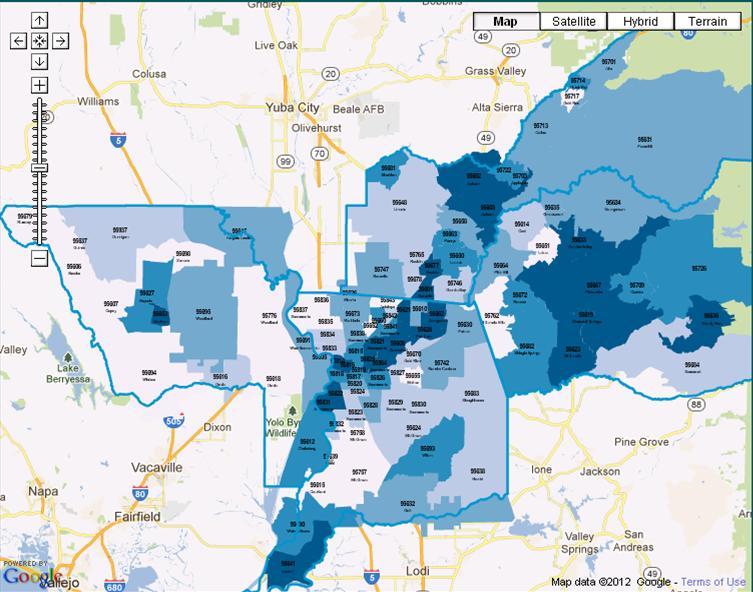
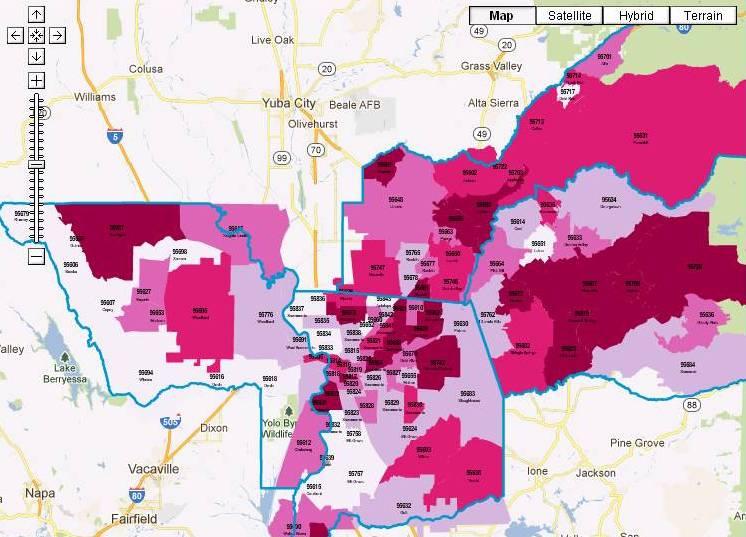
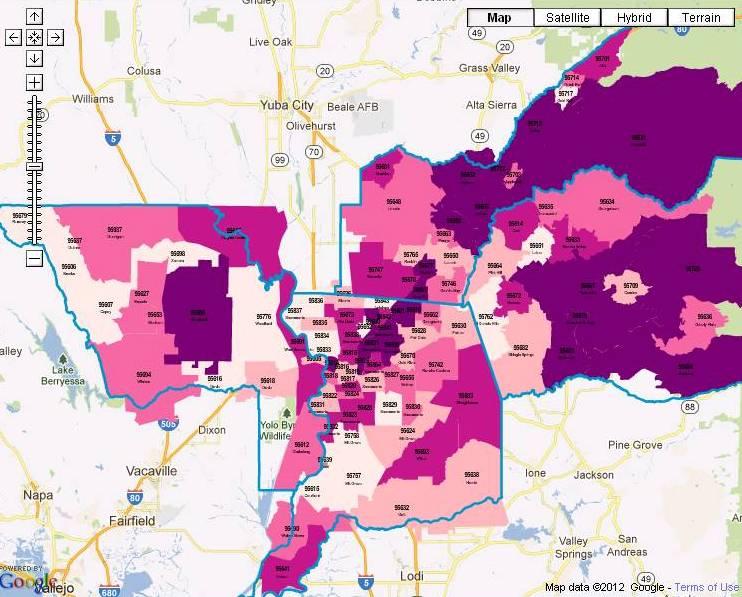
25 Dashboard of Health (County of San Bernardino) The model is the engine of the dashboard which guides the arrow. The model is flexible and can be easily updated, modified, and changed. Intuitive way to internalize the health of the county The arrow will move when new information becomes available. Low Moderate High Severe Runs on continuous interval. We can look at the effects of shocks in the region. We can see how different policy effects will move the dashboard.
 687 Patients 31% No Religious Affiliation 21% Roman")

26 Health System Service Area Census Tract 7301 $1,173,626 in charges (2nd largest dollar amount in a single census tract) 687 Patients 31% No Religious Affiliation 21% Roman Catholic 20% Non-Denominational 18% Protestant 9% Other religion 1% Unknown 34% Ages % Ages % Ages % White/Caucasian 32% Native Am/Ind 27% Afro-American
27 J FKFB INAT OUP SNA SAI RS
28
29 JFK FBI NATO UPS NASA IRS

30 System-wide CHMS Infrastructure Leadership support GIS software on internal server GIS competency POS address validation Internal cloud-based data and report storage

31 System-wide CHMS Infrastructure De-identified community health data published on web (CB) Identify key metrics for tracking population health improvement System-wide culture of decision making based on real-time GIS enabled data, and displayed in a usable format
32 J FKFB INAT OUP SNA SAI RS
33 JFK FBI NATO UPS NASA IRS
34 Reversing Obesity Trends* Among U.S. Adults BRFSS, Now (*BMI 30, or ~ 30 lbs. overweight for 5 4 person) No Data <10% 10% 14% 15% 19% 20% 24% 25% 29% 30%
35 Reversing Obesity Trends* Among U.S. Adults BRFSS, 2013 (*BMI 30, or ~ 30 lbs. overweight for 5 4 person) No Data <10% 10% 14% 15% 19% 20% 24% 25% 29% 30%
36 Reversing Obesity Trends* Among U.S. Adults BRFSS, 2014 (*BMI 30, or ~ 30 lbs. overweight for 5 4 person) No Data <10% 10% 14% 15% 19% 20% 24% 25% 29% 30%
37 Reversing Obesity Trends* Among U.S. Adults BRFSS, 2015 (*BMI 30, or ~ 30 lbs. overweight for 5 4 person) No Data <10% 10% 14% 15% 19% 20% 24% 25% 29% 30%
38 Reversing Obesity Trends* Among U.S. Adults BRFSS, 2016 (*BMI 30, or ~ 30 lbs. overweight for 5 4 person) No Data <10% 10% 14% 15% 19% 20% 24% 25% 29% 30%
39 Reversing Obesity Trends* Among U.S. Adults BRFSS, 2017 (*BMI 30, or ~ 30 lbs. overweight for 5 4 person) No Data <10% 10% 14% 15% 19% 20% 24% 25% 29% 30%
40 Reversing Obesity Trends* Among U.S. Adults BRFSS, 2018 (*BMI 30, or ~ 30 lbs. overweight for 5 4 person) No Data <10% 10% 14% 15% 19% 20% 24% 25%
41 Reversing Obesity Trends* Among U.S. Adults BRFSS, 2019 (*BMI 30, or ~ 30 lbs. overweight for 5 4 person) No Data <10% 10% 14% 15% 19% 20% 24% 25%
42 Reversing Obesity Trends* Among U.S. Adults BRFSS, 2020 (*BMI 30, or ~ 30 lbs. overweight for 5 4 person) No Data <10% 10% 14% 15% 19% 20% 24% 25%
43 Obesity Trends* Among U.S. Adults BRFSS, 2021 (*BMI 30, or ~ 30 lbs. overweight for 5 4 person) No Data <10% 10% 14% 15% 19% 20% 24% 25%
44 Reversing Obesity Trends* Among U.S. Adults BRFSS, 2022 (*BMI 30, or ~ 30 lbs. overweight for 5 4 person) No Data <10% 10% 14% 15% 19% 20%
45 Reversing Obesity Trends* Among U.S. Adults BRFSS, 2023 (*BMI 30, or ~ 30 lbs. overweight for 5 4 person) No Data <10% 10% 14% 15% 19% 20%
46 Reversing Obesity Trends* Among U.S. Adults BRFSS, 2024 (*BMI 30, or ~ 30 lbs. overweight for 5 4 person) No Data <10% 10% 14% 15% 19% 20%
47 Reversing Obesity Trends* Among U.S. Adults BRFSS, 2025 (*BMI 30, or ~ 30 lbs. overweight for 5 4 person) No Data <10% 10% 14% 15% 19% 20%
48 Reversing Obesity Trends* Among U.S. Adults BRFSS, 2026 (*BMI 30, or ~ 30 lbs. overweight for 5 4 person) No Data <10% 10% 14% 15% 19%
49 Reversing Obesity Trends* Among U.S. Adults BRFSS, 2027 (*BMI 30, or ~ 30 lbs. overweight for 5 4 person) No Data <10% 10% 14% 15% 19%
50 Reversing Obesity Trends* Among U.S. Adults BRFSS, 2028 (*BMI 30, or ~ 30 lbs. overweight for 5 4 person) No Data <10% 10% 14% 15% 19%
51 Reversing Obesity Trends* Among U.S. Adults BRFSS, 2029 (*BMI 30, or ~ 30 lbs. overweight for 5 4 person) No Data <10% 10% 14% 15% 19%
52 Reversing Obesity Trends* Among U.S. Adults BRFSS, 2030 (*BMI 30, or ~ 30 lbs. overweight for 5 4 person) No Data <10% 10% 14% 15% 19%
53 Reversing Obesity Trends* Among U.S. Adults BRFSS, 2031 (*BMI 30, or ~ 30 lbs. overweight for 5 4 person) No Data <10% 10% 14% 15% 19%

54 Reversing Obesity Trends* Among U.S. Adults BRFSS, 2032 (*BMI 30, or ~ 30 lbs. overweight for 5 4 person) No Data <10% 10% 14%
55 Reversing Obesity Trends* Among U.S. Adults BRFSS, 2033 (*BMI 30, or ~ 30 lbs. overweight for 5 4 person) No Data <10% 10% 14%
56 Reversing Obesity Trends* Among U.S. Adults BRFSS, 2034 (*BMI 30, or ~ 30 lbs. overweight for 5 4 person) No Data <10% 10% 14%
57 Reversing Obesity Trends* Among U.S. Adults BRFSS, 2035 (*BMI 30, or ~ 30 lbs. overweight for 5 4 person) No Data <10% 10% 14%
58 Reversing Obesity Trends* Among U.S. Adults BRFSS, 2036 (*BMI 30, or ~ 30 lbs. overweight for 5 4 person) No Data <10% 10% 14%
59 Reversing Obesity Trends* Among U.S. Adults BRFSS, 2037 (*BMI 30, or ~ 30 lbs. overweight for 5 4 person) No Data <10% 10% 14%
60 Dora Barilla, DrPH, MPH, CHES Michael Knecht, MDiv Jason Gurtovoy (909)
Consolidated Project Information Project 4.b.ii Access to Chronic Disease Preventive Care Initiative
 Consolidated Project Information Project 4.b.ii Access to Chronic Disease Preventive Care Initiative Contents 4.b.ii Increase Access to High Quality Chronic Disease Preventative Care and Management in
Consolidated Project Information Project 4.a.ii Substance Abuse Prevention and Identification Initiative
 Consolidated Project Information Project 4.a.ii Substance Abuse Prevention and Identification Initiative Contents 4.a.ii Prevent Substance Abuse and Other Mental Emotional Disorders (Focus Area 2)... 3
M.A.P. II. Monitoring and Assessment Project Executive Summary. Infectious Diseases. Chronic Diseases. Tarrant County Public Health
 M.A.P. II Monitoring and Assessment Project 2002-2004 Environmental Health Social & Mental Health Injuries Chronic Diseases County Maternal & Child Health Infectious Diseases County Public Health Safeguarding
HealtheCNY Indicator List by Data Source
 American Community Survey 23 Adults with Health Insurance Children Living Below Poverty Level Children with Health Insurance Families Living Below Poverty Level Homeowner Vacancy Rate Homeownership Households
JOINING HANDS: SHARING RESOURCES AND DATA ACROSS SECTORS TO IMPROVE POPULATION HEALTH
 JOINING HANDS: SHARING RESOURCES AND DATA ACROSS SECTORS TO IMPROVE POPULATION HEALTH Virginia Population Health Summit Charlottesville, Virginia March 29, 2017 Steven H. Woolf, MD, MPH Director, Center
2014 PRC Community Health Needs Assessment
 2014 PRC Community Health Needs Assessment, New York Results Among the Total Population & Target Population (Medicaid/Self-Pay Patients) Prepared for: Stony Brook Medicine By Professional Research Consultants,
2014 Community Health Assessment
 2014 Community Health Assessment ASHLEY CONLEY EPIDEMIOLOGIST CITY OF NASHUA, DPHCS FEBRUARY 19, 2015 NRPC Community Health Assessment Community Health Improvement Process Strategic Plan Community Health
Lincoln Trail District Health Department. Health Report Card
 Lincoln Trail District Health Department 2015 Health Report Card 108 New Glendale Road, Elizabethtown, KY 42701 Phone: 270-769-1601 Fax: 270-765-7274 Website: www.ltdhd.ky.gov Mission The Lincoln Trail
Demographics and Health Data
 Demographics and Health Data Information for Local Planners City of Puyallup, WA Demographic Characteristics Environmental Health Division 3629 South D Street, Tacoma, WA 98418 (253) 798-6470 Table 1 presents
Overweight and Obesity Rates Among Upstate New York Adults
 T H E F A C T S A B O U T Overweight and Obesity Rates Among Upstate New York Adults Upstate New York Obesity Rate: 27.5% Overweight Rate: 35.5% Increase in the combined overweight/ obesity rate from 2003
Demographics and Health Data
 Demographics and Health Data Information for Local Planners City of Lakewood, WA Demographic Characteristics Environmental Health Division 3629 South D Street, Tacoma, WA 98418 (253) 798-6470 Table 1 presents
Health of the City & Community Health Improvement Planning. Raynard Washington, PhD, MPH Chief Epidemiologist
 Health of the City & Community Health Improvement Planning Raynard Washington, PhD, MPH Chief Epidemiologist What is the Community Health Assessment (CHA)? An annual assessment of population health in
2016 PRC Community Health Needs Assessment
 2016 PRC Community Health Needs Assessment Staunton City, Waynesboro City, and Augusta County, Virginia Prepared for: Augusta Health By Professional Research Consultants, Inc. The PRC Community Health
2018 Community Health Assessment
 2018 Community Health Assessment Community Health Status Assessment Linn County, IA Prepared by Amy Hockett, PhD, MPH, CHES Epidemiologist Linn County Public Health August 9, 2018 Community Health Status
Are You Ready to Sail. February 11, 2016
 Are You Ready to Sail your SHIP?! February 11, 2016 Acknowledgement and Disclaimer This webinar was supported by funds made available from the Centers for Disease Control and Prevention, Office for State,
Rockford Health Council
 2010 Healthy Community Study Rockford Area Early Learning Council Becky Cook Kendall April 12, 2011 Rockford Health Council Community-based healthy community collaborative Formed in 1982 as the Rockford
PHACS County Profile Report for Searcy County. Presented by: Arkansas Center for Health Disparities and Arkansas Prevention Research Center
 PHACS County Profile Report for Searcy County Presented by: Arkansas Center for Health Disparities and Arkansas Prevention Research Center Contents Introduction... Page 2 Demographics...Page 3 Social Environment
Healthy People Determinants of Health. County Health Rankings. AHR Indicator. Leading Health Indicators (LHI) CROSSWALK
 CROSSWALK") 1 of 7 CROSSWALK Crosswalk comparing America's Health Rankings' (AHR) indicators with those used by County Health Rankings (CHR) and Healthy People 2020's Leading Health Indicators (LHI). AHR indicators
1 of 7 CROSSWALK Crosswalk comparing America's Health Rankings' (AHR) indicators with those used by County Health Rankings (CHR) and Healthy People 2020's Leading Health Indicators (LHI). AHR indicators
Hospital Discharge Data
 Hospital Discharge Data West Virginia Health Care Authority Hospitalization data were obtained from the West Virginia Health Care Authority s (WVHCA) hospital discharge database. Data are submitted by
Enhancing the Health of Our Communities Alisahah Cole, MD & Chief Community Impact Officer. December 2018
 Enhancing the Health of Our Communities Alisahah Cole, MD & Chief Community Impact Officer December 2018 Goals GET INFORMED GET INSPIRED GET UNCOMFORTABLE GET ACTIVATED Carolinas HealthCare System Is Our
Jackson Hospital Community Health Needs Assessment. Fiscal Year 2016
 Jackson Hospital Community Health Needs Assessment Fiscal Year 2016 JACKSON HOSPITAL AT A GLANCE Jackson Hospital, located in Montgomery, Alabama, is a not-for-profit organization committed to improving
David V. McQueen. BRFSS Surveillance General Atlanta - Rome 2006
 David V. McQueen Associate Director for Global Health Promotion, National Center for Chronic Disease Prevention and Health Promotion, Atlanta BRFSS Surveillance General Atlanta - Rome 2006 Behavioral Risk
2013 Arizona State Health Assessment Summary and Findings. Health and Wellness for all Arizonans
 2013 Arizona State Health Assessment Summary and Findings Health and Wellness for all Arizonans Presentation Overview The State Health Assessment Process Health Indicators 15 Leading Health Issues: o County
Community Health Assessment. May 21, 2014
 Community Health Assessment May 21, 2014 1 Presenters Stacey Adams, MS Co-Leader Domain 1 Carol Heier, LCSW Accreditation Coordinator Dale Quinney, MPH Co-Leader Domain 1 2 Recording available There is
Public Health. In 2006, 23% of births were to mothers between the ages of 15 and 19. This is a decline from 25% in 2001.
 Public Health In 2006, 23% of births were to mothers between the ages of 15 and 19. This is a decline from 25% in 2001. Eleven percent of children born in 2006 had a low birth weight (< 2,500 grams or
Janine E. Janosky, Ph.D. Vice President and Head, Center for Community Health Improvement. June 2013
 Janine E. Janosky, Ph.D. Vice President and Head, Center for Community Health Improvement June 2013 ABIA: Unique Convergence Accountable Care Community (ACC) Vision To improve the health of the community.
How Wheaton Franciscan is meeting the NEEDS of our community. NSWERING HE CALL
 ANSWERING THE CALL MEETING OUR COMMUNITY NEEDS S July 1, 2013 June 30, 2016 How Wheaton Franciscan is meeting the NEEDS of our community. NSWERING HE CALL COMMUNITY HEALTH NEEDS IMPLEMENTATION PLAN: ST.
ALACHUA COUNTY COMMUNITY HEALTH ASSESSMENT
 ALACHUA COUNTY COMMUNITY HEALTH ASSESSMENT JUNE 2016 This page intentionally left blank. ALACHUA COUNTY COMMUNITY HEALTH ASSESSMENT (CHA) Contents Executive Summary 4 The Alachua Community Health Assessment
Baseline Health Data Report: Cambria and Somerset Counties, Pennsylvania
 Baseline Health Data Report: Cambria and Somerset Counties, Pennsylvania 2017 2018 Page 1 Table of Contents Executive Summary.4 Demographic and Economic Characteristics 6 Race and Ethnicity (US Census,
Health Status Disparities in New Mexico Identifying and Prioritizing Disparities
 Health Status Disparities in New Mexico Identifying and Prioritizing Disparities Public Health Division March 23 Health Status Disparities in New Mexico Identifying and Prioritizing Disparities New Mexico
2014 Butte County BUTTE COUNTY COMMUNITY HEALTH ASSESSMENT
 2014 Butte County BUTTE COUNTY COMMUNITY HEALTH ASSESSMENT EXECUTIVE SUMMARY 2015 2017 EXECUTIVE SUMMARY TOGETHER WE CAN! HEALTHY LIVING IN BUTTE COUNTY Hundreds of local agencies and community members
Redington-Fairview General Hospital Community Health Needs Assessment Annual Report
 Redington-Fairview General Hospital 2017 Community Health Needs Assessment Annual Report Original Community Needs Assessment: November 2007 Updated: January 2010; April 2012, September ; August 2015; July
ISSUE BRIEF: ACCESS TO HEALTH CARE Kalkaska County
 ISSUE BRIEF: ACCESS TO HEALTH CARE Kalkaska County Access to primary care providers and medical insurance Improve opportunity for screenings and preventive services Prevent health problems Find problems
Lincoln County. Community Health Assessment
 Community Health Assessment Contents Acknowledgements 1 Introduction 2 Key Informant Health Survey 3 Community Health Data 7 Demographics 8 Substance Abuse 10 Mental Health and Trauma 11 Chronic Disease
Platte Valley Medical Center Page 0
 Platte Valley Medical Center Page 0 Table of Contents Introduction 4 Background and Purpose... 4 Service Area... 4 Map of the Service Area...5 Project Oversight...5 Consultants... 6 Identification of Community
Healthy Montgomery. Our Meaningful Community Partnership Effort to Drive Population Health. Thursday May 17, 2018
 Healthy Montgomery Our Meaningful Community Partnership Effort to Drive Population Health. Thursday May 17, 2018 1.04m Residents 55% Racial or Ethnic Minority 36% Growth in the Senior Population by 2025
Prepared by Southern Illinois University School of Medicine s Center for Clinical Research And Office of Community Health and Service
 Hospital Sisters Health System Community Health Needs Assessment (FY2015-FY2018) Quantitative and Secondary Data Analysis Report For St. Anthony s Hospital Effingham, Prepared by Southern University School
Graves County. Community Health Assessment Three Perspectives on Community Health
 Graves County Community Health Assessment Three Perspectives on Community Health Data Perspective Objective Statistics from National, State and Local Sources Organizational Perspective Community Health
Santa Clara County Highlights
 Santa Clara County Highlights Data and Partnerships: Pivotal Elements to Create Healthy Communities November 6th, 2009 David Hill, PhD, MPH Cities of Santa Clara County 2 The pivotal elements Data evidence-based
Working Towards Addressing Women s Health Disparities in Arizona
 Working Towards Addressing Women s Health Disparities in Arizona Suncerria Tillis, MBA Arizona Health Disparities Center December 6, 2006 National Conference of State Legislatures Women s Health Pre-Conference
Jackson County Community Health Assessment
 2016 Jackson County Community Health Assessment With Collaboration from Black River Memorial Hospital and Jackson County Public Health Wisconsin Population Health Institute Table of Contents Structure
Health Profile Chartbook 2016 Kalkaska County
 Health Profile Chartbook 2016 Kalkaska County 2016 Chartbooks The 2016 Chartbooks provide a snapshot of the health status of the District Health Department #10 jurisdiction. Information is presented by
Health Profile Chartbook 2016 Mecosta County
 Health Profile Chartbook 2016 Mecosta County 2016 Chartbooks The 2016 Chartbooks provide a snapshot of the health status of the District Health Department #10 jurisdiction. Information is presented by
ISSUE BRIEF: ACCESS TO HEALTH CARE Crawford County
 ISSUE BRIEF: ACCESS TO HEALTH CARE Access to primary care providers and medical insurance Improve opportunity for screenings and preventive services Prevent health problems Find problems in early stages
Childhood Obesity in Dutchess County 2004 Dutchess County Department of Health & Dutchess County Children s Services Council
 Childhood Obesity in Dutchess County 2004 Dutchess County Department of Health & Dutchess County Children s Services Council Prepared by: Saberi Rana Ali, MBBS, MS, MPH Dutchess County Department of Health
2013 DUPLIN COUNTY SOTCH REPORT
 2013 DUPLIN COUNTY SOTCH REPORT December 2013 State of the County Health Report The State of the County Health Report (SOTCH) provides a snapshot of the health issues affecting the residents of Duplin
Community Health Status Assessment
 Community Health Status Assessment EXECUTIVE SUMMARY The Community Health Status Assessment (CHSA) is one of four assessments completed as part of the 2015-2016 Lane County Community Health Needs Assessment
In Health Matters, Place Matters - The Health Opportunity Index (HOI) Virginia Department of Health Office of Health Equity
 Virginia Department of Health Office of Health Equity") In Health Matters, Place Matters - The Health Opportunity Index (HOI) Virginia Department of Health Office of Health Equity 1 Identifying the Problem America s Health Rankings United Health Foundation
In Health Matters, Place Matters - The Health Opportunity Index (HOI) Virginia Department of Health Office of Health Equity 1 Identifying the Problem America s Health Rankings United Health Foundation
Preview: Community Health Assessment Findings for the Community Transformation Grant
 Preview: Community Health Assessment Findings for the Community Transformation Grant Sharon Hutchins, Ph.D., MPH Health Services Agency November 26, 2012 Made possible with funding from the Centers for
Behavioral Risk Factor Surveillance System (BRFSS)
") Behavioral Risk Factor Surveillance System (BRFSS) LINA BALLUZ, MPH, Sc.D. Chief Proposed Office of Surveillance, Epidemiology and Laboratory Services Behavior Surveillance Division Overview Background
Behavioral Risk Factor Surveillance System (BRFSS) LINA BALLUZ, MPH, Sc.D. Chief Proposed Office of Surveillance, Epidemiology and Laboratory Services Behavior Surveillance Division Overview Background
Tableau Public Viz Tool
 Tableau Public Viz Tool The purpose of this document is to provide descriptions of the Split By variables for the 2016 VoiceGR Survey results displayed in the Tableau Public Viz Tool. Once you have entered
The Burden Report: Cardiovascular Disease & Stroke in Texas
 The Burden Report: Cardiovascular Disease & Stroke in Texas Texas Cardiovascular Health and Wellness Program www.dshs.state.tx.us/wellness Texas Council on Cardiovascular Disease and Stroke www.texascvdcouncil.org
Community Health Needs Assessment. Implementation Strategy.. SAMPLE TEMPLATE
 Community Health Needs Assessment & Implementation Strategy SAMPLE TABLE OF CONTENTS Executive Summary I. Service Area and Population II. Community Health Needs Assessment Partners.. III. IV. Community
COMMUNITY PARTNERS MEETING
 PUBLIC HEALTH & SYSTEMS IN ACTION COMMUNITY PARTNERS MEETING Presenter: Amy Fagan, Assistant Director of Health Date: February 23, 2017 HEALTH DISTRICT VISION HEALTHY PEOPLE, HEALTHY COMMUNITY HEALTH COALITION
Walworth County Health Data Report. A summary of secondary data sources
 Walworth County Health Data Report A summary of secondary data sources 2016 This report was prepared by the Design, Analysis, and Evaluation team at the Center for Urban Population Health. Carrie Stehman,
FORM 9 NEED FOR ASSISTANCE (NFA) WORKSHEET (REQUIRED)
 WORKSHEET (REQUIRED)") FORM 9 NEED FOR ASSISTANCE (NFA) WORKSHEET (REQUIRED) The worksheet is presented in three sections: Core Barriers, Core Health Indicators, and Other Health and Access Indicators. Refer to the Data Resource
FORM 9 NEED FOR ASSISTANCE (NFA) WORKSHEET (REQUIRED) The worksheet is presented in three sections: Core Barriers, Core Health Indicators, and Other Health and Access Indicators. Refer to the Data Resource
Sarpy/Cass Department of Health and Wellness
 This 2012 Community Health Report Card is the product of many community surveys and agency recordkeeping. The staff at the Sarpy/ Department of Health and Wellness finds value in all of this community
Savannah :: Chatham. August rd Edition COMMUNITY INDICATORS DATABASE COUNTY CHATHAM. produced by the Armstrong Public Service Center
 photo: GA Dept. of Economic Development Savannah :: Chatham COMMUNITY INDICATORS DATABASE August 2013 3rd Edition produced by the Armstrong Public Service Center CHATHAM COUNTY www.savannah-chatham-indicators.org
Obesity in Clark County November 3, 2003 Jeanne Palmer, Health Education Manager, CCHD Rayleen Earney, Chronic Disease Health Educator, CCHD
 Obesity in Clark County November 3, 2003 Jeanne Palmer, Health Education Manager, CCHD Rayleen Earney, Chronic Disease Health Educator, CCHD Presented to: Legislative Committee on Health Care Subcommittee
Health Disparities in WV and the WVU Health Disparities Program. Stephenie K. Kennedy, EdD 12/1/2016
 Health Disparities in WV and the WVU Health Disparities Program Stephenie K. Kennedy, EdD 12/1/2016 Health Disparities Inequalities in the prevalence, morbidity, mortality, or survival rates in a given
Community Health Needs Assessmen. Implementation Strategy
 Community Health Needs Assessmen Implementation Strategy HOSPITAL BACKGROUND Baptist Memorial Restorative Care Hospital was established in 1994 as a long term acute care hospital and is located within
Baptist Health Jacksonville Community Health Needs Assessment Implementation Plans. Health Disparities. Preventive Health Care.
 Baptist Health Jacksonville Community Health Needs Assessment Implementation Plans Health Disparities Infant Mortality Prostate Cancer Heart Disease and Stroke Hypertension Diabetes Behavioral Health Preventive
Maryland s Health Enterprise Zones Addressing Social Determinants of Health
 Maryland s Health Enterprise Zones Addressing Social Determinants of Health Michelle Spencer, MS Associate Director, Bloomberg American Health Initiative Associate Scientist, Health Policy and Management
Colorado Health Disparities Profiles
 Health Disparities Profiles includes: Larimer County Population Total Population Source: CDC/NCHS 2007-based, bridged-race population estimates, 2007. Social Determinants of Health 287,574 248,312 26,629
Table of Contents. Executive Summary.3. McLaren Central Michigan Priority Needs Identified 9. Service Area Profile 11
 Community Health Needs Assessment 2016 2019 1 Table of Contents Executive Summary.3 McLaren Central Michigan Priority Needs Identified 9 Service Area Profile 11 Demographic and Socioeconomic Indicators.12
Maryland SHIP Anne Arundel Baseline Data 10/26/2011. MD Baseline. County Baseline. National Baseline
 Arundel Data 10/26/2011 Increase life expectancy in Arundel 1 Reduce infant Arundel 2 deaths Arundel 3 Arundel 4 Arundel 6 Reduce low birth weight (LBW) & very low birth weight (VLBW) Reduce sudden unexpected
Welcome and Texas DSHS Overview
 Welcome and Texas DSHS Overview July 24, 2015 Heart Attack and Stroke Systems of Care Summit: A Focus on Quality Improvement through the Texas Heart Attack and Stroke Data Collection Initiative Disclosure
The clinical and economic benefits of better treatment of adult Medicaid beneficiaries with diabetes
 The clinical and economic benefits of better treatment of adult Medicaid beneficiaries with diabetes September, 2017 White paper Life Sciences IHS Markit Introduction Diabetes is one of the most prevalent
Baptist Health Nassau Community Health Needs Assessment Priorities Implementation Plans
 Baptist Health Nassau Community Health Needs Assessment Priorities Implementation Plans Health Disparities Heart Disease Stroke Hypertension Diabetes Adult Type II Preventive Health Care Smoking and Smokeless
Oakwood Healthcare Community Health Needs Assessment Indicators
 POPULATION Sub-Category Education Socioeconomic Violence High School High School Dropouts Graduation Rate (Percent) Some College Births to Unmarried Women Children in Poverty Children in Singleparent Households
Developing Health Equity Indicators from a Place based Perspective Corina Chung, MS Epidemiologist Heather Arata, PhD Health Equity Consultant
 Developing Health Equity Indicators from a Place based Perspective Corina Chung, MS Epidemiologist Heather Arata, PhD Health Equity Consultant Deborah van Olst, MPH Epidemiologist What is Health Equity?
Colorado Health Disparities Profiles
 Health Disparities Profiles County includes: Jackson, Moffat, Rio Blanco, and Counties Population Total Population 22,382 43,638 4,861,515 21,015 39,473 3,508,736 904 3,224 909,833 140 263 228,718 210
Progress Tracker. Photo - https://www.healthypeople.gov/
 Progress Tracker Healthy People provides a framework for prevention for communities in the U.S. Healthy People 2020 is a comprehensive set of key disease prevention and health promotion objectives. The
CASINO REVENUE AND AMERICAN INDIAN HEALTH
 CASINO REVENUE AND AMERICAN INDIAN HEALTH The Link Between Tribal Gaming and the Health Status and Behaviors of American Indians Barbara Wolfe Jessica Jakubowski Robert Haveman Hannah Goble Marissa Courey
Community Health Needs Assessment
 Community Health Needs Assessment Scott County, Missouri This assessment will identify the health needs of the residents of Scott County, Missouri, and those needs will be prioritized and recommendations
Tuscarawas County Health Department
 Tuscarawas County Health Department Community Health Needs Assessment 214 TUSCARAWAS COUNTY HEALTH DEPARTMENT Community Health Needs Assessment 214 Assessment Commissioned by: Dr. James Hubert D.O Health
Baptist Health Beaches Community Health Needs Assessment Priorities Implementation Plans
 Baptist Health Beaches Community Health Needs Assessment Priorities Implementation Plans Health Disparities Heart Disease Stroke Hypertension Diabetes Adult Type II Preventive Health Care Smoking and Smokeless
County Health Rankings Baldwin County 2016 Graphics of County Health Rankings Include All Counties In the North Central Health District
 Health Rankings Baldwin 2016 Graphics of Health Rankings Include All Counties In the North Central Health District Public Health for Middle Georgia Serving Baldwin, Bibb, Crawford, Hancock, Houston, Jasper,
2014 Dakota County Community Health Needs Assessment Results
 2014 Dakota County Community Health Needs Assessment Results 1601 Broadway P.O. Box 155 Dakota City, NE 68731 402.987.2164 (P) 402.987.2163 (F) 1 Summary The Dakota County Health Department conducted a
Tri-County Health Assessment Collaborative 2013 Community Health Needs Assessment Research Review
 Tri- Health Assessment Collaborative 2013 Community Health Needs Assessment Research Review The Tri- Collaborative Three counties Five health systems; 12 hospitals Three health departments Countless community
Community Health Needs Assessment 2016
 Community Health Needs Assessment 2016 OSF HOLY FAMILY MEDICAL CENTER WARREN COUNTY CHNA 2016 Warren County 2 TABLE OF CONTENTS Executive Summary... 3 Introduction... 5 Methods... 6 Chapter 1. Community
Community Health Needs Assessment (CHNA)
") Community Health Needs Assessment (CHNA) Pierce ; St. Croix Contents Demographics... 3 Total Population... 4 Median Age... 6 Population Under Age 18... 8 Population Age 65+... 9 Population with Any Disability...
Community Health Needs Assessment (CHNA) Pierce ; St. Croix Contents Demographics... 3 Total Population... 4 Median Age... 6 Population Under Age 18... 8 Population Age 65+... 9 Population with Any Disability...
Cascade Pacific Action Alliance Regional Health Assessment
 Cascade Pacific Action Alliance Regional Health Assessment Cowlitz, Grays Harbor, Lewis, Mason, Pacific, Thurston and Wahkiakum County December, 2014 V.4 Thematic Areas Demographics and Socioeconomic Status
FLHealthCHARTS.com Update List
 Released = New data, statistical brief, or analytic report not previously posted on FLHealthCHARTS. Added = New features or indicators not previously posted on FLHealthCHARTS. Updated = Change to data
County Health Rankings Monroe County 2016
 Health Rankings Monroe 2016 Graphics of Health Rankings Include All Counties In the North Central Health District Public Health for Middle Georgia Serving Baldwin, Bibb, Crawford, Hancock, Houston, Jasper,
Overview of Health Disparities in Arkansas
 Overview of Health Disparities in Arkansas Annual Critical Access Hospital Conference August 9, 2018 Joyce Biddle, MPH, MPA Chronic Disease Epidemiologist Office of Minority Health and Health Disparities
Bernalillo County Community Profile
 County Community Profile Introduction This profile describes the current health status of the county. With this information, the community can complete an assessment and begin to address specific issues
THE HEALTH OF CHINESE AMERICANS: 1970 TO TODAY PRESENTED BY KATHY KO CHIN, PRESIDENT AND CEO ASIAN & PACIFIC ISLANDER AMERICAN HEALTH FORUM
 THE HEALTH OF CHINESE AMERICANS: 1970 TO TODAY PRESENTED BY KATHY KO CHIN, PRESIDENT AND CEO ASIAN & PACIFIC ISLANDER AMERICAN HEALTH FORUM OUR MISSION The Asian & Pacific Islander American Health Forum
Service Area: Herkimer, Fulton & Montgomery Counties. 140 Burwell St. 301 N. Washington St. Little Falls, NY Herkimer, NY 13350
 2016 Community Service Plan & Community Health Improvement Plan & Herkimer County Public Health Service Area: Herkimer, Fulton & Montgomery Counties Bassett Healthcare Network s Little Falls Hospital Herkimer
COUNTY PROFILE: San Bernardino County, California
 COUNTY PROFILE: San Bernardino County, California US COUNTY PERFORMANCE The Institute for Health Metrics and Evaluation (IHME) at the University of Washington analyzed the performance of all 3,142 US counties
Snapshot 2016 COMMUNITY HEALTH ASSESSMENT
 Snapshot 2016 COMMUNITY HEALTH ASSESSMENT Background Hospitals that are 501 (c) (3) and public health agencies in Ohio are required to complete a community health assessment (CHA) every three years. A
Mississippi State Department of Health, Health Services / Office of Health Data and Research
 Maternal and Child Health Mississippi State Department of Health, Health Services / Office of Health Data and Research Jackson, Mississippi Assignment Description The Mississippi State Department of Health
Northampton County. State of the County Health Report (SOTCH)
") ampton County 2015 State of the County Health Report (SOTCH) ampton County Health Department 9495 NC Highway 305 P.O. Box 635 Jackson, NC 27845 252-534-5841 John White, Acting Health Director Virginia
ampton County 2015 State of the County Health Report (SOTCH) ampton County Health Department 9495 NC Highway 305 P.O. Box 635 Jackson, NC 27845 252-534-5841 John White, Acting Health Director Virginia
Westside Health Collaborative Initiative
 Westside Health Collaborative Initiative OVERVIEW, KEY FINDINGS, IMPROVEMENT PLAN www.westsideontherise.org Westside on the Rise: Positive Transformation of People and Place Neighborhood Transformation
Johns Hopkins University Health Disparities Seminar Series. Eliminating Health Disparities in Maryland
 Johns Hopkins University Health Disparities Seminar Series Eliminating Health Disparities in Maryland Joshua M. Sharfstein, MD, Secretary Maryland Department of Health & Mental Hygiene and Carlessia A.
HAMILTON COUNTY DATA PROFILE ADULT CIGARETTE SMOKING. North Country Population Health Improvement Program
 HAMILTON COUNTY DATA PROFILE ADULT CIGARETTE SMOKING North Country Population Health Improvement Program HAMILTON COUNTY DATA PROFILE: ADULT CIGARETTE SMOKING INTRODUCTION The Hamilton County Data Profile
2019 COMMUNITY HEALTH ASSESSMENT
 2019 COMMUNITY HEALTH ASSESSMENT Northampton County Health Department 9495 NC Highway 305 P.O. Box 635, Jackson, NC 27845 Andy Smith, Health Director Virginia McClary, Health Educator/Author 1 Table of
Identifying Dental Deserts in the Los Angeles County Safety Net using GIS Maps. Maritza Cabezas, DDS, MPH Dental Director Oral Health Program
 Identifying Dental Deserts in the Los Angeles County Safety Net using GIS Maps Maritza Cabezas, DDS, MPH Dental Director Oral Health Program Background: Los Angeles County is the most populous and most
Community Health Needs Assessment
 Community Health Needs Assessment Gratiot County Community Health Assessment Community Health Assessment Data Sources Primary Data (new data collected first-hand) Community Opinion Survey Provider Opinion
Wellness County Profile ROGERS
 Wellness County Profile 2018 ROGERS OKLAHOMA MAPS This image cannot currently be displayed. ROGERS Insurance Coverage Population 91,766 Unemployment Rate (2013-2015) High School Dropouts: Class