HEALTH DISPARITIES STORY MAP Conception and Technical Implementation. Ana Lòpez-De Fede, PhD Research Professor
|
|
|
- Joy Dayna Webb
- 5 years ago
- Views:
Transcription

1 HEALTH DISPARITIES STORY MAP Conception and Technical Implementation Ana Lòpez-De Fede, PhD Research Professor

2 HEALTH DISPARITIES STORY MAP Conception and Technical Implementation Ana Lòpez-De Fede, PhD Research Professor Kathy Mayfield-Smith, MA, MBA Associate Professor John Stewart, MS, MPH Senior GIS Research Associate Rebecca Wilkerson, MSPH Senior GIS Research Associate Amar Yara, US Computing Inc., Director of Software Engineering Brett Shofner, US Computing Inc., Software Engineer


3 3 Goals of the Presentation o Introduce the Health Disparity Interactive Map Journal o Highlight the approach and link to community planning and policy o Identify the technical and security challenges and solutions
4 4 Why Map Health Disparities? Disparities in health and health care limit continued improvement in overall quality of care and population health and result in unnecessary costs. Recent analysis estimates that 30% of direct medical costs for Blacks, Hispanics, and Asian Americans are excess costs due to health inequities with economic losses estimated at $309 billion per year due to the direct and indirect costs of disparities. As the population becomes more diverse, with people of color projected to account for over half of the population by 2050, it is increasingly important to address health disparities.
5 Health disparities are... 5 differences in the relative health status of population groups defined by such characteristics as race/ethnicity, gender, socioeconomic status, and geographic location. driven largely by unequal population access to such lifeenhancing resources (or social determinants of health) as food, housing, employment, education, transportation, and health care.
, diabetes, end-stage renal disease (ESRD),")
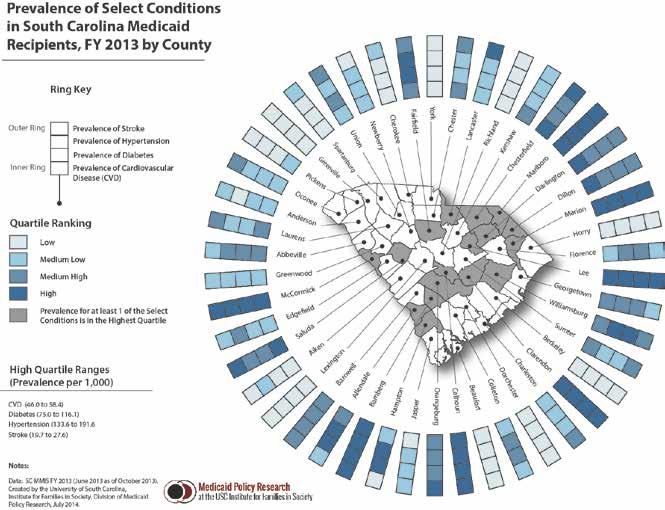
6 6 Medicaid Population Health High Need Areas Areas of South Carolina with a high prevalence of at least 3 select child health conditions AND at least 3 select adult health conditions among Medicaid enrollees Select child conditions: ADHD, autism, asthma, diabetes, obesity, or sickle cell disease Select adult conditions: cardiovascular disease (CVD), diabetes, end-stage renal disease (ESRD), hypertension, obesity, or stroke

7 7 Medicaid Recipients Recipients in 2013: 1,162,210 o Increase of 13.8% from 2012 Nearly 1 in 4 South Carolinians are enrolled in Medicaid Greatest number are in metropolitan areas o BUT the highest enrollment rates are in predominantly rural areas Especially along the I-95 corridor

8 Number of Medicaid Recipients More than 50% of Medicaid recipients are children ages 0-18 years.
 are found along the I-95")

9 9 Percent in Medicaid Notice that the highest rates (percentages) are found along the I-95 corridor (Extending from Marlboro County in the Northeast to Jasper County in the Southern portion of the state)

10 Swipe Example in Journal Text information on left Two related maps on the same page with swipe bar Ability to interact and retrieve data about spatial locations


11 11 Percent African American Increased risk for poor health outcomes Largest % of residents in areas along the I-95 corridor


12 Rural/Urban Landscape 1/3 of South Carolinians live in rural areas Geographic isolation and socioeconomic disadvantage can increase risk for poor health

13 Poverty 13 Associated with higher rates of mortality and morbidity Defined by US Census Bureau Geographic areas in which 20% or more of population live below the federal poverty level are poverty areas Geographic areas in which 40% or more of population live below the federal poverty level are extreme poverty areas


14 Adult Percent Poverty Notice more of the poverty areas are found along the I-95 corridor (Extending from Marlboro County in the Northeast to Jasper County in the Southern portion of the state)


15 15 Child Percent Poverty Poverty and extreme poverty are more prevalent among children than adults.


16 16 Percent With No High School Diploma More likely to suffer functional limitations, acute conditions, and chronic diseases Can restrict access to health information and health care services, limit job opportunities, and diminish lifetime earnings potential


17 17 Percent Unemployed Limits the financial means needed to acquire or access such resources as healthy food, safe housing, adequate clothing, reliable transportation, and continuous, coordinated health care


18 18 Prevalence of Diabetes Diabetes prevalence is high along the I-95 corridor.


19 19 Enlarge Images to View Images on the left-hand side will enlarge when clicked
20

21 Hot Spot Maps 21 Reflect the degree to which high disease prevalence areas in the state are geographically clustered o Adult hot spots represent clustered areas characterized by a high prevalence of any one of 22 conditions o Including asthma, breast cancer, cervical cancer, chronic obstructive pulmonary disease, depression, diabetes, end stage renal disease, hypertension, and obesity o Child hot spots represent clustered areas characterized by a high prevalence of any one of 6 conditions o ADHD, autism, diabetes, obesity, and sickle cell disease

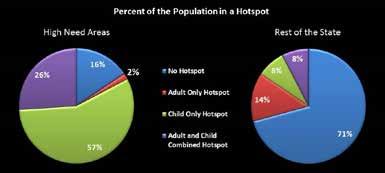
22 22 Hotspot


23 23 Percent in Medicaid Also Showing Trauma Level Hospitals Health care resources are not evenly distributed across the state Rural residents typically must travel farther to advanced hospital-based services


24 24 Provider to Population Ratio Low geographic access can prevent or limit appropriate utilization of health care, including preventive and acute care, and chronic disease management.


25 25 Targeting High Need Areas High Need Areas (symbolized in red on the map) have lower educational attainment, higher poverty rates, higher unemployment, and less access to health care

26 26 Applying Shading Effects Ability to apply shading effects from desktop to final interactive map

27 High Need and Neighboring Areas 27 Areas that border High Need Areas also experience critical community resource disadvantage > 250,000 Medicaid enrollees live in High Need Areas and neighboring areas Percent High Need Areas and Neighboring Areas Compared to the Rest of the State 51% 43% 25% High Need Areas Neighboring Areas Rest of the State 18% 17% 13% 8% 8% 7% 21% 19% 14% 33% 34% 24% 84% 77% 20% 0 Percent Black Percent Without a High School Diploma Percent Unemployed Percent of Adults in Poverty Percent of Children in Poverty Percent in a Hotspot

28 Targeting Interventions 28 Strong spatial association exists between limited access to life-enhancing resources and poor health outcomes among state Medicaid participants. Health interventions targeting these highneed communities can improve health and reduce health disparities among child and adult Medicaid recipients in South Carolina.
29 29 Technical Notes Use of ArcGIS Online Templates o o Esri Story Map Journal Esri Swipe Map development in Desktop Application hosted on local ArcGIS Server Application linked to existing website

30 30 Technical Notes (continued) Minimal text o o Summary of key points Use instruction Graphic Design o o o Adobe Photoshop Adobe Illustrator Stock photos, vector graphics, and original graphics
31 31 Technical Challenges and Solutions Challenges o Presenting side-by-side interactive maps o Mapping/Loading speed o Title and legend tweaks Solutions o Template download and integrative custom coding Swipe template inside Map Journal o Swipes use one map instead of two for loading speed o Template pulls titles and legends from layer and service names
32 Security Issues 32 Concern with mapping protected health information o What s online? o Restrict access? o Aggregate? Verified ArcGIS Online and other Esri products met required security needs o ArcSDE and ArcGIS Server are behind the firewall o Webadaptor prevents direct access to ArcGIS Server based REST services o Ability to restrict access to no one or specific users via user names and passwords with ArcGIS Online o Aggregation of data is useful for public maps
33 QUESTIONS? Ana Lòpez-De Fede, PhD Research Professor Mapping the Story of Health Disparities healthdisparitiesmapjournal ACKNOWLEDGEMENTS SC HealthViz 33
Developing Health Equity Indicators from a Place based Perspective Corina Chung, MS Epidemiologist Heather Arata, PhD Health Equity Consultant
 Developing Health Equity Indicators from a Place based Perspective Corina Chung, MS Epidemiologist Heather Arata, PhD Health Equity Consultant Deborah van Olst, MPH Epidemiologist What is Health Equity?
Introduction Female Breast Cancer, U.S. 9/23/2015. Female Breast Cancer Survival, U.S. Female Breast Cancer Incidence, New Jersey
 Disparities in Female Breast Cancer Stage at Diagnosis in New Jersey a Spatial Temporal Analysis Lisa M. Roche, MPH, PhD 1, Xiaoling Niu, MS 1, Antoinette M. Stroup, PhD, 2 Kevin A. Henry, PhD 3 1 Cancer
HEALTH DISPARITIES AMONG ADULTS IN OHIO
 OHIO MEDICAID ASSESSMENT SURVEY 2012 Taking the pulse of health in Ohio HEALTH DISPARITIES AMONG ADULTS IN OHIO Amy K. Ferketich, PhD 1 Ling Wang, MPH 1 Timothy R. Sahr, MPH, MA 2 1The Ohio State University
Disparity Data Fact Sheet General Information
 Disparity Data Fact Sheet General Information Tobacco use is a well-recognized risk factor for many cancers, respiratory illnesses and cardiovascular diseases within Michigan. rates have continued to decline
The Burden of Cardiovascular Disease in North Carolina June 2009 Update
 The Burden of Cardiovascular Disease in North Carolina June 2009 Update Sara L. Huston, Ph.D. Heart Disease & Stroke Prevention Branch Chronic Disease & Injury Section Division of Public Health North Carolina
Our Healthy Community Partnership. and the Brown/Black Coalition are. pleased to release the Douglas County Health and
 Our Healthy Community Partnership and the Brown/Black Coalition are pleased to release the 2007 Douglas County Health and Disparities Report Card. This report provides a snapshot of local disparities in
Slide 1. Slide 2. Slide 3. Ongoing Disparities in Rural Health. All-Cause Mortality: US vs. Appalachia
 Slide 1 Ongoing Disparities in Rural Health 1 Slide 2 Source: Singh and Siahpush, Widening Rural-Urban Disparities in Life Expectancy, U.S., 1969-2009. American Journal of Preventive Medicine, 2014; 46(2):e19-e29.
Pre-Conception & Pregnancy in Ohio
 Pre-Conception & Pregnancy in Ohio Elizabeth Conrey, PhD 1 January 217 1 State Maternal and Child Health Epidemiologist, Ohio Department of Health EXECUTIVE SUMMARY The primary objective of the analyses
Health Disparities Matter!
 /KirwanInstitute www.kirwaninstitute.osu.edu Health Disparities Matter! Kierra Barnett, Research Assistant Alex Mainor, Research Assistant Jason Reece, Director of Research Health disparities are defined
Changing Patient Base. A Knowledge to Practice Program
 Changing Patient Base A Knowledge to Practice Program Learning Objectives By the end of this tutorial, you will: Understand how demographics are changing among patient populations Be aware of the resulting
HEALTH CARE DISPARITIES AND HEALTH CARE POLICY 1
 HEALTH CARE DISPARITIES AND HEALTH CARE POLICY 1 Health Care Disparities and Health Care Policy Affecting the Rural Community Cheryl Shapiro Ferris State University HEALTH CARE DISPARITIES AND HEALTH CARE
Table of Contents. 2 P age. Susan G. Komen
 RHODE ISLAND Table of Contents Table of Contents... 2 Introduction... 3 About... 3 Susan G. Komen Affiliate Network... 3 Purpose of the State Community Profile Report... 4 Quantitative Data: Measuring
AIR POLLUTION RISK & VULNERABILITY TO HEALTH IMPACTS: A LOOK AT WEST OAKLAND
 AIR POLLUTION RISK & VULNERABILITY TO HEALTH IMPACTS: A LOOK AT WEST OAKLAND AB 617 Community Air Protection Program Consultation Group Meeting March 26, 2018 Muntu Davis, MD, MPH Alameda County Health
Table of Contents. 2 P a g e. Susan G. Komen
 NEW HAMPSHIRE Table of Contents Table of Contents... 2 Introduction... 3 About... 3 Susan G. Komen Affiliate Network... 3 Purpose of the State Community Profile Report... 4 Quantitative Data: Measuring
Racial disparities in health outcomes and factors that affect health: Findings from the 2011 County Health Rankings
 Racial disparities in health outcomes and factors that affect health: Findings from the 2011 County Health Rankings Author: Nathan R. Jones, PhD University of Wisconsin Carbone Cancer Center Introduction
Health Care in Appalachia. Foundations of Modern Health Care, Lecture 12 Anya K. Cope, DO
 Health Care in Appalachia Foundations of Modern Health Care, Lecture 12 Anya K. Cope, DO Learning Objectives: At the completion of this exercise, learners should be able to: Discuss the mortality rates
CHRONIC DISEASE PREVALENCE AMONG ADULTS IN OHIO
 OHIO MEDICAID ASSESSMENT SURVEY 2012 Taking the pulse of health in Ohio CHRONIC DISEASE PREVALENCE AMONG ADULTS IN OHIO Amy Ferketich, PhD Ling Wang, MPH The Ohio State University College of Public Health
 By understanding and using data and statistics, you will become well informed about the state of health in the county and learn the most recent health information and activities pertinent to your specific
2014 Butte County BUTTE COUNTY COMMUNITY HEALTH ASSESSMENT
 2014 Butte County BUTTE COUNTY COMMUNITY HEALTH ASSESSMENT EXECUTIVE SUMMARY 2015 2017 EXECUTIVE SUMMARY TOGETHER WE CAN! HEALTHY LIVING IN BUTTE COUNTY Hundreds of local agencies and community members
CDRI Cancer Disparities Geocoding Project. November 29, 2006 Chris Johnson, CDRI
 CDRI Cancer Disparities Geocoding Project November 29, 2006 Chris Johnson, CDRI cjohnson@teamiha.org CDRI Cancer Disparities Geocoding Project Purpose: To describe and understand variations in cancer incidence,
In Health Matters, Place Matters - The Health Opportunity Index (HOI) Virginia Department of Health Office of Health Equity
 Virginia Department of Health Office of Health Equity") In Health Matters, Place Matters - The Health Opportunity Index (HOI) Virginia Department of Health Office of Health Equity 1 Identifying the Problem America s Health Rankings United Health Foundation
In Health Matters, Place Matters - The Health Opportunity Index (HOI) Virginia Department of Health Office of Health Equity 1 Identifying the Problem America s Health Rankings United Health Foundation
Walkability vs. Several Health Diagnoses for Klamath Falls, OR
 Walkability vs. Several Health Diagnoses for Klamath Falls, OR John Ritter, Ph.D. Geomatics Dept, Oregon Tech Stephanie Van Dyke, MD, MPH Medical Director, Sky Lakes Wellness Center Katherine Pope, RN,
Table of Contents. 2 P age. Susan G. Komen
 NEVADA Table of Contents Table of Contents... 2 Introduction... 3 About... 3 Susan G. Komen Affiliate Network... 3 Purpose of the State Community Profile Report... 4 Quantitative Data: Measuring Breast
Table of Contents. 2 P age. Susan G. Komen
 WYOMING Table of Contents Table of Contents... 2 Introduction... 3 About... 3 Susan G. Komen Affiliate Network... 3 Purpose of the State Community Profile Report... 4 Quantitative Data: Measuring Breast
Texas Chronic Disease Burden Report. April Publication #E
 Texas Chronic Disease Burden Report April 2010 Publication #E81-11194 Direction and Support Lauri Kalanges, MD, MPH Medical Director Health Promotion and Chronic Disease Prevention Section, Texas Department
Geographic Differences in. Community Risk Factors
 Geographic Differences in Chlamydia and Gonorrhea Rates: Community Risk Factors Sonoma County Department of Health Services Lucinda Gardner, MSPH September 30, 2008 Overview Project Objectives About Sonoma
Dental Care Remains the No. 1 Unmet Health Care Need for Children and Low-Income Adults
 Oral Health and Access to Dental Care for Ohioans, 2007 Dental Care Remains the No. 1 Unmet Health Care Need for Children and Low-Income Adults Oral Health and Access to Dental Care for Ohioans, 2007
Wellness County Profile ROGERS
 Wellness County Profile 2018 ROGERS OKLAHOMA MAPS This image cannot currently be displayed. ROGERS Insurance Coverage Population 91,766 Unemployment Rate (2013-2015) High School Dropouts: Class
Wellness County Profile STEPHENS
 Wellness County Profile 2018 STEPHENS OKLAHOMA MAPS STEPHENS Insurance Coverage Population 44,090 Unemployment Rate (2013-2015) High School Dropouts: Class of 16 Uninsured Insured 15.9% Stephens
HIV in the Deep South: Epidemiology* and Prevention Funding Inequities
 HIV in the Deep South: Epidemiology* and Prevention Funding Inequities Carolyn McAllaster, Clinical Professor of Law Director, Southern HIV/AIDS Strategy Initiative (SASI) Duke University School of Law
2018 Community Health Assessment
 2018 Community Health Assessment Community Health Status Assessment Linn County, IA Prepared by Amy Hockett, PhD, MPH, CHES Epidemiologist Linn County Public Health August 9, 2018 Community Health Status
Wellness County Profile JOHNSTON
 Wellness County Profile 2018 JOHNSTON OKLAHOMA MAPS JOHNSTON Insurance Coverage Population 11,087 Unemployment Rate (2013-2015) High School Dropouts: Class of 16 Uninsured Insured 19.1% Johnston
Wellness County Profile CRAIG
 Wellness County Profile 2018 CRAIG OKLAHOMA MAPS CRAIG Insurance Coverage Population 14,625 Unemployment Rate (2013-2015) High School Dropouts: Class of 16 Uninsured Insured 18.1% Craig 5.6
Wellness County Profile GARFIELD
 Wellness County Profile 2018 GARFIELD OKLAHOMA MAPS GARFIELD Insurance Coverage Population 62,603 Unemployment Rate (2013-2015) High School Dropouts: Class of 16 Uninsured Insured 16.5% Garfield
Wellness County Profile GARVIN
 Wellness County Profile 2018 GARVIN OKLAHOMA MAPS GARVIN Insurance Coverage Population 27,838 Unemployment Rate (2013-2015) High School Dropouts: Class of 16 Uninsured Insured 16.7% Garvin
Wellness County Profile BECKHAM
 Wellness County Profile 2018 BECKHAM OKLAHOMA MAPS BECKHAM Insurance Coverage Population 22,519 Unemployment Rate (2013-2015) High School Dropouts: Class of 16 Uninsured Insured 15.2% Beckham
Wellness County Profile SEMINOLE
 Wellness County Profile 2018 SEMINOLE OKLAHOMA MAPS SEMINOLE Insurance Coverage Population 25,207 Unemployment Rate (2013-2015) High School Dropouts: Class of 16 Uninsured Insured 18.9% Seminole
CLACLS. The Relationship between Food Insecurity and Weight in the United States,
 CLACLS Center for Latin American, Caribbean & Latino Studies The Relationship between Food Insecurity and Weight in the United States, 2011-2014 Sebastián Villamizar-Santamaría Sociology PhD Student Research
Table of Contents. 2 P age. Susan G. Komen
 NEW MEXICO Table of Contents Table of Contents... 2 Introduction... 3 About... 3 Susan G. Komen Affiliate Network... 3 Purpose of the State Community Profile Report... 3 Quantitative Data: Measuring Breast
COMMUNITY PROFILE Miami Gardens, Florida
 Jay Weiss Institute for Health Equity Sylvester Comprehensive Cancer Center University of Miami COMMUNITY PROFILE Miami Gardens, Florida April 2015 Miami Gardens 0 TABLE OF CONTENTS Page Introduction 2
Wellness County Profile SEQUOYAH
 Wellness County Profile 2018 SEQUOYAH OKLAHOMA MAPS SEQUOYAH Insurance Coverage Population 41,294 Unemployment Rate (2013-2015) High School Dropouts: Class of 16 Uninsured Insured 18.1% Sequoyah
Wellness County Profile PAYNE
 Wellness County Profile 2018 PAYNE OKLAHOMA MAPS PAYNE Insurance Coverage Population 81,131 Unemployment Rate (2013-2015) High School Dropouts: Class of 16 Uninsured Insured 15.6% Payne 3.9
Multnomah County Health Department. Report Card on Racial and Ethnic Health Disparities. April 2011
 Multnomah County Health Department Report Card on Racial and Ethnic Health Disparities April 2011 Lillian Shirley, Director, Multnomah County Health Department Sandy Johnson, Office of Health and Social
SASI Update: The Continuing HIV Crisis in the US South
 SASI Update: The Continuing HIV Crisis in the US South Duke Center for Health Policy and Inequalities Research Susan Reif, PhD, LCSW Kathryn Whetten, PhD, MPH Duke Center for Health Policy and Inequalities
Wellness County Profile MCCLAIN
 Wellness County Profile 2018 MCCLAIN OKLAHOMA MAPS McCLAIN Insurance Coverage Population 38,682 Unemployment Rate (2013-2015) High School Dropouts: Class of 16 Uninsured Insured 15.3% McClain
M.A.P. II. Monitoring and Assessment Project Executive Summary. Infectious Diseases. Chronic Diseases. Tarrant County Public Health
 M.A.P. II Monitoring and Assessment Project 2002-2004 Environmental Health Social & Mental Health Injuries Chronic Diseases County Maternal & Child Health Infectious Diseases County Public Health Safeguarding
Impact of Poor Healthcare Services
 Competency 3 Impact of Poor Healthcare Services Updated June 2014 Presented by: Lewis Foxhall, MD VP for Health Policy Professor, Clinical Cancer Prevention UT MD Anderson Cancer Center Competency 3 Objectives
INSECURITY. Food. Though analyses at the regional and national levels
 Food INSECURITY The Southern Rural Development Center addresses... Report from RIDGE-funded research in the Southern Region Food insecurity and emotional well-being among single mothers in the rural South
Health Equity Series: Hispanic Health Disparities in Missouri. April 2013
 Health Equity Series: Hispanic Health Disparities in Missouri April 2013 Health Equity Series: Hispanic Health Disparities in Missouri April 2013 This report is based on data, analysis, and narrative prepared
Cancer and Demographic COUNTY PROFILE Broward County, Florida
 Cancer and Demographic COUNTY PROFILE Broward County, Florida Sylvester Comprehensive Cancer Center Jay Weiss Institute for Health Equity University of Miami Revised Sept. 2016 TABLE OF CONTENTS Page Introduction
Identifying Dental Deserts in the Los Angeles County Safety Net using GIS Maps. Maritza Cabezas, DDS, MPH Dental Director Oral Health Program
 Identifying Dental Deserts in the Los Angeles County Safety Net using GIS Maps Maritza Cabezas, DDS, MPH Dental Director Oral Health Program Background: Los Angeles County is the most populous and most
The Burden Report: Cardiovascular Disease & Stroke in Texas
 The Burden Report: Cardiovascular Disease & Stroke in Texas Texas Cardiovascular Health and Wellness Program www.dshs.state.tx.us/wellness Texas Council on Cardiovascular Disease and Stroke www.texascvdcouncil.org
Visualizing Health Care for Rural Veterans with GIS
 Visualizing Health Care for Rural Veterans with GIS Justin Ahern, GIS Analyst U.S. Department of Veterans Affairs, Office of Rural Health, GeoSpatial Outcomes Division Other authors: Cowper Ripley DC,
Heart Disease and Stroke in New Mexico. Facts and Figures: At-A-Glance
 Heart Disease and Stroke in New Mexico Facts and Figures: At-A-Glance December H e a r t D i s e a s e a n d S t r o k e Heart disease and stroke are the two most common conditions that fall under the
The Epidemiology of HIV/AIDS in Texas in Ages ( )
") The Epidemiology of HIV/AIDS in Texas in Ages 25-49 (1999-2010) Author: Jonathan Rodriguez Faculty Mentor: Joseph R. Oppong, Department of Geography, College of Arts and Sciences; Toulouse School of Graduate
The Epidemiology of HIV/AIDS in Texas in Ages 25-49 (1999-2010) Author: Jonathan Rodriguez Faculty Mentor: Joseph R. Oppong, Department of Geography, College of Arts and Sciences; Toulouse School of Graduate
New SASI Analysis: In the Deep South, Significant Percentages of People Most Impacted by HIV Live Outside Large Urban Areas
 New SASI Analysis: In the Deep South, Significant Percentages of People Most Impacted by HIV Live Outside Large s Demonstrating a Need for Increased Federal Resources December 2018 http://southernaidsstrategy.org
Definition of Health/Healthcare disparities. Health/Healthcare. Healthcare Disparities
 Healthcare Disparities Darrell M. Gray, II, MD, MPH Assistant Professor Deputy Director, Center for Cancer Health Equity OSU Comprehensive Cancer Center The James Cancer Hospital and Solove Research Institute
The Geography of Viral Hepatitis C in Texas,
 The Geography of Viral Hepatitis C in Texas, 1992 1999 Author: Mara Hedrich Faculty Mentor: Joseph Oppong, Department of Geography, College of Arts and Sciences & School of Public Health, UNT Health Sciences
Texas Department of State Health Services and the Michael & Susan Dell Center for Healthy Living for providing data used in this report
 Acknowledgements Authors: Eileen Nehme, PhD MPH Nagla Elerian, MS Jay Morrow, DVM MPH Dorothy Mandell, PhD Ella Puga, MPH Divya Patel, PhD MPH David Lakey, MD Additional thanks and acknowledgements to:
Running head: HELPING FEED THE HUNGRY 1
 Running head: HELPING FEED THE HUNGRY 1 Helping Feed the Hungry Student 114517 Tarleton State University HELPING FEED THE HUNGRY 2 Introduction Food insecurity is a multidimensional concept that has evolved
What Do We Know about the Current and Future Psychologist Workforce?
 What Do We Know about the Current and Future Psychologist Workforce? Karen Stamm, PhD Director, Center for Workforce Studies Virginia Behavioral Health Summit September 27, 2018 The opinions expressed
Detroit: The Current Status of the Asthma Burden
 Detroit: The Current Status of the Asthma Burden Peter DeGuire, Binxin Cao, Lauren Wisnieski, Doug Strane, Robert Wahl, Sarah Lyon Callo, Erika Garcia, Michigan Department of Health and Human Services
Community Health Status Assessment
 Community Health Status Assessment EXECUTIVE SUMMARY The Community Health Status Assessment (CHSA) is one of four assessments completed as part of the 2015-2016 Lane County Community Health Needs Assessment
THE STATE OF BLACKS IN NEW MEXICO: BLACK HEALTH DISPARITIES AND ITS EFFECTS ON HEALTH OUTCOMES IN NEW MEXICO AS REFLECTED BY THE DATA HUB
 Research Brief THE STATE OF BLACKS IN NEW MEXICO: BLACK HEALTH DISPARITIES AND ITS EFFECTS ON HEALTH OUTCOMES IN NEW MEXICO AS REFLECTED BY THE DATA HUB By Brooke Abrams, Dr. Gabriel Sanchez, PhD, and
JUSTUS WARREN TASK FORCE MEETING DECEMBER 05, 2012
 SAMUEL TCHWENKO, MD, MPH Epidemiologist, Heart Disease & Stroke Prevention Branch Chronic Disease & Injury Section; Division of Public Health NC Department of Health & Human Services JUSTUS WARREN TASK
The following three slides provide a brief overview of the demographics characteristics of residents of Alameda County. For additional demographic
 This slide set was produced by the Alameda County Public Health Department (ACPHD) Community Assessment, Planning, and Evaluation (CAPE) Unit. One way that we work to achieve the ACPHD mission is to monitor
Table of Contents. 2 P age. Susan G. Komen
 OREGON Table of Contents Table of Contents... 2 Introduction... 3 About... 3 Susan G. Komen Affiliate Network... 3 Purpose of the State Community Profile Report... 4 Quantitative Data: Measuring Breast
The North Carolina Health Data Explorer
 The North Carolina Health Data Explorer The Health Data Explorer provides access to health data for North Carolina counties in an interactive, user-friendly atlas of maps, tables, and charts. It allows
2017 State Of The County Health Report Jones County, NC
 217 State Of The County Health Report Jones County, NC Promoting sound health policies, preventing and controlling the spread of disease, and safeguarding the integrity of the environment for all citizens
Progress Tracker. Photo - https://www.healthypeople.gov/
 Progress Tracker Healthy People provides a framework for prevention for communities in the U.S. Healthy People 2020 is a comprehensive set of key disease prevention and health promotion objectives. The
GIS Master for All Page Health Organizations
 GIS Master for All Page Health Organizations 2008 ESRI Health GIS Conference Washington, D.C., September 28, 2008 Introductions Master Page Kristen Kurland Teaching Professor of Architecture and Public
Summit County Public Health
 Page 1 Death and Life Expectancy Summit County Public Health Population Health Vital Statistics Brief: VOLUME 1: DEATH AND LIFE EXPECTANCY Summit County Public Health Population Health Division 1867 W.
Health Disparities Research. Kyu Rhee, MD, MPP, FAAP, FACP Chief Public Health Officer Health Resources and Services Administration
 Health Disparities Research Kyu Rhee, MD, MPP, FAAP, FACP Chief Public Health Officer Health Resources and Services Administration Outline on Health Disparities Research What is a health disparity? (DETECT)
Geographic distribution of HPV Vaccination Coverage among Adolescents in North Dakota
 Geographic distribution of HPV Vaccination Coverage among Adolescents in North Dakota N O R T H D A K O T A I M M U N I Z A T I O N I N F O R M A T I O N S Y S T E M ( N D I I S ) A I R A, 2 0 1 8 D O
This slide set was produced by the Alameda County Public Health Department
 This slide set was produced by the Alameda County Public Health Department Community Assessment Planning an Evaluation (CAPE) Unit. One way that we work to achieve the ACPHD mission and vision is to monitor
Rockford Health Council
 2010 Healthy Community Study Rockford Area Early Learning Council Becky Cook Kendall April 12, 2011 Rockford Health Council Community-based healthy community collaborative Formed in 1982 as the Rockford
Challenges and Opportunities to Achieve Rural Health Equity and Well-Being. Michael Meit, MA, MPH Co-Director, NORC Walsh Center
 Challenges and Opportunities to Achieve Rural Health Equity and Well-Being Michael Meit, MA, MPH Co-Director, NORC Walsh Center June 13, 2017 1 Source: Singh and Siahpush, Widening Rural-Urban Disparities
Right Care Initiative
 Right Care Initiative Clinical Quality Improvement Leadership Collaborative Los Angeles CVD HOT SPOT: Heart Disease and Stroke Spreading Evidence-based Strategies to Reduce Premature Disability and Death
Diversity Data Snapshots March 2014 Edition
 Diversity Data Snapshots March 2014 Edition Diversity Policy and Programs CDC Health Disparities and Inequalities Report United States, 2013 CDC Health Disparities and Inequalities Report United States,
Obesity: Trends, Impact, Complexity
 Obesity: Trends, Impact, Complexity Ross A. Hammond, Ph.D. Director, Center on Social Dynamics & Policy Senior Fellow, Economic Studies Program The Brookings Institution Attorneys General Education Program
Coney Island. Neighborhood Health Profiles Keeping Brooklyn Healthy by Assessing Population Health and Driving Innovation
 Keeping Brooklyn Healthy by Assessing Population Health and Driving Innovation 11223, 11224, 11229, 11235 Neighborhood at a glance Population: 285,502 TBHC Service Areas: Outside the Service Area for The
An APA Report: Executive Summary of The Behavioral Health Care Needs of Rural Women
 1 Executive Summary Of The Behavioral Health Care Needs of Rural Women The Report Of The Rural Women s Work Group and the Committee on Rural Health Of the American Psychological Association Full Report
Rural residents lag in preventive services use; Lag increases with service complexity. Carolina. South. Rural Health Research Center
 Rural residents lag in preventive services use; Lag increases with service complexity South Carolina Rural Health Research Center At the Heart of Health Policy 2 Stoneridge Dr., Ste 4 Columbia, SC 292
Are You Ready to Sail. February 11, 2016
 Are You Ready to Sail your SHIP?! February 11, 2016 Acknowledgement and Disclaimer This webinar was supported by funds made available from the Centers for Disease Control and Prevention, Office for State,
Population Percent C.I * 6.3% ± * 20.7% ± % ± * 54.2% ± and older * 59.3% ± 2.9.
 Overview Why Is This Indicator Important? High cholesterol is one of the leading risk factor for heart disease and stroke, the1st and 3 rd leading causes of death in US. How Are We Doing? In 1, 32% Hennepin
Analyzing the opioid crisis in America
 Analyzing the opioid crisis in America Symbolize data and calculate with Arcade The current opioid epidemic killed more than 33,000 people in 2015 and is considered one of the worst drug crises in American
2017 USRDS ANNUAL DATA REPORT KIDNEY DISEASE IN THE UNITED STATES S611
 Healthy People 2020 In this chapter, we examine data for 11 Healthy People 2020 (HP2020) objectives 10 for CKD and one for diabetes spanning 20 total indicators for which the USRDS serves as the official
Quantitative Data: Measuring Breast Cancer Impact in Local Communities
 Quantitative Data: Measuring Breast Cancer Impact in Local Communities Quantitative Data Report Introduction The purpose of the quantitative data report for the Southwest Florida Affiliate of Susan G.
980 North Jefferson Street, Jacksonville, Florida T TDD Toll Free
 This document discusses the North Florida Transportation Planning Organization s approach to meeting the needs of persons with limited English Proficiency in executing the TPO s transportation planning
PHACS County Profile Report for Searcy County. Presented by: Arkansas Center for Health Disparities and Arkansas Prevention Research Center
 PHACS County Profile Report for Searcy County Presented by: Arkansas Center for Health Disparities and Arkansas Prevention Research Center Contents Introduction... Page 2 Demographics...Page 3 Social Environment
Differences that occur by gender, race or ethnicity, education or income, disability, geographic location, or sexual orientation. Healthy People 2010
 Differences that occur by gender, race or ethnicity, education or income, disability, geographic location, or sexual orientation. Healthy People 2010 Health Inequalities: Measureable differences in health
Maryland s Health Enterprise Zones Addressing Social Determinants of Health
 Maryland s Health Enterprise Zones Addressing Social Determinants of Health Michelle Spencer, MS Associate Director, Bloomberg American Health Initiative Associate Scientist, Health Policy and Management
ArcGIS for revealing space-time patterns of livestock diseases spread
 ArcGIS for revealing space-time patterns of livestock diseases spread Fedor Korennoy FEDERAL CENTER FOR ANIMAL HEALTH (FGBI ARRIAH ) VLADIMIR, RUSSIAN FEDERATION Federal Service for Veterinary and Phitosanitary
Northampton County State of the County Health Report (SOTCH)
") Northampton County 2017 State of the County Health Report (SOTCH) Northampton County Health Department 9495 NC Highway 305 P.O. Box 635 Jackson, NC 27845 (252)534-5841 Andy Smith, Health Director Virginia
Northampton County 2017 State of the County Health Report (SOTCH) Northampton County Health Department 9495 NC Highway 305 P.O. Box 635 Jackson, NC 27845 (252)534-5841 Andy Smith, Health Director Virginia
2014 Healthy Community Study Executive Summary
 2014 Healthy Community Study Executive Summary BACKGROUND The Rockford Health Council (RHC) exists to build and improve community health in the region. To address this mission, RHC conducts a Healthy Community
Tobacco use is Wisconsin s
 Focus on... Smoking Increasing tobacco taxes: An evidencebased measure to reduce tobacco use Marion Ceraso, MHS; David Ahrens, MS; Patrick Remington, MD Tobacco use is Wisconsin s single most important
Prepared by Southern Illinois University School of Medicine s Center for Clinical Research And Office of Community Health and Service
 Hospital Sisters Health System Community Health Needs Assessment (FY2015-FY2018) Quantitative and Secondary Data Analysis Report For St. Anthony s Hospital Effingham, Prepared by Southern University School
DISTRICT LETTERHEAD. REVISED TEMPLATE (Letter Sent on District s Letterhead) School Annual Education Report (AER) Cover Letter
 School Annual Education Report (AER) Cover Letter") DISTRICT LETTERHEAD REVISED 2017-18 TEMPLATE (Letter Sent on s Letterhead) School (AER) Cover Letter May 20, 2018 Dear Parents and Community Members: We are pleased to present you with the (AER) which
DISTRICT LETTERHEAD REVISED 2017-18 TEMPLATE (Letter Sent on s Letterhead) School (AER) Cover Letter May 20, 2018 Dear Parents and Community Members: We are pleased to present you with the (AER) which
Healthy People 2020: Building a Solid Data Foundation
 Healthy People 2020: Building a Solid Data Foundation Richard J. Klein, MPH National Center for Health Statistics Centers for Disease Control and Prevention NCHS Role in Healthy People Statistical advisor
Canarsie / Flatlands
 Keeping Brooklyn Healthy by Assessing Population Health and Driving Innovation 11234, 11236, 11239 Neighborhood at a glance Population: 195,027 TBHC Service Areas: Outside the Service Area for The Brooklyn