FUNCTIONAL ROLES OF MIDBRAIN DOPAMINE NEURONS IN ASSOCIATIVE LEARNING. Eric Daniel Hudgins. A Dissertation Submitted to the Graduate Faculty of
|
|
|
- Beatrix Barton
- 5 years ago
- Views:
Transcription
1 FUNCTIONAL ROLES OF MIDBRAIN DOPAMINE NEURONS IN ASSOCIATIVE LEARNING BY Eric Daniel Hudgins A Dissertation Submitted to the Graduate Faculty of WAKE FOREST UNIVERSITY GRADUATE SCHOOL OF ARTS AND SCIENCES in Partial Fulfillment of the Requirements for the Degree of DOCTOR OF PHILOSOPHY Neuroscience Program May, 2010 Winston Salem, North Carolina Approved By: Terrence Stanford, Ph.D., Advisor John McHaffie, Ph.D., Advisor Examining Committee: Sam Deadwyler, Ph.D., Chairman Pete Redgrave, Ph.D. Emilio Salinas, Ph.D.
2 ii ACKNOWLEDGEMENTS I would like to thank Terrence Stanford, John McHaffie, Emilio Salinas, and Peter Redgrave, a great team of advisors who provided much insight, encouragement, and support. I would also like to thank all of my friends and family for their constant patience, love, and support.
3 iii TABLE OF CONTENTS Page LIST OF TABLES AND FIGURES.. ABSTRACT. iv-viii ix-x CHAPTERS I. INTRODUCTION... 1 II. MIDBRAIN DOPAMINE NEURONS ENCODE SENSORY SALIENCE AND REWARD PREDICTION AT DISTINCT TEMPORAL LATENCIES 12 III. MIDBRAIN DOPAMINE NEURONS ENCODE BOTH SENSORY SALIENCE AND REWARD PREDICTION FOR STIMULI BIASED TOWARD PARVOCELLULAR PATHWAY DISCRIMINATION IV. DISCUSSION. REFERENCES FOR CHAPTERS I AND IV.. SCHOLASTIC VITA
4 iv TABLES 1. Midbrain dopamine neuron properties, Chapter II 2. Dopamine neuron discrimination latencies, Chapter II 3. Dopamine neuron response latencies, Chapter II 4. Midbrain dopamine neuron properties, Chapter III 5. Dopamine neuron discrimination latencies, Chapter III 6. Dopamine neuron response Latencies, Chapter III Page FIGURES 1. Conditioning shift of phasic dopamine response 2. Behavioral task, Chapter II 3. Dopamine neuron waveforms (n = 83) 4. Spontaneous firing frequency vs. Waveform width 5. Magnetic resonance imaging of implanted electrode 6. Anticipatory licking to conditioned stimuli in random locations 7. Anticipatory licking to conditioned stimuli in fixed locations 8. Example dopamine neuron response to unexpected reward 9. Example dopamine neuron response to visual stimuli 10. Hypothetical neural responses to randomly located stimuli 11. Population histogram for stimuli in random locations 12. Population for reward delivery of random location stimuli 13. Population histogram for stimuli in fixed locations
5 v 14. Population for reward delivery of fixed location stimuli 15. Short latency selectivity index for stimuli in random locations 16. Long latency selectivity index for stimuli in random locations 17. Short latency selectivity index for stimuli in fixed locations 18. Long latency selectivity index for stimuli in fixed locations 19. Response vs. reward probability for stimuli in random locations 20. Response vs. reward probability for stimuli in fixed locations 21. Response and discrimination latencies 22. Receiver operating characteristic vs. time, random locations 23. Receiver operating characteristic vs. time, fixed locations 24. Anticipatory activity preceding salient events 25. Population histogram and spike raster with robust neurons 26. Population histogram and spike raster without robust neurons 27. Population for random location stimuli without robust neurons 28. Population for fixed location stimuli without robust neurons 29. Short latency selectivity index for stimuli in random locations 30. Long latency selectivity index for stimuli in random locations 31. Short latency selectivity index for stimuli in fixed locations 32. Long latency selectivity index for stimuli in fixed locations Possible substrate for early and late components of visuallyevoked response of midbrain dopamine neurons 34. Smoothing eliminates ability to discern biphasic response 35. Population histogram for stimuli in random locations (monkey L)
6 vi 36. Population for reward delivery of random location stimuli (L) 37. Population histogram for stimuli in fixed locations (monkey L) 38. Population for reward delivery of fixed location stimuli (L) 39. Population histogram for stimuli in random locations (monkey S) 40. Population for reward delivery of random location stimuli (S) 41. Population histogram for stimuli in fixed locations (monkey S) 42. Population for reward delivery of fixed location stimuli (S) 43. Behavioral task with high spatial frequency (HSF) stimuli 44. Dopamine neuron waveforms (n = 56) 45. Spontaneous firing frequency vs. Waveform width 46. Magnetic resonance imaging of implanted electrode 47. Anticipatory licking to conditioned stimuli in central locations 48. Anticipatory licking to HSF stimuli in fixed peripheral locations 49. Anticipatory licking to HSF stimuli in random peripheral locations 50. Example dopamine neuron response to unexpected reward 51. Example neuron response to stimuli in central locations (#49) 52. Example biphasic response to stimuli in central locations (#40) 53. Example neuron response to stimuli in fixed peripheral locations 54. Example neuron response to stimuli in fixed peripheral locations 55. Example neuron response to stimuli in random locations 56. Population histogram for HSF stimuli in central locations 57. Population for reward delivery of central location stimuli 58. Response vs. reward probability for central location stimuli
7 vii 59. Short latency selectivity index for stimuli in central locations 60. Long latency selectivity index for stimuli in central locations 61. Population histogram for stimuli in fixed peripheral locations 62. Population for stimuli in fixed peripheral locations, expanded 63. Population for reward delivery of fixed peripheral location stimuli 64. Population histogram for stimuli in random peripheral locations 65. Population for stimuli in random peripheral locations, expanded 66. Population for reward delivery of random location stimuli 67. Population histogram for stimuli in fixed locations (monkey L) 68. Population histogram for stimuli in random locations (monkey L) 69. Population histogram for stimuli in fixed locations (monkey S) 70. Population histogram for stimuli in random locations (monkey S) 71. Location sorted anticipatory licking, random location stimuli (L) 72. Probability sorted anticipatory licking, random location stimuli (L) 73. Population for early training fixed location stimuli (L) 74. Probability sorted population for random location stimuli (L) 75. Late vs. early training anticipatory licking (monkey L) 76. Response and discrimination latencies 77. Receiver operating characteristic vs. time, central locations % vs. 10% stimuli Receiver operating characteristic vs. time, all conditions and stimuli % vs. 10% stimuli Receiver operating characteristic vs. time, all conditions and stimuli 196
8 viii % vs. 50% stimuli Receiver operating characteristic vs. time, all conditions and stimuli 81. Dopamine neuron robustly responds to novel stimuli 82. Dopamine neuron response to trained stimuli
9 ix ABSTRACT These experiments examine the functional properties of midbrain dopamine neurons during conditioned learning tasks designed to test their responses to sensory events. Dopamine neurons are predominately located within two regions of the midbrain, the substantia nigra pars compacta and the ventral tegmental area. This study aims to examine the function of dopamine neurons located in the substantia nigra pars compacta, the region most densely packed with dopamine neurons and known to receive short-latency visual information from the superior colliculus. Dopamine signaling is thought to play a critical role in reward-related learning, and the predominant hypothesis proposes that dopamine neurons signal the expected reward values of sensory stimuli in the form of a short-latency phasic burst. Thus, the reward prediction hypothesis assumes that information relevant to determining stimulus identity informs dopamine neuron firing. Recently, this critical assumption has been questioned and given rise to an alternative hypothetical framework proposing that dopamine activity represents a more generic signal of stimulus salience. Proponents of this competing hypothesis note that the requisite feature-based discrimination would not be possible in a period short enough to inform the dopamine response. Instead, the "saliency hypothesis" proposes that short-latency dopamine activity reflects the relative salience of stimuli (independent of their reward value) and that this signal likely derives from the superior colliculus (SC), a subcortical structure lacking the capacity for fine feature discrimination but specializes in
10 x detecting and locating salient sensory events. Support for this latter view comes from recent anatomical evidence for a projection from the SC to substantia nigra pars compacta and physiological findings showing that SC activity can drive phasic dopamine activity. This dissertation provides a critical test of these competing hypotheses through in vivo recording from dopamine neurons in the context of behavioral tasks capable of dissociating activity relating to stimulus salience from that which predicts reward value. Results from these studies reveal a biphasic neural response and suggest that dopamine neurons both encode the occurrence of salient events and predict reward at distinct temporal latencies.
11 1 CHAPTER I INTRODUCTION
12 2 Associative Learning and Phasic Dopamine Activity Since Pavlov s early twentieth century demonstration that dogs could be trained to salivate at the sound of a ringing bell, the idea of classical conditioning was that neutral sensory stimuli could elicit involuntary, gustatory reactions through repetitive associations with food (Pavlov, 1927). Edward Thorndike carried the idea of associative learning further by illustrating the reinforcement of voluntary (instrumental) responses in his experiments with cats locked in puzzle boxes requiring a lever press to escape the box and retrieve a food reward, later to be termed operant (instrumental) conditioning. Thorndike noticed the cats would initially press the lever through trial and error, but as training advanced, lever pressing frequency increased and reaction time decreased as animals associated that action with an outcome that had the pleasurable result of allowing the animal to escape the box and eat the reward (Thorndike, 1911). The search for a neural correlate for this kind of associative learning has been the focus of much investigative effort over the past two decades. Electrophysiological evidence indicates that midbrain dopamine (DA) neurons respond with a short-latency, phasic response to critical sensory events in both classical and operant conditioning paradigms in animals (Schultz, 2006). Studies of DA cells in both the SNc and the ventral tegmental area (VTA) suggest that the DA response could serve as a signal of reward prediction needed to reinforce behaviors that maximize the acquisition of future reward (Mirenowicz & Schultz, 1994; Schultz, 1998; Schultz, 2006). This interpretation of the DA response has been widely accepted and inspired numerous models of DA-based associative
13 3 learning (Suri, 2002; Montague et al., 2004; Frank, 2005). However, this interpretation has very recently been challenged on both logical and empirical grounds. Redgrave and colleagues have argued that the phasic DA response is more likely a signal of biological salience, a signal suitable for the discovery of actions that are causal to the occurrence of rewarding events (i.e., agency hypothesis) (Redgrave et al., 1999, Redgrave & Gurney, 2006). In developing the argument, Redgrave et al. have proposed that the short-latency DA response would likely fail to show reward predicting properties in experimental settings that more closely approximate the unpredictable character of the natural environment. The currently proposed experiments are designed to explicitly test the validity of this challenge to the reward prediction hypothesis. In doing so, the proposed study will provide a critical test of the reward prediction hypothesis itself by evaluating the circumstances under which the short-latency DA burst can or cannot predict the reward values of sensory events. Disorders of Altered Dopamine and Impact on Associative Learning The many pathologies attributed to altered levels of DA - Parkinson s disease (PD), schizophrenia, attention deficit hyperactivity disorder (ADHD), and cocaine abuse - underscore the importance of DA to both motor and cognitive processes (Barzilai & Melamed, 2003; Iversen & Iversen, 2007; Peoples et al., 2004; Solanto, 2002). Understanding the role of phasic DA activity in the normal state, as this study aims to do, may shed light on the interrelated treatment issues of different DA disorders. Often, the treatment of DA disorders requires
14 4 DA agonists (Parkinson s), antagonists (schizophrenia), or re-uptake inhibitors (ADHD) to modulate DA levels in an attempt to regain normal function (Howland & Mycek, 2006). Steady-state treatment assists only those functions requiring tonic release of DA and neglects the cognitive functions required for associative learning and salience detection thought to be mediated by phasic DA activity. Replacing lost DA in PD patients with steady-level DA agonists improves motor symptoms that require tonic DA but impairment of associative learning and other cognitive processes thought to rely on phasic DA signaling persists in PD patients both on and off medication (Frank et al., 2004). The assignment of salience, or event importance, is abnormal in schizophrenic patients (Jensen et al., 2007). If phasic DA signaling is critical for assigning salience, constant-level DA antagonism may not be the optimal treatment strategy. However, because the role of phasic DA is strongly associated with reward prediction, few studies have considered its role in schizophrenia. The studies contained herein could lend indirect support to its alternative role in assigning salience, in doing so, point toward the need to examine a putative role for altered phasic DA signaling in schizophrenia. Attention deficit hyperactivity disorder (ADHD) is characterized by impulsive behavior, inattention, and increased motor activity, collectively thought to be caused by decreased amounts of DA (Solanto, 2002). ADHD patients are easily distracted making it difficult to complete tasks and severely impairing school and workplace performance. While the precise pathophysiology is unknown, current treatments employ DA synaptic modulators, an indication that
15 5 DA plays a central role in the disorder (Howland & Mycek, 2006; Iversen & Iversen, 2007). The direct relationship of this disorder to associative learning could indicate a possible phasic DA deficiency in ADHD patients. A more accurate understanding of phasic DA s role in associative learning will be important for understanding the disease and its treatment. With their ability to rapidly increase the amounts of DA within synapses, cocaine and methamphetamine are highly addictive drugs (Howland & Mycek, 2006). The neural mechanisms underlying addiction are believed to rely on DA release in the nucleus accumbens. Phasic DA release in the nucleus accumbens is associated with cocaine administration, is suspected to drive drug-seeking behavior, and enhances reward-related learning (Peoples et al., 2004). Understanding phasic DA s normal role could shed light how DA s influence is enhanced by cocaine and amphetamine abuse. Reward Prediction and Prediction Error Rescorla and Wagner first described a model for conditioned learning that predicts associative strength and established a foundation for temporal difference (TD) learning theory (Rescorla & Wagner, 1972). An index of surprise in the model relates how a neutral event (e.g. light onset) paired with an inherently rewarding substance (e.g. food, juice) is initially surprising but becomes expected with repetition. For example, one would be pleasantly surprised if upon entering the local shopping mall he/she was handed a $100 bill. If this scenario were repeated on each of the next several trips to the mall, the level of surprise would


 with hypothetical timing of saccadic eye movement (red) and cortical feature analysis (blue)")
16 6 wane as the association of two events was strengthened. The initial surprise is termed a reward prediction error because what occurred did not match expectation. For over a decade, electrophysiological data from awakebehaving primates has shown that midbrain DA cells respond with short latency to unexpected reward (Schultz et al., 1993 & 1997). With training, the onset of the DA response is observed to shift from shortly after reward administration, to an earlier point coinciding with the onset of a rewardassociated conditioned stimulus (CS+; Figure 1A-C). This finding led Schultz and colleagues to propose that the DA signal encodes a prediction of reward value for conditioned stimuli (Mirenowicz Figure 1. The conditioning shift. Phasic DA activity to CS+ onset (B & C) from unexpected reward delivery (A) as the stimulus/reward association is strengthened. Comparing the relative time of the phasic DA response to CS+ (black) with hypothetical timing of saccadic eye movement (red) and cortical feature analysis (blue) demonstrates that the DA activity occurs before sensory events necessary to predict reward (D). and Schultz et al., 1994; Schultz et al., 1997; Hollerman & Schultz, 1998) and based their theory on the temporal difference model which uses a signal of reward prediction error to associate
17 7 stimuli with rewarding outcomes (Suri & Schultz, 1999; Montague et al., 1996, 2004). During the initial phase of a novel associative learning session, the DA response occurs after delivery of an unexpected reward and corresponds to the reward prediction error (Figure 1A). As the stimulus/reward association is learned, the DA response shifts to encode the expected reward value for the CS+ (Figure 1C). As originally described, this model of phasic DA function relies on cortical feature analysis to update the reward prediction signal as the stimulus/reward association develops, as discussed next. An Alternative Hypothesis for DA Signaling The hypothesis that phasic DA activity corresponds to reward prediction requires that DA neurons have access to the results of the cortical feature analysis necessary to identify stimuli. As discussed by Redgrave and colleagues (Redgrave & Gurney, 2006; Redgrave et al., 2007), evidence for cortical input to SNc neurons is scant (Bolam, et al 2000), and the latency of the phasic dopamine signal ( ms) is shorter than expected of one that is informed by the results of cortical feature analysis. Depending on the complexity of the visual discrimination and the likely requirement for saccadic eye movements, the necessary feature analysis could require at minimum 100 ms (Rousselet et al., 2004) and up to 350 ms or more (assuming typical saccade latencies of ms; see Fig. 1D). Being that this period at best overlaps and at worst follows the DA response, the DA response would seem to occur before the necessary feature-specific information could be conveyed to DA neurons. Largely based on
18 8 this reasoning, Redgrave et al. propose a more general role for the DA response in associative learning. Instead of reward value prediction, the signal is proposed to encode the salience (determined by virtue of novelty or association with reward) of objects within the visual field (Redgrave & Gurney, 2006). Rather than extrastriate cortex, Redgrave and colleagues argue on the basis of anatomical and physiological evidence that the primary visual input to DA neurons comes from the superior colliculus (SC) and therefore, the type of information available to DA neurons is quite distinct from that required for signaling reward prediction but quite consistent with a signal of visual salience. Neurons in the SC are arranged topographically to form maps of visual, auditory, and somatosensory space and these sensory maps in turn communicate with closely aligned SC motor maps to drive gaze shifts for the purpose of putting the image of a peripheral stimulus on the fovea for high-fidelity viewing (see Sparks, 1986; Stein & Meredith, 1993 for reviews). Visual responses in the SC have both short latency ( ms) and a strong transient component making them exquisitely sensitive to changes in luminance and/or movement in the periphery. However, SC neurons are relatively insensitive to static features such as wavelength, high spatial frequency patterns, and orientation owing to the fact that they receive little or no input from the parvocellular visual system (Sparks, 1986; Stein & Meredith, 1993; Sumner et al., 2002; Vuilleumier et al., 2003). Thus, SC neurons are optimized for detecting, locating, and driving orienting movements to the occurrences of salient stimuli but on their own have little or no capacity for detailed feature analysis.
19 9 The timing of SC visual responses is consistent with a putative role as the drive for the short-latency DA response, a role for which there is now direct anatomical and physiological support. The use of anterograde tracers has demonstrated direct projections from the SC to SNc in rats, cats, and, monkeys, with filled terminals found in association with synaptic terminals on putative DA cells in both the SNc and in the VTA (Comoli et al., 2003; McHaffie et al., 2006; May et al., 2009). Functional connectivity from the SC to SNc has also been established in rats in which it has been shown that phasic DA activity is dependent on input from the SC. In rats, urethane anesthesia eliminates responses to light flashes in visual cortex, the SC and DA neurons. Local injection of the GABA antagonist bicuculline can reinstate the visual responsiveness of either the visual cortex or the SC, but it is only reactivation of the SC (not cortex) that restores the phasic DA response thus indicating that the SC is both necessary and sufficient (i.e., cortex not reactivated) for the visuallyevoked phasic DA response (Coizet et al., 2003; Dommett et al, 2005). Also significant from these anesthetized rat studies is the fact that the light flash evoking the DA response has no association with reward. This along with other studies showing that non-reward related salient events (Horvitz et al., 1997; Horvitz, 2000; Ljungberg et al., 1992) and aversive stimuli can trigger phasic DA responses (Coizet et al., 2006; Brischoux et al., 2009; Matsumoto and Hikosaka, 2009) precludes reward-prediction error as the only interpretation of phasic DA output.
20 10 Reconciling Disparate Accounts of Dopamine Signaling The interpretation of DA function proposed by Redgrave and colleagues specifies that the short-latency phasic DA response is blind to the identity of the visual objects upon which they are presumed to confer reward value. Yet, numerous previous studies have shown that the magnitude of this response adapts during the course of associative learning such that it is correlated with the reward probability of the stimulus to which it responds (Fiorillo et al., 2003; Tobler et al., 2005). How then can these alternative interpretations be reconciled? Redgrave and colleagues note that in virtually all relevant nonhuman primate studies, reward associated stimuli were displayed in stereotyped locations. Specifically, monkeys were trained to expect specific stimuli (associated with different reward values) in specific spatial locations thus raising the possibility that the relevant stimulus discriminations (and associated DA response differences) were based not on discerning stimulus identity but instead on a rapid determination of stimulus location. Such discrimination might be accomplished very rapidly by the SC by simply sensitizing specific regions of the sensorimotor map over the course of many trials of reward/location association. Indeed, it is well known that SC sensory responses are enhanced by spatial attention (salient, meaningful stimuli) and habituate when stimuli are known to be irrelevant to behavior (Ikeda & Hikosaka, 2003). The alternative interpretation proposed by Redgrave and colleagues yields some critical but as yet untested predictions about the circumstances under
21 11 which DA neurons would or would not reflect the reward probability of stimulus. Specifically, it is proposed that 1) DA neurons would fail to predict the reward probabilities of featured stimuli were they to appear at unpredictable locations (thus requiring reward value to be judged on the basis of visual feature analysis and not simply location) and 2) DA neurons would fail to predict the reward probabilities of stimuli that are defined by features to which the SC are particularly insensitive. The goal of the experiments detailed in this thesis is to explicitly test these predictions in order to provide a critical test of both the reward prediction hypothesis of DA function and the stimulus salience-based alternative proposed by Redgrave and colleagues.
22 12 CHAPTER II MIDBRAIN DOPAMINE NEURONS ENCODE SALIENCY AND REWARD PREDICTION AT TEMPORALLY DISTINCT LATENCIES
23 13 ABSTRACT Midbrain dopamine neurons are thought to encode reward predictions through a short-latency phasic burst of activity to conditioned stimuli. Recently, however, a competing hypothesis suggests dopamine neurons lack the detailed information required at the time of the dopamine response and thus only report saliency of stimuli. To reconcile the competing hypotheses, we studied midbrain dopamine neurons of monkeys trained to associate images with different probabilities of reward, with the images appearing in random locations. Our results suggest dopamine neurons encode both saliency and reward prediction, but at distinct temporal latencies of the dopamine response to visual stimuli. Thus, the activity of dopamine neurons may serve to orient the subject toward salient images and to modify behavior in anticipation of future reward once detailed information about the stimuli is acquired.
24 14 INTRODUCTION Studies of dopamine neurons in both the substantia nigra pars compacta (SNc) and the ventral tegmental area (VTA) suggest that the dopamine response could serve as a signal of reward prediction needed to reinforce behaviors that maximize the acquisition of future reward (Mirenowicz & Schultz, 1994; Schultz, 1998; Schultz, 2006). Although this interpretation is widely accepted and has inspired numerous models of dopamine-based associative learning (Suri, 2002; Montague et al., 2004; Frank, 2005), it requires that dopamine neurons have access to the results of the cortical feature analysis necessary to identify visual stimuli. Evidence for direct cortical input to SNc neurons is scant (Bolam, et al 2000), and the latency of the phasic dopamine signal ( ms) is shorter than expected of one that is informed by the results of cortical feature analysis (Redgrave & Gurney, 2006; Redgrave et al., 2007). Depending on the complexity of the visual discrimination and the likely requirement for saccadic eye movements, the necessary feature analysis could require at minimum 100 ms (Rousselet et al., 2004) and up to 350 ms or more (assuming typical saccade latencies of ms). Being that this period at best overlaps and at worst follows the dopamine response, the dopamine response would seem to occur before the necessary feature-specific information could be conveyed to dopamine neurons. Largely based on this reasoning, Redgrave et al. propose a more general role for the dopamine response in associative learning. Instead of reward value prediction, the signal is proposed to encode the salience of objects
25 15 within the visual field (Redgrave & Gurney, 2006). The detection of salient events is independent of context, and serves to direct attention toward those events to determine their identity and subsequently choose the appropriate response (approach or retreat). Relevant nonhuman primate studies that conclude dopamine neurons predict rewards display reward associated stimuli in fixed and stereotyped locations (e.g. Fiorillo et al., 2003; Tobler et al., 2005). Monkeys were trained to expect specific stimuli associated with different reward values in specific spatial locations, thus raising the possibility that the relevant stimulus discriminations, and associated dopamine response differences, were based not on discerning stimulus identity but instead on a rapid determination of stimulus location. Such discrimination might be accomplished very rapidly by the superior colliculus (SC) by sensitizing specific regions of the SC sensorimotor map over the course of many trials of reward-location associations. Indeed, it is well known that SC sensory responses are enhanced by spatial attention (salient, meaningful stimuli) and habituate when stimuli are known to be irrelevant to behavior (Ikeda & Hikosaka, 2003). Furthermore, the timing of SC visual responses (50-100ms) is consistent with a putative role as the drive for the short-latency dopamine response, a role for which there is now direct anatomical (Comoli et al., 2003; McHaffie et al., 2006; May et al., 2009) and physiological support (Coizet et al., 2003; Dommett et al, 2005). However, SC neurons are relatively insensitive to static features such as wavelength, high spatial frequency patterns, and orientation owing to the fact that they receive little or no input from the
26 16 parvocellular visual system (Sparks, 1986; Stein & Meredith, 1993; Sumner et al., 2002; Vuilleumier et al., 2003). Thus, SC neurons are optimized for detecting, locating, and driving orienting movements to the occurrences of salient stimuli, but on their own have little or no capacity for detailed feature analysis. The alternative interpretation proposed by Redgrave and colleagues yields some critical but as yet untested predictions about the circumstances under which dopamine neurons would reflect the reward probability of stimuli. The current study is designed to test whether dopamine neurons are capable of predicting the reward probabilities of stimuli presented at unpredictable locations, thus requiring reward value to be judged on the basis of visual feature analysis and not simply location. MATERIALS AND METHODS Two adult, male rhesus monkeys (Macaca mulatta) were prepared for chronic single-unit recording. Monkeys on inhalant anesthesia were fitted with titanium head-posts and plastic recording cylinders following appropriate sterile surgery techniques. A stereotaxic apparatus was used, coupled with MRI guidance, to position the recording cylinder over the SNc. All surgical and experimental procedures were approved by the Wake Forest University School of Medicine Institutional Animal Care and Use Committee (IACUC) and are consistent with the National Institutes of Health (NIH) guidelines for the care and
27 17 use of laboratory animals. The monkeys were housed and maintained in an Association for Assessment and Accreditation of Laboratory Animal Care (AAALAC) accredited facility managed by the Animal Resources Program of the Wake Forest University School of Medicine. Throughout the duration of the experimental sessions, water intake and body weights were monitored to ensure adequate hydration. Behavioral Task The task, shown in Figure 1, was designed to control eye position while visual stimuli are presented at peripheral locations. The monkeys were seated with the head fixed in the straight-ahead position and required to fixate gaze on a central fixation point. The onset of a trial was signaled by a warning buzzer followed by the onset of the fixation stimulus (Panels 1 & 2). The monkeys were required to maintain fixation for as long as it was present (i.e., the duration of the trial). On any given trial, one of three images, each associated with a different reward probability, were randomly selected for display (Panel 4) at an eccentric position of 1 degree relative to fixation for 2 seconds. For example, in this depiction, the top image indicates that there was a 90% probability of future reward (p = 0.9), the bottom image, 50% probability of reward (p = 0.5), and the middle image, 10% probability of reward (p = 0.1). Five hundred milliseconds (500ms, Panel 5) after the stimulus was presented, a liquid reward was delivered according to the stimulus probability assignments in that particular experiment (Panel 6). To prevent possible contamination of the reward-related activity by
28 18 eye movements, the monkeys were required to maintain fixation for an additional one second (Panel 7) after the stimulus-associated reward delivery to receive an additional reward for completing the trial (Panel 8). To ensure that neural responses were based on learned reward-contingencies and not unique physical properties of the images, different reward-associations for the images were used for each monkey. The task was explicitly designed to permit quantitative evaluation of dopamine activity following both the visual stimulus (Panel 4) and the stimulusassociated reward delivery (Panel 6). Thus, the 500 millisecond period of separation between stimulus presentation and reward delivery and the additional requirement for one second of fixation after stimulus-associated reward delivery precludes the possibility of response contamination by providing adequate temporal separation between successive events. In separate blocks of 24 trials each, the experimental sequence was performed with the reward-associated stimuli appearing either in predictable locations or in unpredictable locations. Blocks were interleaved throughout the experimental session so that the monkeys were not provided instructional cues as to the nature of location information within the current block. Stimuli appeared at a single eccentricity, but at directions separated by 45 degrees from fixation. Thus, for example, in the fixed location condition, the red square, green square, and gray square could appear at 0, 45, and -45 (i.e. 315) degrees, respectively. The presentation of stimuli was selected pseudo-randomly to ensure accurate reward-probability associations. Eight trials were assigned to each stimulus with
29 19 7 trials rewarded and 1 trial unrewarded for the 90% stimulus, 4 rewarded and 4 unrewarded for the 50% stimulus, and 7 unrewarded and 1 rewarded trial for the 10% stimulus. In the random location conditions, stimuli occupied the same 3 directions, but the stimuli were assigned to these 3 locations randomly. Electrophysiological Recording At the beginning of each experimental session, the recording chamber was opened, and the electrode positioned using an X-Y translation stage. Structural magnetic resonance imaging (MRI) scans of the monkeys guided placement of the electrode within the cylinder as well as provided estimates of appropriate electrode depth. Once positioned at an X-Y coordinate, the dura was pierced with a 21 gauge hypodermic needle, and an epoxylite-coated tungsten microelectrode (FHC, impedance range ) was advanced through the needle and down to the SNc using a hydraulic microdrive. Amplified and filtered (200 Hz to 3 khz) neural activity was monitored using an oscilloscope and an audio monitor. Estimates of electrode location were determined by listening for phasic dopamine activity related to unexpected delivery of liquid reward and characteristics of putative dopaminergic waveforms (long duration ms and low spontaneous firing frequency spikes/second; Grace & Bunney, 1983; Romo & Schultz, 1990).
30 20 Behavioral Measurements Eye movements were sampled at 240Hz using an infrared-based camera tracking system (ISCAN), and eye tracking software was employed to monitor eye position during experimental sessions. Subjects were required to fix their gaze on a red fixation point presented at the center of the monitor and maintain fixation throughout each trial. If the subjects diverted their gaze, the trial was aborted and restarted following a variable time delay. Licking behavior was measured by a custom designed system that aligns an infrared beam between the monkey s mouth and reward delivery spout. The infrared beam was aimed at a detector that was sampled every 2ms (500Hz), and each beam interruption recorded to evaluate licking quantity (see Figures 5 and 6). Data Acquisition and Analysis A mini-tower computer equipped with National Instruments data acquisition cards (NIDAQ) was used to record analog inputs corresponding to eye position and licking behavior. Single neuron action potentials were isolated with a time/amplitude window discriminator (FHC Inc., Bowdoin, ME), and spike times were stored with a resolution of 10 μs. Stimulus display was controlled by a custom program specifically designed to display behavioral paradigms while simultaneously recording behavioral and neural activity. In this manner, neural activity was synchronized with behavior and the visual task. Custom Matlab scripts and functions (The MathWorks, Inc.) were used for off-line analysis of neural and behavioral data. Analysis of neuronal data was performed at two time
31 21 points reflective of the biphasic response observed with interspike interval (ISI) peri-stimulus time histograms (PSTH). Neuronal response latencies to stimuli were verified using a geometric method applied to cumulative sum (Qsum) of spikes curves with a correction for baseline firing rate (Rowland et al., 2007). For detailed analysis, the short-latency component of the response was identified as being ms after the onset of stimuli while the long-latency component occurred at ms. Receiver operating characteristics (ROC) were then used to determine the discrimination latency, i.e. the time at which the neural responses to different stimuli (e.g. 90% vs. 10%) differed significantly as described previously by Wyder et al., Briefly, ROC analysis determined the probability the instantaneous firing frequency in response to the 90% stimulus was greater than the response to the 10% stimulus by calculating a discrimination index (DI) at 5ms intervals between conditions. Analogous to the area under the ROC curve (AUC), the DI is then plotted as a function of time. For example, AUC values near 1 would indicate near perfect discrimination at the plotted time based on firing rate for the response to the 90% stimulus verses the 10% stimulus, while values near 0.5 indicate no discrimination between neural responses for the stimuli. The discrimination time is the time at which the neural response is significantly different (p<0.01) for the stimuli than would be expected by chance as estimated by a permutation test of 5000 random repetitions. A selectivity index was calculated for individual neurons for the biphasic neural response to stimuli located in fixed and random locations to compare the
32 22 early and late latency components of the response. The index took the difference of the neuronal response to 90% and 10% stimuli divided by the sum (rate_90%-rate_10%/rate_90%+rate_10%), and the result indicated the difference in neuronal responses to the stimuli. Selectivity index values closer to 1 indicate greater response to the 90% stimulus, and values closer to -1 indicate a greater response to the 10% stimulus. Different time windows were used to compare the responses of individual neurons at the early (50-110ms) and late ( ms) latencies of the biphasic dopamine response. RESULTS We recorded from 88 neurons (44 neurons monkey L; 44 neurons monkey S) that exhibited typical electrophysiological signatures of dopamine neurons. All neurons included for analysis displayed characteristics of midbrain dopamine neurons including action potentials with wide waveforms and low spontaneous firing rates, and responded with phasic bursts to delivery of unexpected rewards (Table 1). Figure 2 displays the waveforms averaged from individual action potentials of neurons for which we have stored waveform data (n=83). All neurons included for analysis exhibited a similar waveform. Figure 3 plots waveform widths against spontaneous firing frequency for all neurons. Accurate identification of dopamine neurons is critical for in vivo electrophysiology studies investigating the activity of dopamine neurons in real-
33 23 time. While the electrophysiological characteristics of dopamine neurons used to classify neurons in real-time (long action potential waveforms, low spontaneous firing frequency, and phasic activity to unexpected reward) are widely accepted, additional structural studies are important to confirm that the location from which dopamine neurons are recorded corresponds with substantia nigra pars compacta. We used magnetic resonance imaging (MRI) while monkey L had an electrode implanted at a location 7 mm dorsal to the site of typical recordings from both monkeys. The MR image, located on the right of figure 4 shows a shadow of the electrode located just dorsal to the substantia nigra pars compacta as compared to a rhesus macaque histology slide on the left. The red star on the MR image marks the typical recording depth of putative dopamine neurons, suggesting that the region from which we recorded dopamine neurons was located within the substantia nigra. Interpretation of the single neuron data requires a quantifiable behavioral measure to indicate that the monkey has identified the stimulus and its reward value. To do so, anticipatory licking of the reward delivery spout was quantified by measuring the duration of licking from the time of image onset up to the time point of possible reward. Figure 5 illustrates the anticipatory licking results for both monkeys when images are displayed in random locations (Monkey L, solid blue; Monkey S, dashed red) and plots the number of licks as a function of the reward probability associated with 3 different stimuli (p reward = 0.1 [10%]; p reward = 0.5 [50%]; p reward = 0.9 [90%]). Figure 6 shows trials with images placed in random locations. Note that licking number increases in direct proportion to the
34 24 probability of reward delivery in both conditions and provides a behavioral verification that the monkey is able to predict reward outcome upon stimulus presentation. Figure 7 depicts the activity of a representative dopamine neuron. Spike rasters of individual trials (below) and a spike density function of all trials (above) are aligned on the time of unexpected reward delivery. This neuron demonstrated characteristics typical of dopamine neurons: low spontaneous activity, strong phasic activity to unexpected reward, and a protracted waveform time course ( ms). Figure 8 plots the responses of the same neuron aligned to visual stimulus onset (random and fixed location trials are grouped together) and associated with reward probabilities of 0.1 (top panel), 0.5 (middle panel), and 0.9 (bottom panel). As is the hallmark for putative reward predicting neurons, activity increased monotonically with increasing reward probability. The reward prediction hypothesis predicts that in both control (predictable locations) and test (unpredictable locations) conditions, the magnitude of the phasic dopamine response will be correlated with the monkey s expectation of reward based on feature analysis of the stimuli. Random locations may lengthen the time required for discrimination of stimuli, in which case dopamine cells will respond at longer latencies (arrows, top right panels, Figure 9). In contrast, the hypothesis that the dopamine response represents location-based salience predicts that this correlation will only be observed when stimulus location is fixed, eliminating the ability to predict reward based on location. With images presented in random locations, the relationship between dopamine response
35 25 magnitude and reward expectation would be eliminated, with response magnitudes and timing indistinguishable across different stimuli (bottom right panels, Figure 9). The results of this study (Figure 10), however, suggest that a biphasic response is elicited by the dopamine neurons when stimulus identity is the reliable predictive cue, with the short-latency response not discriminating between the stimuli, and a late-latency component that appears to predict reward through response magnitude. Figure 10 averages the activity of multiple (n=84) dopamine neurons recorded in the random location task and shows density functions for each of the 3 reward probabilities (green: 0.1; magenta: 0.5; blue: 0.9) with activity aligned on stimulus onset (Figure 10). Figure 11 averages the activity of 84 neurons to reward delivery. These data replicate the main findings of earlier studies by showing that the dopamine response to stimulus onset increases as a function of increasing reward probability (reward prediction) whereas responses to reward delivery increase as a function of decreasing reward probability (unexpected reward prediction error, Hollerman & Schultz, 1998). Note however that the response to stimulus onset includes both a short-latency phasic component and a longer-latency sustained component. The magnitudes of the short-latency component do not correlate with reward probability, in contrast to the late-latency component. A similar response profile is exhibited for neuronal responses to images displayed in fixed locations (Figures 12 and 13). It is likely that the monkey and the dopamine neurons preferentially used stimulus identity to signal reward probability, since it was the most reliable association with reward.
36 26 Consequently, there is no difference in response to images placed in fixed locations given the weaker association between location and reward. To quantify differences among individual neurons, a selectivity index was used to evaluate which neurons encoded saliency information at short-latency (50-110ms, Figure 14) and reward prediction in the later-latency time window ( ms, (Figure 15). The most distinct differences were seen for responses to the 90% stimulus at late-latency ( ms), with the majority of neurons preferentially firing for the 90% stimulus as compared to the 10% stimulus in both random (Figure 14, Figure 15) and fixed (Figure 16, Figure 17) locations. To further contrast short and long-latency biphasic activity, Figures 18 and 19 plot the mean firing rates (±SEM) for responses to CS images displayed in random and fixed locations, respectively, and contrast the responses at short-latency (red, ms), long-latency (solid blue, ms), and reward delivery (dashed blue, ms). To determine the discrimination latencies of the dopamine neurons, receiver operating characteristic curves (ROC) identified that a significant discrimination (p < 0.01, permutation test) between responses to 90% and 10% stimuli in fixed locations occurred at 90 ms for monkey L and 85 ms for Monkey S (Table 2, Figures 20, 21, and 22). Note that the discrimination latency is at the beginning of the long latency burst for both subjects, consistent with the correlation between dopamine response and reward probability mentioned above. The discrimination latency for responses to 90% and 10% images in random locations is 90 ms for monkey L and 120 ms for monkey S. While one
37 27 might expect the latencies to be longer for stimuli in random locations only monkey S shows this phenomenon. Additionally, note that the stimuli still convey quite distinct visual information (i.e. color) and such information is likely permitting rapid discrimination of stimuli despite being presented in random locations. Contrasting discrimination latencies of the dopamine response to simple-discrimination images (Chapter II) and complex-discrimination high spatial frequency (HSF) stimuli (Tables 2 and 5, Chapter III) demonstrates that discrimination time is longer for these complex-discrimination stimuli in central locations (115 ms monkey L, 225 ms monkey S) and increases when stimuli are located peripherally (130 ms fixed peripheral, 170 ms random peripheral - Monkey L). Consistent with a saliency detection role for midbrain dopamine neurons, all sensory events (buzzer onset, fixation point onset, CS onset, CS offset, reward delivery) within the trials elicit robust phasic dopamine responses (Figure 23). Additionally, anticipatory activity prior to stimulus onset and reward delivery is quite distinct in the population histograms. Consisting of a two-fold elevation above the averaged baseline of 5 spikes/second, the anticipatory activity begins to increase after the onset of the buzzer (at approximately -1000ms) and then rapidly increases after the onset of the fixation point (-500 ms). The anticipatory activity remains elevated until after the onset of the predictive cue, and then persists for the 90% and 50% stimuli until the delivery of reward. While few neurons in the current sample exhibit robust anticipatory activity (Figure 24, see raster plot), the spike rate during this time is so robust that it strongly influences
38 28 the average population histogram, and adds evidence to the hypothesis that different populations of midbrain dopamine neurons in the SNc may serve to provide different signals to the striatum as previously reported (Matsumoto and Hikosaka, 2009). To account for the influence of the robust neurons (6%) on the population average, we removed those neurons and reanalyzed the data. Figure 25 displays the raster plot for activity to the 90% stimulus random location trials in both monkeys after removing the robustly active neurons. Anticipatory activity is still observed, except at a lower magnitude. Figure 26 depicts response to stimuli displayed in random locations after removing the robust neurons and can be compared to Figure 10 with robust neurons included. Figure 27 shows the response to stimuli displayed in fixed locations with robust neurons removed, and can be compared to Figure 12 (robust neurons included). Note that the biphasic response remains distinct after removing robustly active neurons in both random and fixed location trials, and the selectivity indices computed for short and long latencies still show a preference for individual neuron responses to 90% stimuli at long latency and not short latency (Figure 28, random locations short latency; Figure 29, random locations long latency; Figure 30, fixed locations short latency; Figure 31, fixed locations long latency). Consequently, the robustly active neurons do not exhibit undue influence on the biphasic nature of the response. The magnocellular portion of the visual pathway projects directly to the SC and conveys information limited to the location and movement of salient objects (Figure 32, red). We propose a hypothetical framework for the biphasic
39 29 dopamine response in that the SC provides rapid, short-latency information about the occurrence of salient events to dopamine neurons. Following an update from visual cortex to the SC about the identity and associated reward-value of stimuli, the SC can then relay that information to the dopamine neurons at a laterlatency. Oddly, no prior studies demonstrate a biphasic response to stimulus onset as depicted here. Two possible reasons might explain the unique discovery of a biphasic response. One possibility is that over-trained locationreward associations sensitized the SC visual map so that the responses in the SC increase to stimuli presented in those motivationally salient locations. The SC then conveys that saliency information to dopamine neurons at short-latency. Alternatively, prior studies often smooth the data to an extreme degree to preclude detection of a biphasic response. Analyzing the current study s data with a smoothing window comparable to that used in prior studies eliminates the ability to discern a biphasic response (Figure 33). Figure 34 displays the population response to stimulus onset in random locations for monkey L, while Figure 38 shows the population response for monkey S. Note that the responses to stimuli between the two subjects are similar with the exception of the robust anticipatory activity observed in subject L, decreased response magnitudes for subject S, and reduced short latency activity to the 10% stimulus in subject S. The responses to the onset of stimuli in fixed locations are also similar between the subjects (Figure 36, monkey L; Figure 40, monkey S). Additionally, the responses to reward delivery are similar between the subjects (Figure 35, random locations monkey L; Figure 37, fixed locations
40 30 monkey L; Figure 39, random locations monkey S; Figure 41, fixed locations monkey S). CONCLUSIONS & DISCUSSION Anticipatory licking confirmed that the conditioned stimuli (CS) associated with different reward probabilities were successfully discriminated by the monkeys. Evidence in all conditions indicates that the early phasic DA response is comprised of 1) an initial value independent component (50-110ms), and 2) a second component ( ms) the magnitude of which is determined by the predictive value of the CS. DA responses evoked by reward delivery were inversely related to predictive probabilities of the CS (Figure 18). Randomizing stimulus presentation locations precluded fast discrimination of CS based on location of presentation in favor of detailed feature analysis that requires cortical processing. Given the respective latencies and nature of the responses, the first phase is likely mediated directly via retino-tecto-nigral projections, while the second phase probably derives from early cortical visual processing (see Figure 32). Whether the system could determine stimulus identity in less constrained naturalistic environments remains to be established, since associations between CS and reward probabilities were over-trained, and both phases of the DA response preceded typical saccadic latencies to unpredicted events (~200ms).
41 31 The pre-attentive nature of the first phasic dopamine burst (50-110ms) and the lack of discrimination in response magnitudes to stimuli suggests the dopamine neurons initially signal the occurrence of behaviorally salient events. The early signal may function to direct attention towards salient events so that subsequent detailed cortical analysis may occur to determine whether reward is forthcoming. The ability of these dopamine neurons to discriminate stimuli based on associated reward probabilities does not reliably occur until the second, later latency burst of activity. The timing of the late-latency activity ( ms) likely reflects the additional processing time required to evaluate image features when the knowledge of stimulus identity is required to accurately predict reward. The subjects likely generalize over the image locations (less reliable predictive cue provided in half of all trials), instead favoring detailed features of the unique images (most reliable predictive cue provided in all trials) on which to predict the frequency of anticipatory licking necessary to completely receive perceived future reward. As such, there is no distinct activity to images displayed in random locations as compared to the stereotyped locations since the most reliable reward association is image identity. Subsequently, the dopamine neurons must wait until detailed image information is obtained to signal reward prediction at later latencies. Schultz and colleagues have suggested that dopamine neurons generalize their responses to similar stimuli, i.e. a phasic response can occur for low probability stimuli when they are similar in physical appearance to high probability stimuli (Schultz, 1998). To explain a functional role for dopamine
42 32 neuron generalization by the temporal difference model of the phasic dopamine response represents a challenge, and requires modification of the temporal difference learning model (Kakade & Dayan, 2002), which may not reflect the true nature of the response. Does generalization of the response suggest that dopamine neurons lack accuracy to predict rewards based on visual cues? Such a suggestion would limit dopamine s role in temporal difference learning if the dopamine neurons cannot accurately critique the information available at the time of the response. Given the nature of experimental sessions, the monkeys likely expect the probability of receiving reward to be high for the start of each new trial and for the initial appearance of stimuli at pre-attentive time points when rewardpredictive information is limited. Thus, when considering a functional role for generalization, a more favorable explanation is that it signals the occurrence of behaviorally salient events with unknown reward outcome. Before dopamine neurons can accurately encode reward-predictions, a motivational process would likely be necessary to focus a subject s attention toward salient stimuli for further evaluation. We propose that midbrain dopamine neurons function to help drive attention toward salient stimuli with the short-latency phasic burst of activity ( ms) to subsequently gather additional information about stimuli on which to establish an accurate reward prediction. Prior studies of midbrain dopamine neurons typically do not control for the eye position of the subjects, despite the fact that variable distances of image presentation from the subjects point of gaze will very likely vary the timing of image feature discrimination. Requiring the subjects to maintain their gaze on a
43 33 fixation point is an appropriate control to study the timing of neuronal responses to visual stimuli. In conjunction with overtraining location-reward associations, lack of eye position control complicates the ability to infer the encoding of dopamine neuron responses to visual stimuli. Controlling eye position allows the controlled display of images at distinct distances from the fovea, thereby controlling the amount of visual information available to the subject at the time the image appears on screen. The stimuli used in this study were presented near the point at which the monkeys fixed their eyes, and consequently, obviate the need for large saccades permitting the subjects to identify stimulus features at pre-saccadic times. Without a saccade requirement to evaluate image features, analysis by the temporal cortex occurs 100 ms after stimulus presentation (Rousselet et al., 2004). The latency of the second burst of phasic activity ( ms) by the dopamine neurons is consistent with the processing time required for visual regions of cortex to analyze the detailed features of stimuli. Future studies should evaluate the response of dopamine neurons to conditioned stimuli displayed at incrementally farther distances from the fovea, gradually limiting the amount of visual information available to the subject at short latency. Extremely limited information would be available to the SC when the images are displayed at eccentricities of 40 degrees and greater from the fixation point (Kim and Basso, 2008), and this may have an impact on the short-latency component of the phasic dopamine response.
44 34 One unresolved question centers on the mechanism by which the visual cortex signals update image feature information to dopamine neurons when no direct anatomical connections exist between the structures. Cortical modification of the superior colliculus (SC) is one possible mechanism by which dopamine neurons could receive updated information about visual stimuli. In a recent study, the barrel cortex, a whisker somatosensory cortex in rodents, is shown to modify the activity of the SC. Particularly relevant to the current study is that this modification of the SC response occurs at a later latency after the initial response to whisker stimulation. Further, cortical stimulation is necessary and sufficient for the later latency signal (Cohen, et al., 2008). Furthermore, in a study comparing SC activation to the simultaneous display of both distracter and target stimuli the responses of neurons to each stimulus incorporates an initial, generalized burst of activity that is similar in magnitude for both target and distracters (Kim and Basso, 2008). An additional, delayed response to the target occurs when the target is located in the neuron s receptive field and after the time of target discrimination by the monkey. Color (green vs. red) is the only difference between target and distracter stimuli, a feature the SC alone is not thought capable of discriminating without extensive training. With training, however, the visual cortex is likely providing an update of the target stimulus identity to the SC at a longer latency than the SC visual response so that the SC can accurately drive the saccade towards the target. Thus, the SC is likely relaying this cortical update to dopamine neurons in SNc at a later latency (Figure 32).
45 35 Given the evidence for a biphasic dopamine response detailed in this study, why is there an apparent lack of a biphasic response in prior studies of phasic dopamine response to conditioned stimuli? Adequate temporal resolution of the peristimulus time histograms (PSTH) is critical to discriminate the biphasic dopamine response, but is an issue not well explored by many studies examining the dopamine response to conditioned stimuli. Prior studies typically analyze dopamine neuron data using low temporal resolution, limiting the visualization of mutli-modal activity. If the current study s data are displayed using a low temporal resolution, the result is an apparent single phasic burst of activity (Figure 33). The possibility exists that other studies of dopamine neuron activity particularly those that link stimulus identity to reward and not just stimulus location may also demonstrate the biphasic burst phenomenon when analyzed using a finer temporal resolution. In fact, a recent review that reassesses prior studies of dopamine neuron activity to aversive stimuli suggests that the responses to aversive stimuli are biphasic, exhibiting a short-latency rapid increase in activity followed by a pause of neural activity that suppresses the firing rate below spontaneous levels (Joshua et al., 2009). The authors suggest that the biphasic pattern of the response indicates separate sources of input, with the short-latency signal conveyed by brainstem regions and the late-latency signal by neocortical loops required for value encoding. While this is one possible explanation for the biphasic response, evidence for direct cortical input to SNc dopamine neurons is scant (Bolam et al., 2000), although the direct retino-tecto-nigral pathway is now
46 36 well established (Comoli et al., 2003; McHaffie et al., 2006; May et al., 2009; Coizet et al., 2003; Dommett et al, 2005). We suggest that instead of separate direct inputs to nigral dopamine neurons; it is more likely that the superior colliculus provides both short and late-latency visual signals to the dopamine neurons, but that superior colliculus modification by visual cortex indirectly provides the late-latency value information. In summary, these results suggest that midbrain dopamine neurons encode both saliency and reward prediction, but that latencies of these encoded signals are distinct when stimulus identity is the key element linking reward value to the conditioned stimuli. Stimulus salience is likely provided by the superior colliculus at early latency ( ms) after stimulus onset, and that the dopamine neurons are updated as to the reward value of stimuli at later latency ( ms) when complete visual feature information of stimuli is available. It is likely that the updated signal is again relayed to the dopamine neurons by the superior colliculus, but occurs through a modification of the superior colliculus by visual cortex.
47 37 Dopamine Neuron Properties Monkey L Monkey S Significant phasic activity to reward (p<<0.01) 100% (44/44) 100% (44/44) Mean spontaneous firing ± SD (spikes/sec) 3.85 ± ± 3.03 Mean waveform width ± SD (ms) ± ± Table 1 Significant phasic activity to unexpected reward delivery (reward delivered at random intervals between 2-16 seconds) was determined by a Wilcoxon rank-sum test (p << 0.01, all neurons). Mean action potential spike counts of dopamine response to unexpected reward (analysis window of 50 to 300ms after reward delivery) were compared to baseline firing spike counts (analysis window of -300 to -550 prior to reward delivery) for each individual neuron. Additionally, note that spontaneous firing rate and waveform width means and standard deviations are similar for both monkeys, an indication of homogeneity of electrophysiological characteristics of dopamine neurons between individual monkeys.
48 38 Discrimination latency (ms): Monkey L Monkey S Simple discrimination Fixed 90% vs. 10% Stimulus % vs. 50% Stimulus 90 50% vs. 10% Stimulus Simple discrimination Random 90% vs. 10% Stimulus % vs. 50% Stimulus % vs. 10% Stimulus Table 2 Discrimination latencies in milliseconds were determined by receiver operating characteristic discrimination index (DI) analysis comparing conditions with a moving 5ms window and a permutation test (5000 repetitions) to assess at what time the DI becomes significantly different than what would be expected by chance.
49 39 Response latency (ms): Monkey L Monkey S Simple discrimination Fixed 10% Stimulus % Stimulus % Stimulus Simple discrimination Random 10% Stimulus NR* 50% Stimulus % Stimulus Table 3 Response latencies in milliseconds were determined by a geometric method to detect the deflection angle on a cumulative sum of spikes curve (Qsum) caused by post-stimulus firing rate changes corrected for baseline firing rate (Rowland et al., 2007). Shown are the ranges of the phasic responses from onset to offset. Stimulus offset is the time at which the Qsum slope decreases toward zero. NR* indicates a condition for which the Qsum algorithm did not detect a response greater than pre-stimulus baseline firing rate.
50 Figure 1 40
51 41 Figure 1 Monkeys were trained to associate distinct visual stimuli (CS) with unique probabilities of reward (0.9, 0.5 and 0.1). In some blocks of trials, CS location was randomized, while in other blocks, CS identity and location were yoked. Random and fixed location blocks were interleaved, and monkeys were not cued about the nature of a given block. A low-pitched buzzer signaled the start of a trial, and monkeys were given up to 2 s to acquire a central stimulus (red dot). After 500 ms, a CS was displayed for 2 s, followed by an additional 500ms delay before the reward was administered according to the scheduled reward probability. After an additional 1 s delay, monkeys were rewarded for maintaining fixation for the completion of the trial. Images were counterbalanced between monkeys to ensure that the neurons respond to the associated reward probabilities of each image and not just to particular physical features of the images.
52 42 Figure 2 Averaged action potential waveforms normalized to peak amplitude from 83 individually recorded neurons. All neurons included for analysis exhibited similar waveforms.
53 43 16 Spontaneous Freq. vs. Waveform 14 Spontaneous Firing (spk/sec) Peak Waveform to Peak Waveform width (ms) (ms) Figure 3 Plotting spontaneous firing frequency against waveform demonstrates a population consistent for characteristics typical of dopamine neurons. Orange points are neurons from monkey S, blue are neurons from monkey L. Waveform width is measured from the first negative deflection of the triphasic waveform to the second negative deflection (see Figure 2).
54 Figure 4 44
55 45 Figure 4 MR images were obtained for monkey L with an electrode implanted at a location 7 mm dorsal to the site of typical dopamine neuron recordings to establish a structural location of recording. The MR image (right/top) shows a shadow of the electrode located just dorsal to the substantia nigra pars compacta as compared to a rhesus macaque histology slide on the left/bottom (Mikula et al., 2009). The red star on the MR image depicts the typical recording depth of putative dopamine neurons, confirming that the region from which we recorded dopamine neurons is located within the substantia nigra. The blue star denotes the electrode tip, and the approximate location corresponding with rhesus macaque histology. SNc = substantia nigra pars compacta.
56 46 Figure 5 Classical conditioning assessed by licking behavior of monkey L (solid blue, left y-axis) and monkey S (dashed red, right y-axis) to simple-discrimination images in random locations. Anticipatory licking increased linearly for stimuli conditioned with higher probabilities of reward (mean ± SEM). Licking behavior was determined by counting the number of licks (i.e. number of times the tongue breaks the infrared beam between the monkeys mouths and the reward spout) the monkey made within the 2.5 second period between stimulus onset and reward delivery. Anticipatory activity for each point is averaged across all trials included for neural analysis.
57 47 Figure 6 Classical conditioning assessed by licking behavior of monkey L (solid blue, left y-axis) and monkey S (dashed red, right y-axis) to simple-discrimination images in fixed locations. Anticipatory licking increases linearly for stimuli conditioned with higher probabilities of reward (mean ± SEM). Licking behavior is determined by counting the number of licks (i.e. number of times the tongue breaks the infrared beam between the monkeys mouths and the reward spout) the monkey performs within the 2.5 second period between stimulus onset and reward delivery. Anticipatory activity for each point is averaged across all trials included for neural analysis.
 delivered at random intervals of 2-16 seconds in")
 is smoothed with a Gaussian kernel σ")
 represent individual action potentials as a tick")
58 48 Figure 7 Dopamine neuron activity to delivery of unexpected reward (red line, time = 0 ms) delivered at random intervals of 2-16 seconds in length. Spike density histogram (top panel) is smoothed with a Gaussian kernel σ = 6 ms. Spike raster (below) represent individual action potentials as a tick mark, and each row of tick marks is one trial. All neurons included for analysis exhibited this characteristic response to unexpected reward.
59 Figure 8 49
60 50 Figure 8 Dopamine neuron response to stimuli presented in fixed and random locations. The neuron responded similarly to stimuli presented in fixed or random locations, therefore, the responses displayed here contain trials for both conditions. Each tick mark on raster plots (lower panels) represents an action potential, and each row of tick marks is one trial. Spike density histograms above raster plots are neuron firing rates convolved with a Gaussian kernel of σ = 6ms. Cell firing rate increases to onset of stimuli with higher reward probabilities.
61 51 Fixed Locations, prior studies Random Locations, current study A) Spikes/sec p = 0.1 p = 0.5 p = 0.9 B) Spikes/sec Reward Prediction Hypothesis Latency Shift p = 0.1 p = 0.5 p = Time Time C) Spikes/sec Sensory Salience Hypothesis p = 0.1 p = 0.5 p = Time Figure 9
62 52 Figure 9 Randomizing stimulus location uncouples the association between reward probabilities and location. Does randomizing stimulus location result in longer CS+ response latencies (B) or are dopamine neurons incapable of detecting reward probabilities (C)? If the graded dopamine response depends on image location, it is less likely that they encode reward prediction.
63 Figure 10 53
64 54 Figure 10 Population spike density histogram (neuron firing rates convolved with a Gaussian kernel of σ = 6ms, shaded regions are standard errors about the mean) of 84 dopamine neurons (40 neurons monkey L; 44 monkey S) activity to random location stimulus onset (green = 10% stimulus; magenta = 50%; blue = 90%). A biphasic response to the onset of the stimuli is observed. The first response at ms does not correlate with the predictive reward-values of the three images, while the second response increases monotonically for increasing reward value.
65 Figure 11 55
66 56 Figure 11 Population spike density histogram (neuron firing rates convolved with a Gaussian kernel of σ = 6ms, shaded regions are standard errors about the mean) of 84 dopamine cells (40 neurons monkey L; 44 monkey S) activity to reward delivery for stimuli placed in random locations (green = 10% stimulus; magenta = 50%; blue = 90%). Phasic dopamine neuron activity decreases monotonically with increasing reward probability, and signals reward prediction error, a hallmark of midbrain dopamine neurons. The most robust reward prediction error signal occurs to delivery of unexpected reward for low probability stimulus (10% stimulus, green), since reward expectation is lowest for this stimulus.
67 Figure 12 57
68 58 Figure 12 Population spike density histogram (neuron firing rates convolved with a Gaussian kernel of σ = 6ms, shaded regions are standard errors about the mean) of 84 dopamine neurons (44 neurons monkey L; 40 monkey S) activity to fixed location stimulus onset (green = 10% stimulus; magenta = 50%; blue = 90%). A biphasic response to the onset of the stimuli is observed, similar to stimuli in random locations. The first response at ms does not correlate with the associated reward probabilities of the three images, while the second response increases monotonically for increasing reward value. Since the monkeys were trained to associate stimulus identity and not just location with reward, the monkeys and dopamine neurons consequently respond similarly to images when in fixed and random locations.

69 Figure 13 59
70 60 Figure 13 Population spike density histogram (neuron firing rates convolved with a Gaussian kernel of σ = 6ms, shaded regions are standard errors about the mean) of 84 dopamine cells (44 neurons monkey L; 40 monkey S) activity to reward delivery for stimuli placed in fixed locations (green = 10% stimulus; magenta = 50%; blue = 90%). Phasic dopamine neuron activity decreases monotonically with increasing reward probability, and signals reward prediction error, a hallmark of midbrain dopamine neurons. The most robust reward prediction error signal occurs to delivery of unexpected reward for low probability stimulus (10% stimulus, green line).

71 Figure 14 61
72 62 Figure 14 A selectivity index relates the magnitude of activity evoked for the 90% and 10% stimuli in random locations according to the formula (rate90- rate10/rate90+ rate10). The index was computed for each individual neuron s early and late response components (84 neurons total; 40 neurons monkey L; 44 neurons monkey S). Some neurons do not exhibit activity at short latency to both 90% and 10% stimuli, and consequently lack a selectivity index (division by zero error, 9 neurons). In contrast to the late component (Figure 15), the early component, values are distributed around zero, indicative of insensitivity to reward probability. The time window to calculate the short latency selectivity index is ms.
73 Figure 15 63
74 64 Figure 15 A selectivity index relates the magnitude of activity evoked for the 90% and 10% stimuli in random locations according to the formula (rate90- rate10/rate90+ rate10). The index was computed for each individual neuron s early and late response components (84 neurons total; 40 neurons monkey L; 44 neurons monkey S). Some neurons do not exhibit activity at long latency to both 90% and 10% stimuli, and consequently lack a selectivity index (division by zero error, 5 neurons). In contrast to the early component (Figure 14), the late component shows a strong trend toward positive values, indicative of greater activity for the CS predicting high likelihood of reward. The time window to calculate the late latency selectivity index is ms. Late latency selectivity index mean is significantly different from short latency selectivity index mean (p = 1.94 x 10⁻⁸, Student s t-test).
75 Figure 16 65
76 66 Figure 16 A selectivity index relates the magnitude of activity evoked for the 90% and 10% stimuli in fixed locations according to the formula (rate90- rate10/rate90+ rate10). The index was computed for each individual neuron s early and late response components (84 neurons total; 44 neurons monkey L; 40 neurons monkey S). Some neurons do not exhibit activity at short latency to both 90% and 10% stimuli, and consequently lack a selectivity index (division by zero error, 9 neurons). In contrast to the late component (Figure 17), the early component, values were distributed around zero, indicative of insensitivity to reward probability. The time window to calculate the short latency selectivity index is ms.

77 Figure 17 67
78 68 Figure 17 A selectivity index relates the magnitude of activity evoked for the 90% and 10% stimuli in fixed locations according to the formula (rate90- rate10/rate90+ rate10). The index was computed for each individual neuron s early and late response components (84 neurons total; 44 neurons monkey L; 40 neurons monkey S). Some neurons do not exhibit activity at long latency to both 90% and 10% stimuli, and consequently lack a selectivity index (division by zero error, 4 neurons). In contrast to the early component (Figure 16), the late component shows a strong trend toward positive values, indicative of greater activity for the CS predicting high likelihood of reward. The time window to calculate the late latency selectivity index is ms. The late latency selectivity index mean is significantly different from short latency selectivity index mean (p = , Student s t-test).
79 Figure 18 69
80 70 Figure 18 Response vs. reward probability plots mean firing rates (± SEM) for stimulus onset and reward delivery for CS displayed in random locations. Mean firing rate for early component is similar for all CS (solid red, ms) whereas the mean firing rate for the late component (solid blue, ms) increases monotonically with CS reward probability. Activity for reward delivery (dashed blue, ms) is inversely related to reward probability and is consistent with a signal that encodes reward prediction error.
81 Figure 19 71
82 72 Figure 19 Response vs. reward probability plots mean firing rates (± SEM) for stimulus onset and reward delivery for CS displayed in fixed locations. Mean firing rate for early component is similar for both the 10% and 50% CS (solid red, ms) whereas the mean firing rate for the late component (solid blue, ms) increases monotonically with CS reward probability. Note that the mean firing rate of the short latency component to the 90% stimulus is slightly greater than the short latency component response to 50% and 10% stimuli. Additionally, the short latency component activity to the 90% stimulus in fixed locations is slightly greater than the short latency component response to the 90% stimulus in random locations (Figure 18) and suggests that location-specific information is relayed to DA neurons when images are displayed in fixed locations. Activity for reward delivery (dashed blue, ms) is inversely related to reward probability and is consistent with a signal that encodes reward prediction error.
83 73 Rand90S Rand50S Monkey S Rand10S Fixed90S Fixed50S Fixed10S Rand90L Rand50L Monkey L Rand10L Fixed90L Fixed50L Fixed10L Time (ms) Figure 20
84 74 Figure 20 Response (lines) and discrimination (dots) latencies for each stimulus across both conditions (fixed and random locations) for both subjects illustrates the time course of the neuronal response. Lines plot the duration of the response from onset to the off point as verified by Qsum analysis (see Data Analysis in Methods). Dots depict the point at which the responses between stimuli differed significantly as determined by ROC analysis (see Data Analysis in Methods). Note that the discrimination latency occurs near the offset of the 10% stimulus and the onset of the 90% stimulus. Discrimination latencies are plotted for the discrimination time for 90% stimulus vs. 10% stimulus for both the 90% stimulus and 10% stimulus, and 50% stimulus vs. 10% stimulus for the 50% stimulus. Fixed = stimuli in fixed locations, Rand = stimuli in random locations, 10 = 10% stimulus, 50 = 50% stimulus, and 90 = 90% stimulus, L = monkey L, S = monkey S.

 curves provide information")


85 75 Random Locations ROC Discrimination Index Figure 21 Receiver operating characteristic (ROC) curves provide information about rate and duration of discrimination between populations. For stimuli placed in random locations, the greatest discrimination occurs between 90% and 10% stimuli as well as 50% and 10% stimuli. Additionally, the discrimination occurs over a protracted time window and demonstrates the anticipatory activity for 90% and 50% stimuli prior to reward delivery.
 curves provide")


86 76 Fixed Locations ROC Discrimination Index Figure 22 Receiver operating characteristic (ROC) curves provide information about rate and duration of discrimination between populations. For stimuli placed in fixed locations, the greatest discrimination occurs between 90% and 10% stimuli as well as 50% and 10% stimuli. Additionally, the discrimination occurs over a protracted time window and demonstrates the anticipatory activity predominately for the 90% stimulus prior to reward delivery.
87 77 Aligned on stimulus onset random locations Buzzer Fix CS onset CS off Reward Reward 90% 50% 10% Figure 23
88 78 Figure 23 Peristimulus time histogram (convolved with a Gaussian smoothing kernel σ=6ms) for random location conditions in both subjects. Neurons exhibit robust anticipatory activity leading up to the onset of fixation point (-500 ms) and CS (0 ms, red line). Additionally, it is apparent that midbrain dopamine neurons respond robustly to all occurrences of salient stimuli throughout the trial (buzzer onset at -1000ms, fixation point onset -500ms, CS onset at 0ms, CS offset at 2000ms).

89 Figure 24 79
90 80 Figure 24 Peristimulus time histogram (convolved with a Gaussian smoothing kernel σ=6ms) and spike raster for the 90% stimulus presented in random locations in both monkeys. Neurons exhibited robust anticipatory activity leading up to the onset of fixation point (-500 ms) and CS (0 ms, red line). While the number of neurons that exhibited this activity is relatively few (5 neurons, 6% of sample total), the spike rates were high enough to influence the histogram average. This may suggest that certain populations of midbrain dopamine neurons in SNc serve different functions in reward-related learning. Additionally, it is apparent that midbrain dopamine neurons respond robustly to all occurrences of salient stimuli throughout the trial (buzzer onset at -1000ms, fixation point onset -500ms, CS onset at 0ms, CS offset at 2000ms).
91 Figure 25 81
92 82 Figure 25 Peristimulus time histogram (convolved with a Gaussian smoothing kernel σ=6ms) and spike raster for the 90% stimulus presented in random locations in both monkeys with the 6% of neurons exhibiting robust anticipatory activity removed (see Figure 24 for histogram with neurons included) to evaluate the biphasic response in the absence of those neurons. The remaining neurons still exhibit anticipatory activity leading up to the onset of fixation point (-500 ms) and CS (0 ms, red line), although less robustly, and a biphasic response to stimulus onset persists (see Figure 26 for clearer depiction of the biphasic response).
 to evaluate the biphasic response in the absence of those")
93 83 Figure 26 Peristimulus time histogram (convolved with a Gaussian smoothing kernel σ=6ms) for the 90% stimulus (blue), 50% stimulus (magenta), and 10% stimulus (green) presented in random locations in both monkeys with the 6% of neurons exhibiting robust anticipatory activity removed (see Figure 10 for histogram with neurons included) to evaluate the biphasic response in the absence of those neurons. The remaining neurons still exhibit a biphasic response to stimulus onset.
 to evaluate the biphasic response in the absence of those")
94 84 Figure 27 Peristimulus time histogram (convolved with a Gaussian smoothing kernel σ=6ms) for the 90% stimulus (blue), 50% stimulus (magenta), and 10% stimulus (green) presented in fixed locations in both monkeys with the 6% of neurons exhibiting robust anticipatory activity removed (see Figure 12 for histogram with neurons included) to evaluate the biphasic response in the absence of those neurons. The remaining neurons still exhibit a biphasic response to stimulus onset.
95 Figure 28 85
96 86 Figure 28 A selectivity index relates the magnitude of activity evoked for the 90% and 10% stimuli in random locations according to the formula (rate90- rate10/rate90+ rate10). The index was computed for each individual neuron s early and late response components (79 neurons total; 35 neurons monkey L; 44 neurons monkey S) excluding 5 neurons exhibiting robust anticipatory activity. Some neurons within the sample do not exhibit activity at short latency to both 90% and 10% stimuli, and consequently lack a selectivity index (division by zero error, 9 neurons). In contrast to the late component (Figure 29), the early component, values are distributed around zero, indicative of insensitivity to reward probability. The time window to calculate the short latency selectivity index is ms.

97 Figure 29 87
98 88 Figure 29 A selectivity index relates the magnitude of activity evoked for the 90% and 10% stimuli in random locations according to the formula (rate90- rate10/rate90+ rate10). The index was computed for each individual neuron s early and late response components (79 neurons total; 35 neurons monkey L; 44 neurons monkey S) excluding 5 neurons exhibiting robust anticipatory activity. Some neurons within the sample do not exhibit activity at long latency to both 90% and 10% stimuli, and consequently lack a selectivity index (division by zero error, 5 neurons). In contrast to the early component (Figure 28), the late component shows a strong trend toward positive values, indicative of greater activity for the CS predicting high likelihood of reward. The time window to calculate the late latency selectivity index is ms. Late latency selectivity index mean is significantly different from short latency selectivity index mean (p = 1.6 x 10⁻⁶, Student s t-test).

99 Figure 30 89
100 90 Figure 30 A selectivity index relates the magnitude of activity evoked for the 90% and 10% stimuli in fixed locations according to the formula (rate90- rate10/rate90+ rate10). The index was computed for each individual neuron s early and late response components (79 neurons total; 39 neurons monkey L; 40 neurons monkey S) excluding 5 neurons exhibiting robust anticipatory activity. Some neurons do not exhibit activity at short latency to both 90% and 10% stimuli, and consequently lack a selectivity index (division by zero error, 9 neurons). In contrast to the late component (Figure 31), the early component, values are distributed around zero, indicative of insensitivity to reward probability. The time window to calculate the short latency selectivity index is ms.
101 Figure 31 91
102 92 Figure 31 A selectivity index relates the magnitude of activity evoked for the 90% and 10% stimuli in fixed locations according to the formula (rate90- rate10/rate90+ rate10). The index was computed for each individual neuron s early and late response components (79 neurons total; 39 neurons monkey L; 40 neurons monkey S) excluding 5 neurons exhibiting robust anticipatory activity. Some neurons do not exhibit activity at long latency to both 90% and 10% stimuli, and consequently lack a selectivity index (division by zero error, 4 neurons). In contrast to the early component (Figure 30), the late component shows a strong trend toward positive values, indicative of greater activity for the CS predicting high likelihood of reward. The time window to calculate the late latency selectivity index is ms. Late latency selectivity index mean is significantly different from short latency selectivity index mean (p = 0.003, Student s t-test).
103 93 Visual Cortex Parvocellular Superior Colliculus ms Magnocellular Retina ms Dopamine Neurons in SNc Figure 32
104 94 Figure 32 Schematic depicts a possible substrate for early and late components of visually evoked response of midbrain dopamine neurons. Based on latency alone, the superior colliculus (SC) is a likely source of short-latency, nondiscriminative visual input to DA neurons via the retino-tecto-nigral projections (magnocellular pathway; low contrast, luminance information). Later activity, which discriminates stimulus identity, is likely the result of cortical visual processing (parvocellular pathway; color, fine feature discrimination) which could be relayed via the SC to DA neurons at a longer latency.
105 Figure 33 95
106 96 Figure 33 A Gaussian smoothing window of σ=20ms, as used by many prior studies investigating the visual response of midbrain dopamine neurons (histogram bin-widths of 20ms), eliminates the ability to discern biphasic activity and suggests that biphasic activity may have been apparent in prior studies had adequate analysis bin-widths been used.

107 Figure 34 97
108 98 Figure 34 Population spike density histogram (neuron firing rates convolved with a Gaussian kernel of σ = 6ms, shaded regions are standard errors about the mean) of 40 dopamine neurons (monkey L) activity to random location stimulus onset (green = 10% stimulus; magenta = 50%; blue = 90%). A biphasic response to the onset of the stimuli is observed. The first response at ms does not correlate with the predictive reward-values of the three images, while the second response increases monotonically for increasing reward value.

109 Figure 35 99
110 100 Figure 35 Population spike density histogram (neuron firing rates convolved with a Gaussian kernel of σ = 6ms, shaded regions are standard errors about the mean) of 40 dopamine cells (monkey L) activity to reward delivery for stimuli placed in random locations (green = 10% stimulus; magenta = 50%; blue = 90%). Phasic dopamine neuron activity decreases monotonically with increasing reward probability, and signals reward prediction error, a hallmark of midbrain dopamine neurons. The most robust reward prediction error signal occurs to delivery of unexpected reward for low probability stimulus (10% stimulus, green).

111 Figure
112 102 Figure 36 Population spike density histogram (neuron firing rates convolved with a Gaussian kernel of σ = 6ms, shaded regions are standard errors about the mean) of 44 dopamine neurons (monkey L) activity to fixed location stimulus onset (green = 10% stimulus; magenta = 50%; blue = 90%). A biphasic response to the onset of the stimuli is observed. The first response at ms does not correlate with the predictive reward-values of the three images, while the second response increases monotonically for increasing reward value.
113 Figure
114 104 Figure 37 Population spike density histogram (neuron firing rates convolved with a Gaussian kernel of σ = 6ms, shaded regions are standard errors about the mean) of 44 dopamine cells (monkey L) activity to reward delivery for stimuli placed in fixed locations (green = 10% stimulus; magenta = 50%; blue = 90%). Phasic dopamine neuron activity to reward delivery is inversely related to reward probability, decreasing with increasing reward probability, which signals reward prediction error, a hallmark of midbrain dopamine neurons. The most robust reward prediction error signal occurs to delivery of unexpected reward for low probability stimulus (10% stimulus, green line).

115 105 Stimulus onset random locations Monkey S Figure 38
116 106 Figure 38 Population spike density histogram (neuron firing rates convolved with a Gaussian kernel of σ = 6ms, shaded regions are standard errors about the mean) of 44 dopamine neurons (monkey S) activity to random location stimulus onset (green = 10% stimulus; magenta = 50%; blue = 90%). A biphasic response to the onset of the stimuli is observed. The first response at ms does not correlate with the predictive reward-values of the three images, while the second response increases monotonically for increasing reward value.

117 107 Reward delivery random locations Monkey S Figure 39
118 108 Figure 39 Population spike density histogram (neuron firing rates convolved with a Gaussian kernel of σ = 6ms, shaded regions are standard errors about the mean) of 44 dopamine cells (monkey S) activity to reward delivery for stimuli placed in random locations (green = 10% stimulus; magenta = 50%; blue = 90%). Phasic dopamine neuron activity decreases monotonically with increasing reward probability, and signals reward prediction error, a hallmark of midbrain dopamine neurons. The most robust reward prediction error signal occurs to delivery of unexpected reward for low probability stimulus (10% stimulus, green).

119 109 Stimulus onset fixed locations Monkey S Figure 40
120 110 Figure 40 Population spike density histogram (neuron firing rates convolved with a Gaussian kernel of σ = 6ms, shaded regions are standard errors about the mean) of 40 dopamine neurons (monkey S) activity to fixed location stimulus onset (green = 10% stimulus; magenta = 50%; blue = 90%). A biphasic response to the onset of the stimuli is observed. The first response at ms does not correlate with the predictive reward-values of the three images, while the second response increases monotonically for increasing reward value.

121 111 Reward delivery fixed locations Monkey S Figure 41
122 112 Figure 41 Population spike density histogram (neuron firing rates convolved with a Gaussian kernel of σ = 6ms, shaded regions are standard errors about the mean) of 40 dopamine cells (monkey S) activity to reward delivery for stimuli placed in fixed locations (green = 10% stimulus; magenta = 50%; blue = 90%). Phasic dopamine neuron activity to reward delivery is inversely related to reward probability, decreasing with increasing reward probability, which signals reward prediction error, a hallmark of midbrain dopamine neurons. The most robust reward prediction error signal occurs to delivery of unexpected reward for low probability stimulus (10% stimulus, green).
123 113 REFERENCES Bolam JP, Hanley JJ, Booth PA, Bevan MD. Synaptic organisation of the basal ganglia. J Anat May;196 ( Pt 4): Cohen JD, Hirato A, Castro-Alamancos MA. Vibrissa Sensation in Superior Colliculus: Wide-Field Sensitivity and State-Dependent Cortical Feedback. J. Neurosci (44): Coizet V, Comoli E, Westby GW, Redgrave P. Phasic activation of substantia nigra and the ventral tegmental area by chemical stimulation of the superior colliculus: an electrophysiological investigation in the rat. Eur.J.Neurosci Jan;17(1): Comoli E, Coizet V, Boyes J, Bolam JP, Canteras NS, Quirk RH, Overton PG, Redgrave P. A direct projection from superior colliculus to substantia nigra for detecting salient visual events. Nat Neurosci 2003 Sep;6(9): Dommett E, Coizet V, Blaha CD, Martindale J, Lefebvre V, Walton N, Mayhew JEW, Overton PG, Redgrave P. How Visual Stimuli Activate Dopaminergic Neurons at Short Latency. Science 2005 Mar 4;307(5714): Fiorillo CD, Tobler PN, Schultz W. Discrete Coding of Reward Probability and Uncertainty by Dopamine Neurons. Science 2003 Mar 21;299(5614):
124 114 Frank MJ. Dynamic dopamine modulation in the basal ganglia: a neurocomputational account of cognitive deficits in medicated and nonmedicated Parkinsonism. J Cogn Neurosci 2005 Jan;17(1): Grace AA, Bunney BS. Intracellular and extracellular electrophysiology of nigral dopaminergic neurons--1. Identification and characterization. Neuroscience 1983 Oct;10(2): Hollerman JR, Schultz W. Dopamine neurons report an error in the temporal prediction of reward during learning. Nat Neurosci 1998 Aug;1(4): Ikeda T, Hikosaka O. Reward-dependent gain and bias of visual responses in primate superior colliculus. Neuron Aug 14;39(4): Joshua M, Adler A, Bergman H. The dynamics of dopamine in control of motor behavior. Curr Opin Neurobiol Dec;19(6): Kakade S., and Dayan P. Dopamine: generalization and bonuses, Neural Netw , Kim B, Basso MA. Saccade Target Selection in the Superior Colliculus: A Signal Detection Theory Approach. J. Neurosci (12): Matsumoto M, Hikosaka O. Two types of dopamine neuron distinctly convey positive and negative motivational signals. Nature (7248): May, P.J., McHaffie, J.G., Stanford, T.R., Jiang, H., Costello, M.G., Coizet, V., Hayes, L.M., Haber, S.N., and Redgrave, P. Tectonigral projections in the
125 115 primate: A pathway for pre-attentive sensory input to midbrain dopaminergic neurons. Eur. J. Neurosci. 2009; 29: McHaffie JG, Jiang H, May PJ, Coizet V, Overton PG, Stein BE, Redgrave P. A direct projection from superior colliculus to substantia nigra pars compacta in the cat. Neuroscience 2006;138(1): Mikula S, Stone JM, Berman AL, Jones EG. A digital stereotaxic atlas of the brain of the monkey, Macaca mulatta. Brainmaps.org Mirenowicz J, Schultz W. Importance of unpredictability for reward responses in primate dopamine neurons. J Neurophysiol 1994 Aug 1;72(2): Montague PR, Hyman SE, Cohen JD. Computational roles for dopamine in behavioural control. Nature 2004 Oct 14;431(7010): Redgrave P, Gurney K, Reynolds J. What is reinforced by phasic dopamine signals? Brain Res.Rev Oct 26. Redgrave P, Gurney K. The short-latency dopamine signal: a role in discovering novel actions? Nat Rev Neurosci 2006 Dec;7(12): Romo R, Schultz W. Dopamine neurons of the monkey midbrain: contingencies of responses to active touch during self-initiated arm movements. J.Neurophysiol Mar;63(3): Rousselet GA, Thorpe SJ, Fabre-Thorpe M. How parallel is visual processing in the ventral pathway? Trends Cogn Sci Aug;8(8):
126 116 Rowland BA, Quessy S, Stanford TR, Stein BE. Multisensory integration shortens physiological response latencies.. J Neurosci May 30;27(22): Schultz W. Predictive reward signal of dopamine neurons. J Neurophysiol 1998 Jul;80(1):1-27. Schultz W. Behavioral Theories and the Neurophysiology of Reward. Annual Review of Psychology 2006;57(1): Sparks DL. Translation of sensory signals into commands for control of saccadic eye movements: role of primate superior colliculus. Physiol.Rev Jan 1;66(1): Stein BE, Meredith MA. The Merging of the Senses MIT Press, Cambridge, Massacheusetts. Sumner P, Adamjee T, Mollon JD. Signals invisible to the collicular and magnocellular pathways can capture visual attention. Curr.Biol Aug 6;12(15): Suri RE. TD models of reward predictive responses in dopamine neurons. Neural Netw Jun;15(4-6): Tobler PN, Fiorillo CD, Schultz W. Adaptive Coding of Reward Value by Dopamine Neurons. Science 2005 Mar 11;307(5715):
127 117 Vuilleumier P, Armony JL, Driver J, Dolan RJ. Distinct spatial frequency sensitivities for processing faces and emotional expressions. Nat Neurosci 2003 Jun;6(6): Wyder MT, Massoglia DP, Stanford TR. Contextual modulation of central thalamic delay-period activity: representation of visual and saccadic goals. J Neurophysiol :
128 118 CHAPTER III MIDBRAIN DOPAMINE NEURONS ENCODE BOTH SENSORY SALIENCE AND REWARD PREDICTION FOR STIMULI BIASED TOWARD PARVOCELLULAR PATHWAY DISCRIMINATION
129 119 ABSTRACT Considerable anatomical and electrophysiological evidence suggests that visual information is conveyed to dopamine (DA) neurons in the substantia nigra pars compacta (SNc) from the superior colliculus (SC). Such evidence, in concert with the short-latency nature of the phasic DA signal (typically ms after stimulus presentation), suggests that DA neurons have limited visual information at the time of short-latency phasic bursts to reward-associated visual stimuli. The reward prediction hypothesis of short-latency DA firing relies on an assumption that sensory processing of reward-associated stimuli has occurred to an extent that reward value of unique stimuli can be accurately relayed by the DA neurons. If visual information is solely provided by the SC, the image resolution of stimuli is quite low, as the SC receives visual information from the magnocellular pathway. Prior studies supporting short-latency DA neuron reward prediction often confound the spatial location of stimuli with the reward value of the conditioned stimuli. As such, predicting the reward associated with the onset of a visual stimulus only requires basic knowledge of the location, likely provided by the SC at short-latency. Our experiments provide a test of both the reward prediction hypothesis and its recent challenge (Redgrave et al., 2007) by determining the circumstances in which the short-latency DA burst can or can not predict the reward values of sensory events. Monkeys were trained to associate different high spatial frequency stimuli (HSF) with unique probabilities of reward. The stimuli were presented in central, fixed peripheral, and random peripheral
130 120 locations on a computer screen while the activity of putative midbrain DA neurons was recorded. In this paradigm, responses with two different latencies were found for HSF stimuli in central locations that are similar to previously reported results for simple-discrimination images presented in random locations (Chapter II). A phasic signal occurring ms after image onset did not differentiate among reward probability associations but rather was a robust signal indicating a salient event had occurred. By contrast, a longer-latency component increased monotonically with reward probability and occurred at a time when, presumably, the stimulus identity is known ( ms after image onset). These data suggest that when knowledge of stimulus identity is required to accurately predict a reward, the phasic dopamine response encodes both sensory salience and reward prediction but at different latencies. The data also suggest that the visual information provided to DA neurons also includes the parvocellular visual pathway. INTRODUCTION Evidence from awake-behaving non-human primate electrophysiology studies indicates that midbrain DA neurons respond with a short-latency, phasic response to critical sensory events in both classical and operant conditioning paradigms in animals (Schultz, 2006). Studies of DA cells in both the substantia nigra pars compacta (SNc) and the ventral tegmental area (VTA) suggest that
131 121 DA responses serve as a signal of reward prediction needed to reinforce behaviors that maximize the acquisition of future rewards (Mirenowicz & Schultz, 1994; Schultz, 1998; Schultz, 2006). This interpretation of DA responses has been widely accepted and inspired numerous models of DA-based associative learning (Suri, 2002; Montague et al., 2004; Frank, 2005). However, this interpretation has recently been challenged by Redgrave and colleagues, who argue that the phasic DA response is more likely a signal of biological salience, a signal suitable for the discovery of actions that are causal to the occurrence of rewarding events (i.e., agency hypothesis) (Redgrave et al., 1999, Redgrave & Gurney, 2006). Redgrave and colleagues argue on the basis of anatomical and physiological evidence that the primary visual input to DA neurons comes from the superior colliculus (SC) rather than extrastriate cortex, and therefore, the type of information available to DA neurons is distinct from that required for signaling reward prediction but consistent with a signal of visual salience. Neurons in the SC are arranged topographically to form maps of visual, auditory, and somatosensory space, and these sensory map, in turn, communicate with closely-aligned SC motor maps to drive gaze shifts that places a peripheral stimulus on the fovea for high-fidelity viewing (see Sparks, 1986; Stein & Meredith, 1993 for reviews). Visual responses in the SC are both short-latency ( ms) and have a strong transient component making them exquisitely sensitive to changes in luminance and/or movement in the periphery. However, SC neurons are relatively insensitive to static features such as wavelength, high
132 122 spatial frequency patterns, and orientation because they receive no direct input from the parvocellular visual system (Sparks, 1986; Stein & Meredith, 1993; Sumner et al., 2002; Vuilleumier et al., 2003). Thus, SC neurons are optimized for detecting, locating, and mediating orienting movements to salient stimuli but have no capacity for detailed feature analysis. The timing of SC visual responses is consistent with a putative role as the drive for the short-latency DA response, a role for which there is now direct anatomical and physiological support. Anatomical studies using anterograde tracers have demonstrated direct projections from the SC to SNc in rats, cats, and, monkeys, with tectonigral terminals contacting DA cells (tyrosine hydroxylase positive) in both the SNc and VTA (Comoli et al., 2003; McHaffie et al., 2006; May et al., 2009). Functional connectivity of this tectonigral circuit has also been established in rats whereby phasic DA activity is dependent on input from the SC (Coizet et al., 2003; Dommett et al., 2005). In rats, urethane anesthesia eliminates responses to light flashes in visual cortex, the SC and DA neurons. Local injection of the GABA antagonist bicuculline reinstates the visual responsiveness of either the visual cortex or the SC. Only reactivation of the SC (not cortex) via bicuculline injection restores the phasic DA response, which indicates that the SC is both necessary and sufficient (i.e., cortex not reactivated) for the visually-evoked phasic DA response (Coizet et al., 2003; Dommett et al, 2005). Moreover, visual stimuli without reward associations evoke DA response. This, along with other studies showing that non-reward related salient events (Horvitz et al., 1997; Horvitz, 2000; Ljungberg et al., 1992) and aversive stimuli
133 123 can trigger phasic DA responses (Coizet et al., 2006; Brischoux et al., 2009; Matsumoto & Hikosaka, 2009), precludes reward-prediction error as the only interpretation of phasic DA output. The reinterpretation of short-latency phasic DA activity proposed by Redgrave and colleagues specifies that DA response is blind to the identity of the visual stimulus at the time they are presumed to confer reward value. Yet, numerous previous studies have shown that the magnitude of this response adapts during the course of associative learning, such that it becomes correlated with the reward probability of the stimulus to which it responds (Fiorillo et al., 2003; Tobler et al., 2003; Tobler et al., 2005). How then can these two alternative interpretations be reconciled? In virtually all relevant nonhuman primate studies, reward associated stimuli were displayed in stereotyped locations (e.g. Fiorillo et al., 2003; Tobler et al., 2005). Specifically, monkeys were trained to expect specific stimuli (associated with specific reward values) in specific spatial locations, thus raising the possibility that the relevant stimulus discriminations (and the associated DA response differences) were not based on discerning stimulus identity but instead determined by stimulus location. Such discrimination might be accomplished very rapidly by the SC by simply sensitizing specific regions of the sensorimotor map over the course of many trials of reward-location associations. Indeed, it is well known that SC sensory responses are enhanced by spatial attention (salient, meaningful stimuli) and habituate when stimuli are known to be irrelevant to behavior (Ikeda & Hikosaka, 2003).
134 124 The alternative interpretation proposed by Redgrave and colleagues yields several critical, but untested, predictions about the circumstances under which DA neurons would or would not reflect the reward probability of stimulus. As an alternative to reward probability, Redgrave et al. have argued that the shortlatency DA response signals stimulus salience. They further posit that the primary visual input to midbrain DA neurons comes from the SC, a structure illsuited for feature analysis but well-suited for detecting and locating salient events. To test this hypothesis, we used HSF stimuli with various reward probabilities (10%, 50%, 90%) associated with pattern orientation. Unlike simplediscrimination images, these stimuli are designed to be heavily biased toward cortical rather than SC processing. If, in fact, the short-latency DA response is derived principally from the SC, HSF images will eliminate the ability of the phasic DA response to discriminate stimuli based on reward value. Our studies suggest that DA neurons encode a biphasic response to stimuli when HSF identity is the key association with reward. An initial short-latency component (50-110ms) responds with equal magnitude to all HSF stimuli that are presented centrally. Alternatively, the late-latency component increases in accord with associated reward values of HSF stimuli. These results support the hypothesis that the late-latency visual information is somehow conveyed to the midbrain dopamine neurons from visual cortex. When HSF stimuli are displayed peripherally, however, the short-latency component of the phasic DA response is absent and the response is shifted toward longer latencies owing to the longer
135 125 evaluation time required by visual cortex or decreased motivation for the subject to perform these trials. MATERIALS AND METHODS Two adult, male rhesus monkeys (Macaca mulatta) were prepared for chronic single-neuron recording. All surgical and experimental procedures were approved by the Wake Forest University School of Medicine Institutional Animal Care and Use Committee (IACUC) and consistent with the National Institutes of Health (NIH) guidelines for the care and use of laboratory animals. The monkeys were housed and maintained in an Association for Assessment and Accreditation of Laboratory Animal Care (AAALAC) accredited facility managed by the Animal Resources Program of the Wake Forest University School of Medicine. Throughout the duration of the experimental sessions, water intake and body weights were monitored to ensure adequate hydration. Behavioral Task The task, shown in Figure 1, was designed to control eye position while visual stimuli were presented at central and peripheral locations. HSF stimuli (Petkov et al., 2007) were used, and the spatial frequency (>3 cycles/deg. of visual angle) and contrast (0.5 = luminance1 - luminance2 / luminance1 + luminance2) of the HSF stimuli Gabor patches were designed to bias the
136 126 discrimination to depend heavily on processing within the parvocellular channel of the ascending visual system (see Schiller et al., 1990). The monkey was seated with head fixed in the straight-ahead position and required to fixate gaze on a central fixation point. The onset of a trial was signaled by a warning buzzer followed by the onset of the fixation stimulus (Panels 1 & 2). The monkey was required to look at the fixation stimulus and maintain fixation for as long as it was present (i.e., the duration of the trial). On any given trial, one of three HSF stimuli, each associated with a different reward probability, was randomly selected for display (Panel 4) for 2 seconds. For example, in this depiction, vertical grating indicates that there is a 90% probability of future reward (p = 0.9), diagonal grating, 50% probability of reward (p = 0.5), and horizontal grating, 10% probability of reward (p = 0.1). Five hundred milliseconds (500ms, Panel 5) after the stimulus was presented a liquid reward was given according to the stimulus probability assignments for that particular experiment (Panel 6). To prevent possible contamination of the reward-related activity by eye movements, the monkey is required to maintain fixation for an additional one second (Panel 7) after the stimulus-associated reward delivery to receive an addition drop of water for completing the trial (Panel 8). The task was explicitly designed to permit quantitative evaluation of DA activity following both the visual stimulus (Panel 4) and the stimulus-associated reward delivery (Panel 6). Thus, the 500 ms period between stimulus presentation and reward delivery and the additional requirement for one second of fixation after stimulus-associated reward delivery precludes the possibility of
137 127 response contamination by providing adequate temporal separation between successive events. In separate blocks of 24 trials each, the experimental sequence was performed with the reward associated stimuli appearing either in central positions (overlapping the fixation point), at an eccentric position of 3 degrees in fixed locations, or at an eccentric position of 3 degrees in random locations. In blocks with peripherally displayed images, stimuli appeared at a single eccentricity, but at directions separated by 45 degrees from fixation. Thus, for example, in the control condition (fixed locations), the horizontal, vertical, and diagonal grated HSF stimuli could have appeared at 0, 45, and -45 (i.e. 315) degrees, respectively. The presentation of stimuli was selected pseudo-randomly to ensure accurate reward-probability associations. Eight trials were assigned to each stimulus with 7 trials rewarded and 1 trial unrewarded for the 90% stimulus, 4 rewarded and 4 unrewarded for the 50% stimulus, and 7 unrewarded and 1 rewarded trial for the 10% stimulus. In the test condition (central and random peripheral locations), stimuli occupied the same 3 directions, but different grating patterns were randomly assigned to these 3 directions. Surgical Procedures Monkeys on inhalant anesthesia were fitted with titanium head-posts and plastic recording cylinders following appropriate sterile surgery techniques. Preoperative Procedures: Animals were restricted of food for 12 hrs before surgery. Prior to preoperative anesthesia, animals received injections of atropine
138 128 ( mg/kg, intramuscular) to control secretions. Surgical sites were shaved and scrubbed before the animal is moved to the operating room. The animal was placed on inhalant anesthesia (isoflurane %). Blood oxygenation level, heart rate, and body temperature were monitored and recorded at 15 minute intervals. Head restraint: Each anesthetized subject was placed in a stereotaxic apparatus, and a sterile field prepared. Skin was incised along the midline and retracted to expose the skull. A post was attached to the skull with titanium surgical screws for restraining the head during experiments. The post and screws were bonded together with sterile orthopedic bone cement. Recording cylinder: Each anesthetized subject was placed in a stereotaxic apparatus and the sterile field prepared. A circular region of scalp was removed to expose the skull. The periosteum was removed, and a circular region of bone was removed using a sterile drill. Placement of the craniotomy was guided by MRI scans for optimal access to substantia nigra pars compacta (SNc). A recording cylinder was placed over the craniotomy, secured using orthopedic bone cement, and anchored with 2-6 stainless steel screws that were threaded into the skull. The interior of the cylinder was flushed with sterile saline, filled with antibiotic solution, and closed with a sterile cap that threads into the cylinder opening.
139 129 Electrophysiological Recording At the beginning of each experimental session, the recording chamber was opened and the electrode positioned using an X-Y translation stage. Structural magnetic resonance imaging (MRI) scans of the monkeys guided placement of the electrode within the cylinder as well as provided estimates of appropriate electrode depth. Once positioned at a particular X-Y coordinate, the dura was pierced with a 21 gauge hypodermic needle, and an epoxylite-coated tungsten microelectrode (1-3 MΩ impedance, FHC Inc., Bowdoin, ME) was advanced through the needle and down to the SNc using an hydraulic microdrive. Amplified and filtered (200 Hz to 3 khz) neural activity was monitored using an oscilloscope and an audio monitor. Estimates of electrode location were determined by monitoring phasic DA activity related to unexpected delivery of liquid reward (given at 2-16 second random intervals). Neuronal responses were characterized as dopaminergic by the presence of long duration waveforms ( ms) and low spontaneous frequency ( spikes/second) (Grace & Bunney, 1983; Romo & Schultz, 1990). Behavioral Measurements Eye movements were sampled at 240Hz using an infrared-based camera tracking system (ISCAN), and eye position tracking software employed to determine eye position during experimental sessions. Monkeys were required to fix their gaze on a red fixation spot presented at the center of the monitor and to maintain fixation throughout each trial. If the subjects diverted their gaze, the trial
140 130 was aborted and restarted following a variable time delay. Licking behavior was measured by a custom designed system that aligns an infrared beam between the monkey s mouth and reward delivery spout. The infrared beam was aimed at a detector sampling at 500Hz. Beam interruption was recorded to determine licking duration (see Figures 5, 6, and 7). Data Acquisition and Analysis A mini-tower computer equipped with National Instruments data acquisition cards (NIDAQ) was used to record analog inputs corresponding to eye position and licking behavior. Single neuron action potentials were isolated with a time/amplitude window discriminator (FHC Inc., Bowdoin, ME) and spike times stored with a resolution of 10 μs. Stimuli were presented by a custom program specifically designed to display behavioral paradigms while simultaneously recording behavioral and neural activity. In this manner, neural activity is synchronized with behavior and the visual task. Custom Matlab scripts and functions (The MathWorks, Inc.) were used for off-line analysis of neural and behavioral data. Analysis of neuronal data was performed at two time points reflective of the biphasic response observed with interspike interval (ISI) peristimulus time histograms (PSTH) for HSF stimuli presented in central locations. Neuronal response latencies to stimuli were verified using a geometric method applied to cumulative sum (Qsum) of spikes curves with a correction for baseline firing rate (Rowland et al., 2007). For detailed analysis, the short-
141 131 latency component of the response was identified as being ms after the onset of stimuli, while the long-latency component occurred at ms. Receiver operating characteristics (ROC) were then used to determine the discrimination latency, i.e. the time at which the neural responses to different stimuli (e.g., 90% vs. 10%) differed significantly as described previously by Wyder et al., Briefly, ROC analysis determined the probability the instantaneous firing frequency in response to the 90% stimulus was greater than the response to the 10% stimulus by calculating a discrimination index (DI) at 5ms intervals between conditions. Analogous to the area under the ROC curve (AUC), the DI was then plotted as a function of time. For example, DI values near 1 indicated near perfect discrimination at the plotted time based on firing rate for the response to the 90% stimulus verses the 10% stimulus, while values near 0.5 indicate no discrimination between neural responses for the stimuli. The discrimination time was the time at which the neural response was significantly different (p<0.01) for the stimuli than would be expected by chance as determined by a permutation test of 5000 random repetitions. A selectivity index was calculated for individual neurons for the biphasic neural response to HSF stimuli presented in central locations to compare the early and late latency components of the response. The index took the difference of the neuronal response to 90% and 10% stimuli divided by the sum (rate_90%-rate_10%/rate_90%+rate_10%), and the result indicated the difference in neuronal responses to the stimuli. Selectivity index values closer to 1 indicate greater response to the 90% stimulus, and values closer to -1 indicate
142 132 a greater response to the 10% stimulus. Different time windows were used to compare the responses of individual neurons at the early (50-110ms) and late ( ms) latencies of the biphasic dopamine response. RESULTS A total of 57 neurons (45 neurons monkey L; 12 neurons monkey S) were studied that exhibited typical characteristics of dopamine neurons. All neurons displayed action potentials with wide waveforms, low spontaneous firing rates, and responded with phasic bursts to delivery of unexpected rewards. All neurons included for analysis exhibited similar triphasic, wide action potential waveforms (Figure 2). Waveforms were averaged from individual action potentials of neurons for which we have stored waveform data (n=56). Additionally, all included neurons had low spontaneous firing rates (Figure 3). Accurate identification of dopamine neurons is critical for in vivo electrophysiology studies investigating the activity of dopamine neurons in realtime. While the electrophysiological characteristics of dopamine neurons used to classify neurons in real-time (long action potential waveforms, low spontaneous firing frequency, and phasic activity to unexpected reward) are widely accepted, additional structural studies are important to confirm that the location from which dopamine neurons are recorded corresponds with substantia nigra pars compacta. We used magnetic resonance imaging (MRI) while monkey L had an electrode implanted at a location 7 mm dorsal to the site of typical recordings
143 133 from both monkeys. The electrode shadow detected by MRI suggested our recordings were consistent with dopamine neurons from the SNc. Interpretation of the single neuron data requires a quantifiable behavioral measure to indicate that the monkey has identified the stimulus and its reward value. Thus, anticipatory licking of the reward delivery spout was quantified by measuring the duration of licking from the time of image onset up to the time point of possible reward. Figure 5 illustrates the anticipatory licking results for both monkeys with HSF stimuli presented centrally (Monkey L, solid blue; Monkey S, dashed red) and plots number of licks counted during the 2.5s period from stimulus onset to reward delivery as a function of the reward probability associated with 3 different stimuli (p reward = 0.1 [10%]; p reward = 0.5 [50%]; p reward = 0.9 [90%]). Figure 6 displays licking duration for trials when images were displayed at fixed peripheral locations, while Figure 7 shows trials with images placed in random peripheral locations. Note that anticipatory licking increased in direct proportion to the probability of reward delivery in both conditions and provides a behavioral verification that the monkey is able to predict reward outcome upon stimulus presentation. Figure 8 depicts the activity of a representative putative dopamine cell to unexpected rewards, and meets the electrophysiological criteria for dopamine neurons (see methods). Figure 9 plots the responses of the same neuron to HSF stimuli presented in central locations and associated with reward probabilities of 10% (top), 50% (middle), and 90% (bottom). A hallmark for putative reward predicting neurons, phasic DA activity increased monotonically
144 134 with increasing reward probability, although the response latencies appeared longer than latencies for simple-discrimination stimuli (see Chapter II). Figure 10 plots the responses of a different neuron to HSF stimuli presented in central locations. Note that this neuron has a distinct biphasic response to the 50% (middle), and 90% (bottom) stimuli, which suggests the biphasic response occurs in individual neurons. Figure 11 plots the responses of the same neuron as in Figure 9 to HSF stimuli presented in fixed peripheral locations and associated with reward probabilities of 10% (top), 50% (middle), and 90% (bottom). Figure 12 plots the responses of the same neuron as in Figure 10 to HSF stimuli presented in fixed peripheral locations and associated with reward probabilities of 10% (top), 50% (middle), and 90% (bottom). Figure 13 plots the responses of a single neuron to HSF stimuli presented in random peripheral locations and demonstrates a protracted time course for the neuronal response ( ms) to 50% and 90% stimuli indicating that the responses on a trial-by-trail basis are likely de-synchronized to stimulus onset. Dopamine neurons responded to HSF images presented in central locations (Figure 14) with a biphasic pattern. The first component of the response at ms did not correlate with the reward-values of stimuli, while the late-latency component ( ms) increased monotonically for increasing reward-value. Neural responses are similar to data previously described for simple-discrimination images displayed in fixed and random locations (Figures 10 and 12, Chapter II). Responses to reward delivery decreased monotonically with increasing expectation of reward (Figure 15) and encoded positive reward
145 135 prediction error, a hallmark of dopamine neurons. A single image location is used for all stimuli in these trials, thus eliminating location-specific predictive information. The short-latency component of the biphasic visual response to centrally located images does not differentiate between the three images (Figure 16, red). The late-latency component did differentiate between the stimuli and increased monotonically with associated reward probability (Figure 16, solid blue), suggesting that late-latency visual information provided to midbrain dopamine neurons is derived from regions receiving parvocellular information (i.e., visual cortex). Response to reward delivery decreases monotonically with increasing reward expectation (Figure 16, dashed blue) and follows the reward prediction error hypothesis. A selectivity index comparing phasic activity of neurons for 90% and 10% stimuli at short-latency (Figure 17) demonstrated that most neurons do not differentiate between the two stimuli. These data suggest that the response likely reflects saliency and not reward prediction. In contrast, a selectivity index analyzing phasic activity of neurons to 90% and 10% stimuli at long-latency (Figure 18) indicates that most neurons preferentially respond to the 90% stimulus at the later latency time-point, which could serve as a rewardprediction signal. Presenting HSF stimuli in fixed (Figure 19) and random (Figure 22) peripheral locations (3 degrees from fixation), however, has an impact on the short-latency response. The latency of the initial burst of dopamine activity occurred later, and the response is less distinct than for HSF stimuli presented in central locations (Figure 14). A sustained component of the response was
146 136 observed for both 50% and 90% stimuli presented in fixed (Figure 20) and random (Figure 23) locations. Response to reward delivery for both fixed (Figure 21) and random (Figure 24) peripheral locations follows reward prediction error characteristics, decreasing in magnitude with increasing expectation of reward. The short-latency response appeared less distinct for monkey L in both average responses to fixed peripheral locations (Figure 25) and random peripheral locations (Figure 26), but remained distinctly apparent in neural data from monkey S in both conditions (Figure 27, Figure 28). The differences may be a reflection of the relative training status of each monkey (monkey L late training stage; monkey S early training stage) or in differences in individual motivation for these HSF trials in which discrimination is more difficult (see discussion). Although the short-latency response to HSF stimuli presented in peripheral locations is minimal for monkey L in the late-training analysis (Figure 25, Figure 26), the short-latency response is present in early training trials that were not included in Figure 19 and Figure 22 averages. Monkey L was incapable of discriminating the HSF stimuli in these early training trials, because the images initially used were likely too small to discriminate the grating pattern orientations. Consequently, monkey L only associated location with reward and not stimulus identity, which is clear in his anticipatory licking for rewarded locations (Figure 29) rather than reward-probability based on stimulus identity (Figure 30) in random peripheral locations. Enlarging the HSF stimuli on subsequent training trials enabled this monkey to discriminate between the
147 137 grating pattern orientations. These early training trials demonstrate that in situations where the subject associates location with reward, the short latency phasic dopamine response reflects the subject s perception of rewardassociation for stimuli (Figure 31), increasing in magnitude to stimuli for which the subject s anticipatory licking is greatest. When stimuli were presented at random peripheral locations, the short-latency phasic dopamine response (Figure 32) and anticipatory licking (Figure 30) failed to reflect the reward probabilities of the stimuli since location was the only reliable cue during these trials. One possible explanation for the reduced short-latency phasic burst in late-training trials with peripherally presented HSF stimuli is a decrease in motivation of monkey L to perform these trials. Indeed, the subject had decreased anticipatory licking behavior in late-training (red dashed) compared to early training (blue solid) trials (Figure 33), presumably reflecting decreased motivation. An additional interesting finding from these results suggests that midbrain dopamine neurons follow the subject s perceived reward-values rather than actual reward values. The greatest magnitude phasic dopamine response occurs to the 50% stimulus (Figure 31, magenta), which follows the subject s greatest anticipatory licking to the 50% stimulus (Figure 29). To determine the discrimination latencies of the dopamine neurons, receiver operating characteristic curves (ROC) identified that a significant discrimination between responses to 90% and 10% HSF stimuli in central locations occurred at 115 ms for monkey L and 225 ms for Monkey S (Table 2, Figure 34, Figure 35). Note that the discrimination latency is within the late-
148 138 latency burst of phasic dopamine activity (~ ms), adding support to the argument that only the late-latency component of the phasic dopamine response corresponds with the reward probabilities of the associated stimuli. Contrasting discrimination latencies of the dopamine response to HSF images with latencies for simple-discrimination stimuli in fixed locations (90 ms monkey L, 85 ms monkey S, see Figure 34) demonstrates that discrimination time is longer for the complex HSF stimuli in central locations (115 ms monkey L, 225 ms monkey S) and increases when HSF stimuli are located peripherally (130 ms fixed peripheral, 170 ms random peripheral - Monkey L,) and is seen in the ROC curves (Figures 36, 37, and 38. Additionally, note that discrimination based on neural activity is greatest for comparisons between 90% and 10% HSF stimuli in central locations (Figure 35). Figure 38 displays the discrimination between 90% and 50% stimuli. Note that the discrimination between 90% and 50% stimuli is low across all conditions (Figure 38) when compared to responses between 90% and 10% stimuli (Figure 36) and responses between 50% and 10% stimuli (Figure 37), a likely indication that neuronal responses do not perfectly differentiate between stimuli with higher reward probabilities. Thus, it is unclear how precisely DA neurons are capable of encoding a reward prediction to maximize reward, and consequently may suggest DA neurons encode a motivational salience value rather than pure reward predictions.
149 139 CONCLUSIONS & DISCUSSION A principal difference between the reward prediction and the behavioral salience interpretations of DA function is the source of input to DA neurons in SNc. The former requires that DA neurons be informed by the outcome of cortical visual analysis whereas the latter purports that the main input to DA neurons derives from the midbrain SC (Redgrave & Gurney, 2006). To differentiate between these alternatives, we used isoluminent high-spatial frequency images with Gabor patches that differ only in orientation. The spatial frequency (>3 cycles/deg. of visual angle) and contrast (0.5 = luminance1 - luminance2 / luminance1 + luminance2) of the patches were chosen to bias the discrimination to depend heavily on processing within the parvocellular channel of the ascending visual system (see Schiller et al., 1990). The use of these stimuli provided a strong test of the two alternatives by virtually eliminating the SC as a potential source of information pertaining to the sensory discrimination, owing to its lack of parvocellular representation (Sparks, 1986; Stein & Meredith, 1993; Sumner et al., 2002; Vuilleumier et al., 2003). Since the visual discrimination necessary to predict reward value (Gabor patch orientation) cannot be the product of processing within the SC, the correlation between reward expectation and DA response magnitude when no reward-location association exists will be completely eliminated if, in fact, the drive to DA neurons derives solely from the SC (Redgrave & Gurney, 2006). Alternatively, the reward prediction interpretation predicts that DA response
150 140 magnitude will once again correlate with reward probability/expectation despite an absent reward-location association. Our results indicate that with HSF stimuli presented centrally, midbrain dopamine neurons respond to the salient appearance of the HSF stimuli equally for all three reward probabilities, but also encode reward predictions at later latencies at the time visual cortex is able to update dopamine neurons about the identity of the stimuli. These data support the hypothesis that the short-latency visual response of dopamine neurons derives from the SC, while the source of the late-latency visual response is visual cortex. While it is clear that the late-latency phasic dopamine neuron response magnitude is capable of differentiating HSF stimuli with different reward probabilities, interestingly the responses appear only to encode saliency and reward predictions when the HSF images are located centrally. Additionally, the response to HSF stimuli in central locations displays a similar biphasic pattern as seen in our prior study using simple-discrimination stimuli (see Chapter II), indicating that the dopamine neurons signal both saliency and reward prediction. Displaying HSF stimuli at 3 degrees from fixation point, however, precludes fast discrimination of the stimuli and consequently fails to elicit a robust short latency phasic dopamine response. It is already established that dopamine neurons exhibit decreasing short-latency phasic responses when subjects are less motivated (Satoh et al., 2003). Therefore, the most likely explanation for the decreased phasic dopamine response in peripheral location trials is the decreased motivation of the monkeys; particularly monkey L, resulting from
151 141 greater discrimination difficulty as measured by decreased anticipatory licking of monkey L in late-stage training trials (Figure 33). An additional interesting aspect of this experiment relates to DA response latency and a comparison of the visual stimulus response latencies. If, in fact, DA activity reflects reward prediction based on stimulus identity, one would expect the timing of this signal to depend on the difficulty of the discrimination i.e, more difficult discriminations require more time thus leading to delayed DA responding. The results from this study suggest the phasic activity of DA neurons is capable of predicting reward for the late-latency ( ms) component of the visual response for the centrally presented HSF images and at longer latencies when HSF stimuli are displayed peripherally. If the SC provides saliency information to dopamine neurons, the appearance of any salient stimulus regardless of SC discrimination capability would be expected to elicit a short-latency response. An unexpected result from the current study was found in decreased short-latency DA activity observed for HSF images displayed 3 degrees from the fixation point in neurons recorded from Monkey L. Initially, however, the short latency visual response to the peripherally presented HSF stimuli was apparent for Monkey L in the early stages of training (Figure 31). The loss of this short-latency signal appears to be related to the motivational status of the monkey. Compared to the initial training sessions, the monkey licked with much less frequency in the trials in which the short latency visual response is absent (Figure 33), perhaps reflecting the increased difficulty of stimulus discrimination and subsequent lack of motivation.
152 142 Although the short latency burst is markedly reduced in monkey L for HSF stimuli presented in peripheral locations, anticipation encoded by the neurons as an elevation of average baseline firing rate during the period between stimulus onset and reward delivery for the 50% and 90% images persists (Figure 20). The anticipatory activity begins around 120 ms after the onset of stimuli, which is consistent with cortical processing having proceeded to an extent to determine the reward probabilities associated with the image features. The anticipatory activity fails to distinguish between the 50% and 90% stimuli, and thus likely does not encode uncertainty as previously reported by Fiorillo and colleagues (Science, 2003). In that study, anticipatory activity was only apparent for the 50% stimulus, and therefore the authors concluded that the baseline elevation was encoding uncertainty about future reward since reward is most uncertain for 50% probability. Our data suggest that the elevation of baseline firing might instead be associated with an attention process to ensure that all potential future reward is received by modifying behaviors required for the task (e.g. greater anticipatory licking). After extensive training using the three stimuli for the study in Chapter II, HSF stimuli were presented for the first time while recording from a dopamine neuron (Figure 39). In contrast to the neuron s response to simple-discrimination stimuli (Figure 40), the neuron responds more robustly to the novel HSF stimuli (Figure 39). Additionally, it is important to note that the neuron responds to all sensory events contained in the trial (stimulus onset, offset, and reward delivery) indicating that the currently accepted model of the dopamine neuron conditioning
153 143 shift depicted in Figure 1 may be inaccurate. Instead, it is likely that dopamine neurons initially respond robustly to all novel sensory events, as do SC neurons. Once those sensory events are determined to be less motivationally salient or reward-related (i.e. 10% and 50% stimuli), the response decreases in magnitude, while the response is maintained for high motivationally salient stimuli (i.e. 90% rewarded stimulus). These data further support a role for the superior colliculus in the visual response of dopamine neurons, since the superior colliculus is known to initially respond to novel stimuli but will eventually habituate for distracters not associated with reward (low-motivational salience) in contrast to target stimuli that are highly motivationally salient given their association with reward (Kim & Basso, 2008). In summary, these results indicate that dopamine neurons receive updated information about stimulus reward value at later latencies from brain regions that receive parvocellular visual channel information. In addition, shortlatency phasic dopamine neuron responses encode saliency in that they initially respond robustly to the appearance of all stimuli regardless of learned reward probability, and that only at later latencies do the neuronal responses correspond with reward value of the stimuli in a manner consistent with the reward prediction hypothesis. The results also add evidence that the short-latency response is linked to subject motivation as one previous study reported (Satoh et al., 2003), and that the responses of midbrain dopamine neurons signal the occurrence of novel events.
154 144 Dopamine Neuron Properties Monkey L Monkey S Significant phasic activity to reward (p<<0.01) 100% (46/46) 100% (12/12) Mean spontaneous firing ± SD (spikes/sec) 4.46 ± ± 2.52 Mean waveform width ± SD (ms) ± ± Table 1 Significant phasic activity to unexpected reward delivery (reward delivered at random intervals between 2-16 seconds) was determined by a Wilcoxon rank-sum test (p << 0.01, all neurons). Mean action potential spike counts of dopamine responses to unexpected reward (analysis window of 50 to 300ms after reward delivery) were compared to baseline firing spike counts (analysis window of -300 to -550 prior to reward delivery) for each individual neuron. Additionally, note that spontaneous firing rate and waveform width means and standard deviations are similar for both monkeys, an indication of homogeneity of electrophysiological characteristics of dopamine neurons between individual monkeys.
155 145 Discrimination latency: Monkey L Monkey S HSF centered 90% vs. 10% Stimulus % vs. 50% Stimulus % vs. 10% Stimulus 155 HSF peripheral fixed 90% vs. 10% Stimulus % vs. 50% Stimulus % vs. 10% Stimulus HSF peripheral random 90% vs. 10% Stimulus % vs. 50% Stimulus 50% vs. 10% Stimulus 310 Table 2 Discrimination latencies in milliseconds were determined by receiver operating characteristic discrimination index (DI) analysis comparing conditions in each 5ms interval and a permutation test to assess at what time the DI becomes significantly different than what would be expected by chance.
156 146 Response latency Monkey L Monkey S HSF centered 10% Stimulus % Stimulus % Stimulus HSF peripheral fixed 10% Stimulus NR* % Stimulus % Stimulus HSF peripheral random 10% Stimulus NR* % Stimulus % Stimulus Table 3 Response latencies in milliseconds were determined by a geometric method to detect the deflection angle on a cumulative sum of spikes curve (Qsum) caused by post-stimulus firing rate changes corrected for baseline firing rate (Rowland et al., 2007). Shown are the ranges of the phasic responses from onset to offset. Stimulus offset is the time at which the Qsum slope decreases toward zero. NR* indicates conditions for which the Qsum algorithm did not detect a response greater than pre-stimulus baseline firing rate.

157 Figure 1 147
158 148 Figure 1 Monkeys were trained to associate distinct high spatial frequency (HSF) conditioned stimuli (CS) with unique probabilities of reward (0.9, 0.5 and 0.1). The orientation of HSF grating patterns provides reward probability information (e.g., vertical grating associated with 90% reward, horizontal grating 10% reward, and oblique grating 50% reward). In some blocks of trials, CS location was randomized, while in other blocks, CS identity and location were yoked. HSF images were placed in central locations overlapping the fixation point and at random and fixed locations 3 visual degrees from the fixation point. Random and fixed location blocks were interleaved and monkeys were not cued about the nature of a given block. A low-pitched buzzer signaled the start of a trial, and monkeys were given up to 2 s to acquire a central stimulus (red dot). After 500 ms, a CS was displayed for 2 s, followed by an additional 500ms delay before the reward was administered according to the scheduled reward probability. After an additional 1s delay, monkeys were rewarded for maintaining fixation for the completion of the trial. HSF Images were counterbalanced between monkeys to ensure that the neurons respond to the associated reward probabilities of each image and not the unique physical properties of the stimuli.
159 149 1 Dopamine Neuron Waveforms n = Volts Time (ms) Figure 2 Averaged action potential waveforms normalized to peak amplitude from 56 individually recorded neurons. All neurons included for analysis exhibited similar triphasic waveforms, which are indicative of DA neurons.
160 Spontaneous Freq. vs. Waveform 14 Spontaneous Firing (spk/sec) Peak Waveform to Peak Waveform width (ms) (ms) Figure 3 Plotting spontaneous firing frequency against waveform demonstrates a population consistent for characteristics typical of dopamine neurons (low spontaneous firing rates, and wide action potential waveforms). Orange points are neurons from monkey S, blue are neurons from monkey L. Waveform widths were measured from the first to the second negative deflection of the triphasic waveforms (Figure 2). Discrete values of waveform widths at 0.6ms result from equipment limitations at the time those neurons were recorded. Waveform information for those neurons was stored using video recordings of individual action potentials displayed on the oscilloscope, and waveform width values were estimated by reviewing those videos.
161 Figure 4 151
162 152 Figure 4 We obtained MR imagery of monkey L with an electrode implanted at a location 7 mm dorsal to the site of typical dopamine neuron recordings from both monkeys in order to establish a structural location of recording. The MR image (right) shows a shadow of the electrode located just dorsal to the substantia nigra pars compacta as compared to a rhesus macaque histology slide on the left (Mikula et al., 2009). The red star on the MR image depicts the typical recording depth of putative dopamine neurons, confirming that the region from which we recorded dopamine neurons is located within the substantia nigra. The blue star depicts the electrode tip, and the approximate location corresponding with rhesus macaque histology. SNc = substantia nigra pars compacta.
163 153 Figure 5 Classical conditioning assessed by licking behavior of monkey L (solid blue, left y-axis) and monkey S (dashed red, right y-axis) to HSF stimuli in central locations. Anticipatory licking increased linearly for stimuli conditioned with higher probabilities of reward (mean ± SEM). Licking behavior was determined by counting the number of licks (i.e. number of times the tongue breaks the infrared beam between the monkeys mouths and the reward spout) the monkeys perform within the 2.5 second period between stimulus onset and reward delivery.
164 154 Anticipatory licking HSF fixed peripheral locations Figure 6 Classical conditioning assessed by licking behavior of monkey L (solid blue, left y-axis) and monkey S (dashed red, right y-axis) to HSF stimuli in fixed peripheral locations. Anticipatory licking increased linearly for stimuli conditioned with higher probabilities of reward (mean ± SEM), with the exception of the licking behavior for monkey S (greatest for 50% stimulus). Licking behavior was determined by counting the number of licks (i.e. number of times the tongue breaks the infrared beam between the monkeys mouths and the reward spout) the monkeys perform within the 2.5 second period between stimulus onset and reward delivery.
165 155 Anticipatory licking HSF random peripheral locations Figure 7 Classical conditioning assessed by licking behavior of monkey L (solid blue, left y-axis) and monkey S (dashed red, right y-axis) to HSF stimuli in random peripheral locations. Anticipatory licking increased linearly for stimuli conditioned with higher probabilities of reward (mean ± SEM). Licking behavior was determined by counting the number of licks (i.e. number of times the tongue breaks the infrared beam between the monkeys mouths and the reward spout) the monkeys perform within the 2.5 second period between stimulus onset and reward delivery.
166 156 Figure 8 Dopamine neuron (#49) activity to delivery of unexpected reward (red line, time=0 ms) delivered at random intervals of 2-16 seconds in length. Spike density histogram (above) is smoothed with a Gaussian kernel σ = 6ms. Spike raster (below) represents individual action potentials as each tick mark, and each row of tick marks is one trial. All neurons included for analysis exhibited this characteristic.
167 Figure 9 157
168 158 Figure 9 Dopamine neuron (#49) activity to onset of HSF stimuli (red line, time=0 ms) that were presented in central locations. Spike density histograms (top panels) are smoothed with a Gaussian kernel σ = 6ms and depicts a shifted latency effect, with the robust activity to the 90% stimulus occurring at a delayed latency ~250ms after its onset. Spike rasters (below histograms) represent individual action potentials as each tick mark, and each row of tick marks is one trial.
169 Figure
170 160 Figure 10 Dopamine neuron (#40) activity to onset of HSF stimuli (red line, time=0 ms) that were displayed in central locations. Spike density histograms (top panels) are smoothed with a Gaussian kernel σ = 6ms. Spike rasters (below histograms) represent individual action potentials as each tick mark, and each row of tick marks is one trial. Note a distinct biphasic neuronal response to stimulus onset for 50% and 90% stimuli.
171 Figure
172 162 Figure 11 Dopamine neuron (#49) activity to onset of HSF stimuli (red line, time=0 ms) that were presented in fixed peripheral locations. Spike density histograms (top panels) are smoothed with a Gaussian kernel σ = 6ms. Spike rasters (below histograms) represent individual action potentials as each tick mark, and each row of tick marks is one trial.
173 Figure
174 164 Figure 12 Dopamine neuron (#40) activity to onset of HSF stimuli (red line, time=0 ms) that were in fixed peripheral locations. Spike density histograms (top panels) are smoothed with a Gaussian kernel σ = 6ms. Spike rasters (below histograms) represent individual action potentials as each tick mark, and each row of tick marks is one trial. Note the protracted time course ( ms) of the response to the 90% stimulus, which may indicate that peripherally displayed HSF stimuli de-synchronize the phasic dopamine response on a trial-by-trial basis as a reflection of increased discrimination difficulty.
175 165
176 166 Figure 13 Dopamine neuron (#53) activity to onset of HSF stimuli (red line, time=0 ms) that were in random peripheral locations. Spike density histograms (top panels) are smoothed with a Gaussian kernel σ = 6ms. Spike rasters (below histograms) represent individual action potentials as each tick mark, and each row of tick marks is one trial.
 activity to the onset of HSF stimuli displayed in central locations (green = 10% stimulus; magenta = 50%; blue = 90%).")
177 167 Figure 14 Population spike density histogram (neuron firing rates convolved with a Gaussian kernel of σ = 6ms, shaded regions are standard errors about the mean) of 57 putative dopamine neurons (45 neurons monkey L; 12 monkey S) activity to the onset of HSF stimuli displayed in central locations (green = 10% stimulus; magenta = 50%; blue = 90%). A biphasic response to the onset of the stimuli is observed. The first response at ms does not correlate with the predictive reward-values of the three images, while the second response ( ms) increases monotonically for increasing reward value.
 activity to reward delivery for HSF stimuli displayed in central locations (green = 10% stimulus; magenta = 50%; blue = 90%).")
178 168 Figure 15 Population spike density histogram (neuron firing rates convolved with a Gaussian kernel of σ = 6ms, shaded regions are standard errors about the mean) of 57 putative dopamine neurons (45 neurons monkey L; 12 monkey S) activity to reward delivery for HSF stimuli displayed in central locations (green = 10% stimulus; magenta = 50%; blue = 90%). Phasic dopamine neuron activity decreases monotonically with increasing reward probability and signals reward prediction error, a hallmark of midbrain dopamine neurons. The most robust reward prediction error signal occurs to delivery of unexpected reward for low probability stimulus (10% stimulus, green).
179 169 Figure 16 Neuronal activity was averaged from ms after the onset of stimuli for the early component (solid red), from ms after the onset of stimuli for the late component (solid blue), and from ms after the delivery of reward (dashed blue). Mean firing rate (± SEM) for early component is similar for all HSF stimuli presented in central locations (solid red) whereas the mean firing rate for the late component (solid blue) increases monotonically with CS reward probability. Activity for reward delivery (dashed blue) is inversely related to reward probability and is consistent with a signal that encodes reward prediction error.
.")
180 170 Figure 17 A selectivity index relates the magnitude of activity evoked for the 90% and 10% HSF stimuli in central locations according to the formula (rate90- rate10/rate90+ rate10). The index was computed for each individual neuron s early component at ms after stimulus onset (57 neurons total; 45 neurons monkey L; 12 neurons monkey S). Some neurons do not exhibit activity at long latency to both 90% and 10% stimuli, and consequently lack a selectivity index (division by zero error, 6 neurons). In contrast to the late component (Figure 18), the early component, values were distributed around zero, indicative of insensitivity to reward probability.
181 171 Figure 18 A selectivity index relates the magnitude of activity evoked for the 90% and 10% HSF stimuli in central locations according to the formula (rate90- rate10/rate90+ rate10). The index was computed for each individual neuron s late response component at ms after onset of stimuli (57 neurons total; 45 neurons monkey L; 12 neurons monkey S). Some neurons do not exhibit activity at long latency to both 90% and 10% stimuli, and consequently lack a selectivity index (division by zero error, 5 neurons). In contrast to the early component (Figure 17), the late component shows a trend toward positive values, indicative of greater activity for the CS predicting high likelihood of reward. Time windows for the selectivity index are ms (early), and ms (late). Late latency selectivity index mean is significantly different from short latency selectivity index mean (p = , Student s t-test).

182 Figure
183 173 Figure 19 Population spike density histogram (neuron firing rates convolved with a Gaussian kernel of σ = 6ms, shaded regions are standard errors about the mean) of 31 putative dopamine neurons (26 neurons monkey L; 7 monkey S) activity to the onset of HSF stimuli displayed 3 visual degrees from the fixation point in fixed locations. A biphasic response to the onset of stimuli is not as apparent as in the case of centrally located stimuli (Figure 14). Instead, a delayed burst of activity appears beginning ~150ms after onset of the images. A relatively short-latency burst at ms after the onset of stimuli is apparent, although the time-course of the response varies between stimuli. The highest magnitude response occurs for the 90% stimulus at 300ms and indicates either an exaggerated increase in visual processing time required to analyze the HSF at peripheral locations or variability of phasic activity among individual neurons.
184 174 Time (ms) Figure 20
185 175 Figure 20 Population spike density histogram (neuron firing rates convolved with a Gaussian kernel of σ = 6ms of 31 putative dopamine neurons (26 neurons monkey L; 7 monkey S) activity to the onset of HSF stimuli displayed 3 visual degrees from the fixation point in fixed locations, with the analysis window extended to 2 seconds after onset of the stimuli. Sustained activity is visible for the 50% and 90% stimuli, corresponding to an elevation in baseline firing rates.
 activity to reward delivery for HSF stimuli displayed 3 degrees from the fixation point in fixed locations (green = 10% stimulus; magenta = 50%; blue = 90%).")
186 176 Figure 21 Population spike density histogram (neuron firing rates convolved with a Gaussian kernel of σ = 6ms, shaded regions are standard errors about the mean) of 31 putative dopamine cells (26 neurons monkey L; 7 monkey S) activity to reward delivery for HSF stimuli displayed 3 degrees from the fixation point in fixed locations (green = 10% stimulus; magenta = 50%; blue = 90%). Phasic dopamine neuron activity decreases monotonically with increasing reward probability, and signals reward prediction error, a hallmark of midbrain dopamine neurons. The most robust reward prediction error signal occurs to delivery of unexpected reward for low probability stimulus at ms (10% stimulus, green).
 activity to the onset of HSF stimuli displayed 3 visual degrees from the fixation point in random locations.")
187 177 Figure 22 Population spike density histogram (neuron firing rates convolved with a Gaussian kernel of σ = 6ms, shaded regions are standard errors about the mean) of 23 putative dopamine neurons (16 neurons monkey L; 7 monkey S) activity to the onset of HSF stimuli displayed 3 visual degrees from the fixation point in random locations. A synchronized biphasic response to the onset of the stimuli is not observed for all three stimuli in contrast to centrally located stimuli. Instead, similar to HSF stimuli displayed in fixed peripheral locations, delayed and repeated burst firing occurs beginning ~150ms after onset of the image distinguishes most readily distinguishable for the 90% stimulus.
188 Figure
189 179 Figure 23 Population spike density histogram (neuron firing rates convolved with a Gaussian kernel of σ = 6ms of 23 putative dopamine neurons (16 neurons monkey L; 7 monkey S) activity to the onset of HSF stimuli displayed 3 visual degrees from the fixation point in random locations. Extending the analysis window to 1000ms reveals delayed and repeated burst firing beginning around 100ms after stimulus onset and persists for the 90% and 50% stimuli.
 activity to reward delivery for HSF stimuli displayed 3 degrees from the fixation point in random locations (green = 10% stimulus; magenta = 50%; blue = 90%).")
190 180 Figure 24 Population spike density histogram (neuron firing rates convolved with a Gaussian kernel of σ = 6ms, shaded regions are standard errors about the mean) of 23 putative dopamine cells (16 neurons monkey L; 7 monkey S) activity to reward delivery for HSF stimuli displayed 3 degrees from the fixation point in random locations (green = 10% stimulus; magenta = 50%; blue = 90%). Phasic dopamine neuron activity decreases monotonically with increasing reward probability, and signals reward prediction error, a hallmark of midbrain dopamine neurons. The most robust reward prediction error signals occur to delivery of unexpected reward for low probability stimuli (10% stimulus, green; 50% stimulus, magenta).
. A biphasic response to the onset of the stimuli is observed.")
191 181 Figure 25 Population spike density histogram (neuron firing rates convolved with a Gaussian kernel of σ = 6ms, shaded regions are standard errors about the mean) of 26 dopamine neurons (monkey L) activity to the onset of HSF stimuli displayed in fixed peripheral locations (green = 10% stimulus; magenta = 50%; blue = 90%). A biphasic response to the onset of the stimuli is observed. The first response at ms does correlate with the predictive reward-values of the three images, and a second burst 300 ms occurs for the 90% stimulus.
 of 26 dopamine neurons (monkey L) activity to the onset of HSF stimuli displayed in random peripheral locations (green = 10% stimulus; magenta = 50%; blue = 90%).")
192 182 Stimulus onset - HSF random peripheral locations Monkey L Figure 26 Population spike density histogram (neuron firing rates convolved with a Gaussian kernel of σ = 6ms, shaded regions are standard errors about the mean) of 26 dopamine neurons (monkey L) activity to the onset of HSF stimuli displayed in random peripheral locations (green = 10% stimulus; magenta = 50%; blue = 90%). A distinct phasic burst for 90% and 50% stimuli occurs at ms after onset of the stimuli.
 of 7 dopamine neurons (monkey S) activity to the onset of HSF stimuli displayed in fixed peripheral locations (green = 10% stimulus; magenta = 50%; blue =")
193 183 Figure 27 Population spike density histogram (neuron firing rates convolved with a Gaussian kernel of σ = 6ms, shaded regions are standard errors about the mean) of 7 dopamine neurons (monkey S) activity to the onset of HSF stimuli displayed in fixed peripheral locations (green = 10% stimulus; magenta = 50%; blue = 90%).
 of 7 dopamine neurons (monkey S) activity to the onset of HSF stimuli displayed in random peripheral locations (green = 10% stimulus; magenta = 50%; blue =")
194 184 Figure 28 Population spike density histogram (neuron firing rates convolved with a Gaussian kernel of σ = 6ms, shaded regions are standard errors about the mean) of 7 dopamine neurons (monkey S) activity to the onset of HSF stimuli displayed in random peripheral locations (green = 10% stimulus; magenta = 50%; blue = 90%).
195 Licking Duration - HSF Random Locations - Sorted by Location normalized licking duration reward probability location Figure 29 Anticipatory licking for monkey L early training trials for HSF stimuli placed in random peripheral locations demonstrates greater anticipation of reward when any image appears in the previously high-rewarded locations (top and bottom locations) during fixed peripheral location trials. Therefore, the monkey only understands a location-reward association at this stage of training and is either incapable of detecting or has not learned the stimulus-reward associations based on stimulus identity. Trials were sorted by reward-location associations that were previously over-trained in fixed location-reward trials. The top position was associated with 90% probability of reward, middle position with 10% probability, and bottom position with 50% probability. Licking duration is normalized to the maximum licking per trial.
196 Licking Duration - HSF Random Locations - Sorted by Probability 0.9 normalized licking duration reward probability Figure 30 Anticipatory licking for monkey L early training trials for HSF stimuli placed in random peripheral locations demonstrates the no distinction between the three stimuli when sorted by image probability. Therefore, the monkey only knows a location-reward association at this stage of training and is either incapable of detecting or has not learned the stimulus-reward associations based on stimulus identity. Licking duration is normalized to the maximum licking per trial.
197 HSF Stimulus Onset p = 0.1 p = 0.5 p = 0.9 Spikes / sec Time (msec) Figure 31 Population spike density histogram (neuron firing rates convolved with a Gaussian kernel of σ = 6ms) of 7 putative dopamine neurons (monkey L) activity to the onset of HSF stimuli displayed 3 degrees from the fixation point in fixed locations. The monkey was unable to discriminate the HSF stimuli likely due to the small image sizes and his visual acuity. As a result, the neurons and the monkey are signaling reward probabilities associated with location and not stimulus identity. In this case, the short latency burst follows the reward prediction associated with the monkey s perceived highest reward-value location (50% stimulus location) as indicated by his licking behavior (Figure 33) A biphasic response to the onset of the stimuli is observed.
198 HSF Stimulus Onset p = 0.1 p = 0.5 p = Spikes / sec Time (msec) Figure 32 Population spike density histogram (neuron firing rates convolved with a Gaussian kernel of σ = 6ms) of 7 putative dopamine neurons (monkey L) activity to the onset of HSF stimuli displayed 3 degrees from the fixation point in random locations. The monkey was unable to discriminate the HSF stimuli likely due to his visual acuity. As a result, the neurons and the monkey are signaling reward probabilities associated with location and not stimulus identity. In this case, the short latency burst is incapable of determining reward probability and neither is the late latency burst. The monkey s licking duration increases for locations that had previously been associated with reward in fixed trials (Figure 29). Licking duration does not follow stimulus identity (Figure 30).
199 189 Figure 33 Monkey L demonstrates decreased motivation in the late-training trials as indicated by a decrease in his anticipatory licking (late-training dashed red, right y-axis) contrasted with greater anticipatory licking in early training phase (solid blue, left y-axis). His decreased motivation is one possible explanation for why the short-latency dopamine activity to HSF stimuli is less robust for monkey L in fixed and random peripherally displayed stimuli. It has been previously established that phasic dopamine responses decrease when subjects are less motivated (Satoh et al., 2003).
200 190 HSFr90S HSFr50S HSFr10S HSFp90S HSFp50S HSFp10S HSFn90S HSFn50S HSFn10S Rand90S Rand50S Rand10S Fixed90S Fixed50S Fixed10S HSFr90L HSFr50L HSFr10L HSFp90L HSFp50L HSFp10L HSFn90L HSFn50L HSFn10L Rand90L Rand50L Rand10L Fixed90L Fixed50L Fixed10L Time ( ms) Figure 34
201 191 Figure 34 Response (lines) and discrimination (dots) latencies for each stimulus across all conditions for both subjects illustrates the time course of the neuronal response. Note that the response latency ranges increase for HSF stimuli located peripherally, likely indicating an increased variability of responses by individual neurons (de-synchronization). Additionally, the discrimination latency increases for all HSF conditions as compared to discrimination latencies for simple-discrimination images used in Chapter II and the increase is most pronounced for HSF stimuli in peripheral locations for monkey S. Discrimination latencies are plotted for the discrimination time for 90% stimulus vs. 10% stimulus for both the 90% stimulus and 10% stimulus, and 50% stimulus vs. 10% stimulus for the 50% stimulus. HSFn = HSF stimuli in central locations, HSFp = HSF stimuli in peripheral locations, HSFr = HSF stimuli in random peripheral locations, Fixed = simple-disrimination stimuli in fixed locations, Rand = simplediscrimination stimuli in random locations, 10 = 10% stimulus, 50 = 50% stimulus, and 90 = 90% stimulus, L = monkey L, S = monkey S.
202 Figure
203 193 Figure 35 Receiver operating characteristic curves provide information about rate and duration of discrimination between populations. An ROC discrimination index, analogous to the area under the ROC curve (AUC), was calculated for the stimuli. For HSF stimuli placed in central locations, the greatest discrimination occurs between 90% and 10% stimuli, and discrimination between 50% and 10% stimuli is better than between 90% and 50% stimuli. Additionally, the discrimination occurs over a protracted time window and demonstrates anticipatory activity for 90% and 50% stimuli that is distinct from activity to the 10% stimulus at 1000 ms prior to reward delivery.
204 Figure
205 195 Figure 36 Receiver operating characteristic (ROC) curves are used to provide information about the time at which phasic dopamine neuron responses discriminate between stimuli. Shown here are the ROC curves for all conditions comparing the response to 90% stimuli and 10% stimuli (Chapter II simplediscrimination images and Chapter III HSF images). An ROC discrimination index, which is analogous to the area under the ROC curve (AUC), value of 1 indicates perfect discrimination for the 90% stimulus, while a value of 0 indicates perfect discrimination for the 10% stimulus. Note that the phasic dopamine activity discriminates simple-discrimination stimuli faster than HSF stimuli (see latencies in Table 2, Chapter II and Table 2, current chapter). Additionally, discrimination between HSF stimuli located centrally occurs earlier than discrimination for HSF stimuli located in fixed and random peripheral locations.
206 Figure
207 197 Figure 37 Receiver operating characteristic (ROC) curves are used to provide information about the time at which phasic dopamine neuron responses discriminate between stimuli. Shown here are the ROC curves for all conditions comparing the response to 50% stimuli and 10% stimuli (Chapter II simplediscrimination images and Chapter III HSF images). An ROC area under the curve (AUC) value of 1 indicates perfect discrimination for the 90% stimulus, while a value of 0 indicates perfect discrimination for the 10% stimulus. Note that the phasic dopamine activity discriminates simple-discrimination stimuli faster than HSF stimuli (see latencies in Table 2, Chapter II and Table 2, current chapter). Discrimination between HSF stimuli located centrally occurs earlier than discrimination for HSF stimuli located in fixed and random peripheral locations.
208 Figure
209 199 Figure 38 Receiver operating characteristic (ROC) curves are used to provide information about the time at which phasic dopamine neuron responses discriminate between stimuli. Shown here are the ROC curves for all conditions comparing the response to 90% stimuli and 50% stimuli (Chapter II simplediscrimination images and Chapter III HSF images). An ROC area under the curve (AUC) value of 1 indicates perfect discrimination for the 90% stimulus, while a value of 0 indicates perfect discrimination for the 10% stimulus. Note that the phasic dopamine activity discriminates simple-discrimination stimuli faster than HSF stimuli (see latencies in Table 2, Chapter II and Table 2, current chapter). Additionally, there is less discrimination between the 90% and 50% stimuli, likely because dopamine neurons lack precision to discern similar reward probabilities based on response magnitude.


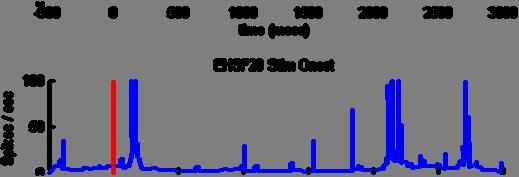


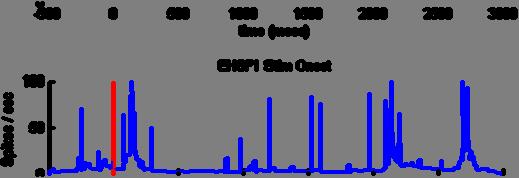


210 Figure
211 201 Figure 39 Dopamine neuron robustly responds to novel stimuli. After extensive training using the same 3 stimuli for the study in Chapter II, HSF stimuli were presented for the first time while recording from a dopamine neuron. Histograms (above) and spike rasters (below) display robust activity to these novel HSF stimuli as contrasted by the response of the neuron to simple-discrimination stimuli (Figure 40). Additionally, it is important to note that the neuron responds to all sensory events contained in the trial (stimulus onset at 0ms, offset at 2000ms, and reward delivery at 2500ms) indicating that the current widely believed conditioned-learning hypothesis of the dopamine neuron-conditioning shift depicted in Figure 1 might be inaccurate. Instead, it is likely that dopamine neurons initially respond robustly to all novel sensory events. Once those sensory events are determined to be less motivationally salient (i.e 10% and 50% rewarded stimulus), the response decreases in magnitude, while the response is maintained for high motivationally salient stimuli (i.e. 90% rewarded stimulus). This data further supports a role for the superior colliculus, since the superior colliculus initially responds to novel stimuli but eventually habituates for lowmotivationally salient distracters in contrast to high motivationally salient targets (Kim and Basso, 2008).


212 Figure
Supplementary Figure 1. Example of an amygdala neuron whose activity reflects value during the visual stimulus interval. This cell responded more
 1 Supplementary Figure 1. Example of an amygdala neuron whose activity reflects value during the visual stimulus interval. This cell responded more strongly when an image was negative than when the same
The individual animals, the basic design of the experiments and the electrophysiological
 SUPPORTING ONLINE MATERIAL Material and Methods The individual animals, the basic design of the experiments and the electrophysiological techniques for extracellularly recording from dopamine neurons were
NSCI 324 Systems Neuroscience
 NSCI 324 Systems Neuroscience Dopamine and Learning Michael Dorris Associate Professor of Physiology & Neuroscience Studies dorrism@biomed.queensu.ca http://brain.phgy.queensu.ca/dorrislab/ NSCI 324 Systems
Chapter 5: Learning and Behavior Learning How Learning is Studied Ivan Pavlov Edward Thorndike eliciting stimulus emitted
 Chapter 5: Learning and Behavior A. Learning-long lasting changes in the environmental guidance of behavior as a result of experience B. Learning emphasizes the fact that individual environments also play
Reinforcement learning and the brain: the problems we face all day. Reinforcement Learning in the brain
 Reinforcement learning and the brain: the problems we face all day Reinforcement Learning in the brain Reading: Y Niv, Reinforcement learning in the brain, 2009. Decision making at all levels Reinforcement
Distinct Tonic and Phasic Anticipatory Activity in Lateral Habenula and Dopamine Neurons
 Article Distinct Tonic and Phasic Anticipatory Activity in Lateral Habenula and Dopamine s Ethan S. Bromberg-Martin, 1, * Masayuki Matsumoto, 1,2 and Okihide Hikosaka 1 1 Laboratory of Sensorimotor Research,
A Model of Dopamine and Uncertainty Using Temporal Difference
 A Model of Dopamine and Uncertainty Using Temporal Difference Angela J. Thurnham* (a.j.thurnham@herts.ac.uk), D. John Done** (d.j.done@herts.ac.uk), Neil Davey* (n.davey@herts.ac.uk), ay J. Frank* (r.j.frank@herts.ac.uk)
Supplementary Figure 1. Recording sites.
 Supplementary Figure 1 Recording sites. (a, b) Schematic of recording locations for mice used in the variable-reward task (a, n = 5) and the variable-expectation task (b, n = 5). RN, red nucleus. SNc,
Basal Ganglia General Info
 Basal Ganglia General Info Neural clusters in peripheral nervous system are ganglia. In the central nervous system, they are called nuclei. Should be called Basal Nuclei but usually called Basal Ganglia.
PERSPECTIVES. The short-latency dopamine signal: a role in discovering novel actions?
 OPINION The short-latency dopamine signal: a role in discovering novel actions? Peter Redgrave and Kevin Gurney Abstract An influential concept in contemporary computational neuroscience is the reward
Book 3: Lab Procedures Book 3: Ch. 1: The Hypothesis and Overview
 Book 3: Lab Procedures Book 3: Ch. 1: The Hypothesis and Overview 13 Introduction This experiment will investigate how cocaine acts on dopamine neurons in the brain. Cocaine is a drug of abuse that increases
Anatomy of the basal ganglia. Dana Cohen Gonda Brain Research Center, room 410
 Anatomy of the basal ganglia Dana Cohen Gonda Brain Research Center, room 410 danacoh@gmail.com The basal ganglia The nuclei form a small minority of the brain s neuronal population. Little is known about
TO BE MOTIVATED IS TO HAVE AN INCREASE IN DOPAMINE. The statement to be motivated is to have an increase in dopamine implies that an increase in
 1 NAME COURSE TITLE 2 TO BE MOTIVATED IS TO HAVE AN INCREASE IN DOPAMINE The statement to be motivated is to have an increase in dopamine implies that an increase in dopamine neurotransmitter, up-regulation
Microcircuitry coordination of cortical motor information in self-initiation of voluntary movements
 Y. Isomura et al. 1 Microcircuitry coordination of cortical motor information in self-initiation of voluntary movements Yoshikazu Isomura, Rie Harukuni, Takashi Takekawa, Hidenori Aizawa & Tomoki Fukai
Dynamic Nigrostriatal Dopamine Biases Action Selection
 Article Dynamic Nigrostriatal Dopamine Biases Action Selection Highlights d Nigrostriatal dopamine signaling is associated with ongoing action selection Authors Christopher D. Howard, Hao Li, Claire E.
Representation of negative motivational value in the primate
 Representation of negative motivational value in the primate lateral habenula Masayuki Matsumoto & Okihide Hikosaka Supplementary Figure 1 Anticipatory licking and blinking. (a, b) The average normalized
Supplementary materials for: Executive control processes underlying multi- item working memory
 Supplementary materials for: Executive control processes underlying multi- item working memory Antonio H. Lara & Jonathan D. Wallis Supplementary Figure 1 Supplementary Figure 1. Behavioral measures of
Behavioral generalization
 Supplementary Figure 1 Behavioral generalization. a. Behavioral generalization curves in four Individual sessions. Shown is the conditioned response (CR, mean ± SEM), as a function of absolute (main) or
Basal Ganglia. Introduction. Basal Ganglia at a Glance. Role of the BG
 Basal Ganglia Shepherd (2004) Chapter 9 Charles J. Wilson Instructor: Yoonsuck Choe; CPSC 644 Cortical Networks Introduction A set of nuclei in the forebrain and midbrain area in mammals, birds, and reptiles.
Sum of Neurally Distinct Stimulus- and Task-Related Components.
 SUPPLEMENTARY MATERIAL for Cardoso et al. 22 The Neuroimaging Signal is a Linear Sum of Neurally Distinct Stimulus- and Task-Related Components. : Appendix: Homogeneous Linear ( Null ) and Modified Linear
Supplementary Figure 1
 Supplementary Figure 1 Miniature microdrive, spike sorting and sleep stage detection. a, A movable recording probe with 8-tetrodes (32-channels). It weighs ~1g. b, A mouse implanted with 8 tetrodes in
Spectro-temporal response fields in the inferior colliculus of awake monkey
 3.6.QH Spectro-temporal response fields in the inferior colliculus of awake monkey Versnel, Huib; Zwiers, Marcel; Van Opstal, John Department of Biophysics University of Nijmegen Geert Grooteplein 655
Supporting Online Material for
 www.sciencemag.org/cgi/content/full/323/5920/1496/dc1 Supporting Online Material for Human Substantia Nigra Neurons Encode Unexpected Financial Rewards Kareem A. Zaghloul,* Justin A. Blanco, Christoph
Analysis of in-vivo extracellular recordings. Ryan Morrill Bootcamp 9/10/2014
 Analysis of in-vivo extracellular recordings Ryan Morrill Bootcamp 9/10/2014 Goals for the lecture Be able to: Conceptually understand some of the analysis and jargon encountered in a typical (sensory)
A NOVEL MODEL OF TASK-SWITCHING AND DECISION MAKING NICK BENTLEY WAKE FOREST UNIVERSITY GRADUATE SCHOOL OF ARTS AND SCIENCES
 A NOVEL MODEL OF TASK-SWITCHING AND DECISION MAKING BY NICK BENTLEY A Dissertation Submitted to the Graduate Faculty of WAKE FOREST UNIVERSITY GRADUATE SCHOOL OF ARTS AND SCIENCES In Partial Fulfillment
Different inhibitory effects by dopaminergic modulation and global suppression of activity
 Different inhibitory effects by dopaminergic modulation and global suppression of activity Takuji Hayashi Department of Applied Physics Tokyo University of Science Osamu Araki Department of Applied Physics
Double dissociation of value computations in orbitofrontal and anterior cingulate neurons
 Supplementary Information for: Double dissociation of value computations in orbitofrontal and anterior cingulate neurons Steven W. Kennerley, Timothy E. J. Behrens & Jonathan D. Wallis Content list: Supplementary
The Adolescent Developmental Stage
 The Adolescent Developmental Stage o Physical maturation o Drive for independence o Increased salience of social and peer interactions o Brain development o Inflection in risky behaviors including experimentation
brain valuation & behavior
 brain valuation & behavior 9 Rangel, A, et al. (2008) Nature Neuroscience Reviews Vol 9 Stages in decision making process Problem is represented in the brain Brain evaluates the options Action is selected
Correlated Coding of Motivation and Outcome of Decision by Dopamine Neurons
 The Journal of Neuroscience, October 29, 2003 23(30):9913 9923 9913 Behavioral/Systems/Cognitive Correlated Coding of Motivation and Outcome of Decision by Dopamine Neurons Takemasa Satoh, Sadamu Nakai,
Neural Coding. Computing and the Brain. How Is Information Coded in Networks of Spiking Neurons?
 Neural Coding Computing and the Brain How Is Information Coded in Networks of Spiking Neurons? Coding in spike (AP) sequences from individual neurons Coding in activity of a population of neurons Spring
TMS Disruption of Time Encoding in Human Primary Visual Cortex Molly Bryan Beauchamp Lab
 TMS Disruption of Time Encoding in Human Primary Visual Cortex Molly Bryan Beauchamp Lab This report details my summer research project for the REU Theoretical and Computational Neuroscience program as
Lecture 1: Neurons. Lecture 2: Coding with spikes. To gain a basic understanding of spike based neural codes
 Lecture : Neurons Lecture 2: Coding with spikes Learning objectives: To gain a basic understanding of spike based neural codes McCulloch Pitts Neuron I w in Σ out Θ Examples: I = ; θ =.5; w=. - in = *.
Theoretical Neuroscience: The Binding Problem Jan Scholz, , University of Osnabrück
 The Binding Problem This lecture is based on following articles: Adina L. Roskies: The Binding Problem; Neuron 1999 24: 7 Charles M. Gray: The Temporal Correlation Hypothesis of Visual Feature Integration:
Introduction to Computational Neuroscience
 Introduction to Computational Neuroscience Lecture 11: Attention & Decision making Lesson Title 1 Introduction 2 Structure and Function of the NS 3 Windows to the Brain 4 Data analysis 5 Data analysis
BRAIN MECHANISMS OF REWARD AND ADDICTION
 BRAIN MECHANISMS OF REWARD AND ADDICTION TREVOR.W. ROBBINS Department of Experimental Psychology, University of Cambridge Many drugs of abuse, including stimulants such as amphetamine and cocaine, opiates
Learning. Learning: Problems. Chapter 6: Learning
 Chapter 6: Learning 1 Learning 1. In perception we studied that we are responsive to stimuli in the external world. Although some of these stimulus-response associations are innate many are learnt. 2.
Neurons in the human amygdala selective for perceived emotion. Significance
 Neurons in the human amygdala selective for perceived emotion Shuo Wang a, Oana Tudusciuc b, Adam N. Mamelak c, Ian B. Ross d, Ralph Adolphs a,b,e, and Ueli Rutishauser a,c,e,f, a Computation and Neural
The Contribution of Neuroscience to Understanding Human Behaviour
 The Contribution of Neuroscience to Understanding Human Behaviour Gail Tripp Human Developmental Neurobiology Unit Okinawa Institute of Science and Technology Promotion Corporation Okinawa Japan Today
Chapter 6/9: Learning
 Chapter 6/9: Learning Learning A relatively durable change in behavior or knowledge that is due to experience. The acquisition of knowledge, skills, and behavior through reinforcement, modeling and natural
Reward Unpredictability inside and outside of a Task Context as a Determinant of the Responses of Tonically Active Neurons in the Monkey Striatum
 The Journal of Neuroscience, Aug. 1, 2001, 21(15):5730 5739 Reward Unpredictability inside and outside of a Task Context as a Determinant of the Responses of Tonically Active Neurons in the Monkey Striatum
Shadowing and Blocking as Learning Interference Models
 Shadowing and Blocking as Learning Interference Models Espoir Kyubwa Dilip Sunder Raj Department of Bioengineering Department of Neuroscience University of California San Diego University of California
Lateral Geniculate Nucleus (LGN)
") Lateral Geniculate Nucleus (LGN) What happens beyond the retina? What happens in Lateral Geniculate Nucleus (LGN)- 90% flow Visual cortex Information Flow Superior colliculus 10% flow Slide 2 Information
Lateral Geniculate Nucleus (LGN) What happens beyond the retina? What happens in Lateral Geniculate Nucleus (LGN)- 90% flow Visual cortex Information Flow Superior colliculus 10% flow Slide 2 Information
Dopamine reward prediction error signalling: a twocomponent
 OPINION Dopamine reward prediction error signalling: a twocomponent response Wolfram Schultz Abstract Environmental stimuli and objects, including rewards, are often processed sequentially in the brain.
The Frontal Lobes. Anatomy of the Frontal Lobes. Anatomy of the Frontal Lobes 3/2/2011. Portrait: Losing Frontal-Lobe Functions. Readings: KW Ch.
 The Frontal Lobes Readings: KW Ch. 16 Portrait: Losing Frontal-Lobe Functions E.L. Highly organized college professor Became disorganized, showed little emotion, and began to miss deadlines Scores on intelligence
Neural Recording Methods
 Neural Recording Methods Types of neural recording 1. evoked potentials 2. extracellular, one neuron at a time 3. extracellular, many neurons at a time 4. intracellular (sharp or patch), one neuron at
The Integration of Features in Visual Awareness : The Binding Problem. By Andrew Laguna, S.J.
 The Integration of Features in Visual Awareness : The Binding Problem By Andrew Laguna, S.J. Outline I. Introduction II. The Visual System III. What is the Binding Problem? IV. Possible Theoretical Solutions
The role of amplitude, phase, and rhythmicity of neural oscillations in top-down control of cognition
 The role of amplitude, phase, and rhythmicity of neural oscillations in top-down control of cognition Chair: Jason Samaha, University of Wisconsin-Madison Co-Chair: Ali Mazaheri, University of Birmingham
Ivan Petrovich Pavlov ( )
") Ivan Petrovich Pavlov (1849-1936) Chapter 7 1 Ivan Petrovich Pavlov 1. Born in Ryazan, Russia on Sep 14, 1849. 2. Studied the digestive system and won the Nobel Prize in 1904 for physiology and medicine.
Ivan Petrovich Pavlov (1849-1936) Chapter 7 1 Ivan Petrovich Pavlov 1. Born in Ryazan, Russia on Sep 14, 1849. 2. Studied the digestive system and won the Nobel Prize in 1904 for physiology and medicine.
Rhythm and Rate: Perception and Physiology HST November Jennifer Melcher
 Rhythm and Rate: Perception and Physiology HST 722 - November 27 Jennifer Melcher Forward suppression of unit activity in auditory cortex Brosch and Schreiner (1997) J Neurophysiol 77: 923-943. Forward
A Multimodal Paradigm for Investigating the Perisaccadic Temporal Inversion Effect in Vision
 A Multimodal Paradigm for Investigating the Perisaccadic Temporal Inversion Effect in Vision Leo G. Trottier (leo@cogsci.ucsd.edu) Virginia R. de Sa (desa@cogsci.ucsd.edu) Department of Cognitive Science,
M Cells. Why parallel pathways? P Cells. Where from the retina? Cortical visual processing. Announcements. Main visual pathway from retina to V1
 Announcements exam 1 this Thursday! review session: Wednesday, 5:00-6:30pm, Meliora 203 Bryce s office hours: Wednesday, 3:30-5:30pm, Gleason https://www.youtube.com/watch?v=zdw7pvgz0um M Cells M cells
thebiotutor.com A2 Biology OCR Unit F215: Control, genomes and environment Module 4.3 Animal behaviour Notes & Questions
 thebiotutor.com A2 Biology OCR Unit F215: Control, genomes and environment Module 4.3 Animal behaviour Notes & Questions Andy Todd 1 Explain the advantages to organisms of innate behaviour. Behaviour o
Nature Methods: doi: /nmeth Supplementary Figure 1. Activity in turtle dorsal cortex is sparse.
 Supplementary Figure 1 Activity in turtle dorsal cortex is sparse. a. Probability distribution of firing rates across the population (notice log scale) in our data. The range of firing rates is wide but
Exploring the Brain Mechanisms Involved in Reward Prediction Errors Using Conditioned Inhibition
 University of Colorado, Boulder CU Scholar Psychology and Neuroscience Graduate Theses & Dissertations Psychology and Neuroscience Spring 1-1-2013 Exploring the Brain Mechanisms Involved in Reward Prediction
acquisition associative learning behaviorism B. F. Skinner biofeedback
 acquisition associative learning in classical conditioning the initial stage when one links a neutral stimulus and an unconditioned stimulus so that the neutral stimulus begins triggering the conditioned
Planning activity for internally generated reward goals in monkey amygdala neurons
 Europe PMC Funders Group Author Manuscript Published in final edited form as: Nat Neurosci. 2015 March ; 18(3): 461 469. doi:10.1038/nn.3925. Planning activity for internally generated reward goals in
Temporal coding in the sub-millisecond range: Model of barn owl auditory pathway
 Temporal coding in the sub-millisecond range: Model of barn owl auditory pathway Richard Kempter* Institut fur Theoretische Physik Physik-Department der TU Munchen D-85748 Garching bei Munchen J. Leo van
A Memory Model for Decision Processes in Pigeons
 From M. L. Commons, R.J. Herrnstein, & A.R. Wagner (Eds.). 1983. Quantitative Analyses of Behavior: Discrimination Processes. Cambridge, MA: Ballinger (Vol. IV, Chapter 1, pages 3-19). A Memory Model for
5th Mini-Symposium on Cognition, Decision-making and Social Function: In Memory of Kang Cheng
 5th Mini-Symposium on Cognition, Decision-making and Social Function: In Memory of Kang Cheng 13:30-13:35 Opening 13:30 17:30 13:35-14:00 Metacognition in Value-based Decision-making Dr. Xiaohong Wan (Beijing
Electrophysiological and firing properties of neurons: categorizing soloists and choristers in primary visual cortex
 *Manuscript Click here to download Manuscript: Manuscript revised.docx Click here to view linked Referenc Electrophysiological and firing properties of neurons: categorizing soloists and choristers in
Cocaine and Dopamine. Script for the Virtual Cocaine Lab Tutorial. Page 1. Introduction
 Page 1 Script for the Virtual Cocaine Lab Tutorial Cocaine and Dopamine http://www.mind.ilstu.edu Introduction This tutorial is for The Virtual Neuroscience Lab #1: Cocaine Study, a free virtual lab available
Associative Learning
 Learning Learning Associative Learning Classical Conditioning Operant Conditioning Observational Learning Biological Components of Learning Cognitive Components of Learning Behavioral Therapies Associative
Structure and Function of the Auditory and Vestibular Systems (Fall 2014) Auditory Cortex (3) Prof. Xiaoqin Wang
 Auditory Cortex (3) Prof. Xiaoqin Wang") 580.626 Structure and Function of the Auditory and Vestibular Systems (Fall 2014) Auditory Cortex (3) Prof. Xiaoqin Wang Laboratory of Auditory Neurophysiology Department of Biomedical Engineering Johns
580.626 Structure and Function of the Auditory and Vestibular Systems (Fall 2014) Auditory Cortex (3) Prof. Xiaoqin Wang Laboratory of Auditory Neurophysiology Department of Biomedical Engineering Johns
(Visual) Attention. October 3, PSY Visual Attention 1
 Attention. October 3, PSY Visual Attention 1") (Visual) Attention Perception and awareness of a visual object seems to involve attending to the object. Do we have to attend to an object to perceive it? Some tasks seem to proceed with little or no attention
(Visual) Attention Perception and awareness of a visual object seems to involve attending to the object. Do we have to attend to an object to perceive it? Some tasks seem to proceed with little or no attention
Making Things Happen 2: Motor Disorders
 Making Things Happen 2: Motor Disorders How Your Brain Works Prof. Jan Schnupp wschnupp@cityu.edu.hk HowYourBrainWorks.net On the Menu in This Lecture In the previous lecture we saw how motor cortex and
Effects of Attention on MT and MST Neuronal Activity During Pursuit Initiation
 Effects of Attention on MT and MST Neuronal Activity During Pursuit Initiation GREGG H. RECANZONE 1 AND ROBERT H. WURTZ 2 1 Center for Neuroscience and Section of Neurobiology, Physiology and Behavior,
Effects of lesions of the nucleus accumbens core and shell on response-specific Pavlovian i n s t ru mental transfer
 Effects of lesions of the nucleus accumbens core and shell on response-specific Pavlovian i n s t ru mental transfer RN Cardinal, JA Parkinson *, TW Robbins, A Dickinson, BJ Everitt Departments of Experimental
Lecture overview. What hypothesis to test in the fly? Quantitative data collection Visual physiology conventions ( Methods )
") Lecture overview What hypothesis to test in the fly? Quantitative data collection Visual physiology conventions ( Methods ) 1 Lecture overview What hypothesis to test in the fly? Quantitative data collection
Lecture overview What hypothesis to test in the fly? Quantitative data collection Visual physiology conventions ( Methods ) 1 Lecture overview What hypothesis to test in the fly? Quantitative data collection
Prefrontal dysfunction in drug addiction: Cause or consequence? Christa Nijnens
 Prefrontal dysfunction in drug addiction: Cause or consequence? Master Thesis Christa Nijnens September 16, 2009 University of Utrecht Rudolf Magnus Institute of Neuroscience Department of Neuroscience
Area MT Neurons Respond to Visual Motion Distant From Their Receptive Fields
 J Neurophysiol 94: 4156 4167, 2005. First published August 24, 2005; doi:10.1152/jn.00505.2005. Area MT Neurons Respond to Visual Motion Distant From Their Receptive Fields Daniel Zaksas and Tatiana Pasternak
Theme 2: Cellular mechanisms in the Cochlear Nucleus
 Theme 2: Cellular mechanisms in the Cochlear Nucleus The Cochlear Nucleus (CN) presents a unique opportunity for quantitatively studying input-output transformations by neurons because it gives rise to
Decoding a Perceptual Decision Process across Cortex
 Article Decoding a Perceptual Decision Process across Cortex Adrián Hernández, 1 Verónica Nácher, 1 Rogelio Luna, 1 Antonio Zainos, 1 Luis Lemus, 1 Manuel Alvarez, 1 Yuriria Vázquez, 1 Liliana Camarillo,
The Eye. Cognitive Neuroscience of Language. Today s goals. 5 From eye to brain. Today s reading
 Cognitive Neuroscience of Language 5 From eye to brain Today s goals Look at the pathways that conduct the visual information from the eye to the visual cortex Marielle Lange http://homepages.inf.ed.ac.uk/mlange/teaching/cnl/
Responses of cells in the tail of the caudate nucleus during visual discrimination learning
 Responses of cells in the tail of the caudate nucleus during visual discrimination learning V J Brown, R Desimone and M Mishkin J Neurophysiol 74:1083-1094, 1995 ; You might find this additional info useful
CSE511 Brain & Memory Modeling Lect 22,24,25: Memory Systems
 CSE511 Brain & Memory Modeling Lect 22,24,25: Memory Systems Compare Chap 31 of Purves et al., 5e Chap 24 of Bear et al., 3e Larry Wittie Computer Science, StonyBrook University http://www.cs.sunysb.edu/~cse511
OPTO 5320 VISION SCIENCE I
 OPTO 5320 VISION SCIENCE I Monocular Sensory Processes of Vision: Color Vision Mechanisms of Color Processing . Neural Mechanisms of Color Processing A. Parallel processing - M- & P- pathways B. Second
Dissociation of Response Variability from Firing Rate Effects in Frontal Eye Field Neurons during Visual Stimulation, Working Memory, and Attention
 2204 The Journal of Neuroscience, February 8, 2012 32(6):2204 2216 Behavioral/Systems/Cognitive Dissociation of Response Variability from Firing Rate Effects in Frontal Eye Field Neurons during Visual
1. A type of learning in which behavior is strengthened if followed by a reinforcer or diminished if followed by a punisher.
 1. A stimulus change that increases the future frequency of behavior that immediately precedes it. 2. In operant conditioning, a reinforcement schedule that reinforces a response only after a specified
Supporting Online Material
 Supporting Online Material Materials and Methods Electrophysiological recordings and stimulation We recorded the activity from single neurons that were located primarily in the CM nucleus, but also in
Dopamine Cells Respond to Predicted Events during Classical Conditioning: Evidence for Eligibility Traces in the Reward-Learning Network
 The Journal of Neuroscience, June 29, 2005 25(26):6235 6242 6235 Behavioral/Systems/Cognitive Dopamine Cells Respond to Predicted Events during Classical Conditioning: Evidence for Eligibility Traces in
Supplemental Information. Gamma and the Coordination of Spiking. Activity in Early Visual Cortex. Supplemental Information Inventory:
 Neuron, Volume 77 Supplemental Information Gamma and the Coordination of Spiking Activity in Early Visual Cortex Xiaoxuan Jia, Seiji Tanabe, and Adam Kohn Supplemental Information Inventory: Supplementary
Competitive Mechanisms Subserve Attention in Macaque Areas V2 and V4
 The Journal of Neuroscience, March 1, 1999, 19(5):1736 1753 Competitive Mechanisms Subserve Attention in Macaque Areas V2 and V4 John H. Reynolds, 1 Leonardo Chelazzi, 2 and Robert Desimone 1 1 Laboratory
Phil 490: Consciousness and the Self Handout [16] Jesse Prinz: Mental Pointing Phenomenal Knowledge Without Concepts
![Phil 490: Consciousness and the Self Handout [16] Jesse Prinz: Mental Pointing Phenomenal Knowledge Without Concepts](/thumbs/88/117469450.jpg "Phil 490: Consciousness and the Self Handout [16] Jesse Prinz: Mental Pointing Phenomenal Knowledge Without Concepts") Phil 490: Consciousness and the Self Handout [16] Jesse Prinz: Mental Pointing Phenomenal Knowledge Without Concepts Main Goals of this Paper: Professor JeeLoo Liu 1. To present an account of phenomenal
Phil 490: Consciousness and the Self Handout [16] Jesse Prinz: Mental Pointing Phenomenal Knowledge Without Concepts Main Goals of this Paper: Professor JeeLoo Liu 1. To present an account of phenomenal
A normalization model suggests that attention changes the weighting of inputs between visual areas
 A normalization model suggests that attention changes the weighting of inputs between visual areas Douglas A. Ruff a,1 and Marlene R. Cohen a a Department of Neuroscience and Center for the Neural Basis
Coding of Predicted Reward Omission by Dopamine Neurons in a Conditioned Inhibition Paradigm
 10402 The Journal of Neuroscience, November 12, 2003 23(32):10402 10410 Behavioral/Systems/Cognitive Coding of Predicted Reward Omission by Dopamine Neurons in a Conditioned Inhibition Paradigm Philippe
Network Dynamics of Basal Forebrain and Parietal Cortex Neurons. David Tingley 6/15/2012
 Network Dynamics of Basal Forebrain and Parietal Cortex Neurons David Tingley 6/15/2012 Abstract The current study examined the firing properties of basal forebrain and parietal cortex neurons across multiple
PSY402 Theories of Learning. Chapter 4 (Cont.) Indirect Conditioning Applications of Conditioning
 Indirect Conditioning Applications of Conditioning") PSY402 Theories of Learning Chapter 4 (Cont.) Indirect Conditioning Applications of Conditioning Extinction Extinction a method for eliminating a conditioned response. Extinction paradigm: Present the
PSY402 Theories of Learning Chapter 4 (Cont.) Indirect Conditioning Applications of Conditioning Extinction Extinction a method for eliminating a conditioned response. Extinction paradigm: Present the
The primate amygdala combines information about space and value
 The primate amygdala combines information about space and Christopher J Peck 1,8, Brian Lau 1,7,8 & C Daniel Salzman 1 6 npg 213 Nature America, Inc. All rights reserved. A stimulus predicting reinforcement
Neuron, Volume 63 Spatial attention decorrelates intrinsic activity fluctuations in Macaque area V4.
 Neuron, Volume 63 Spatial attention decorrelates intrinsic activity fluctuations in Macaque area V4. Jude F. Mitchell, Kristy A. Sundberg, and John H. Reynolds Systems Neurobiology Lab, The Salk Institute,
Learning Working Memory Tasks by Reward Prediction in the Basal Ganglia
 Learning Working Memory Tasks by Reward Prediction in the Basal Ganglia Bryan Loughry Department of Computer Science University of Colorado Boulder 345 UCB Boulder, CO, 80309 loughry@colorado.edu Michael
Cortical neurons multiplex reward-related signals along with sensory and motor information
 Cortical neurons multiplex reward-related signals along with sensory and motor information Arjun Ramakrishnan a,b, Yoon Woo Byun b,c, Kyle Rand c, Christian E. Pedersen d, Mikhail A. Lebedev a,b, and Miguel
Intrinsic Signal Optical Imaging
 Intrinsic Signal Optical Imaging Introduction Intrinsic signal optical imaging (ISOI) is a technique used to map dynamics in single cells, brain slices and even and most importantly entire mammalian brains.
nucleus accumbens septi hier-259 Nucleus+Accumbens birnlex_727
 Nucleus accumbens From Wikipedia, the free encyclopedia Brain: Nucleus accumbens Nucleus accumbens visible in red. Latin NeuroNames MeSH NeuroLex ID nucleus accumbens septi hier-259 Nucleus+Accumbens birnlex_727
acquisition associative learning behaviorism A type of learning in which one learns to link two or more stimuli and anticipate events
 acquisition associative learning In classical conditioning, the initial stage, when one links a neutral stimulus and an unconditioned stimulus so that the neutral stimulus begins triggering the conditioned
Psychoactive Drugs & The Brain
 Psychoactive Drugs & The Brain Psychoactive Substances & The Brain 1. Psychoactive substances enter the bloodstream via oral administration, inhalation, smoking, or injection 2. Psychoactive substances
What is Learned? Lecture 9
 What is Learned? Lecture 9 1 Classical and Instrumental Conditioning Compared Classical Reinforcement Not Contingent on Behavior Behavior Elicited by US Involuntary Response (Reflex) Few Conditionable
Learning theory provides the basis for behavioral interventions. The USMLE behavioral science section always contains questions relating to learning
 Learning theory provides the basis for behavioral interventions. The USMLE behavioral science section always contains questions relating to learning theory. Learning theory does not apply to behaviors
CS/NEUR125 Brains, Minds, and Machines. Due: Friday, April 14
 CS/NEUR125 Brains, Minds, and Machines Assignment 5: Neural mechanisms of object-based attention Due: Friday, April 14 This Assignment is a guided reading of the 2014 paper, Neural Mechanisms of Object-Based
Dopamine neurons report an error in the temporal prediction of reward during learning
 articles Dopamine neurons report an error in the temporal prediction of reward during learning Jeffrey R. Hollerman 1,2 and Wolfram Schultz 1 1 Institute of Physiology, University of Fribourg, CH-1700