P3-related Brain Components and the Externalizing Spectrum Disorders
|
|
|
- Blanche Marsh
- 5 years ago
- Views:
Transcription
1 P3-related Brain Components and the Externalizing Spectrum Disorders A DISSERTATION SUBMITTED TO THE FACULTY OF THE GRADUATE SCHOOL OF THE UNIVERSITY OF MINNESOTA BY Henry Hyunkoo Yoon IN PARTIAL FULFILLMENT OF THE REQUIREMENTS FOR THE DEGREE OF DOCTOR OF PHILOSOPHY William G. Iacono Octorber, 2009
2 Henry Hyunkoo Yoon, 10/2009
3 Acknowledgements I thank my family, especially my Mother and Father, for exhibiting patience and understanding in what will continue to be my lifelong academic journey. I give my eternal gratitude to my advisor William Iacono for re-shaping how I think and act. I also thank Stephen Malone and Matt McGue for their tireless support and mentorship over the years. Others I also thank include the amazing colleagues from the Minnesota Center for Twin and Family Research including Micah Hammer, Scott Burwell, Jennifer Donnelly, Casey Gilmore, and Margaret Keyes, and members of the psychophysiology data collection and analysis teams. I would also like to thank Leo Mao for his expert assistance. i
4 Abstract Objective: This dissertation explored the neurophysiological correlates of lifetime externalizing (EXT) spectrum disorders in two studies using a community-based sample of 29-year-old adult men assessed longitudinally. The first study used high-density EEG brain data to test the hypothesis that reductions in time-domain and time-frequency component measures previously identified in 17-year-old youth with EXT continue to be present in adults at age 29 when participants have largely passed through the age of heaviest substance misuse, and when brain development is further complete. The second study tested the notion that reductions on these brain measures could serve as endophenotypes (or inherited biomarkers) for EXT risk by investigating the developmental stability of these associations across a 12-year span. We further uniquely tested whether significant reduction in time-domain P3 amplitude could be used to predict the eventual diagnosis of an externalizing disorder over a decade later. Method: In both studies, EEG data were obtained using a visual oddball task. Participants were assessed from age-17 through age-29 for the lifetime presence of EXT disorders. The first study used data from 378 male twin participants from the original 17-year-old cohort of the Minnesota Twin Family Study (MTFS) who had high-density EEG data that allowed for regional scalp analyses, including data from the frontal region that was not available before. The second study included the same 29-year-old males who had EEG data collected from a midline parietal site (site-pz) at both their age-17 and age-29 assessments (n = 325). All comparisons were made against controls free of any EXT diagnosis by age 29. Results: The hypothesis tested in the first study was supported with ii
5 both time-domain and time-frequency components coinciding with P3 activity significantly reduced across all EXT groups, particularly at the posterior regions. Furthermore, a theta time-frequency component yielded frontal discriminations that were not apparent in the time-domain. Hypotheses from the second study were also confirmed with group results demonstrating reductions in these brain measures across all EXT groups with comparable effects observed at both age-17 and age-29. Finally, P3 amplitude at age-17 was predictive of EXT status by age-29 with every one-microvolt decrease in P3 amplitude associated with an approximately 5% increase in risk for an age-29 EXT diagnosis. In both studies, the effects of acute and cumulative substance exposure on the various brain measures were insignificant. Conclusions: Despite brain changes associated with normative development and potential substance exposure related to EXT symptomatology, both time-domain and time-frequency measures associated with P3 activity continue to provide effective, stable and predictive brain markers related to a wide spectrum of EXT psychopathology. These findings offer further support for the notion that P3-related measures constitute endophenotypes that tap into a neural substrate underlying behavioral disinhibition. iii
6 Table of Contents Acknowledgements.i Abstract..ii Table of Contents.iv List of Tables..viii List of Figures x Chapter 1. General Introduction The P3 event-related brain potential amplitude and alcoholism P3 amplitude reduction and the externalizing spectrum disorders Time-frequency principal components and externalizing Ambiguities in the P3-EXT literature: age, substance use, & prediction Specific Study Objectives 5 Chapter 2. A Multimethod Investigation of the P3 Response in Adults with or without a Lifetime History of Externalizing Psychopathology Introduction Findings from P3 studies of externalizing Time-domain P3 amplitude Development, P3 amplitude, EXT, and substance exposure Time-frequency principal components and EXT Aims of Current Study Methods..11 iv
7 Subjects Interview and Assessment Procedure Diagnostic and control groups P3 Event-related potential (ERP) procedure ERP data processing and reduction Artifact tagging and rejection Time-domain P3 amplitude peak identification Time-frequency decomposition Ancillary analyses Assessment for recent substance use Task performance Attrition analyses Statistical analyses of time-domain and time-frequency data Regional PCA of EEG data Statistical design, correction for twins, and measures of effects Results Task performance Attrition analyses Regional PCA of EEG data Time-Domain analyses Latency Peak...28 v
8 2.9. Time-Frequency PCA decomposition Time-frequency group analyses Follow-up analyses: cumulative substance use Discussion Overall summary Time-domain results Time-frequency results Time-domain, time-frequency, and disinhibitory behavioral disorders P3-related brain measures as candidate endophenotypes Limitations...40 Chapter 3. A Longitudinal Investigation of the Stability and Predictive Utility of the P3 Response in Adults with or without a Lifetime History of Externalizing Psychopathology Introduction P3 event-related brain potential as a candidate endophenotype of externalizing P3 brain response as a candidate endophenotype for EXT Time-domain P3 amplitude Time-frequency principal components Development, P3, EXT, and substance use Present study Methods Subjects...85 vi
9 Interview and assessment procedure Diagnostic and control groups P3 Event-related potential (ERP) procedure Intake assessment Third follow-up assessment Visual ERP task ERP data processing, artifact tagging/rejection Intake assessment Third follow-up assessment Time-domain P3 amplitude peak identification Time-frequency decomposition Procedure Decomposition results and component pairings Statistical analyses Ancillary analyses Attrition Assessment for recent and prolonged substance use Results Time-domain analyses Time-frequency analyses Prediction results Discussion vii
10 Overall summary Time-domain results Time-frequency results Time-domain, time-frequency, and adult antisocial behavioral disorders Limitations 110 Chapter 4. General Conclusions References.125 viii
11 List of Tables Chapter 2. Table 1. Table 2. Table 3. Table 4. Table 5. Table 6. Table 7. Table 8. Table 9. Table 10. Total study rates of lifetime EXT psychopathology in male participants assessed from intake (age 17) through third follow-up 41 Mean (SD) for P3 amplitude peak (µv), P3 latency (ms), and results of statistical comparisons for child and adult disinhibitory behavioral disorder groups...43 Mean (SD) for P3 amplitude (µv), P3 latency (ms), and results of statistical comparisons for substance dependence groups...45 Mean (SD) for P3 amplitude peak (µv), P3 latency (ms), and results for composite EXT groups..46 Summary table of group comparison results for TF components decomposed from 61 electrodes 48 Summary table of group comparison results for TF components decomposed from site-pz Mean (SD) for weighted energy units for PC4 and corresponding site-pz PC6, and results of statistical comparisons for all EXT groups 50 Mean (SD) for weighted energy units for PC5 and corresponding site-pz PC2, and results of statistical comparisons for all EXT groups 51 Mean (SD) for weighted energy units for PC7 and corresponding site-pz PC8, and results of statistical comparisons for all EXT groups 52 Mean (SD) for weighted energy units for PC8 and corresponding site-pz PC4, and results of statistical comparisons for all EXT groups 53 Chapter 3. Table 1. Total lifetime study n s of externalizing psychopathology in male participants assessed from intake (age 17) through third follow-up (age 29)..112 ix
12 Table 2. Table 3. Mean and standard deviation (M/SD) for P3 amplitude peak (µv), P3 latency (ms), and time-frequency principal components (PC; weighted energy units), and results of statistical comparisons for composite EXT groups Descriptive statistics and t-test results for intake control cases who did or did not develop EXT by age x
13 List of Figures Chapter 2. Figure 1. Topographic Regions.55 Figure 2 (A-D). Regional Grand Averages for Childhood Disruptive Disorders..56 Figure 3 (A-D). Regional Grand Averages for Adult Antisocial Groups.. 57 Figure 4 (A-D). Regional Grand Averages for Substance Dependence Groups.. 58 Figure 5 (A-D). Regional Grand Averages for Composite EXT Groups.. 57 Figure 6. Figure 7. Figure 8. Figure 9. Figure 10A. Figure 10B. Figure 10C. Figure 11A. Effect size graphs for time-domain P3 by topographic region and site-pz for child and adult antisocial behavioral disorders.60 Effect size graphs for time-domain P3 by topographic region and site-pz for substance dependence groups 61 Effect size graphs for time-domain P3 by topographic region and site-pz for composite EXT groups.. 62 Grand Average Waveforms and time-frequency component alignment from 61- and Pz-site decompositions.63 Effect size graphs for PC4 by topographic region and equivalent component derived from site Pz for child and adult disinhibitory behavioral disorders 64 Effect size graphs for PC4 by topographic region and equivalent component derived from site Pz for substance dependence groups. 65 Effect size graphs for PC4 by topographic region and equivalent component derived from site Pz for composite externalizing groups. 66 Effect size graphs for PC5 by topographic region and equivalent component derived from site Pz for child and adult disinhibitory behavioral disorders 67 xi
14 Figure 11B. Figure 11C. Figure 12A. Figure 12B. Figure 12C. Figure 13A. Figure 13B. Figure 13C. Figure 14. Figure 15. Figure 16. Effect size graphs for PC5 by topographic region and equivalent component derived from site Pz for child and substance dependence groups.68 Effect size graphs for PC5 by topographic region and equivalent component derived from site Pz for child and composite externalizing groups.69 Effect size graphs for PC7 by topographic region and equivalent component derived from site Pz for child and adult disinhibitory behavioral disorders 70 Effect size graphs for PC7 by topographic region and equivalent component derived from site Pz for substance dependence groups.. 71 Effect size graphs for PC7 by topographic region and equivalent component derived from site Pz for composite externalizing groups.. 72 Effect size graphs for PC8 by topographic region and equivalent component derived from site Pz for child and adult disinhibitory behavioral disorders...73 Effect size graphs for PC8 by topographic region and equivalent component derived from site Pz for substance dependence groups...74 Effect size graphs for PC8 by topographic region and equivalent component derived from site Pz for composite externalizing groups...75 Time-frequency PC4 regional profile plots for the Any EXT group.76 Time-frequency PC5 regional profile plots for the Any EXT group.77 Time-frequency PC7 regional profile plots for the Any EXT group.78 Chapter 3. Figure 1. Figure 2. Grand average ERP waveforms and alignment of time-frequency components at age 17 and age Effect size graphs for time-domain P3 by assessment age for EXT groups factors xii
15 Figure 3. Figure 4. Figure 5. Figure 6. Effect size graphs for time-frequency component pair PC1 PC1 by assessment age for EXT groups..119 Effect size graphs for time-frequency component pair PC2 PC4 by assessment age for EXT groups Effect size graphs for time-frequency component pair PC4 PC5. by assessment age for EXT groups..121 Effect size graphs for time-frequency component pair PC5 PC2 by assessment age for EXT groups... xiii
16 Chapter 1. General Introduction 1.1. The P3 event-related brain potential amplitude and alcoholism Since the initial discovery of electrocortical oscillations in human subjects in 1924 (Berger, 1929), bioelectric measures have continually evolved as indices of brain functioning, especially in active response to cognitive tasks (event-related potentials, ERPs). The ERPs are characteristic deflections in the on-going EEG that are time-locked to stimuli. Among these time-domain ERP measures, the P300 (or P3) has been the most scrutinized and explicated bioelectric component in psychopathology research, especially for alcoholism. Significant reduction in the amplitude component of the P3 was initially noted in abstinent alcoholics compared to controls (Porjesz, Begleiter, & Garozzo, 1980) and assumed to index the deleterious effects of prolonged alcohol abuse (see review by Porjesz & Begleiter, 1985). However, the observation that P3 amplitude reduction (or P3-AR) also characterizes alcohol-naïve, high-risk boys compared to low-risk controls (Begleiter, Porjesz, Bihari, & Kissin, 1984) broadened the utility of this measure as a possible inherited biomarker (or endophenotype) of alcoholism risk. Attempts to evaluate this association led to occasional failures to replicate, but an important metaanalysis of 22 high-risk studies provided credible evidence that P3-AR may have predictive utility of alcoholism when assessed in young, high-risk males using complex visual tasks (Polich, Pollock, & Bloom, 1994) P3 amplitude reduction and the externalizing spectrum disorders Decades of research from the Minnesota Twin Family Study (MTFS) primarily using cross-sectional samples of adolescent and young adults have converged on the 1
17 finding that time-domain P3-AR is not specific to alcoholism but may reflect a candidate endophenotype for disorders that constitute diagnostic endpoints under a heritable, latent externalizing (EXT) factor (Krueger et al., 2002) transmitted within families (Hicks, Krueger, Iacono, McGue, & Patrick, 2004). P3-AR is not only associated with individual disorders on this factor (Carlson, Katsanis, Iacono, & Mertz, 1999; Iacono, Malone, & McGue, 2003) as a reliable and heritable brain index (Yoon, Iacono, Malone, & McGue, 2006), but comprises a facet on the externalizing factor itself (Patrick et al., 2006) due to mutual genetic effects (Hicks, 2006 #1648). Furthermore, P3-AR may index a fundamental liability for disinhibitory dysfunction that exists relatively early in development and that is indicated by diagnoses of childhood disruptive disorders (Yoon, Iacono, Malone, Bernat, & McGue, 2008) or socially deviant behaviors such as alcohol (Iacono & McGue, 2006; McGue, Iacono, Legrand, Malone, & Elkins, 2001) or illicit drug use prior to age 15 (Iacono & McGue, 2006). Taken together, these communitybased findings suggest that P3-AR may serve as a broader index that taps a neural substrate underlying behavioral disinhibition (Iacono, Carlson, Malone, & McGue, 2002; Iacono, Malone, & McGue, 2008) Time-frequency principal components and externalizing More recent advances in technology and methodology now allow for the analysis of time-frequency principal components (TF-PCs) that offer important (and complex) analytical dimensions for investigations into the brain s functional responses to stimuli (Basar, Demiralp, Schurmann, Basar-Eroglu, & Ademoglu, 1999). These TF-PCs are thought to coincide with changes of ongoing EEG activity that are evoked by temporally- 2
18 related events (e.g., sensory) (Basar, Basar-Eroglu, Karakas, & Schurmann, 1999). Among these various TF-PCs, the delta (0-3 Hz) and theta (3-7 Hz) components have received the most attention since these frequencies contribute substantially to the composition of the P3 waveform (Basar-Eroglu et al., 1992; Karakas et al., 2000a, 2000b; Yordanova & Kolev, 1996). Although the majority of studies using TF-PCs in psychopathology research have focused on alcoholism, growing evidence suggests that, like time-domain P3, these measures may show potential utility as biomarkers for EXT broadly. For instance, studies show that both delta and theta components are reduced in alcoholics (K. A. Jones et al., 2006) with reductions further noted in high-risk adolescent and young adult subjects with family histories of alcoholism (Rangaswamy et al., 2007). Using an MTFS sample assessed at age 17, Gilmore et al., (2009) demonstrated that TF- PCs can be used to successfully discriminate those with various EXT spectrum disorders from controls, thus broadening the phenotypic scope of these measures Ambiguities in the P3-EXT literature: age, substance use, and prediction Collectively, these P3-related time-domain and time-frequency investigations have laid critical groundwork towards explicating these brain measures as candidate endophenotypes for EXT spectrum disorders. However, a few unresolved issues remain. For instance, most of this work was conducted cross-sectionally in predominantly adolescent and young adult samples, with P3 typically assessed at site-pz. Although important, the relationship between P3 amplitude and EXT may vary over development. For instance, research from the MTFS demonstrated that P3 amplitude undergoes normative decreases over the course of adolescence through early adulthood (Carlson & 3
19 Iacono, 2006; Katsanis, Iacono, & McGue, 1996) with an estimated decrease of onemicrovolt per year (Carlson & Iacono, 2006). Such amplitude decrease has been taken to suggest that P3-AR may lose its endophenotypic potential by adulthood (Hill & Shen, 2002; Hill et al., 1999). On the other hand, the topographic expression of P3 may shift frontally during late adolescence (Bauer & Hesselbrock, 2001, 2003), with frontal P3 reductions putatively providing more effective indices for EXT in older subjects with alcohol dependence (Costa et al., 2000), ASPD (Bauer, O'Connor, & Hesselbrock, 1994). These frontal P3 findings, however, raise the issue regarding the cumulative effects of substance exposure since the frontal region may be particularly vulnerable to such effects (Rogers & Robbins, 2001) especially as subjects age (Oscar-Berman, 2000; Pfefferbaum et al., 1997; Sullivan, 2000). Finally, although P3-AR is viewed as a proxy for genetic risk underlying EXT, few investigations have directly tested the stability or the predictive utility of P3-AR to forecast the development of EXT in unaffected subjects evaluated longitudinally, which reflects an important criterion for an endophenotype (Frederick & Iacono, 2006). 4
20 1.5. Specific Study Objectives In two studies, this dissertation explored the neurophysiological correlates of externalizing (EXT) spectrum disorders in a longitudinal, community-based sample of 29-year-old adult men. The first study used high-density EEG brain data which was unavailable in prior MTFS studies to test the hypothesis that reductions in time-domain and time-frequency component measures previously identified in 17-year-old youth with EXT continue to be present in adults at age 29 when participants have largely passed through the age of heaviest substance misuse, and when brain development is further complete. The second study tested the notion that reductions on these brain measures could serve as endophenotypes for EXT risk by investigating the developmental stability of these associations across a 12-year span. We further uniquely tested whether significant reduction in time-domain P3 amplitude could be used to predict the eventual diagnosis of an EXT disorder over a decade later. Finally, in both studies we evaluated whether cumulative substance use would have any effect on these brain measures. 5
21 Chapter 2. A Multimethod Investigation of the P3 Response in Adults with or without a Lifetime History of Externalizing Psychopathology 2.1. Introduction Research shows that the P3 event-related brain potential activity provides reliable neurophysiological indices of externalizing (EXT) psychopathology. Numerous investigations in the time-domain have shown that P3 amplitude reduction (P3-AR) is associated with child (see review by Barry, Johnstone, & Clarke, 2003) and adult (Bauer et al., 1994; Malone, Iacono, & McGue, 2001) disinhibitory behavioral disorders as well as substance dependence (Iacono et al., 2002; Porjesz et al., 2005). More recent investigations have shown that P3 is not a homogeneous brain signature but can be decomposed into complex time-frequency (TF) signals (Bernat, Williams, & Gehring, 2005) that also differentiate subjects with various EXT disorders from controls (Gilmore et al., 2009). Together, these findings offer evidence that P3-related measures display utility as inherited biomarkers (or endophenotypes) for disorders marked by behavioral disinhibition (Iacono et al., 2008). However, much of this important work was determined using adolescent and emerging adult samples with P3 activity typically measured from a single posterior site (site-pz) leaving unclear the nature of these associations through adulthood when the cumulative effects of substance use may be detectable and when brain development is likely to be complete. The present study provides a multimethod investigation of the P3 response that evaluates both time-domain and time-frequency brain measures in a community sample of adult men (n = 378) evaluated over a decade for a spectrum of EXT disorders. In order 6
22 to evaluate potential differences in P3 activity across the scalp, regional comparisons were made using a high-density electrode array in addition to analyses at site-pz Findings from P3 studies of externalizing Time-domain P3 amplitude Numerous studies spanning decades converge on the finding that time-domain P3- AR reflects a viable laboratory index for various disorders falling on the EXT spectrum. For instance, P3-AR has been documented in subjects with Attention-Deficit Hyperactivity Disorder (Barry et al., 2003; Yoon et al., 2008), Oppositional Defiant Disorder (Baving, Rellum, Laucht, & Schmidt, 2006), Conduct Disorder (Bauer & Hesselbrock, 1999a, 1999b, 1999c, 2001, 2003), with dependence to licit substances including alcohol (Carlson, Iacono, & McGue, 2002; Carlson et al., 1999; Malone et al., 2001; Porjesz & Begleiter, 1996) nicotine (Anokhin et al., 2000), dependence to illicit substances such as cannabis (Solowij, Michie, & Fox, 1991) or cocaine (Bauer, 2001; Biggins, MacKay, Clark, & Fein, 1997), as well as Antisocial Personality Disorder (Bauer et al., 1994; O'Connor, Bauer, Tasman, & Hesselbrock, 1994). In an important investigation, Iacono et al. (2002) provided further evidence for these associations as well as a conceptual nexus for P3-EXT studies generally by demonstrating that P3-AR may serve as a broader index that taps a neural substrate underlying behavioral disinhibition. This study of adolescents is particularly relevant to the current investigation because it uses the same visual task and community sample in a broad evaluation of externalizing disorders. Other work using this same sample has since demonstrated that the frequent co-occurrence (or comorbidity) of these various disinhibitory disorders can be accounted
23 for by a hierarchical latent EXT factor (Krueger et al., 2002) that is transmissible within families (Hicks et al., 2004), and that P3 amplitude constitutes a facet on this factor (Patrick et al., 2006) due to mutually shared genetic effects (Hicks et al., 2007) Development, P3 amplitude, EXT, and substance exposure Investigations explicating the connection between time-domain P3-AR and EXT have been conducted in predominantly adolescent and young adult samples, with P3 typically assessed at site-pz. Although important, the relationship between P3 amplitude and EXT may vary over development. For instance, ERP studies show that visual P3 amplitude undergoes normative decreases over the course of adolescence through early adulthood (Courchesne, 1978; Hill et al., 1999). Using the same sample of males and ERP task as in the current investigation, Carlson and colleagues (2006) demonstrated significant and successive decreases in P3 amplitude across ages 17, 20, and 23 to further confirm previous findings with this sample (Katsanis et al., 1996). Also, the topographic expression of P3 may shift frontally during late adolescence (Bauer & Hesselbrock, 2001, 2003), with frontal P3 reductions putatively providing more effective indices for EXT in older subjects with alcohol dependence (Costa et al., 2000; Kamarajan et al., 2005), ASPD (Bauer et al., 1994; Costa et al., 2000), those with ASPD and comorbid cocaine dependence (Bauer, 1997), as well as subjects at high familial risk for alcohol dependence (Hada, Porjesz, Chorlian, Begleiter, & Polich, 2001; Ramachandran, Porjesz, Begleiter, & Litke, 1996). However, these frontal P3 findings raise the issue regarding the cumulative effects of substance exposure since the frontal region may be particularly vulnerable to such effects (see reviews by Oscar-Berman et al., 2003; Rogers & Robbins, 2001) especially as subjects age (Oscar-Berman, 2000; Pfefferbaum et al., 1997; 8
24 Sullivan, 2000). In general, although some evidence suggests that P3-AR may reflect neuropathology related to prolonged alcohol exposure (e.g., Begleiter et al., 1980; Porjesz & Begleiter, 1981) or withdrawal concomitants (see also Hill et al., 2002) in adulthood, there is also contrasting evidence that both parietal (Iacono et al., 2002; Malone et al., 2001; see also meta-analysis by Polich et al., 1994) and frontal (Costa et al., 2000; O Connor et al., 1986) P3-AR does not appear to be related to substance exposure per se but rather to familial risk for alcoholism (Pfefferbaum, Ford, White, & Mathalon, 1991) Time-frequency principal components and EXT Recent advances in decomposition and data reduction techniques allow for extraction of refined time-frequency principal components (TF-PCs) from traditional EEG data which are thought to constitute changes of ongoing EEG activity evoked by temporally-related events (Basar, 1999 #2302). Although time-frequency components at various frequencies exist, research has focused predominantly on delta (0-3 Hz) and theta (3-7 Hz) since these frequencies dominate the ERP time course (Basar, 1998, 1999), contributing substantially to the composition of the P3 waveform (Yordanova, 1996 #2320;Karakas, 2000 #2308;Karakas, 2000 #2307;Basar-Eroglu, 1992 #2309). The delta component is maximal parietally and is associated with signal detection, decision-making (Basar, 1999 #2303) and consciousness (Karakas, 2000 #2308). Theta is maximal frontally and has been associated with selective attention (Basar-Eroglu, 1992 #2309), orienting (Basar, Rahn, Demiralp, & Schurmann, 1998), and associative processes (Karakas, 2000 #2307). Generally, EXT investigations using these time-frequency components have demonstrated their effectiveness in discriminating EXT cases from controls. For instance, 9
25 reductions in delta and theta components have been noted in alcoholics (K. A. Jones et al., 2006; Kamarajan et al., 2004). In another study directly relevant to the current investigation, Gilmore et al., (2009) extended the Iacono et al. (2002) study by evaluating associations between various TF-PCs and EXT in the same community sample of 17- year-old males. Time-frequency decompositions at site-pz revealed the presence of five TF-PCs with one particular delta component spanning the P2-N2-P3 complex discriminating EXT cases from controls across all groups: i.e., ADHD, ODD, CD, and nicotine/alcohol/illicit drug substance use disorders (Gilmore et al., 2009). This study supports the notion that TF-PCs offer an array of effective brain markers associated with behavioral disinhibition Aims of Current Study The present study reflects an extension of the Iacono et al. (2002) and Gilmore et al. (2009) investigations by determining both time-domain and time-frequency associations in the same male adolescent community sample who were evaluated in the current study as adults. Participants were evaluated longitudinally for a broader range of lifetime externalizing disorders including childhood disruptive disorders (ADHD, ODD, CD), adult antisocial behavioral disorders (ASPD, adult antisocial behavior, AAB), and substance dependence (alcohol, nicotine, illicit street drugs), as well as composite diagnostic groups reflecting various combinations of these disorders (e.g., any lifetime EXT diagnosis). EEG activity at age 29 was ascertained using a high-density, 61-channel electrode array to allow for regional comparisons of P3-related activity beyond that of site-pz. As in the Gilmore et al. (2009) study, the current investigation decomposed the ERP data using a novel PCA-based time-frequency method (Bernat et al., 2007), 10
26 extending this method across 61-channels. Finally, to assess the potential influence of substance exposure on the various brain indices, cumulative measures of substance use were derived using self-report data ascertained from intake (age 17) up through third follow-up (age 29) assessments. Based on existing literature, we hypothesized that adult males with lifetime EXT disorders would continue to display P3-AR in the time-domain that would be apparent across all scalp regions. Furthermore, time-frequency analyses would reveal decreases in delta- and theta-related components coinciding with P3 activity. Finally, we expected to find little effect related to prolonged substance use on these brain measures Methods Subjects Participants consisted of year-old males who were assessed as part of the Minnesota Twin Family Study (MTFS), a community-based longitudinal investigation of the development of substance use disorders and related psychopathology. These participants were identified for intake assessment through public records of twin births in Minnesota between January 1, 1972 and December 31, Approximately 84% of those meeting eligibility criteria (living with at least one biological parent and within a day s drive of Minneapolis, and lacking a mental or physical disability that would preclude their completing the daylong intake assessment) agreed to participate. At study intake, comparisons of participating families with those who declined participation indicated that parents of participating twins were slightly but significantly better educated than parents of nonparticipants; fathers averaged 0.2 more years of education and mothers averaged 0.3 years more (Iacono, Carlson, Taylor, Elkins, & 11
27 McGue, 1999). Overall, however, there was little evidence of bias in the sample, and results indicated that the MTFS sample is generally representative of the population of Minnesota with respect to self-reported mental health and socioeconomic background. The vast majority of participants are Caucasian (99%), consistent with the makeup of the state at the time. Written informed assent was obtained from each participant. Participants who were still legal minors at intake gave written assent to participate and their parents consented to their participation. Participants who were 18 years old gave written informed consent to participate. The sample was initially assessed when the twins were approximately 17 yearsold, and follow-up assessments were scheduled at ages 20-21, 24-25, and All assessments were designed to be in-person, although some individuals who could not complete an in-person assessment were interviewed by phone Interview and Assessment Procedure Twin participants were interviewed simultaneously, each in a separate room by a different interviewer. Interviewers had an M.A. or B.A. in psychology (or a related field), participated in intensive training in clinical diagnostic interviewing, passed written examinations, and satisfied proficiency criteria. At the intake assessment, twins were assessed for symptoms of DSM-III-R Childhood Disruptive Disorders (Attention-Deficit Hyperactivity Disorder, ADHD; Oppositional-Defiant Disorder, ODD; and Conduct Disorder, CD) using the revised version of the Diagnostic Interview for Children and Adolescents (DICA-R) (Reich, 2000 #275;Welner, 1987 #286). The mother of the twins was also interviewed with the DICA-R-Parent version. All the questions asked of the twins were also asked of the mother as they pertained to the twins. To establish diagnoses 12
28 for each Childhood Disruptive Disorder, a best-estimate approach was used that combined twin- and mother-reports (Kosten & Rounsaville, 1992; Leckman, Scholomskas, Thompson, Belanger, & Weisman, 1982). Twins were also assessed for substance use disorders using the expanded substance abuse module (Robins, Babor, & Cottler, 1987) developed as a supplement to the World Health Organization's Composite International Diagnostic Interview (Robins et al., 1988). Twins were given a lifetime assessment during their intake evaluation at approximately age 17 (n = 578) and first follow-up assessment (mean age = 20 years; 80% participation rate). For both second (mean age = 24 years; 91% participation rate) and third follow-up evaluations (mean age = 29; 92% participation rate), participants reported on the time since their last assessment. Substance use diagnostic criteria were assessed for both licit (alcohol, nicotine) and illicit (amphetamines, cannabis, cocaine, hallucinogens, inhalants, opioids, phencyclidine, and sedatives) psychoactive substances. Finally, an interview adapted from the Structured Clinical Interview for DSM-III-R Personality Disorders (SCID-II) (Spitzer, Williams, Gibbon, & First, 1987) provides a detailed assessment for symptoms of Antisocial Personality Disorder (ASPD). Clinical interviews were reviewed by at least two individuals with advanced clinical training, who coded, by consensus, every relevant DSM-III-R symptom and diagnostic criterion. For study purposes, all substance dependence as well as all child and adult antisocial behavioral disorder diagnoses (i.e., ADHD, ODD, CD, Antisocial Personality Disorder, ASPD, and Adult Antisocial Behavior, AAB) were made at the definite (all diagnostic criteria satisfied) level of certainty. A diagnosis of AAB was given to participants who met criteria for ASPD except for the CD requirement (cf. Elkins et al, 1996). Cohen kappa reliability 13
29 coefficients for the disorders assessed in the current study all exceeded 0.71 (Iacono et al., 1999) Diagnostic and control groups For study purposes, nine groups were initially formed reflecting whether participants were ever diagnosed with an EXT disorder(s) within two broad classes: 1) Disinhibitory Behavioral Disorders included Childhood Disruptive Disorders (ADHD, ODD, CD), and adult antisocial behavioral disorders (AAB, ASPD) 2) Substance Dependence included subjects who met alcohol, nicotine, or illicit drug dependence criteria. Since a large majority of illicit drug dependence cases consisted of those with cannabis dependence, a comparison group consisting of subjects with cannabis dependence was included separately for analysis. Individuals were assigned to these nine diagnostic groups without regard for possible comorbid diagnoses to produce representative samples of individuals with these externalizing conditions. However, to further assess the potential effects of comorbidity within and between these two broad classes, six additional composite diagnostic groups were created whereby participants were selected for the following: 1) Dependence to any licit substance (i.e., alcohol or nicotine) 2) Dependence to either licit or illicit substances 3) Diagnosis for any childhood disruptive disorder (ADHD, ODD, or CD) at intake 4) Diagnosis for any adult antisocial behavioral disorder (AAB or ASPD) 5) Diagnosis for any child or adult disinhibitory behavioral disorder 6) Diagnosis for any lifetime EXT disorder. 14
30 Thus, a total of 15 externalizing comparison groups were included for analyses. A Control group was formed consisting of subjects who were free of any externalizing disorder, including possible abuse for any licit of illicit substances. Table 1 shows the number of participants who received these diagnoses by their third follow-up assessment. {Table 1 here} P3 Event-related potential (ERP) procedure ERP data were acquired as part of a brief battery of psychophysiological tasks administered to all twin participants during their third follow-up assessment. All participants completed the procedure at the same time of day to minimize circadian and postprandial effects on physiological measures. While subjects sat in a high-backed chair, EEG activity was recorded using the ActiveTwo BioSemi electrode system (BioSemi, Amsterdam, the Netherlands) from sixty-one scalp electrodes digitized at 1024 Hz with an open pass-band from DC to 250 Hz. In addition, four monopolar leads recorded electrooculographic (EOG) activity which was subsequently used to derive horizontal and vertical bipolar EOG channels. Detailed description of the referencing and grounding arrangements used by the ActiveTwo BioSemi electrode system is available online ( As opposed to a single standard ground electrode used in traditional EEG systems, this system uses two separate electrodes: Common Mode Sense active electrode and Driven Right Leg passive electrode. A feedback loop is formed by these 2 electrodes which drives the average potential of the subject (the Common Mode voltage) as close as possible to the ADC reference voltage in the AD-box. The ADC reference can be considered as the amplifier zero. All data were re-referenced to activity from averaged linked ears for analysis after data acquisition. 15
31 The rotated-heads oddball paradigm developed by Begleiter et al. (1984) was used to elicit a P3 response in the event-related potential. P3 amplitude obtained from this paradigm has been shown to provide a reliable (Yoon et al., 2006) and heritable (Katsanis et al., 1997; van Beijsterveldt & van Baal, 2002; Yoon et al., 2006) marker of substance use disorders and other externalizing psychopathology that indexes both morbid (i.e., personal history; see review by Iacono et al., 2003) and premorbid (i.e., family history; see Begleiter et al., 1984) concomitants over decades of research. During ERP recording, subjects were seated in a sound-attenuated room, instructed to pay close attention to images appearing on a computer monitor, and asked to respond as quickly as possible by pressing either a left or right button when target stimuli appeared. Targets consisted of infrequently occurring schematics of heads with a nose pointed vertically up or down on the screen and only one ear represented on either the left or right side. Easy targets (n = 40) consisted of heads with noses pointed towards the top of the screen with the left or right ear appearing directly on the side corresponding to the correct response button (e.g., nose pointed up with ear on left of head requires left button press). In contrast, hard targets (n = 40) consisted of heads facing towards the bottom of the screen with either left or right ear appearing on the head which corresponds to the opposite response button (e.g., nose pointed down with ear on left of head requires right button press). Consistent with past research using this rotated heads paradigm, easy and hard trials together composed targets. Subjects were also instructed to ignore frequently occurring, interspersed non-target stimuli which consisted of ovals (n = 160). All stimuli were displayed for 100 ms, with intertrial intervals randomly varying between 1 and 2 s. The ERP task took 15 min to complete. 16
32 2.5. ERP data processing and reduction Artifact tagging and rejection EEG data were processed for analysis using EEGLAB v6.01b (Delorme and Makeig, 2004); online descriptions available at ( Operations were implemented interactively in Matlab 7.1 using sets of generalized processing scripts available within the EEGLAB toolbox (Delorme & Makeig, 2004) 1. Each participant s EEG data were high- and lowpass filtered at 0.1 Hz and 8-Hz cutoff frequencies respectively and down-sampled to 256 Hz. Subsequently, epochs of ms around the presentation of the visual stimuli were extracted from each trial with a prestimulus baseline window of -500 to -1 ms. Rejection of artifactual data began with the removal of eye activity (i.e., prominent blinks and other movements) from the scalp data. This was conducted using independent component analysis (ICA) (Makeig et al., 1996) which has been used in a number of EEG studies to separate distinct eye blink, muscle, and other artifactual processes (see review by Delorme et al., 2006). ICA was applied to the scalp data using the Runica decomposition algorithm in EEGLAB which essentially derives independent components that act as spatial filters which are then applied to the multichannel data. These independent component filters were chosen to maximally reflect temporally-independent signals in the channel data. Blink components were identified on the basis of cross-correlations between component activity and activity from the vertical EOG channel. Components with correlations above 0.70 with the criterion channel were removed. Remaining suspected blink components were also reviewed and manually 1 All scripts from this study are available upon request from the author 17
33 rejected based on time-course, morphology, and topography. The remaining components were back projected to the scalp to constitute EEG data with minimal contributions of these blink artifacts. The next step involved further artifact tagging and rejection with three semiautomated methods based on criteria using extreme values, unusual distributions, and spectral patterns (see Delorme et al., 2007 for discussion of these and other methods). Identifying artifacts based on an extreme values approach relied on the detection of EEG values that exceeded an absolute threshold which was set at 150 µv from baseline. The use of unusual distributions to flag artifacts involved the identification of data that was abnormally distributed, displaying either peaky activity (e.g., eye-blink artifacts) or abnormally flat activity that may be due to a number of alternating current (AC) or direct current (DC) artifactual sources (e.g., strong induced line noise from electrical machinery, lighting fixtures or loose electrode contacts). This method identifies artifacts defined in absolute terms of one standard deviation from the mean kurtosis value for allchannel activity. The third method involved finding abnormal spectral patterns using rejection thresholds defined by amplitude changes (20-60Hz) relative to baseline in db (- 100dB to +37dB). This procedure derives trial spectra by decomposing frequencies based on the slepian multitaper function. After deriving trial spectra, the average power spectrum is removed from each trial spectrum and artifacts are identified when the remaining spectral differences exceed the preset thresholds Time-domain P3 amplitude peak identification For each of the 61 scalp electrodes, grand average target waveforms were derived across easy and hard target trials. P3 amplitude peak was identified algorithmically using 18
34 a peak-in-window approach specifying the positive apex between ms poststimulus with P3 latency defined as the time interval between stimulus-onset to this apex in milliseconds. Although a variety of P3 amplitude identification procedures exist, this approach has been used extensively in numerous studies examining disinhibitory disorders (see review by Gilmore et al., 2009), including those using MTFS samples (see Iacono et al., 2008). P3 data derived from this algorithmic process were further screened for potential outliers based on both amplitude and latency scores. In particular, subjects with P3 latency values that were before, on, or a few milliseconds after the minimum time window of 350 ms were chosen for further inspection to ensure that the algorithm chose the correct peak. The algorithm was overridden when it was determined that an earlier event (e.g., P3a peak) was chosen instead Time-frequency decomposition Decomposition of the ERP data into time-frequency transforms (TFTs) were conducted using procedures detailed by Bernat et al. (2005, 2007) with relevant details also available by Gilmore et al. (2009). A series of generalized scripts were run through Matlab (version 7.3, Mathworks, Inc.) in order to convert the time-domain ERP data into TF surfaces using Cohen s class RID transform method. To facilitate greater comparability to extant time-domain P3 studies, decompositions were performed on averaged time-domain data to enhance brain activity that was consistently phase-locked to target stimuli, while reducing non-phase-locked activity (e.g., induced). Furthermore, in order to evaluate subsequent findings to those from a recent TF-externalizing study from our lab, decompositions were performed using a frequency range of Hz which was found to achieve the best resolution for activity decompositions within the 19
35 frequency range of interest (Gilmore et al., 2009). Decompositions were performed on the entire, baseline-corrected (-500 to -10 ms), 2 second epoch to allow for the rejection of edge effects from the transform since, as with any filter, the edges of the signal may be marred when conducting TF transformations (Bernat et al., 2005). PCA was then performed on these TF surfaces in order to decompose these surfaces into TF components a procedure that is similar in its application to signals in the time or frequency domain. The difference with the TF-PCA procedure was the reorganization of each TF surface into a vector to generate a matrix of subjects in rows and TF energy points in columns. The covariance matrix was then subject to Varimax rotation to attain simple structure by maximizing the amount of variance associated with the smallest number of variables (Chapman & McCrary, 1995). The component vectors were rearranged back into surfaces reflecting each TF-PCA component s matrix of rotated component loadings for each TF point. The number of components extracted was based on inspection of the scree plot of singular values to determine a break (or elbow ) that may indicate a reduction of explanatory variance for components falling after the break. Finally, each subjects original TF surface was weighted using the extracted TF-PCA components. Each original TF point was multiplied by the corresponding point in the matrix of rotated loadings for each component. This produced weighted data surfaces for each subject and for each TF-PCA component whose data points represented energy in units weighted by the component loadings. In order to determine how these extracted TF-PCA components differed between participants with various disinhibitory psychopathology and controls, component scores representing peak energy on the weighted TF data surface (i.e., the TF point with the 20
36 highest energy) were used as dependent variables. This method was similarly employed by Gilmore et al. (2009) to successfully discriminate various externalizing groups from controls and allows for evaluations between the TF (peak energy) and time (peak P3 amplitude) domains. TF decompositions were also derived from site-pz in order to make comparative evaluations to the Gilmore et al. (2009) report Ancillary analyses Assessment for recent substance use Participants were instructed to cease alcohol consumption for at least 24-hours prior to their in-person visit. A breathalyzer was used to quantify participants blood alcohol content (BAC) prior to EEG assessment and no participants in the current study had elevated BAC levels. Self-report information was also gathered using an abbreviated checklist from the substance abuse module to determine whether participants had consumed alcohol or other psychoactive substances (i.e., marijuana, amphetamines, barbiturates, tranquilizers, cocaine, heroin, opiates, PCP, psychedelics, inhalants, gas and other substances) 24-hours prior to EEG assessment. To evaluate the potential influence of recent substance use, a dichotomous variable was formed reflecting those who reported using any or none of these substances 24-hours prior to EEG assessment. This group was then cross-tabulated with each for the following three composite externalizing groups against controls: the group consisting of those with dependence to licit or illicit substances, those with any disinhibitory behavioral disorder (child and adult), and those with any externalizing disorder. None of the results were significant (all chi-square values < 0.3, all p-values > 0.62), thus confirming that the diagnostic groups and controls did not differ in past 24-hour substance use. 21
37 Task performance Three task performance measures were evaluated: 1) False alarms constituted the number of non-target stimuli (160 ovals) incorrectly identified as targets. 2) Reaction time was defined as the average time it took for subjects to make a button press to identify target stimuli. 3) Total hits reflected the number of both easy and hard targets correctly identified from the 80 presented. The effect of each of the diagnostic grouping variables on the task performance measures was assessed in separate ANOVAs with group as the sole fixed effect. The task performance measures were skewed. Thus, false alarm as well as reaction time data were log transformed whereas total hits data underwent arcsine transformation prior to analyses Attrition analyses Of the 578 twin participants who underwent in-person assessment at intake, 443 returned for in-person assessment at third follow-up. Among these participants, 13 did not complete or refused EEG assessment, 34 subjects had to be dropped from analyses due to technical/equipment difficulties (e.g., CMS ground electrode out of commission, EEG recording equipment failure), 3 subjects had incomplete diagnostic data, and 15 subjects were dropped due to excessive artifactual channel data whereby more than 10% of channels required interpolation. Thus, the total number of participants with both lifetime diagnostic and EEG data was 378 (see also Table 1 for participant rates within each group by third follow-up assessment). These various sources of attrition may have 22
38 led to significant bias in terms of externalizing disorder rates in the final study sample. Analyses were therefore conducted using a dichotomous grouping variable to compare those who were included (n = 378) and excluded (n = 200) from the current study for any reason on three domains: 1) P3 amplitude at intake: P3 amplitude data was obtained for 501 participants at study intake. Of these participants, 330 were included in the current study. Group comparisons were thus made on intake P3 between these participants and the 171 who were not included in this study. Intake ERP data was obtained at a midline parietal site (Pz) using the same ERP eliciting task described previously (cf. Iacono et al., 2002). 2) Full-scale IQ. Participants cognitive ability was also assessed at intake (cf. Kirkpatrick et al., 2009) using a short form of the Wechsler Adult Intelligence Scale- Revised (WAIS-R) which consisted of two Verbal subtests (Information and Vocabulary) and two Performance subtests (Block Design and Picture Arrangement). Full-scale IQ was determined by prorating the scaled scores for these four subtests. Scores for the study sample ranged from 69 to 148 (mean = 103.0, SD = 14.3). 3) Paternal externalizing. To evaluate whether differences in familial risk for EXT existed between groups, comparisons were made on their paternal level of EXT. This was conducted by deriving externalizing factor for participants biological fathers using four symptom count variables: conduct disorder, adult antisocial behavior, alcohol dependence, and drug dependence. Drug assessment covered the same eight types of substances evaluated in twin participants (i.e., amphetamines, cannabis, cocaine, hallucinogens, inhalants, opioids, PCP, and sedatives). The substance for which the greatest number of symptoms was established provided the paternal drug dependence 23
39 variable (cf. Krueger et al., 2002). With the four symptom count variables positively skewed, all variables underwent logarithmic transformations before being entered into a PCA. Results of the PCA indicated that one factor accounted for the majority of relationship between the four symptom count variables, displaying an eigenvalue over 2.0 and accounting for approximately 53% of the variance. Factor scores were calculated for each father and these values served as paternal externalizing scores for subsequent group analysis. 4) EXT diagnosis at intake. To evaluate the possibility that those who were included and excluded in the current study differed in their likelihood of receiving a lifetime EXT diagnosis at their age-17 assessment, the proportions of subjects who were ever diagnosed in the two groups were compared. The effect of the grouping variable (included vs. excluded subjects) on intake P3, full IQ, and paternal externalizing was assessed in separate ANOVAs with group as the sole fixed effect. A chi-square analysis was performed to assess the proportions of EXT cases between the groups Statistical analyses of time-domain and time-frequency data Regional PCA of EEG data In order to reduce the number of statistical comparisons, a principal components analysis (PCA) was performed to derive topographic scalp areas that would offer summary measures of regional activity (e.g., frontal) for both time-domain and TF data. These regional templates were initially derived by submitting P3 peak amplitude scores from each of the 61 electrode sites into the PCA with resulting components subject to Varimax rotation. Each electrode was grouped with each component factor based on its 24
40 highest loading with this factor to define the regional areas for EEG data. The mean activity for all electrodes within each region was derived separately for P3 amplitude, P3 latency, and each TF component scores to serve as outcome measures in subsequent group comparisons Statistical design, correction for twins, and measures of effects A series of 3 (regions) by 2 (group) repeated measures ANOVAs were conducted using PROC MIXED in SAS with region as a within-subjects effect and each of the 15 EXT groups as a between-subjects effect. In order to correct for correlated observations due to having twins in the sample, the model included a random intercept to account for between-twin pair differences in means on the ERP measures. In addition to allowing us to accommodate non-independence represented by twins, the mixed model approach uses all available data, unlike standard repeated measures ANOVA, which is appropriate when data are missing at random. For comparative purposes, P3 amplitude measured from site-pz was also evaluated across all groups through a series of univariate ANOVAs. These and other univariate comparisons (including attrition analyses, task performance, etc.) were made using PROC SURVEYREG in SAS (version 9.1) that accounted for twins. SURVEYREG uses a Taylor series expansion to derive appropriate standard errors (Fuller, 1975) when data are clustered and result in ordinary least squares standard errors being reduced by within-cluster similarity of observations. A SAS macro (smsub.sas) was subsequently used to derive means and standard errors for the different groups. A significance criterion of alpha <.05 was used for all analyses. For time-domain P3 amplitude and time-frequency results, Cohen s D effect sizes were calculated by taking 25
41 the mean difference for each regional time-domain and TF component measure between controls and comparison group and dividing by the overall group standard deviation. 2.8 Results Task performance Total target hits, number of false alarms, and reaction time data were available for 362 participants. ANOVA results revealed no significant differences on either total hits or false alarms between controls and any of the 15 externalizing groups assessed (all Fs < 2.20, all p-values > 0.14). With one exception, reaction time did not significantly discriminate diagnostic groups from controls. This exception was produced by the ODD group comparison which showed that those with a diagnosis (M = , SD = ) averaged longer reaction times by ms than controls (M = , SD = ) (F (1, 119) = 10.33, p = 0.002). Given the general pattern of no significant effects between groups for total target hits, number of false alarms, and little effect for reaction time, these task performance variables were not considered further Attrition analyses ANOVAs revealed that none of the three measures (intake P3 amplitude, full IQ, paternal externalizing) evaluated between participants who were included and excluded from the current study differed significantly (all Fs < 1.53, all p-values > 0.22). Furthermore, the percentages of diagnosed participants in the included and excluded groups were 70.5% and 70.1%, respectively, a non-significant difference, χ2 (1, N = 487) = 0.1, p = Overall, these analyses indicated that participants who were included and excluded from the current study were not biased on these measures. 26
42 2.8.3 Regional PCA of EEG data Based on the scree plot and factor loadings derived using P3 amplitude peak values for all 61 electrodes, three factors were retained accounting for 60.67% of the variance: frontal (27 electrodes), central-parietal (14 electrodes including site-pz), parietal-occipital (20 electrodes) regions. Figure 1 displays these three regions. The mean values taken from the electrodes constituting each region were derived separately for P3 amplitude (microvolts, µv), P3 latency (ms), and weighted peak energy units for each of the eight TF components. {Figure 1 here} Time-Domain analyses Omnibus F-statistics are reported in text. Tables 2-4 display descriptive statistics (means, standard deviations) for site-pz and regional P3 amplitude peak/latency values. The p-values associated with statistical comparisons for the disinhibitory behavioral disorder, substance dependence, and composite groups are presented in these tables. Multilevel repeated-measures analyses produce a separate control group standard deviation for each comparison depending on exactly which subjects are included in the analysis. Therefore, to record standard deviations for controls on a particular brain measure, these values were taken from the comparisons against the composite group reflecting those with any lifetime EXT disorder. Figures 2-5 (A-D) display the grand P3 waveforms by region and site-pz for childhood disruptive disorder, adult antisocial, substance dependence, and composite EXT groups, respectively. Lastly, Figures
43 provide effect size graphs coinciding with child/adult disinhibitory, substance dependence, and composite EXT groups respectively Latency Regional comparisons for P3 latency did not yield any significant group results (all Fs < 0.72, all p-values > 0.40). Furthermore, there were no significant interactions between any group with region (all Fs < 2.91, all p-values > 0.06) Peak Tables 2-4 show that results for P3 analyses were straightforward with all 15 group comparisons significant for both site-pz (all Fs > 5.36, all p-values < 0.02) as well as regional (all Fs > 6.24, all p-values < 0.01) analyses. Effect size graphs (Figures 6-8) further served to demonstrate that, despite the various ways of defining EXT, P3 differences between any EXT group to controls were palpable with a diagnosis of any lifetime EXT disorder being associated with an effect size of 0.43 at site-pz and a median effect size of 0.38 across all topographic regions (Figure 8). The magnitude of these effects appeared to vary by region with stronger effects generally observed at the posterior regions than at the frontal region. Statistically, the main effect of region was significant across all comparisons (all Fs > 61.08, all p-values <.001) and these results are highlighted by Figures 2-5 (A-D) along with descriptive statistics from Tables 2-4 which show that the largest P3 peak amplitudes were associated with the central-parietal and parietal-occipital regions. However, P3 amplitude was largest at site-pz. In contrast, a smaller more amorphous P3 peak is observed at the frontal region which does not appear to show noticeable differences between controls and EXT groups. Effect size graphs (Figures 6-8) demonstrate the lack of P3 differences between EXT groups and controls at 28
44 the frontal region. Median effect sizes estimated within each of the child and adult antisocial behavioral disorder (Figure 6), substance dependence (Figure 7), and composite EXT (Figure 8) groups separately yielded the same small magnitude of On the other hand, Figures 2-5 (B-D) and Figures 6-8 collectively show notable differences between these groups at the posterior regions including site-pz. More specifically, effect sizes associated with having any lifetime EXT disorder (Figure 8) were largest at site-pz (effect size = 0.43) followed by comparisons at the parietaloccipital (effect size = 0.41), and central-parietal (effect size = 0.38) regions. Finally, Table 4 (composite EXT groups) shows that group differences in P3 may vary by region. Although the overall interaction between group and region was not significant for those with any lifetime EXT disorder (F (2, 619) = 2.77, p = 0.06), there were significant interactions observed for groups consisting of those with any childhood disruptive disorder (F (2, 399) = 5.30, p = 0.005) and any adult antisocial behavioral disorder (F (2, 268) = 6.27, p = 0.002) or any disinhibitory behavioral disorder generally (F (2, 412) = 5.20, p = 0.006). Thus, in order to explore the nature of these interactions, separate univariate ANOVAs were conducted with P3 amplitude coinciding with the three regions serving as dependent variables. To simplify these analyses, the composite group consisting of those with any child or adult disinhibitory behavioral disorder was used. Results showed that while P3 amplitude between controls and affected participants did not differ frontally (F (1, 158) = 3.76, p-value > 0.05), differences were pronounced at the central-parietal and parietal-occipital regions (Fs > 11.50, p-values <.001), in line with effect size patterns observed in Figure 8. 29
45 {Table 2-4 here} {Figures 2-5 here} {Figures 6-8 here} 2.9. Time-Frequency Figure 9 displays the TF component solutions for both the 61-electrode and site- Pz decompositions that are aligned by similarity based on cross-factor loadings and factor score correlations PCA decomposition Eight principal components accounting for 85.74% of the variance were retained based on the scree plot when decompositions were made using all 61 electrodes. Similar TF components accounting for 88.21% of the variance were also retained from site Pz decompositions. The numbers associated with each TF component (e.g., PC1) reflects the ascending order of the component based on the amount of variance accounted for in the varimax-rotated solution. For the 61-electrode solution (and its corresponding site-pz component), principal component 1 (PC1) reflected theta activity centered around 4 Hz coinciding with P2 peak. PC2 was also centered at approximately 4 Hz coinciding with the end of N2 and early rise of P3. PC3 constituted another theta component centered around 3.5 Hz coinciding with start and end of P2 activity. PC4 was a delta component centered around 1 Hz and had a long duration spanning the P2-N2-P3 complex. PC5 reflected theta activity centered around 3 Hz and encompassing an elliptical area most coinciding with P3 peak. PC6 reflected delta activity around 2.5 Hz that spanned a long duration coinciding with the slow-wave after P3 peak. PC7 also reflected delta activity centered around 2 Hz that spanned the back edge of P3 peak and the beginning of the 30
46 slow wave post-peak. Finally, PC8 was a delta component covering the N2-P3 complex at 2.5 Hz. {Figure 9 here} Time-frequency group analyses Regional analyses for each of the 8 TF components for the 15 EXT groups yielded 120 comparisons. Tables 5 and 6 provide a summary of the group comparison results for both the 61-electrode and site-pz TF component comparisons respectively. These tables clearly show that four components discriminate EXT groups from controls most consistently: PCs 4, 5, 7, 8 from the 61-electrode decomposition, and PCs 6, 2, 8, 4 from the site-pz decomposition which Figure 9 shows are corresponding pairs. In order to examine the time-frequency components that offer the most utility as broad indices of EXT, these TF components became the focus of more detailed analyses. For these component pairs, Tables 7-10 provide descriptive statistics (means, standard deviations) for weighted energy unit values associated with each topographic region and its corresponding site-pz TF component as well as p-values associated with statistical comparisons for all 15 EXT groups. Figures (A-C) provide graphs of effect sizes corresponding to comparisons made on PC4 (Figure 10), PC5 (Figure 11), PC7 (Figure 12), and PC8 (Figure 13) for child/adult disinhibitory behavioral disorder (A), substance dependence (B), and composite EXT (C) groups respectively. These figures also provide effect sizes for their corresponding site-pz TF component. Like the time-domain results, group comparisons on TF components were straightforward in showing that all four components derived from the full complement of 31
47 electrodes discriminated all 15 EXT groups: PC4 (all Fs > 4.53, all p-values < 0.04), PC5 (all Fs > 7.55, all p-values < 0.007), PC7 (all Fs > 4.49, all p-values < 0.04), PC8 (all Fs > 4.72, all p-values < 0.03). Results from site-pz analyses were similarly strong although comparisons for cannabis dependence displayed trend-level significance (i.e.,.05 < p <.10) for PC6 and PC8. Apart from these two exceptions, the other TF components successfully differentiated EXT groups from controls: PC2 (all Fs > 4.23, all p-values < 0.04), PC4 (all Fs > 4.29, all p-values < 0.04), PC6 (minus cannabis: all Fs > 4.77, all p- values < 0.03), PC8 (minus cannabis: all Fs > 4.04, all p-values < 0.05). Further parallel to time-domain results, effect size graphs demonstrated that regardless of how EXT was defined, significant reductions in each TF component score was observed when compared against controls (see Figures (A-C)). Generally, comparisons using the Any EXT group produced median effect sizes that tended to be more pronounced for the theta component PC5 (0.43), followed by the delta components PC4 (0.31), PC7 (0.35), and PC8 (0.24) when estimated across regions. For TF components at site-pz, the magnitude of effects were comparable with larger effects observed for PC6 (0.39) followed by PC2 (0.36) and PC4 (0.36) and then by PC8 (0.30). The magnitude of effect observed for PC6 is noteworthy since this component, which reflects delta activity encompassing the P2-N2-P3 complex, was found in the Gilmore et al. (2009) study to be most successful in discriminating all EXT groups in their adolescent sample. As in the time-domain, the main effect of region was significant across all TF comparisons (all Fs across TF components > 24.08, all p-values <.001) with larger scores for TF components generally associated with the posterior regions, including site-pz (see Tables 7-10). 32
48 However, in contrast to the small frontal effects seen between EXT groups and controls in the time-domain, TF components appeared to show notable reductions frontally, especially for ADHD (effect sizes; PC4: 0.39, PC5: 0.68, PC7: 0.50, PC8: 0.48), ODD (effect sizes; PC4: 0.34, PC5: 0.70, PC7: 0.40, PC8: 0.50), and ASPD (effect sizes; PC4: 0.31, PC5: 0.57, PC7: 0.53, PC8: 0.46). PC5, which reflected theta activity most closely in time-course to P3 peak amplitude, provided the most striking example of this effect (Figure 11A, 11B, 11C). Effect sizes associated frontally for PC5 were notable for composite groups reflecting those with any child (effect size = 0.48), or adult (effect size = 0.53) disinhibitory behavioral disorder (Figure 11c), as well as groups reflecting lifetime dependence to licit (effect size = 0.50) substances (Figure 11b). Finally, significant group by region interactions were detected to varying degrees among the TF components, although not consistently for PC8 (see Tables 7-10). Thus, for PC components 4, 5, and 7, these interactions were explored further using the any EXT group for simplicity. Profile plots for each component are provided in Figures Univariate analyses for each region by each component showed that, similar to timedomain analyses, differences on PC4 were not significant frontally (F (1, 208) = 1.71, p = 0.19) although significant effects were noted at the central-parietal and parietal-occipital regions (Fs > 6.37, p-values < 0.01). On the other hand, those with any EXT displayed significant reductions at all regions for both PC5 (all Fs > 7.25, p-values < 0.008) and PC7 (all Fs > 6.08, p-values < 0.015). However, these reductions tended to be more pronounced at the central-parietal region (see Figure 14-16). 33
49 2.10. Follow-up analyses: cumulative substance use Although acute effects of recent substance use (i.e., 24-hours prior to EEG assessment) do not appear to account for group differences on the P3-related measures, the effects of cumulative substance exposure may still contribute to these observed differences. Prolonged substance use over the course of adolescence through adulthood may lead to brain abnormalities (e.g., Oscar-Berman, 2000). Furthermore, such abnormalities may most likely occur in those with disinhibitory psychopathology due to the inability to inhibit use. Thus the palpable P3 deficits observed in EXT groups may be reflecting the neurotoxic effects of prolonged use and not genetic risk for behavioral disinhibition per say. In order to assess the effects of cumulative substance use on P3 results, five measures of use history were derived from the substance abuse module assessed from intake through third follow-up. Although differences in reporting periods and interview items were apparent across assessments, five proxy measures were derived: 1) Cigarettes: total number of cigarettes smoked during heaviest use per day from intake through second follow-up. 2) Cigarettes: total number of years smoked starting from the earliest age the participant reported smoking heavily to age last used tobacco. 3) Alcohol: the average number of drinks during the heaviest period of drinking in their lifetime. 4) Alcohol: lifetime number of intoxications from intake through second follow-up. 5) Illicit drugs: number of times reported using any illicit drugs summed across assessment periods from intake through third follow-up. 34
50 For each of the five substance use history measures, dichotomous groups were created using decile splits. These five groups were then compared on regional time-domain and TF component measures using repeated-measures ANOVAs. Results from these analyses yielded no significant results when compared on time-domain regions (all F s < 1.82, all p-values > 0.18). For regional time-frequency analyses, these cumulative substance use groups did not significantly differ on three of the four TF components (PC4: all F s < 3.51, all p-values > 0.07; PC5: all F s < 4.18, all p-values > 0.05; PC8: all F s < 3.64, all p-values > 0.06). The one exception was the group created using the total number of years smoked. Participants who constituted the upper decile displayed significantly attenuated PC7 energy scores compared to those smoking fewer years (F (1, 63) = 6.11, p = 0.02). Comparisons on PC7 for the other four group comparisons however were not significant (all F s < 0.27, all p-values > 0.61). F (1, 63) = 6.11, p = {Tables 5 and 6 here} {Tables 7 thru 10 here} {Figures here} {Figures here} 2.11 Discussion Overall summary This investigation provided a multimethod assessment of P3-related brain activity in a male community sample at uniform age to demonstrate the extensive utility of these measures as broad indices of disinhibitory psychopathology. This study further demonstrated the consistency of these associations in an adult sample, extending and elaborating both the Iacono et al. (2002) and Gilmore et al. (2009) studies of adolescents. 35
51 Analyses for time-domain P3 were clear in showing significant posterior amplitude reductions in all 15 EXT groups. Results were similarly straightforward for timefrequency analyses, with four TF-PCs successfully discriminating the EXT groups. Finally, assessment of substance use history indicated that these effects were not due to the consequence of substance exposure per se, offering further support to the notion that these neurophysiological measures may tap a neural substrate underlying behavioral disinhibition Time-domain results Results from time-domain analyses showed that P3-AR was widespread posteriorly, encompassing both the central-parietal and parietal-occipital regions. However, more robust effects were observed at site-pz which suggests that activity at this site may provide an effective general summary index for time-domain P3-EXT investigations. On the other hand, the results from this study are somewhat discrepant to other investigations. For instance, results from this study do not support the view that P3- AR may not be an effective indicator of EXT past childhood (e.g., Hill et al., 1999), but instead we provide strong evidence that time-domain P3-AR indexes adults with a range of EXT disorders, including diagnoses made in childhood. Also, our findings are somewhat discrepant to other investigations which show evidence for frontal P3-AR. Although these differences are difficult to reconcile based on available information, one possibility is that the visual rotated-heads paradigm used in the current study does not elicit strong frontal responses. Furthermore, to our knowledge, no study finding frontal effects in adults with EXT have done so using this paradigm. Another possibility is sample recruitment source. Many investigations finding frontal effects in alcoholic cases, 36
52 for instance, have done so using treatment samples (e.g., Hada et al., 2000; Kamarajan et al., 2005) or samples selected to have high familial risk for alcoholism (Costa et al., 2000; Hada et al., 2000; Prabhu et al., 2001). Although important, these samples may include particularly severe cases putatively associated with pre-existing frontal abnormalities (e.g., Giancola et al., 2006) Time-frequency results Time-frequency decomposition of the ERP waveform produced a number of effective measures for EXT. As in the Gilmore et al. (2009) study, TF-PCs in the delta frequency appeared to be particularly effective with three of the four most successful components in this frequency range. Replicating their findings at site-pz in an adult sample, we demonstrated that a low-frequency delta spanning the time-course of P2-N2- P3 complex (PC6; Table 7) showed robust reductions across EXT groups (except for cannabis dependence), displaying the largest median effect sizes across all EXT groups (0.52). However, results using the full complement of electrodes revealed a theta component (PC5, Table 8) that was most effective in discriminating all EXT groups. PC5, which coincided most with P3 peak in time, was particularly interesting because it revealed a robust effect across all regions, with a notable frontal effect not apparent in the time-domain analyses (median effect size across all study groups = 0.48). Theta activity has been shown to be heavily influenced by frontal sources (Basar-Eroglu, Basar, Demiralp, & Schurmann, 1992) which may be particularly susceptible to cumulative substance exposure effects (Oscar-Berman & Marinkovic, 2003). Our analyses, however, showed that none of the cumulative substance use measures were related to this theta component suggesting that significant frontal reductions on this component may reflect a 37
53 biomarker of EXT. It further suggests that the decomposition techniques employed in the current study allow for the extraction of TF components that is more sensitive to frontal EXT-related variance than time-domain P3 amplitude Time-domain, time-frequency, and disinhibitory behavioral disorders Although both time-domain and time-frequency results demonstrate the effectiveness of these measures as broad brain indices of EXT in adults, further inspection shows that these associations are pronounced in certain conditions. For instance, time-domain results indicate noteworthy effects for groups consisting of subjects with any lifetime child or adult disinhibitory behavioral disorder (Figure 8; effect size = 0.56, 0.48, 0.44 for site-pz, parietal-occipital, central-parietal respectively). By individual diagnostic group (see Figure 6), the largest effects were seen for ADHD (central-parietal effect size = 0.65; site-pz = 0.77), ODD (central-parietal effect size = 0.63; site-pz = 0.73), and ASPD (parietal-occipital effect size = 0.51; site-pz = 0.66). Similar patterns were generally observed in the time-frequency domain especially at the theta component corresponding most with P3 peak (PC5; Figure 10C) where groups reflecting those with any child (median effect size across regions = 0.52) or adult (median effect size across regions = 0.53) disinhibitory behavioral disorder yielded noteworthy effects. Interestingly, the most robust frontal effects at this theta component (Figure 11A) were also noted for ADHD (effect size = 0.68), ODD (effect size = 0.70), and ASPD (effect size = 0.57), and generally across the four TF-PCs corroborating evidence of abnormal frontal lobe functions/structures in subjects with ASPD (Costa et al., 2000; Raine et al., 2000) as well as ADHD (e.g., Barkley et al., 1997; Castellanos et al., 2002; Willcutt et al., 2005), and ODD (see review by Sergeant et al., 2002). 38
54 P3-related brain measures as candidate endophenotypes Results from this study offer further support to the notion that time-domain P3- AR may reflect an endophenotype for disorders characterized by behavioral disinhibition (see review by Iacono et al., 2008). Other evidence includes the finding that visual P3 amplitude is heritable (see meta-analysis by van Beijsterveldt, C. E., & van Baal, G. C., 2002); a finding which has also been demonstrated for this sample at age 17 (Yoon et al., 2006). Molecular genetic investigations have documented significant linkage to various chromosomes with visual P3 (Begleiter et al., 1998; Porjesz et al., 2002), as well as a dopamine receptor A1 allele which was linked to P3-AR in children at high familial risk for alcoholism (Hill et al., 1998). Also, results of a bivariate genome scan indicated that a chromosome region near the ADH3 locus may influence both P3 amplitude and risk for alcoholism (Williams et al., 1999) which is noteworthy since this region was also linked to the maximum number of drinks consumed in a day (Saccone et al., 2000). Genetic investigations of time-frequency components are also yielding promising results. For example, an association was found between a frontal theta TF component and a specific polymorphism in the muscarinic acetylcholine receptor, CHRM2 (K.A. Jones, Pojesz, Almasy, & al., 2004), that was linked to performance IQ (Dick et al., 2007), cognition, and memory (Comings, Wu, Rostamkhani, McGue, & Iacono, 2003). Significant associations with multiple single nucleotide polymorphisms (SNPs) in CHRM2 were also found with comorbid alcohol dependence and major depression (Wang, Hinrichs, Stock, Budde, & al., 2004). Our lab is also pursuing the link between the theta component PC5 and CHRM2 as well as its association to the EXT latent factor. 39
55 2.12. Limitations The current study presents certain limitations. For example, although both timedomain and time-frequency analyses uncovered various regional differences in activity between EXT groups and controls, this does not allow for inferences regarding the putative intracranial current sources that may be involved since scalp electrical potential data does not reveal unique sets of sources for any given potential field (see Michel et al., 2004). More sophisticated analyses using functional brain imaging techniques such as low resolution brain electromagnetic tomography (LORETA) would offer the ability to identify these sources. These efforts are currently being pursued in our lab. Also, although assessment of both acute (24-hour) and prolonged (years) substance exposure did not reveal any associations with the group results, this may be due to the limited time window for age in the current study. Future follow-up assessments may be necessary to evaluate such effects. Finally, although this community-based sample offers unique research opportunities, it is nevertheless comprised of predominantly Caucasian twin participants from Minnesota, potentially limiting generalizability to samples similarly composed. Despite these limitations, the findings from this study extend and elaborate those of Iacono et al. (2002) and Gilmore et al. (2009) by demonstrating that both timedomain and time-frequency components provide effective brain measures of EXT in adults. Collectively, these community-based studies suggest that P3-related measures may provide effective multivariate endophenotypes (Iacono et al., 2000) that tap the neurobehavioral deviations associated with behavioral disinhibition (Iacono, Malone, & McGue, 2008). 40
56 Table 1: Total study rates of lifetime EXT psychopathology in male participants assessed from intake (age 17) through third follow-up Intake (Age 17) FU1 (Age 20-21) FU2 (Age 24-25) FU3 (Age 29-30) Controls a Childhood Disruptive Disorders b Oppositional Defiant Disorder (ODD) Attention-Deficit Hyperactivity Disorder (ADHD) Conduct Disorder (CD) Any (ODD, ADHD, or CD) Adult Antisocial Behavioral Disorders Adult Antisocial Behaviors (AAB) Antisocial Personality Disorder (ASPD) Any (AAB or ASPD) Licit Substance Use Disorders Alcohol Nicotine Any (Alcohol or Nicotine) Intake FU1 FU2 FU3 Illicit SUDs Amphetamines Cannabis Cocaine Hallucinogens Inhalants Opiates PCP Sedatives Any (illicit drug dependence) Composite Variables Any SUDs (Licit or Illicit) Any Disinhibitory Behaviors (child or adult) Any Externalizing (child, adult, licit, Illicit)
57 Note: Diagnoses were made at the definite level of diagnostic certainty via self-report data acquired through all four assessments (i.e., intake, follow-up 1 thru 3) except for Childhood Disruptive Disorders (see point b below). a. Controls consist of participants who did not present EXT diagnoses at and up to that assessment stage. b. Diagnoses for Childhood Disruptive Disorders (ADHD, ODD, and CD) were established using best-estimate diagnoses using both self and mother reports to ensure greater reliability. Rates for these disorders are consistent across assessments since information for these diagnoses were established during intake assessment only.
58 Table 2. Mean (SD) for P3 amplitude peak (µv), P3 latency (ms), and results of statistical comparisons for child and adult disinhibitory behavioral disorder groups P3 Amplitude & Latency by Region Controls (N = 87) ADHD (N = 21) ODD (N = 39) CD (N = 66) AAB (N = 57) P3 Amplitude & Regions Latency at site-pz Descriptives T-test Frontal Central- Results Parietal Mean p- Mean Mean (SD) values (SD) (SD) Amplitude (4.43) (3.15) (4.23) Latency (42.56) (52.91) (44.26) Amplitude (3.60) < (2.81) (3.74) Latency (52.14) (39.34) (50.09) Amplitude (3.55) < (2.93) (3.45) Latency (38.63) (35.47) (36.90) Amplitude < (4.90) (3.27) (4.72) Latency (43.36) (35.44) (44.48) Amplitude (3.93) < (2.90) (3.72) Latency (39.15) (37.96) (41.96) Posterior- Occipital Mean (SD) (3.49) (38.90) 8.47 (2.62) (54.04) 8.19 (2.92) (33.55) 8.55 (3.82) (39.98) 8.36 (3.29) (33.62) ANOVA results Group (G) Region (R) G x R p-values.014 < <.001 < < < <
59 ASPD (N = 40) Amplitude (3.91) Latency (41.04) < (2.62) (40.04) (3.29) (46.95) 8.21 (3.19) (34.80).004 <
60 Table 3. Mean (SD) for P3 amplitude (µv), P3 latency (ms), and results of statistical comparisons for substance dependence groups P3 Amplitude & Latency by Region Controls (N = 87) Alcohol (N = 144) Nicotine (N = 145) Cannabis (N = 59) Illicit drugs (N = 63) P3 Amplitude & Latency at site-pz Regions ANOVA results Descriptives T-test Frontal Central- Posterior- Group Region G x R Results Parietal Occipital (G) 2 (R) Mean (SD) p-values Mean (SD) Mean (SD) Mean (SD) p-values Amplitude (4.43) (3.29) (4.33) (3.70) Latency (42.56) (52.91) (44.26) (38.90) Amplitude <.001 < (4.19) (2.86) (3.63) (3.34) Latency < (43.52) (40.07) (39.63) (38.44) Amplitude < <.001 < (4.32) (2.86) (3.81) (3.39) Latency < (44.91) (37.90) (38.58) (36.87) Amplitude < (4.86) (3.10) (3.89) (3.33) Latency < (44.59) (44.93) (37.28) (35.38) Amplitude < (4.75) (3.08) (3.80) (3.29) Latency (43.57) (43.62) (36.30) (35.06) 45
61 Table 4. Mean (SD) for P3 amplitude peak (µv), P3 latency (ms), and results for composite EXT groups P3 Amplitude & Latency by Region P3 Amplitude & Latency at site-pz Regions ANOVA results Controls (N = 87) Alcohol/Nicotine dependence (N = 199) Any substance dependence (N = 205) Any childhood disruptive disorder (N = 127) Any adult antisocial behavioral disorder (N = 57) Descriptives T-test Frontal Central- Posterior- Group Region G x R Results Parietal Occipital (G) (R) Mean (SD) p-values Mean (SD) Mean (SD) Mean (SD) p-values Amplitude (4.43) (3.29) (4.33) (3.70) Latency (42.56) (52.91) (44.26) (38.90) Amplitude < <.001 < (4.28) (2.97) (3.85) (3.39) Latency < (44.05) (39.23) (38.63) (36.71) Amplitude < <.001 < (4.52) (3.03) (3.96) (3.41) Latency < (44.17) (40.10) (38.68) (36.62) Amplitude < <.001 < (4.36) (3.09) (4.01) (3.47) Latency (41.18) (39.96) (40.19) (35.66) Amplitude < < (3.93) (2.71) (3.53) (3.26) Latency (39.15) (37.96) (41.96) (33.62) 46
62 Any antisocial behavior disorder (child/adult) (N = 135) ANY lifetime externalizing disorder (N = 230) Amplitude (4.35) Latency (40.45) Amplitude (4.60) Latency (43.75) < (3.11) (39.27) < (3.05) (39.88) (4.06) (39.48) (4.05) (38.36) 8.66 (3.48) (36.04) 8.94 (3.50) (36.31).001 < <.001 < <
63 Table 5. Summary table of group comparison results a for TF components decomposed from 61 electrodes PC1 PC2 PC3 PC4 PC5 PC6 PC7 PC8 ODD * ** ** *** *** Trend ** *** ADHD * * ** ** ** Trend ** ** CD NS NS Trend * ** * ** * AAB NS * Trend ** *** Trend ** ** ASPD NS Trend * ** *** * *** ** Alcohol * ** * ** *** * ** ** Nicotine Trend ** * *** *** * *** *** Licit Dep * ** * *** *** * *** *** Cannabis Trend NS * * ** NS * * Illicit Dep Trend NS * * ** NS * * Sub Dep * ** * ** *** * *** ** CDD NS * * *** *** Trend *** *** Adult ASB NS * Trend ** *** Trend ** ** Any ASB NS * Trend ** *** Trend ** ** Any EXT NS * NS ** *** * *** ** Note: Licit = alcohol or nicotine dependence; Sub Dep = substance dependence (licit or illicit); CDD = childhood disruptive disorder; Adult ASB = adult antisocial behavioral disorders; Any ASB = child/adult antisocial behavioral disorder; Any EXT = any lifetime externalizing disorder by age 29. a Significance notations indicate p-values associated with group comparisons in repeated-measures analyses for each TF component. NS p >.05 Trend.05 p.10 * p <.05 ** p <.01 *** p <
64 Table 6. Summary table of group comparison results a for TF components decomposed from site-pz PC1 PC2 PC3 PC4 PC5 PC6 PC7 PC8 ODD * *** * *** ** *** *** ** ADHD *** *** NS *** *** ** ** *** CD NS ** * * NS ** Trend ** AAB NS ** * ** NS *** * ** ASPD NS ** * ** NS ** * ** Alcohol NS * * * NS ** * * Nicotine Trend ** ** *** * *** ** ** Licit Dep NS * * ** Trend *** * * Cannabis NS * NS * NS Trend Trend Trend Illicit Dep NS * Trend * NS * Trend * Any Dep NS * * ** Trend ** * * CDDs NS ** * ** NS *** * ** Adult ASBs NS ** * ** NS *** * ** Any ASBs NS ** * ** NS *** * ** Any EXT NS ** * ** NS *** * ** Note: Licit = alcohol or nicotine dependence; Sub Dep = substance dependence (licit or illicit); CDD = childhood disruptive disorder; Adult ASB = adult antisocial behavioral disorders; Any ASB = child/adult antisocial behavioral disorder; Any EXT = any lifetime externalizing disorder by age 29. a Significance notations indicate p-values associated with group comparisons in univariate analyses for each TF component. NS p >.05 Trend.05 p.10 * p <.05 ** p <.01 *** p <
65 Table 7. Mean (SD) for weighted energy units for PC4 and corresponding site-pz PC6, and results of statistical comparisons for all EXT groups Pz (PC6) M (SD) Frontal M (SD) Central- Parietal M (SD) Parietal- Occipital M (SD) Group (G) Region (R) G x R Controls p-values (11.00) (4.76) (8.87) (7.14) ODD 13.12*** <.001 < (7.42) (4.00) (6.15) (4.99) ADHD 13.61** < (7.41) (3.62) (6.11) (4.40) CD 14.69** < (10.49) (4.93) (9.51) (5.89) AAB 14.12*** < (8.96) (4.33) (7.82) (5.76) ASPD 13.75** < (9.37) (3.57) (6.43) (6.05) Alcohol 15.85** < (10.29) (4.47) (8.48) (5.92) Nicotine 14.53*** <.001 < (9.53) (4.37) (7.68) (5.53) Licit Dep 15.34*** <.001 < (10.15) (4.52) (8.38) (5.84) Cannabis < (10.48) (4.29) (9.18) (5.32) Illicit Dep 16.18* < (10.30) (4.22) (9.01) (5.29) Any Dep 15.68** < (10.59) (4.57) (8.89) (5.95) CDDs 14.62*** <.001 < (9.76) (4.59) (8.41) (5.97) Adult ASBs 14.12*** < (8.96) (4.33) (7.82) (5.76) Any ASBs 14.73*** < (9.67) Any EXT 15.82** (8.96) (4.69) 6.77 (4.57) (8.71) (9.01) (5.96) 9.14 (6.28).002 <
66 Table 8. Mean (SD) for weighted energy units for PC5 and corresponding site-pz PC2, and results of statistical comparisons for all EXT groups Pz (PC2) M (SD) Frontal M (SD) Central- Parietal M (SD) Parietal- Occipital M (SD) Group (G) Region (R) G x R Controls p-values (8.62) (4.10) (8.70) (6.14) ODD 8.38*** <.001 < (6.08) (2.23) (4.54) (3.99) ADHD 7.09*** < (5.22) (2.75) (5.64) (4.30) CD 9.26** < (6.81) (4.25) (7.49) (4.50) AAB 9.26** <.001 < (6.40) (2.68) (5.41) (4.30) ASPD 8.61** <.001 < (5.94) (2.58) (4.85) (3.99) Alcohol 10.51* <.001 < (7.74) (3.29) (6.56) (5.06) Nicotine 9.64** <.001 <.001 <.001 (6.88) (2.90) (5.90) (4.83) Licit Dep 10.17* <.001 < (7.39) (3.24) (6.31) (5.04) Cannabis 10.28* < (7.21) (3.01) (6.42) (4.24) Illicit Dep 9.96* < (7.14) (3.01) (6.39) (4.22) Any Dep 10.35* <.001 < (7.40) (3.31) (6.44) (5.02) CDDs 9.39** <.001 <.001 <.001 (6.37) (3.65) (6.47) (4.31) Adult ASBs 9.26** <.001 < (6.40) (2.68) (5.41) (4.30) Any ASBs 9.61** <.001 < (6.53) Any EXT 10.24* (7.35) (3.61) 4.32 (3.64) (6.55) 8.70 (6.75) (4.41) 7.28 (5.00) <.001 <
67 Table 9. Mean (SD) for weighted energy units for PC7 and corresponding site-pz PC8, and results of statistical comparisons for all EXT groups Pz (PC8) M (SD) Frontal M (SD) Central- Parietal M (SD) Parietal- Occipital M (SD) Group (G) Region (R) G x R Controls p-values (9.91) (4.27) (8.90) (6.56) ODD 12.32** < (8.75) (4.16) (6.51) (5.14) ADHD 10.37*** < (6.68) (2.72) (4.97) (4.00) CD 13.12** < (9.58) (4.09) (7.33) (4.75) AAB 13.08** < (8.96) (3.83) (7.16) (5.39) ASPD 12.24** <.001 < (8.73) (2.87) (5.29) (4.87) Alcohol 14.62* < (9.46) (3.82) (7.72) (5.75) Nicotine 13.69** <.001 < (9.14) (3.61) (7.07) (5.35) Licit Dep 14.23* <.001 < (9.42) (3.78) (7.38) (5.58) Cannabis < (9.27) (3.65) (8.13) (5.47) Illicit Dep 14.27* < (9.16) (3.61) (8.02) (5.44) Any Dep 14.40* <.001 < (9.42) (3.77) (7.49) (5.58) CDDs 13.74** <.001 < (9.57) (3.95) (6.79) (5.10) Adult ASBs 13.08** < (8.96) (3.83) (7.16) (5.39) Any ASBs 13.85** < (9.54) Any EXT 14.48* (9.91) (4.00) 5.68 (3.88) (7.20) (7.47) (5.27) 8.56 (5.74) <.001 <
68 Table 10. Mean (SD) for weighted energy units for PC8 and corresponding site-pz PC4, and results of statistical comparisons for all EXT groups Pz (PC4) M (SD) Frontal M (SD) Central- Parietal M (SD) Parietal- Occipital M (SD) Group (G) Region (R) G x R Controls p-values (11.63) (4.85) (9.80) (8.71) ODD 10.42*** <.001 < (7.27) (2.48) (4.83) (6.15) ADHD 8.37*** < (9.59) (3.22) (6.78) (6.38) CD 13.90* < (11.64) (4.39) (10.08) (7.56) AAB 12.88** < (9.39) (3.32) (7.75) (7.24) ASPD 12.79** < (9.94) (2.57) (6.87) (7.40) Alcohol 14.67* < (10.84) (4.00) (8.50) (7.17) Nicotine 13.12*** <.001 < (9.72) (3.63) (7.30) (7.22) Licit Dep 13.90** <.001 < (10.20) (3.89) (8.10) (7.27) Cannabis 14.64* < (10.63) (3.71) (8.92) (6.17) Illicit Dep 14.52* < (10.53) (3.75) (9.03) (6.18) Any Dep 14.38** < (10.68) (4.01) (8.63) (7.28) CDDs 13.34** <.001 < (10.39) (3.90) (8.54) (7.32) Adult ASBs 12.88** < (9.39) (3.32) (7.75) (7.24) Any ASBs 13.59** < (10.31) Any EXT 14.52** (10.85) (4.01) 5.69 (4.12) (8.83) (9.00) (7.33) (7.48).002 <
69 Note: Column Pz gives univariate descriptives for the corresponding TF component when decomposed from site-pz; columns Group, Region, GxR provides p-values associated with repeated-measures ANOVAs. Trend:.05 < p <.10 * p <.05 ** p <.01 *** p <
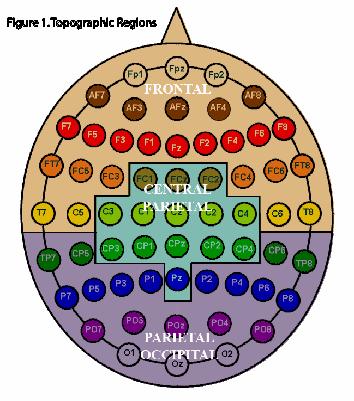
70 55
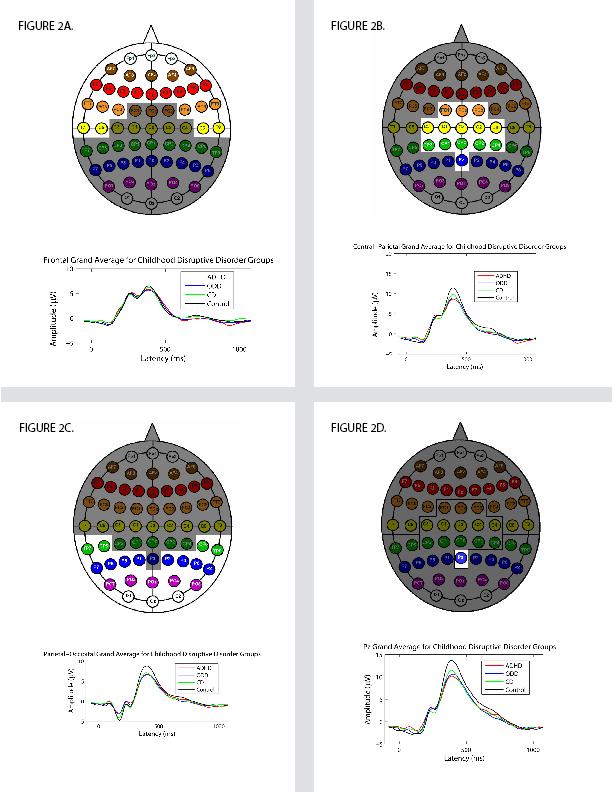
71 56
72 57
73 58
74 59
75 Frontal Central-Parietal Parietal-Occipital Site-Pz ADHD ODD CD AAB ASPD Figure 6 Effect size graphs for time-domain P3 by topographic region and site-pz for child and adult antisocial behavioral disorders. Note: ADHD = Attention-deficit hyperactivity disorder; ODD = Oppositional Defiant Disorder; CD = Conduct Disorder; AAB = Adult antisocial behavior; ASPD = Antisocial personality disorder. 60
76 Frontal Central-Parietal Parietal-Occipital Site-Pz Alcohol Nicotine Licit Cannabis Illicit Figure 7 Effect size graphs for time-domain P3 by topographic region and site-pz for substance dependence groups. NOTE: Licit refers to lifetime dependence on alcohol or nicotine; Illicit refers to street drug dependence (e.g., cannabis, amphetamines, cocaine) 61
77 Frontal Central-Parietal Parietal-Occipital Site-Pz Sub Dep CDD Adult ASB Any ASB Any EXT Figure 8 Effect size graphs for time-domain P3 by topographic region and site-pz for composite externalizing groups. NOTE: Sub Dep = lifetime dependence to any substance; CDD = Childhood Disruptive Disorder; Adult ASB = adult antisocial behaviors (AAB) or antisocial personality disorder (ASPD); Any ASB = CDD or Adult ASB; Any EXT = any lifetime externalizing disorder. 62
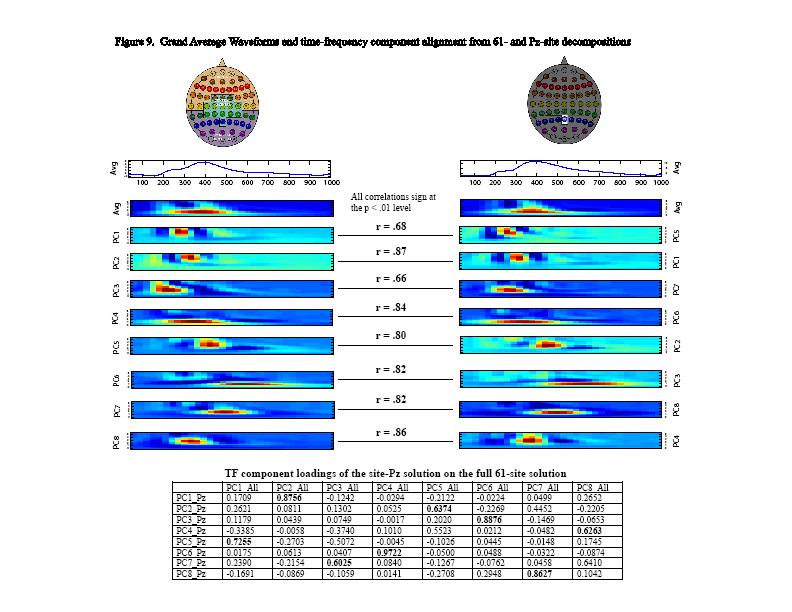
78
79 Effect size Frontal Parietal-Occipital Central-Parietal Pz ADHD ODD CD AAB ASPD Group Figure 10A Effect size graphs for PC4 by topographic region and equivalent component derived from site Pz for child and adult disinhibitory behavioral disorders. Note: ADHD = Attention-deficit hyperactivity disorder; ODD = Oppositional Defiant Disorder; CD = Conduct Disorder; AAB = Adult antisocial behavior; ASPD = Antisocial personality disorder. 64
80 Effect size Frontal Central-Parietal Parietal-Occipital Pz 0.00 Alcohol Nicotine Licit Cannabis Illicit Group Figure 10B Effect size graphs for PC4 by topographic region and equivalent component derived from site Pz for substance dependence groups. NOTE: Licit refers to lifetime dependence on alcohol or nicotine; Illicit refers to street drug dependence (e.g., cannabis, amphetamines, cocaine) 65
81 Effect size Frontal Central-Parietal Parietal-Occipital Pz 0.00 Sub Dep CDD Adult ASB Any ASB Any EXT Group Figure 10C Effect size graphs for PC4 by topographic region and equivalent component derived from site Pz for composite externalizing groups. NOTE: Sub Dep = lifetime dependence to any substance; CDD = Childhood Disruptive Disorder; Adult ASB = adult antisocial behaviors (AAB) or antisocial personality disorder (ASPD); Any ASB = CDD or Adult ASB; Any EXT = any lifetime externalizing disorder. 66
82 Effect size Frontal Central-Parietal Parietal-Occipital Pz 0.00 ADHD ODD CD AAB ASPD Group Figure 11A Effect size graphs for PC5 by topographic region and equivalent component derived from site Pz for child and adult disinhibitory behavioral disorders. Note: ADHD = Attention-deficit hyperactivity disorder; ODD = Oppositional Defiant Disorder; CD = Conduct Disorder; AAB = Adult antisocial behavior; ASPD = Antisocial personality disorder. 67
83 Effect size Frontal Central-Parietal Parietal-Occipital Pz 0.00 Alcohol Nicotine Licit Cannabis Illicit Group Figure 11B Effect size graphs for PC5 by topographic region and equivalent component derived from site Pz for substance dependence groups. NOTE: Licit refers to lifetime dependence on alcohol or nicotine 68
84 Effect size Frontal Central-Parietal Parietal-Occipital Pz 0.00 Sub Dep CDD Adult ASB Any ASB Any EXT Group Figure 11C Effect size graphs for PC5 by topographic region and equivalent component derived from site Pz for composite externalizing groups. NOTE: Sub Dep = any lifetime substance dependence; CDD = Childhood Disruptive Disorder; Adult ASB = adult antisocial behaviors (AAB) or antisocial personality disorder (ASPD); Any ASB = CDD or Adult ASB; Any EXT = any lifetime externalizing disorder. 69
85 0.70 Effect size Frontal Central-Parietal Parietal-Occipital Pz 0.00 ADHD ODD CD AAB ASPD Group Figure 12A Effect size graphs for PC7 by topographic region and equivalent component derived from site Pz for child and adult disinhibitory behavioral disorders. Note: ADHD = Attention-deficit hyperactivity disorder; ODD = Oppositional Defiant Disorder; CD = Conduct Disorder; AAB = Adult antisocial behavior; ASPD = Antisocial personality disorder. 70
86 0.70 Effect size Frontal Central-Parietal Parietal-Occipital Pz 0.00 Alcohol Nicotine Licit Cannabis Illicit Group Figure 12B Effect size graphs for PC7 by topographic region and equivalent component derived from site Pz for substance dependence groups. NOTE: Licit refers to lifetime dependence on alcohol or nicotine 71
87 0.70 Effect size Frontal Central-Parietal Parietal-Occipital Pz 0.00 Sub Dep CDD Adult ASB Any ASB Any EXT Group Figure 12C Effect size graphs for PC7 by topographic region and equivalent component derived from site Pz for composite externalizing groups. NOTE: Sub Dep = any lifetime substance dependence; CDD = Childhood Disruptive Disorder; Adult ASB = adult antisocial behaviors (AAB) or antisocial personality disorder (ASPD); Any ASB = CDD or Adult ASB; Any EXT = any lifetime externalizing disorder. 72
88 Effect size Frontal Central-Parietal Parietal-Occipital Pz 0.00 ADHD ODD CD AAB ASPD Group Figure 13A Effect size graphs for PC8 by topographic region and equivalent component derived from site Pz for child and adult disinhibitory behavioral disorders. Note: ADHD = Attention-deficit hyperactivity disorder; ODD = Oppositional Defiant Disorder; CD = Conduct Disorder; AAB = Adult antisocial behavior; ASPD = Antisocial personality disorder. 73
89 Effect size Frontal Central-Parietal Parietal-Occipital Pz 0.00 Alcohol Nicotine Licit Cannabis Illicit Group Figure 13B Effect size graphs for PC8 by topographic region and equivalent component derived from site Pz for substance dependence groups. NOTE: Licit refers to lifetime dependence on alcohol or nicotine. 74
90 Effect size Frontal Central-Parietal Parietal-Occipital Pz 0.00 Sub Dep CDD Adult ASB Any ASB Any EXT Group Figure 13C Effect size graphs for PC8 by topographic region and equivalent component derived from site Pz for composite externalizing groups. NOTE: Sub Dep = any lifetime substance dependence; CDD = Childhood Disruptive Disorder; Adult ASB = adult antisocial behaviors (AAB) or antisocial personality disorder (ASPD); Any ASB = CDD or Adult ASB; Any EXT = any lifetime externalizing disorder. 75
91 Weighted Energy Units (PC4) region Frontal Central-Parietal Parietal- Occipital 6 No Any Lifetime Ext Yes Figure 14. Time-frequency PC4 regional profile plots for the Any EXT group 76
92 Weighted Energy Units (PC5) region Frontal Central-Parietal Parietal- Occipital 4 No Yes Any Lifetime EXT Figure 15. Time-frequency PC5 regional profile plots for the Any EXT group. 77
93 Weighted Energy Units (PC7) region Frontal Central-Parietal Parietal- Occipital 6 No Yes Any Lifetime EXT Figure 16. Time-frequency PC7 regional profile plots for the Any EXT group. 78
94 Chapter 3. A Longitudinal Investigation of the Stability and Predictive Utility of the P3 Response in Adults with or without a Lifetime History of Externalizing Psychopathology 3.1. Introduction P3 event-related brain potential as a candidate endophenotype of externalizing Research has converged on the notion that P3 amplitude reduction (or P3-AR) may constitute a candidate endophenotype reflecting risk for substance use and related externalizing (EXT) spectrum disorders. For instance, P3-AR has been noted in the alcohol-naïve boys with alcoholic (see meta-analysis by Polich, Pollock, & Bloom, 1994) and substance dependent (Brigham, Herning, & Moss, 1995) fathers compared to their peers without this familial history. Since then, others have shown that P3-AR is noted in a spectrum of disinhibitory disorders (e.g., Iacono et al., 2002) reflecting diagnostic endpoints under a heritable, latent externalizing factor (Kendler, Prescott, Myers, & Neale, 2003; Krueger et al., 2002; Young, Stallings, Corley, Krauter, & Hewitt, 2000) that is transmitted within families (Hicks, Krueger, Iacono, McGue, & Patrick, 2004). Furthermore, P3 amplitude, which is itself heritable (e.g., Yoon et al., 2006) has been shown to constitute a facet on this EXT factor resulting from shared genetic effects (Hicks et al., 2006). More recently, investigations have shown that the P3 response can be decomposed into complex time-frequency (TF) signals that also differentiate subjects with various EXT disorders from controls (Gilmore et al., 2009) as well as those at high familial risk for alcoholism (e.g., Rangaswamy et al., 2007). Together, these findings provide evidence that P3-related measures display utility as candidate endophenotypes 79
95 for disorders marked by behavioral disinhibition (Iacono et al., 2008). However, much of this important work was conducted cross-sectionally leaving unclear the nature and stability of these associations across development into adulthood. Furthermore, although previous studies have laid the foundation intimating the predictive utility of P3-AR for the future development of substance use disorders, we are not aware of any studies that have directly evaluated this potential for EXT disorders broadly over the course of a decade. The present study evaluates both time-domain and time-frequency brain measures in a community sample of adult men (n = 325) assessed over a 12-year span for EXT spectrum disorders. We extend our previous work with this sample (Study-1) by including participants age-17 EEG data to allow for a determination regarding the stability between these measures and their associations with EXT. Furthermore, this sample allowed us to evaluate whether P3-AR at intake assessment forecast the eventual development of an EXT disorder by age 29, thus directly testing the utility of these measures as candidate endophenotypes for behavioral disinhibition P3 brain response as a candidate endophenotype for EXT Time-domain P3 amplitude An endophenotype is a quantifiable endogenous trait that is itself a product of the predisposing genotype (Iacono et al., 1998). These measures may potentially provide valuable tools for gene search efforts that attempt to uncover genes underlying complex, non-mendelian disorders since they are putatively simpler in structure and more proximal to gene action than clinical diagnoses (Gottesman & Shields, 1972). Most investigations explicating the P3 amplitude as a potential endophenotype have been conducted for 80
96 alcohol dependence where promising findings have been uncovered. For example, molecular genetic investigations have documented significant linkage to various chromosomes with visual P3 (Begleiter et al., 1998; Porjesz et al., 2002; Porjesz et al., 2005), as well as a dopamine receptor A1 allele which was linked to P3-AR in children at high familial risk for alcoholism (Hill et al., 1998). Also, results of a bivariate genome scan indicated that a chromosome region near the ADH3 locus may influence both P3 amplitude and risk for alcoholism (Williams et al., 1999) which is noteworthy since this region was also linked to the maximum number of drinks consumed in a day (Saccone et al., 2000) Time-frequency principal components More recently, advances in decomposition and data reduction techniques have allowed for the examination of refined time-frequency principal components (TF-PCs) from traditional EEG data. These components are thought to constitute changes of ongoing EEG activity evoked by temporally-related events (Basar, 1999 #2302) that are putatively closer to gene action (see review by Porjesz et al., 2005). Research into timefrequency components has focused predominantly on delta (0-3 Hz) and theta (3-7 Hz) since these frequencies contribute substantially to the composition of the P3 waveform (Yordanova, 1996 #2320;Karakas, 2000 #2308;Karakas, 2000 #2307;Basar-Eroglu, 1992 #2309). The delta component is associated with signal detection, decision-making (Basar, 1999 #2303) and consciousness (Karakas, 2000 #2308). Theta has been associated with selective attention (Basar-Eroglu, 1992 #2309), orienting (Basar et al., 1998), and associative processes that include encoding new information (Karakas, 2000 #2307). Although most investigations have focused on alcoholism, growing evidence suggests 81
97 that, like time-domain P3, these time-frequency measures may show potential utility as biomarkers for EXT broadly. For instance, studies show that both delta and theta components are reduced in alcoholics (Kamarajan, 2004 #2270;Jones, 2006 #2272) with reductions further noted in high-risk adolescent and young adult subjects with family histories of alcoholism (Kamarajan, 2006 #2266;Rangaswamy, 2007 #2271). Using the same community sample as in the current study assessed at age 17, Gilmore et al., (2009) evaluated the associations between various TF-PCs and EXT spectrum disorders. Timefrequency decompositions revealed the presence of five TF-PCs with one particular delta component spanning the P2-N2-P3 complex discriminating EXT cases from controls across all groups: i.e., ADHD, ODD, CD, and various substance use disorders. Molecular genetic studies using TF components have also yielded promising results. For example, an association was found between an event-related theta band oscillation of the P3 and a specific polymorphism in the muscarinic acetylcholine receptor, CHRM2 (K.A. Jones et al., 2004), that was linked to performance IQ (Dick, 2007 #2292), cognition, and memory (Comings, 2003 #2293). Significant associations with multiple single nucleotide polymorphisms (SNPs) in CHRM2 were also found with comorbid alcohol dependence and major depression (Wang et al., 2004) Development, P3, EXT, and substance use Although the results of these investigations are promising, key questions left unaddressed from extant P3 studies is the degree to which P3-related decrements reflect developmentally stable features of EXT, and whether these decrements can predict the development of these disorders. Answers to such questions are viewed as being fundamental to the notion that these measures reflect endophenotypes related to genetic 82
98 liability for EXT (Frederick & Iacono, 2006). However, the prospect that P3-AR is a developmentally-enduring index of EXT is made ambiguous by longitudinal investigations which suggest that this relationship may depend on developmental stage. For instance, ERP studies show that visual P3 amplitude undergoes normative significant decreases over the course of adolescence through early adulthood (Courchesne, 1978; Hill, Shen, et al., 1999). For example, using the same sample of males and ERP task as in the current investigation, Carlson and colleagues (2006) demonstrated significant and successive decreases in P3 amplitude across ages 17, 20, and 23 to further confirm previous findings with this sample (Katsanis et al., 1996). Such decreases in amplitude have been taken to suggest that P3-AR may lose its endophenotypic potential over development, with P3 amplitude hypothetically converging in subjects with and without familial risk for alcoholism by age 22 (Hill et al., 1999; Hill et al., 2002). Furthermore, the cumulative effects of substance exposure on these brain measures may account for the reductions seen between EXT cases and controls which may become more apparent as subjects age (Oscar-Berman, 2000; Pfefferbaum et al., 1997; Sullivan, 2000). Finally, although P3 amplitude has been viewed as a neurophysiological proxy for genetic risk underlying the neural substrate for EXT (behavioral disinhibition; see review by Iacono et al., 2008), few investigations have directly tested this notion by evaluating the utility of P3-AR to predict the development of EXT in the same subjects evaluated longitudinally; an important criterion for an endophenotype (Frederick & Iacono, 2006). Existing studies that have investigated this possibility were limited primarily to examining substance use outcomes, and then linking P3-AR to an earlier assessment point. Using this design, P3- AR was found to be associated with the initiation of alcohol use (Hill, Shen, Lowers, & 83
99 Locke, 2000), the development of substance use problems (Berman, Whipple, Fitch, & Noble, 1993) and even substance use disorders (Habeych, Charles, Sclabassi, Kirisci, & Tarter, 2005; Iacono et al., 2002). Whether such associations extend broadly across EXT spectrum disorders remain to be addressed Present study In our recent work (Study-1), we determined that P3 amplitude and TF component reductions were palpable across a comprehensive spectrum of both child and adult EXT disorders in the same sample of 29-year-old males used in the current study. Furthermore, we found little evidence that acute or prolonged substance exposure affected these results. In the present study, we extend and elaborate these findings across a 12-year span by assessing participants age-17 and age-29 time-domain and timefrequency data. Participants (n = 325) were evaluated longitudinally for a broad range of lifetime EXT disorders including substance dependence (alcohol, nicotine, cannabis), and various composite diagnostic groups such as childhood disruptive disorders (ADHD, ODD, CD), adult antisocial behavioral disorders (ASPD, adult antisocial behavior, AAB), and those diagnosed with any lifetime EXT. EEG activity at both ages was ascertained using a visual oddball task at site-pz. Assessment of potential acute and prolonged substance exposure effects on the various brain indices was also made. Based on existing literature and our previous work, we hypothesized that the association between EXT and P3-related reductions would be maintained at both ages. Finally, we expected to find that P3-AR at age-17 would predict the development of EXT by age
100 3.5. Methods Subjects Participants consisted of year-old males who were assessed as part of the Minnesota Twin Family Study (MTFS), a community-based longitudinal investigation of the development of substance use disorders and related psychopathology. These participants were originally identified for intake assessment through public records of twin births in Minnesota between January 1, 1972 and December 31, Approximately 84% of those meeting eligibility criteria (living with at least one biological parent and within a day s drive of Minneapolis, and lacking a mental or physical disability that would preclude their completing the daylong intake assessment) agreed to participate. At study intake, comparisons of participating families with those who declined participation indicated that parents of participating twins were slightly but significantly better educated than parents of nonparticipants; fathers averaged 0.2 more years of education and mothers averaged 0.3 years more (Iacono, Carlson, Taylor, Elkins, & McGue, 1999). Overall, however, there was little evidence of bias in the sample, and results indicated that the MTFS sample is generally representative of the population of Minnesota with respect to self-reported mental health and socioeconomic background. The vast majority of participants are Caucasian (99%), consistent with the makeup of the state at the time. Written informed assent was obtained from each participant. Participants who were still legal minors at intake gave written assent to participate and their parents consented to their participation. Participants who were 18 years old gave written informed consent to participate. 85
101 The sample was initially assessed when the twins were approximately 17 yearsold, and follow-up assessments were scheduled at ages 20-21, 24-25, and All assessments were designed to be in-person, although some individuals who could not complete an in-person assessment were interviewed by phone. Participants for the current study reflect those used in a previous P3 investigation (Study-1). However, in order to pursue the goals of the current study, participants with ERP data at both intake and third follow-up assessments were retained in the current investigation Interview and assessment procedure Twin participants were interviewed simultaneously, each in a separate room by a different interviewer. Interviewers had an M.A. or B.A. in psychology (or a related field), participated in intensive training in clinical diagnostic interviewing, passed written examinations, and satisfied proficiency criteria. At the intake assessment, twins were assessed for symptoms of DSM-III-R Childhood Disruptive Disorders (Attention-Deficit Hyperactivity Disorder, ADHD; Oppositional-Defiant Disorder, ODD; and Conduct Disorder, CD) using the revised version of the Diagnostic Interview for Children and Adolescents (DICA-R) (Reich, 2000; Welner, Reich, Herjanic, Jung, & Amado, 1987). The mother of the twins was also interviewed with the DICA-R-Parent version. All the questions asked of the twins were also asked of the mother as they pertained to the twins. To establish diagnoses for each Childhood Disruptive Disorder, a best-estimate approach was used that combined twin- and mother-reports (Kosten & Rounsaville, 1992; Leckman et al., 1982). Twins were also assessed with for substance disorders using the expanded substance abuse module (Robins et al., 1987) developed as a supplement to the World Health Organization's Composite International Diagnostic Interview (Robins et al., 86
102 1988). Twins were given a lifetime assessment during their intake evaluation at approximately age 17 (n = 578) and first follow-up assessment (mean age = 20 years; 80% participation rate). For both second (mean age = 24 years; 91% participation rate) and third follow-up evaluations (mean age = 29; 92% participation rate), participants reported on the time since their last assessment. Substance use diagnostic criteria were assessed for both licit (alcohol, nicotine) and illicit (amphetamines, cannabis, cocaine, hallucinogens, inhalants, opioids, phencyclidine, and sedatives) psychoactive substances. Finally, an interview adapted from the Structured Clinical Interview for DSM-III-R Personality Disorders (SCID-II) (Spitzer, Williams, Gibbon, & First, 1987) provides a detailed assessment for symptoms of Antisocial Personality Disorder (ASPD). Clinical interviews were reviewed by at least two individuals with advanced clinical training, who coded, by consensus, every relevant DSM-III-R symptom and diagnostic criterion. For study purposes, all substance dependence as well as all child and adult antisocial behavioral disorder diagnoses (i.e., ADHD, ODD, CD, Antisocial Personality Disorder, ASPD, and Adult Antisocial Behavior, AAB) were made at the definite (all diagnostic criteria satisfied) level of certainty. A diagnosis of AAB was given to participants who met criteria for ASPD except for the CD requirement (cf. Elkins et al, 1996). Cohen kappa reliability coefficients for the disorders assessed in the current study all exceeded 0.71 (Iacono et al., 1999) Diagnostic and control groups The three substance dependence groups included subjects who met alcohol, nicotine, or cannabis dependence criteria at the definite level of certainty. Individuals were assigned to these groups without regard for possible comorbid disorders to produce 87
103 representative samples of individuals with these diagnoses. However, to further evaluate the potential effects of comorbidity within and between diagnostic classes, three additional composite groups were created: 1) Any Childhood Disruptive Disorder captures subjects who met criteria for ADHD, ODD, or CD at intake assessment 2) Any Adult Antisocial Behavioral Disorder reflects those who met lifetime criteria for AAB or ASPD 3) Any Externalizing reflects participants who met lifetime criteria for any externalizing disorder (any childhood disruptive disorder, dependence to any substances assessed, any adult antisocial behavioral disorders) by third follow-up assessment. Thus, a total of six externalizing comparison groups were included for analyses. A Control group was also formed consisting of subjects who were free of any externalizing disorders, including possible abuse for any licit of illicit substances. Table 1 shows the number of participants who received these diagnoses by age 29. {Table 1 here} P3 Event-related potential (ERP) procedure ERP data were acquired as part of a battery of psychophysiological tasks administered to all twin participants during both their intake and third follow-up assessments. All participants completed the procedure at the same time of day to minimize circadian and postprandial effects on physiological measures Intake assessment EEG activity at intake lab assessment for each subject was recorded from three parietal electrodes using an electrode cap: one over each hemisphere (P3 and P4) and one 88
104 at the midline scalp (i.e., site-pz). Linked earlobes served as reference while an electrode on the right shin served as the ground electrode. Electrooculographic (EOG) data were recorded from a pair of electrodes: one at the supra-orbital ridge and one on the outer canthus of the eye. Impedances were kept below 5 kv for scalp electrodes and below 10 kv for EOG recordings. All data were acquired using a Grass Model 12A Neurodata system and filtered with a passband of 0.01 to 30 Hz (half-amplitude). Data were digitized with 12 bits of resolution at a rate of 256 samples per second Third follow-up assessment Upgraded EEG software and hardware were added to the psychophysiological assessment battery by participants third follow-up visit to allow for higher-density EEG measurements from sixty-one scalp electrodes using the ActiveTwo BioSemi electrode system (BioSemi, Amsterdam, the Netherlands). The scalp electrodes were digitized at 1024 Hz with an open pass-band from DC to 205 Hz. In addition, four monopolar leads recorded electrooculographic (EOG) activity which was subsequently used to derive horizontal and vertical bipolar EOG channels. Detailed description of the referencing and grounding arrangements used by the ActiveTwo BioSemi electrode system is available online ( As opposed to a single standard ground electrode used in traditional EEG systems, this system uses two separate electrodes: Common Mode Sense active electrode and Driven Right Leg passive electrode. A feedback loop is formed by these 2 electrodes which drives the average potential of the subject (the Common Mode voltage) as close as possible to the ADC reference voltage in 89
105 the AD-box. The ADC reference can be considered as the amplifier zero. All data were re-referenced to activity from averaged linked ears for analysis after data acquisition Visual ERP task At both assessments, the rotated-heads oddball paradigm developed by Begleiter et al. (1984) was used to elicit a P3 response in the event-related potential. P3 amplitude obtained from this paradigm has been shown to provide a reliable (Yoon et al., 2006) and heritable (Katsanis et al., 1997; van Beijsterveldt & van Baal, 2002; Yoon et al., 2006) marker of substance use disorders and other externalizing psychopathology that indexes both morbid (e.g., personal history; see review by Iacono et al., 2003) and premorbid (i.e., family history; see Begleiter et al., 1984) concomitants over decades of research. During ERP recording, subjects were seated in a sound attenuated room, instructed to pay close attention to images appearing on a computer monitor, and asked to respond as quickly as possible by pressing either a left or right button when target stimuli appeared. Targets consisted of infrequently occurring schematics of heads with a nose pointed vertically up or down on the screen and only one ear represented on either the left or right side. Easy targets (n = 40) consisted of heads with noses pointed towards the top of the screen with the left or right ear appearing directly on the side corresponding to the correct response button (e.g., nose pointed up with ear on left of head requires left button press). In contrast, hard targets (n = 40) consisted of heads facing towards the bottom of the screen with either left or right ear appearing on the head which corresponds to the opposite response button (e.g., nose pointed down with ear on left of head requires right button press). Consistent with past research using this rotated heads paradigm, easy and hard trials together composed targets. Subjects were also instructed to ignore 90
106 frequently occurring, interspersed non-target stimuli which consisted of ovals (n = 160). All stimuli were displayed for 100 ms, with intertrial intervals randomly varying between 1 and 2 s. The ERP task took 15 min to complete. Performance measures associated with the completion of the ERP task was available at both assessments including false alarm (i.e., number of nontarget stimuli (160 ovals) incorrectly identified as targets), reaction time (the average time it took for subjects to make a button press to identify target stimuli), and total hits (i.e., number of 80 targets correctly identified) data. Previous studies using extended samples from the current study at both intake (see Iacono et al., 2002) and third follow-up assessment (see Study-1) did not find differences between EXT probands and controls on any task performance indicators. Thus, these measures were not considered further ERP data processing, artifact tagging/rejection Intake assessment A computer algorithm was used to identify the P3 peak after stimulus onset. One of several trained individuals supervised the algorithm and overrode its selection when necessary. In particular, when two peaks of approximately equal amplitude occurred within 100 ms of each other, suggestive of separate P3a and P3b peaks (Squires, Squires, & Hillyard, 1975), we chose the second. Corrections for eye blinks as well as other ocular artifacts were made offline using standard regression-based procedures (Gratton, Coles, & Donchin, 1983). In addition, waveforms were filtered using a 7.5-Hz lowpass zerophase digital filter (3 db down) in order to reduce high frequency artifacts not eliminated by online (analog) filters. ERP data were carefully checked for outliers based on distributional inspections of P3 latency and amplitude values as well as extreme task 91
107 performance errors. If P3 data could not be re-scored in cases where data were anomalous (e.g., 4 standard deviations from group mean), these subjects were dropped from the study. A total of 5 subjects were dropped for these reasons (3 Controls, 2 Probands) Third follow-up assessment The addition of high-density EEG data required more extensive multilevel data processing procedures. This was conducted using EEGLAB v6.01b (Delorme and Makeig, 2004) with online descriptions available elsewhere ( Operations were implemented interactively in Matlab 7.1 using sets of generalized processing scripts available within the EEGLAB toolbox (Delorme & Makeig, 2004). Each participant s EEG data were high- and lowpass filtered at 0.1 Hz and 8-Hz cutoff frequencies respectively and down-sampled to 256 Hz. Subsequently, epochs of ms around the presentation of the visual stimuli were extracted from each trial with a prestimulus baseline window of -500 to -1 ms. Rejection of artifactual data began with the removal of ocular activity (i.e., prominent blinks and other movements) from the scalp data. This was conducted using independent component analysis (ICA) (Makeig et al., 1996) which has been used in a number of EEG studies to separate distinct eye blink, muscle, artifactual processes (see review by Delorme et al., 2006). ICA was applied to the scalp data using the Runica decomposition algorithm in EEGLAB which essentially derives independent components that act as spatial filters which are then applied to the multi-channel data. These independent component filters were chosen to maximally reflect temporally-independent signals in the channel data. Blink components were identified on the basis of crosscorrelations between component activity and activity from the vertical EOG channel. 92
108 Components with correlations above 0.70 with the criterion channel were removed. Remaining suspected blink components were also reviewed and manually rejected based on time-course, morphology, and topography. The remaining components were back projected to the scalp to constitute EEG data with minimal contributions of these ocular artifacts. The next step involved further artifact tagging and rejection with three semiautomated methods based on criteria using extreme values, unusual distributions, and spectral patterns (see Delorme et al., 2007 for discussion of these and other methods). Identification of artifacts based on an extreme values approach relied on the detection of EEG values that exceeded an absolute threshold which was set at 150 µv from baseline. The use of unusual distributions to flag artifacts involved the identification of data that was abnormally distributed, displaying either peaky activity (e.g., eye-blink artifacts) or abnormally flat activity that may be due to a number of alternating current (AC) or direct current (DC) artifactual sources (e.g., strong induced line noise from electrical machinery, lighting fixtures or loose electrode contacts). This method identifies artifacts defined in absolute terms of one standard deviation from the mean kurtosis value for allchannel activity. The third method involved finding abnormal spectral patterns using rejection thresholds defined by amplitude changes (20-60Hz) relative to baseline in db (- 100dB to +37dB). This procedure derives trial spectra by decomposing frequencies based on the slepian multitaper function. After deriving trial spectra, the average power spectrum is removed from each trial spectrum and artifacts are identified when the remaining spectral differences exceed the preset thresholds. 93
109 Time-domain P3 amplitude peak identification For the present investigation, ERP data from the site-pz electrode site recorded at both assessments were chosen for analysis because of its importance in the P3 literature (Hill, Muka, Steinhauer, & Locke, 1995; Hill, Steinhauer, Lowers, & Locke, 1995; Hill & Steinhauer, 1993a; Porjesz & Begleiter, 1990; Steinhauer & Hill, 1993) and because it allowed for comparisons at a common electrode site between the two EEG systems and assessment periods. P3 amplitude peak was identified algorithmically using a peak-inwindow approach specifying the positive apex within a specified time range in milliseconds occurring after stimulus presentation. For intake assessment this time window was specified for approximately ms post-stimulus, whereas a slightly delayed window of ms was used for third follow-up assessment. P3 latency was defined as the time interval between stimulus-onset to the apex in milliseconds. Although a variety of P3 amplitude identification procedures exist, this approach has been used extensively in numerous studies examining disinhibitory disorders (see review by Gilmore et al., 2009), including those using MTFS samples (see Iacono et al., 2008) Time-frequency decomposition Procedure Decomposition of ERP data into time-frequency transforms (TFTs) were performed on both the age-17 intake and age-29 follow-up three data at site-pz using procedures detailed by Bernat et al. (2005, 2007) with relevant details also available by Gilmore et al. (2009). The same series of generalized scripts were run on both sets of data through Matlab (version 7.3) to convert ERP data into TF surfaces using Cohen s class RID transform method. To allow greater comparability to both existing time-domain P3 94
110 studies as well as between intake and follow-up three data, decompositions were performed on averaged time-domain data to enhance brain activity that was consistently phase-locked to target stimuli, while reducing non-phase-locked activity (e.g., induced). Furthermore, in order to evaluate subsequent findings to those from a recent TFexternalizing study from our lab, all decompositions were performed using a frequency range of Hz which was found to achieve the best resolution for activity decompositions within the frequency range of interest (Gilmore et al., 2009). Decompositions were performed on the entire, baseline-corrected (-500 to -10 ms), 2 second epoch to allow rejection of edge effects from the transform since, as with any filer, the edges of the signal may be marred when conducting TF transformations (Bernat et al., 2005). PCA was then performed on these TF surfaces in order to decompose these surfaces into TF components a procedure that is similar in its application to signals in the time or frequency domain. The difference with the TF-PCA procedure was the reorganization of each TF surface into a vector to generate a matrix of subjects in rows and TF energy points in columns. The covariance matrix was then subject to Varimax rotation to attain simple structure by maximizing the amount of variance associated with the smallest number of variables (Chapman & McCrary, 1995). The component vectors were rearranged back into surfaces reflecting each TF-PCA component s matrix of rotated component loadings for each TF point. The number of components extracted was based on inspection of the scree plot of singular values to determine a break (or elbow ) that may indicate a reduction of explanatory variance for components falling after the break. Finally, each subjects original TF surface was weighted using the extracted TF- PCA components. Each original TF point was multiplied by the corresponding point in 95
111 the matrix of rotated loadings for each component. This produced weighted data surfaces for each subject and for each TF-PCA component whose data points represented energy in units weighted by the component loadings. Based on previous work by Gilmore et al. (2009) with this sample at age 17, a 5- factor TF component solution was chosen a priori in order to allow for comparisons across assessments. Further taking their lead, we used component scores representing peak energy on the weighted TF data surface (i.e., the TF point with the highest energy) as dependent variables to evaluate differences between participants w/ various disinhibitory disorders and controls Decomposition results and component pairings Figure 1 shows the 5-factor TF solutions corresponding to age-17 and age-29 ERP data. In order to evaluate the relationship between these components with EXT over the assessment period, TF-PCs at age 17 and age 29 were paired for eventual analyses in a repeated-measures design. Component matching was determined using three primary methods ordered by importance: 1. The age-29 TF solution was rotated to match the age-17 solution with further inspection of the correlations between factor loadings. 2. The factor scores corresponding to the various TF components were correlated across age. 3. The time-course and morphology of the TF components were inspected for similarity. Results of these pairings are also presented in Figure 1, along with correlations for the factor scores and factor loadings between corresponding components. The numbers associated with each TF component (e.g., PC1) reflects the ascending order of 96
112 the component based on the amount of variance accounted for in the varimax-rotated solution for decomposition at each age. One TF component at each age did not pair successfully and each was dropped from further consideration (i.e., PC3 at both ages). Although there were slight differences in the morphology as well as time-course for the remaining TF component pairs, correlations between these pairs were both robust and significant across age 17 and 29 (median correlation = 0.52; all p-values <.001). For the PC1 (age-17) PC1 (age-29) pair, these components appeared to reflect theta activity corresponding with the rise P3. The PC2 (age-17) PC4 (age-29) component pair reflected low-frequency delta with a long activity duration that encompassed the P2-N2- P3 complex. PC4 (age-17) PC5 (age-29) constituted a higher-frequency delta that spanned the back edge of P3 peak as well as the beginning of the slow wave after the peak. Finally, PC5 (age-17) PC2 (age-29) spanned the front edge of P3 as higherfrequency delta components. {Figure 1 here} 3.9. Statistical analyses For P3 data, a series of 2 (assessment age) by 2 (group) repeated measures ANOVAs were conducted using PROC MIXED in SAS with time-domain or timefrequency values observed at age 17 and age 29 as a within-subjects effect and each of the six EXT groups as a between-subjects effect. In order to correct for correlated observations due to having twins in the sample, the model included a random intercept to account for between-twin pair differences in means on the ERP measures. In addition to allowing us to accommodate non-independence represented by twins, the mixed model 97
113 approach uses all available data, unlike standard repeated measures ANOVA, which is appropriate when data are missing at random. Univariate ANOVAs were also conducted to evaluate potential attrition effects. These were made using PROC SURVEYREG in SAS (version 9.1) to account for twins. SURVEYREG uses a Taylor series expansion to derive appropriate standard errors (Fuller, 1975) when data are clustered and result in ordinary least squares standard errors being reduced by within-cluster similarity of observations. A SAS macro (smsub.sas) was subsequently used to derive means and standard errors for the different groups. A significance criterion of alpha <.05 was used for all analyses. For time-domain P3 amplitude and time-frequency results, Cohen s D effect sizes were calculated separately by age by taking the mean difference for a particular brain measure between controls and comparison groups and dividing by the overall group standard deviation. In order to determine whether P3 amplitude served as a predictive index for future EXT, participants who were identified as controls at age-17 intake assessment were split by those who remained EXT disorder-free (n = 75) and those who were diagnosed with EXT by age-29 (n = 78). First, group comparisons were made on P3 amplitude at age-17 and age-29 to determine whether P3 differences existed prior to the third follow-up visit as well as thereafter. Secondly, logistic regression was conducted in SAS to formally evaluate the predictive capability with EXT status at age-29 as outcome and intake P3 amplitude as the single predictor. An odds ratio with the 95% confidence interval was also obtained. This gives the change in odds of developing EXT associated with a onemicrovolt increase in P3 amplitude. 98
114 3.10. Ancillary analyses Attrition Although analyses in Study-1 indicated no significant bias between those who did or did not participate at third follow-up assessment on key intake variables, the current sample was further reduced by 53 cases. Therefore, in order to assess potential biases in the sample that may have resulted from this further exclusion, analyses were conducted comparing the participants who were excluded for any reason from the current study (n = 253) from those included (n = 325) on the following intake variables: 1) P3 amplitude: data from site-pz was assessed at intake and provided an opportunity to determine whether included and excluded subjects differed on P3 amplitude. 2) Full-scale IQ. Participants cognitive ability was also assessed at intake (cf. Kirkpatrick et al., 2009) using a short form of the Wechsler Adult Intelligence Scale- Revised (WAIS-R) which consisted of two Verbal subtests (Information and Vocabulary) and two Performance subtests (Block Design and Picture Arrangement). Full-scale IQ was determined by prorating the scaled scores for these four subtests and scores for the study sample ranged from 69 to 148 (mean = 103.0, SD = 14.0). 3) Paternal externalizing. To evaluate whether differences in familial risk existed for externalizing disorders, comparisons were also made using paternal externalizing symptoms. Externalizing factor scores were derived for participants biological fathers using four symptom count variables: conduct disorder, adult antisocial behavior, alcohol dependence, and drug dependence. Drug assessment covered the same eight types of substances evaluated in twin participants (i.e., amphetamines, cannabis, cocaine, hallucinogens, inhalants, opioids, PCP, and sedatives). The substance for which the 99
115 greatest number of symptoms was established provided the paternal drug dependence variable (cf. Krueger et al., 2002). With the four symptom count variables positively skewed, all variables underwent logarithmic transformations before being entered into a Principal Components Analysis (PCA). Results of the PCA indicated that one factor accounted for the majority of relationship between the four symptom count variables, displaying an eigenvalue over 2.0 and accounting for approximately 53% of the variance. Factor scores were calculated for each father and these values served as paternal externalizing scores for subsequent group analysis. 4) EXT diagnosis at intake. To evaluate the possibility that those who were included and excluded in the current study differed in their likelihood of ever having been diagnosed with an EXT disorder at their age-17 assessment, the proportions of subjects who were ever diagnosed in the two groups were compared. The effect of the grouping variable (included vs. excluded subjects) on intake P3, full IQ, and paternal externalizing was assessed in separate ANOVAs with group as the sole fixed effect. A chi-square analysis was performed to assess the proportions of EXT diagnoses between the groups. As in our previous analyses (Study-1), ANOVAs revealed that none of the three outcomes measures differed significantly (all Fs < 1.68, all p-values > 0.20). Furthermore, the percentages of diagnosed participants in the included and excluded groups were 33.3% and 41.5%, respectively, a non-significant difference, χ 2 (1, N = 362) = 1.3, p = Overall, these analyses indicate that the further exclusion of subjects from this study did not bias the sample on these measures. 100
116 Assessment for recent and prolonged substance use Although participants were asked to desist from using any substances 24-hours prior to their in-person visit, self-report data indicated that 70 participants had used either alcohol or other psychoactive substances (i.e., marijuana, amphetamines, barbiturates, tranquilizers, cocaine, heroin, opiates, PCP, psychedelics, inhalants, gas and other substances) prior to EEG assessment. Thus, to determine whether this recent use may potentially influence group comparisons on the various brain measures, a chi-square analysis was performed between a dichotomous group reflecting those who reported using any or none of these substances against those with or without a lifetime history of EXT (Any EXT). The result was not significant (χ2 (1, N = 57) = 0.1, p = 0.73) indicating that those diagnosed with any EXT disorder and the controls did not differ in past 24-hour substance use. Participants were also evaluated for substance use history in order to determine whether the effects of cumulative exposure may contribute to any observed differences on the brain measures. Neurotoxic effects have been noted with prolonged substance use, especially over the course of adolescence through adulthood (e.g., Oscar-Berman, 2000). Furthermore, these effects may most likely occur in those with disinhibitory psychopathology due to the inability to inhibit use. Thus, any observed P3 deficits in the EXT groups may be reflecting the effects of prolonged use and not genetic risk for behavioral disinhibition per say. To assess the effects of cumulative substance use on P3 results, five measures of use history were derived from the substance abuse module assessed from age-17 through age-29. Although differences in reporting periods and interview items were apparent across assessments, five proxy measures were derived: 101
117 1) Cigarettes: total number of cigarettes smoked during heaviest use per day from intake through second follow-up. 2) Cigarettes: total number of years smoked starting from the earliest age the participant reported smoking heavily to age last used tobacco. 3) Alcohol: the average number of drinks during the heaviest period of drinking in their lifetime. 4) Alcohol: lifetime number of intoxications from intake through second follow-up. 5) Illicit drugs: number of times reported using any illicit drugs summed across assessment periods from intake through third follow-up. For each of the five substance use history measures, dichotomous groups were created using decile splits. These five groups were then compared on the timedomain and TF component measures using repeated-measures ANOVAs. Results from group analyses yielded no significant results when compared on time-domain P3 amplitude across assessments (all F s < 3.02, all p-values > 0.09), nor for any TF component pairs (all Fs < 3.75, all p-values > 0.09) Results Omnibus F-statistics are reported in text. Table 2 displays descriptive statistics (means, standard deviations) for P3 amplitude peak/latency values as well as values associated with the time-frequency component pairs at age-17 and age-29. The p-values associated with statistical comparisons for the substance dependence (alcohol, nicotine, cannabis) and composite diagnostic groups (any childhood disruptive disorder, adult antisocial behavioral disorder, lifetime EXT) are also presented in Table 2. Multilevel repeated-measures analyses produce a separate control group standard deviation for each 102
118 comparison depending on exactly which subjects are included in the analysis. Therefore, to record standard deviations for controls on a particular brain measure, these values were taken from the comparisons against the composite diagnostic group reflecting those with any lifetime EXT disorder. Figures 2-6 provide effect size graphs coinciding with all EXT groups and P3-related measures Time-domain analyses Table 2 shows that comparisons for P3 latency did not yield any significant group result (all Fs < 1.11, all p-values > 0.29). Furthermore, there were no significant interactions between any group with assessment age (all Fs < 1.37, all p-values > 0.24). However, there was a strong effect of age (all Fs > , all p-values <.001) indicating that latency was significantly reduced by age 29 confirming previous observations with this sample (e.g., Katsanis et al., 1996). Figure 1 shows that despite morphological variation in the grand average ERP waveform between age-17 and age-29, a robust correlation was observed for P3 peak between these ages (r = 0.50, p <.01). Furthermore, Table 2 reveals that P3 peak group analyses were straightforward in showing that all comparisons were significant (all Fs > 11.14, all p-values <.001). No significant interactions between group by age were detected (all NS: all Fs < 3.21, all p-values > 0.08), although a strong age effect was observed (all Fs > , all p-values <.001) indicating that P3 peak amplitude declined by age-29 across all groups. Figure 2 reveals that despite a 12-year assessment span, there appeared to be strong consistencies in terms of magnitude of effects related to P3 differences between EXT groups and controls. Overall, the median effect size associated with having any EXT diagnosis across age was At age-17 and age-29, median effect 103
119 sizes of 0.51 and 0.64 were respectively observed across all groups. Observation of effects across age for the various EXT groups further revealed that higher effect sizes were associated with having any adult antisocial behavioral disorder (median effect size = 0.79), followed by having any childhood disruptive disorder (median effect size = 0.60), although median effect sizes across all EXT groups showed comparable magnitudes (see Figure 2). {Table 2 here} {Figure 2 here} Time-frequency analyses Analyses of time-frequency component pairs similarly revealed consistent effects across group analyses as shown in Table 2, with most EXT groups displaying component score reductions compared to controls at both age-17 and age-29. The one exception was provided by the cannabis dependence group where the PC1 (age-17) PC1 (age-29) as well as PC5 (age-17) PC2 (age-29) component pairs yielded trend-level findings (Fs < 4.33, 0.05 p-values 0.10, across pairs). However, for all other group comparisons, the TF components significantly differentiated EXT groups from controls (all Fs > 4.33, all p-values <.04). The main effect of age was also apparent on all TF component pairs which, like time-domain amplitude, displayed reductions over age-17 to age-29 (all Fs > 93.71, all p-values <.001). Figures 3-6 display effect size graphs associated with component pairs PC1 PC1, PC2 - PC4, PC4 PC5, and PC5 PC2 respectively. Inspection of these figures show that, like time-domain results, the TF component pairs yielded consistent magnitude of effects across age-17 and age-29. In general, when observed across age over all EXT groups, larger effect sizes were apparent for PC2 - PC4 104
120 (Figure 4; median effect size = 0.53) followed by PC4 - PC5 (Figure 5; median effect size = 0.47), PC5 - PC2 (Figure 6; median effect size = 0.43), and PC1 - PC1 (Figure 3; median effect size = 0.33). Also in parallel to the time-domain observations, group effects tended to be larger for the adult and child behavioral disorder groups with effect sizes across all TF component pairs yielding effect size values of 0.63 and 0.51, respectively. Finally, although there were no significant interactions detected between group by age for two TF component pairs (PC1 PC1, PC5 PC2: Fs < 3.34, p-values > 0.07), such significance was detected for the other two pairs: PC2 PC4 and PC4 PC5 (Fs > 4.18, all p-values < 0.04), though not for cannabis dependence (Fs < 2.37, p-values < 0.13). For these pairs, univariate analyses were conducted to determine whether group comparisons at each age produced significant differences. To simplify these analyses, each age-17 and age-29 TF component in the component pairs were evaluated separately between the Any EXT group and controls. Results showed that while significant interactions were detected statistically, all individual TF components were significantly decreased for EXT participants at both age-17 (PC2, PC4: Fs > 10.36, p-values < 0.002) and age-29 (PC4, PC5: Fs > 7.55, p-values < 0.007) in line with observation of effect size graphs (see Figures 4 and 5) which show comparable effects at both ages for the Any EXT composite diagnostic group. {Figures 3-6 here} Prediction results Table 3 shows descriptive statistics (mean, SD) for P3 amplitude associated with participants who did (n = 75) or did not (n = 78) remain EXT-free by age-29 from their initial status as Controls at intake assessment. Results of the t-tests were clear in showing 105
121 that despite their initial categorization in the control group, those who eventually met diagnosis for any EXT disorder displayed reduced P3 amplitude at both age-17 and age- 29 compared to participants who remained controls throughout assessments. Interestingly, results of the logistic regression analysis further supported these observations by indicating that age-17 P3 amplitude could reliably distinguish between those who did or did not remain EXT-free: χ2 (1, N = 153) = 4.89, p = An odds ratio of 0.95 (confidence interval: 0.91, 1.00) was produced suggesting that a microvolt (µv) increase in P3 amplitude was associated with an approximately 5% decrease in categorization as an EXT case. {Table 3 here} Discussion Overall summary The current study provides an elaboration and extension of our previous work (Study-1) and work from our colleagues (Iacono et al., 2002; Gilmore et al., 2009) to show that both time-domain P3 amplitude as well as various time-frequency components reflect stable and predictive brain indices related to genetic risk for EXT spectrum disorders. These brain measures yielded robust correlations across a 12-year span and successfully differentiated EXT groups from controls at both age-17 and age-29 with remarkable consistency. Furthermore, this study provided pivotal evidence summarizing decades of work by demonstrating that P3 amplitude reduction can forecast the development of EXT disorders as genetic proxies over a decade later. 106
122 Time-domain results Time-domain P3 amplitude was strongly correlated (Figure 1; r = 0.50) between age-17 and age-29. This is impressive notwithstanding the long span between assessments since EEG data were extracted using two completely different systems at these ages. Furthermore, this association was seen despite major changes in brain development that would have likely occurred, including large-scale cortical and subcortical modifications (Sowell, Thompson, Holmes, Jernigan, & Toga, 1999; Sowell, Thompson, Tessner, & Toga, 2001) as well as parietal decreases in P3 activity over late adolescence up to the senior ages (Carlson & Iacono, 2006; Fabiani, Friedman, & Cheng, 1998; Hill et al., 1999; Mullis, Holcomb, Diner, & Dykman, 1985). Group results were straightforward in showing that P3-AR was seen across all EXT diagnostic groups at both ages. The stability of group effects across age is further notable because the developmental period covered in this study is one in which heavy substance misuse was most likely to have occurred. Initiation of substance use and misuse is greater during adolescence than at any other time during development (Johnston, O'Malley, & Bachman, 2003). Furthermore this misuse may affect the brain differently depending on developmental stage. For instance, animal and human studies show that the adolescent brain is affected by alcohol and nicotine in distinct manner relative to adults (see review by Schepis, Adinoff, & Rao, 2008). Despite this, the magnitude of effects for P3 reduction was comparable at age-17 and age-29 across the substance dependence groups (Figure 2), providing continued evidence that P3-AR provides a proxy of genetic risk for EXT especially for younger samples that have not yet fully passed the age of risk for substance use disorders (e.g., Yoon et al., 2006). Perhaps the strongest evidence for this 107
123 assertion is the finding that adolescents initially classified as controls who went on to receive a diagnosis by age 29 displayed significant P3-AR compared to those who remained free of EXT (Table 3). This extends the work of Iacono et al. (2002) who noted this reduction in the same community sample at age 20 who developed a substance use disorder from intake. Furthermore, we uniquely showed that P3 shows predictive utility, with a microvolt increase in age-17 P3 amplitude being associated with a 5% decrease in being an EXT case at age-29. This supports one criterion for a candidate endophenotype offered provided by Frederick & Iacono (2006) in showing that P3-AR can forecast the future development of the EXT Time-frequency results Analyses of the time-frequency data across age-17 and age-29 yielded results similar in scope to those from the time domain. For instance, the various TF components corresponding between the two ages displayed 12-year correlations that were comparable to time-domain amplitude, ranging from 0.45 to 0.54 (Figure 1; median correlation = 0.52). Group comparisons showed that all four TF component pairs successfully discriminated the EXT diagnostic groups (Table 2). Furthermore, results from this study support previous observations from Gilmore et al., (2009) and our recent work (Study-1) which found that a low-frequency delta component (PC2 (age-17) PC4 (age-29)) performed particularly well in differentiating EXT groups from controls. This component pair, which spanned the P2-N2-P3 complex, yielded the largest correlation at age-17 and 29 and appeared morphologically stable between those two ages. Furthermore, when group results were observed across age over all EXT groups, the largest effect sizes were apparent for this delta component pair (Figure 4; median effect size = 0.53). Delta has 108
124 been associated with important psychological processes including signal detection, decision-making (Basar, Basar-Eroglu, Karakas, & Schurmann, 1999a) or consciousness (Karakas, Erzengin, & Basar, 2000a), and is reduced in alcoholics (Kamarajan, 2004 #2270;Jones, 2006 #2272) as well as subjects with familial risk for alcoholism (Kamarajan, 2006 #2266;Rangaswamy, 2007 #2271). Although molecular genetic studies using TF components have yielded promising findings linking theta to a specific polymorphism in CHRM2 (K.A. Jones et al., 2004) that may relate to alcohol dependence (Wang et al., 2004), further research is needed to uncover such associations for the delta TF component Time-domain, time-frequency, and adult antisocial behavioral disorders Results from the current study further extend and support our previous findings in Study-1 by showing that, although P3-related brain measures demonstrate effectiveness as broad indices of EXT across development, these associations are pronounced for the group consisting of subjects diagnosed with adult antisocial behavior (AAB) or antisocial personality disorder (ASPD). For instance, large effect sizes were seen for time-domain P3 results (Figure 2; range across age: ; median = 0.79). Furthermore, timefrequency component analyses revealed comparable results with the largest effects seen for the low-frequency delta component mentioned previously (Figure 4; effect size range = ; median = 0.71). Generally, a median effect size of 0.61 was observed for all TF component pairs across age. Along with observations from Study-1, which include the presence of a strong frontal theta reduction in ASPD, these results collectively suggest that antisocial behavioral disorders may generally provide useful cases for future molecular genetic studies that are conducted in conjunction with time-frequency data. 109
125 3.13. Limitations The current study may be limited in certain respects. For example, although multiple methods were used to match TF component pairs between age-17 and age-29, these components may not reflect the same neurocognitive processes at both ages. Future work is needed to address this important developmental issue. Also, the results from our studies suggest that TF components may provide useful candidate endophenotypes for EXT spectrum disorders. Although our results are suggestive, further explicating work is required that parallels the work for time-domain P3, including the estimation of heritabilities for the various delta and theta components. This work is currently being pursued in our lab. Furthermore, like Study-1 we found little evidence for the potential influence of both acute (24-hour) and prolonged (years) substance exposure on the group results. However, this may be due to the limited time window for age in the current study. Future follow-up assessments may be necessary to evaluate such effects. Finally, although this community-based sample offers unique research opportunities, it is nevertheless comprised of predominantly Caucasian twin participants from Minnesota, potentially limiting generalizability to samples similarly composed. Despite these limitations, the findings from this study together with Study-1 extend and elaborate those of Iacono et al. (2002) and Gilmore et al. (2009) by demonstrating that both time-domain and time-frequency brain components provide effective, stable, and predictive brain measures of EXT across adolescence and adulthood. Collectively, these community-based studies suggest that P3-related measures may provide effective multivariate endophenotypes (Iacono, Carlson, & Malone, 2000) that tap the 110
126 neurobehavioral deviations associated with behavioral disinhibition (Iacono, Malone, & McGue, 2008). 111
127 Frequency of Dependence Cases by Stage Table 1: Total lifetime study n s of externalizing psychopathology in male participants assessed from intake (age 17) through third follow-up (age 29) Intake (Age 17) FU1 (Age 20-21) FU2 (Age 24-25) FU3 (Age 29-30) Controls a Childhood Disruptive Disorders (CDDs) b Oppositional Defiant Disorder (ODD) Attention-Deficit Hyperactivity Disorder (ADHD) Conduct Disorder (CD) Any (ODD, ADHD, or CD) Adult Antisocial Behavioral Disorders Adult Antisocial Behaviors (AAB) Antisocial Personality Disorder (ASPD) Any (AAB or ASPD) Licit Substance Use Disorders (SUDs) Alcohol Nicotine Any (Alcohol or Nicotine) Intake FU1 FU2 FU3 Illicit SUDs Amphetamines Cannabis Cocaine Hallucinogens Inhalants Opiates
128 PCP Sedatives Any (illicit drug dependence) Composite Variables Any SUDs (Licit or Illicit) Any Disinhibitory Behaviors (CDDs or AABDs) Any Externalizing (CDDs, AABDs, Licit, Illicit SUDs ) Note: Diagnoses were made at the definite level of certainty via self-report data acquired through all four assessments (i.e., intake, follow-up 1 thru 3) except for Childhood Disruptive Disorders (see point b below). a. Controls consist of participants who did not present EXT diagnoses up to that assessment stage. b. Diagnoses for Childhood Disruptive Disorders (ADHD, ODD, and CD) were established using best-estimate diagnoses using both self and mother reports to ensure greater reliability. Rates for these disorders are consistent across assessments since information for these diagnoses were established during intake assessment only. 113
129 Table 2. Mean and standard deviation (M/SD) for P3 amplitude peak (µv), P3 latency (ms), and time-frequency principal components (PC; weighted energy units), and results of statistical comparisons for composite EXT groups P3 Latency Controls (N = 75) Alcohol (N = 122) Nicotine (N = 119) Cannabis (N = 47) CDD (N = 85) Adult ASB (N = 49) Any EXT (N = 187) Age 17 (M/SD) (60.68) (62.25) (66.84) (69.71) (64.69) (74.08) (64.00) Age 29 (M/SD) (43.73) (43.73) (45.68) (44.19) (43.24) (39.89) (44.77) Group Age <.001 <.001 <.001 <.001 <.001 <.001 Group x Age P3 Amplitude Age 17 (M/SD) (7.55) (7.90) (7.66) (8.64) (8.09) (8.03) (7.55) Age 29 (M/SD) (3.71) (4.02) (4.33) (3.94) (4.73) (3.91) (4.36) Group <.001 < <.001 <.001 <.001 Age <.001 <.001 <.001 <.001 <.001 <.001 Group x Age Age 17 (PC1)/Age 29 (PC1) Age 17 (M/SD) (15.39) (13.92) (13.25) (14.62) (11.76) (12.24) (13.27) Age 29 (M/SD) (8.83) 9.87 (8.78) 8.89 (8.17) 9.32 (7.75) 9.53 (9.70) 8.60 (8.31) 9.73 (8.67) Group (G) Age <.001 <.001 <.001 <.001 <.001 <
130 Group x Age Age 17 (PC2)/Age 29 (PC4) Age 17 (M/SD) (25.91) (21.95) (19.96) (21.32) (19.85) (17.43) (21.23) Age 29 (M/SD) (8.23) (8.23) (8.58) (7.87) (9.26) (7.39) (8.97) Group <.001 <.001 <.001 Age <.001 <.001 <.001 <.001 <.001 <.001 Group x Age Age 17 (PC4)/Age 29 (PC5) Age 17 (M/SD) (25.28) (20.46) (19.20) (18.95) (19.74) (16.56) (20.18) Age 29 (M/SD) (9.56) (9.55) (9.36) (8.38) (10.33) (8.02) (9.89) Group < <.001 <.001 <.001 Age <.001 <.001 <.001 <.001 <.001 <.001 Group x Age Age 17 (PC5)/Age 29 (PC2) Age 17 (M/SD) (20.69) (17.12) (16.04) (17.97) (14.36) (14.34) (16.34) Age 29 (M/SD) (9.04) (9.09) (8.24) (7.34) (9.39) (7.59) (8.87) Group < < Age <.001 <.001 <.001 <.001 <.001 <.001 Group x Age Table 3. Descriptive statistics and t-test results for intake control cases who did or did not develop EXT by age
131 P3 Peak Amplitude (µv) Controls at Intake who by age-29: Remained Developed EXT T-test results Controls (n = 75) (n = 78) Mean (SD) Mean (SD) F (1, 118), p- value Age-17 (Intake) (7.22) (7.52) 4.42, Age-29 (FU3) (3.71) (3.92) 13.22, <.001 NOTE: FU3 = Follow-up three assessment 116
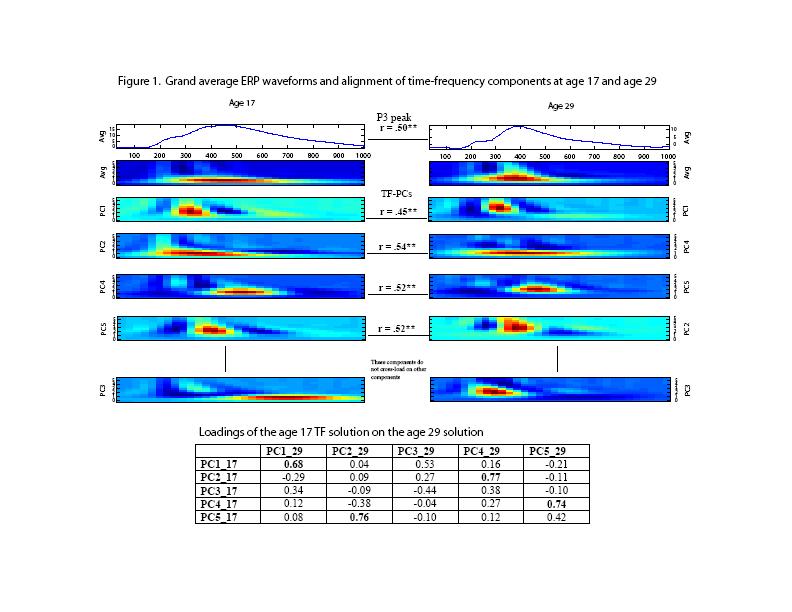
132
ABSTRACT 1. INTRODUCTION 2. ARTIFACT REJECTION ON RAW DATA
 AUTOMATIC ARTIFACT REJECTION FOR EEG DATA USING HIGH-ORDER STATISTICS AND INDEPENDENT COMPONENT ANALYSIS A. Delorme, S. Makeig, T. Sejnowski CNL, Salk Institute 11 N. Torrey Pines Road La Jolla, CA 917,
DATA MANAGEMENT & TYPES OF ANALYSES OFTEN USED. Dennis L. Molfese University of Nebraska - Lincoln
 DATA MANAGEMENT & TYPES OF ANALYSES OFTEN USED Dennis L. Molfese University of Nebraska - Lincoln 1 DATA MANAGEMENT Backups Storage Identification Analyses 2 Data Analysis Pre-processing Statistical Analysis
Beyond Blind Averaging: Analyzing Event-Related Brain Dynamics. Scott Makeig. sccn.ucsd.edu
 Beyond Blind Averaging: Analyzing Event-Related Brain Dynamics Scott Makeig Institute for Neural Computation University of California San Diego La Jolla CA sccn.ucsd.edu Talk given at the EEG/MEG course
Shirley Y. Hill, Stuart Steinhauer, Lisa Lowers, and Jeannette Locke. ERP Procedure
 Eight-Year Longitudinal Follow-up Clinical Outcome in Children from Alcoholism Families of P300 and High-Risk for Shirley Y. Hill, Stuart Steinhauer, Lisa Lowers, and Jeannette Locke Key Words: ERP, P300,
Supporting Information
 Supporting Information ten Oever and Sack 10.1073/pnas.1517519112 SI Materials and Methods Experiment 1. Participants. A total of 20 participants (9 male; age range 18 32 y; mean age 25 y) participated
2011, Vol. 120, No. 2, X/11/$12.00 DOI: /a
 Journal of Abnormal Psychology 211 American Psychological Association 211, Vol. 12, No. 2, 352 364 21-843X/11/$12. DOI: 1.137/a22124 Externalizing Psychopathology and Gain Loss Feedback in a Simulated
Figure 1. Source localization results for the No Go N2 component. (a) Dipole modeling
 Dipole modeling") Supplementary materials 1 Figure 1. Source localization results for the No Go N2 component. (a) Dipole modeling analyses placed the source of the No Go N2 component in the dorsal ACC, near the ACC source
Supplementary materials 1 Figure 1. Source localization results for the No Go N2 component. (a) Dipole modeling analyses placed the source of the No Go N2 component in the dorsal ACC, near the ACC source
Support Vector Machine Classification and Psychophysiological Evaluation of Mental Workload and Engagement of Intuition- and Analysis-Inducing Tasks
 Support Vector Machine Classification and Psychophysiological Evaluation of Mental Workload and Engagement of Intuition- and Analysis-Inducing Tasks Presenter: Joseph Nuamah Department of Industrial and
BCIA NEUROFEEDBACK CERTIFICATION PROGRAM
 BCIA NEUROFEEDBACK CERTIFICATION PROGRAM Instructor: Cynthia Kerson, PhD (26 BCIA F2F Hours 10 Self-paced Hours Accredited Instruction) Level: Introductory to Intermediate Practice Gap: Neurofeedback is
EEG based biomarkers in pediatric neuropsychiatry: ADHD autism (ASD)
") EEG based biomarkers in pediatric neuropsychiatry: ADHD autism (ASD) Neuropsychologist PhD Geir Ogrim NORWAY geir.ogrim@so-hf.no Affiliations Neuroteam, Child psychiatry service, Østfold Hospital Trust
EEG based biomarkers in pediatric neuropsychiatry: ADHD autism (ASD) Neuropsychologist PhD Geir Ogrim NORWAY geir.ogrim@so-hf.no Affiliations Neuroteam, Child psychiatry service, Østfold Hospital Trust
Genetic Correlation Between the P300 Event-Related Brain Potential and the EEG Power Spectrum
 Behavior Genetics, Vol. 31, No. 6, November 2001 ( 2001) Genetic Correlation Between the P300 Event-Related Brain Potential and the EEG Power Spectrum Andrey P. Anokhin, 1,4 G. C. M. van Baal, 2 C. E.
EEG-Rhythm Dynamics during a 2-back Working Memory Task and Performance
 EEG-Rhythm Dynamics during a 2-back Working Memory Task and Performance Tsvetomira Tsoneva, Davide Baldo, Victor Lema and Gary Garcia-Molina Abstract Working memory is an essential component of human cognition
Outline of Talk. Introduction to EEG and Event Related Potentials. Key points. My path to EEG
 Outline of Talk Introduction to EEG and Event Related Potentials Shafali Spurling Jeste Assistant Professor in Psychiatry and Neurology UCLA Center for Autism Research and Treatment Basic definitions and
Effect of intensity increment on P300 amplitude
 University of South Florida Scholar Commons Graduate Theses and Dissertations Graduate School 2004 Effect of intensity increment on P300 amplitude Tim Skinner University of South Florida Follow this and
Time-frequency theta and delta measures index separable components of feedback processing in a gambling task
 Psychophysiology, (1),. Wiley Periodicals, Inc. Printed in the USA. Copyright 1 Society for Psychophysiological Research DOI: 1.1111/psyp.139 Time-frequency theta and delta measures index separable components
International Journal of Neurology Research
 International Journal of Neurology Research Online Submissions: http://www.ghrnet.org/index./ijnr/ doi:1.1755/j.issn.313-511.1..5 Int. J. of Neurology Res. 1 March (1): 1-55 ISSN 313-511 ORIGINAL ARTICLE
EEG Analysis on Brain.fm (Focus)
") EEG Analysis on Brain.fm (Focus) Introduction 17 subjects were tested to measure effects of a Brain.fm focus session on cognition. With 4 additional subjects, we recorded EEG data during baseline and while
EEG Analysis on Brain.fm (Focus) Introduction 17 subjects were tested to measure effects of a Brain.fm focus session on cognition. With 4 additional subjects, we recorded EEG data during baseline and while
Title of Thesis. Study on Audiovisual Integration in Young and Elderly Adults by Event-Related Potential
 Title of Thesis Study on Audiovisual Integration in Young and Elderly Adults by Event-Related Potential 2014 September Yang Weiping The Graduate School of Natural Science and Technology (Doctor s Course)
JEREMY BENJAMIN HARPER
 JEREMY BENJAMIN HARPER Department of Psychology University of Minnesota Minneapolis, MN 55455 Email: harpe300@umn.edu EDUCATION Doctoral Program, Clinical Science and Psychopathology Research 2014- University
Neurophysiologically Driven Image Triage: A Pilot Study
 Neurophysiologically Driven Image Triage: A Pilot Study Santosh Mathan Honeywell Laboratories 3660 Technology Dr Minneapolis, MN 55418 USA santosh.mathan@honeywell.com Stephen Whitlow Honeywell Laboratories
SUMMARY AND DISCUSSION
 Risk factors for the development and outcome of childhood psychopathology SUMMARY AND DISCUSSION Chapter 147 In this chapter I present a summary of the results of the studies described in this thesis followed
EEG History. Where and why is EEG used? 8/2/2010
 EEG History Hans Berger 1873-1941 Edgar Douglas Adrian, an English physician, was one of the first scientists to record a single nerve fiber potential Although Adrian is credited with the discovery of
The impact of numeration on visual attention during a psychophysical task; An ERP study
 The impact of numeration on visual attention during a psychophysical task; An ERP study Armita Faghani Jadidi, Raheleh Davoodi, Mohammad Hassan Moradi Department of Biomedical Engineering Amirkabir University
Aggregation of psychopathology in a clinical sample of children and their parents
 Aggregation of psychopathology in a clinical sample of children and their parents PA R E N T S O F C H I LD R E N W I T H PSYC H O PAT H O LO G Y : PSYC H I AT R I C P R O B LEMS A N D T H E A S SO C I
Supporting Information
 Supporting Information Forsyth et al. 10.1073/pnas.1509262112 SI Methods Inclusion Criteria. Participants were eligible for the study if they were between 18 and 30 y of age; were comfortable reading in
Saichiu Nelson Tong ALL RIGHTS RESERVED
 2017 Saichiu Nelson Tong ALL RIGHTS RESERVED MODELING CLASSIFICATION NETWORK OF ELECTROENCEPHALOGRAPHIC ARTIFACTS AND SIGNALS ASSOCIATED WITH DEEP BRAIN STIMULATION By SAICHIU NELSON TONG A thesis submitted
S-transform time-frequency analysis of P300 reveals deficits in individuals diagnosed with alcoholism
 Clinical Neurophysiology 117 (2006) 2128 2143 www.elsevier.com/locate/clinph S-transform time-frequency analysis of P300 reveals deficits in individuals diagnosed with alcoholism Kevin A. Jones, Bernice
From Single-trial EEG to Brain Area Dynamics
 From Single-trial EEG to Brain Area Dynamics a Delorme A., a Makeig, S., b Fabre-Thorpe, M., a Sejnowski, T. a The Salk Institute for Biological Studies, 10010 N. Torey Pines Road, La Jolla, CA92109, USA
BRAIN RESEARCH 1104 (2006) available at
 available at") available at www.sciencedirect.com www.elsevier.com/locate/brainres Research Report Comparative analysis of event-related potentials during Go/NoGo and CPT: Decomposition of electrophysiological markers
available at www.sciencedirect.com www.elsevier.com/locate/brainres Research Report Comparative analysis of event-related potentials during Go/NoGo and CPT: Decomposition of electrophysiological markers
What is novel in the novelty oddball paradigm? Functional significance of the novelty P3
 * Manuscript-title pg, abst, fig... Debener et al. Independent components of the auditory novelty oddball What is novel in the novelty oddball paradigm? Functional significance of the novelty P3 event-related
BENEFITS OF MULTI-DOMAIN FEATURE OF MISMATCH NEGATIVITY EXTRACTED BY NONNEGATIVE TENSOR FACTORIZATION FROM EEG COLLECTED BY LOW-DENSITY ARRAY
 International Journal of Neural Systems World Scientific Publishing Company BENEFITS OF MULTI-DOMAIN FEATURE OF MISMATCH NEGATIVITY EXTRACTED BY NONNEGATIVE TENSOR FACTORIZATION FROM EEG COLLECTED BY LOW-DENSITY
Reward prediction error signals associated with a modified time estimation task
 Psychophysiology, 44 (2007), 913 917. Blackwell Publishing Inc. Printed in the USA. Copyright r 2007 Society for Psychophysiological Research DOI: 10.1111/j.1469-8986.2007.00561.x BRIEF REPORT Reward prediction
Seizure onset can be difficult to asses in scalp EEG. However, some tools can be used to increase the seizure onset activity over the EEG background:
 This presentation was given during the Dianalund Summer School on EEG and Epilepsy, July 24, 2012. The main purpose of this introductory talk is to show the possibilities of improved seizure onset analysis
ISSN: (Online) Volume 3, Issue 7, July 2015 International Journal of Advance Research in Computer Science and Management Studies
 Volume 3, Issue 7, July 2015 International Journal of Advance Research in Computer Science and Management Studies") ISSN: 2321-7782 (Online) Volume 3, Issue 7, July 2015 International Journal of Advance Research in Computer Science and Management Studies Research Article / Survey Paper / Case Study Available online
ISSN: 2321-7782 (Online) Volume 3, Issue 7, July 2015 International Journal of Advance Research in Computer Science and Management Studies Research Article / Survey Paper / Case Study Available online
Power-Based Connectivity. JL Sanguinetti
 Power-Based Connectivity JL Sanguinetti Power-based connectivity Correlating time-frequency power between two electrodes across time or over trials Gives you flexibility for analysis: Test specific hypotheses
Neural Correlates of Complex Tone Processing and Hemispheric Asymmetry
 International Journal of Undergraduate Research and Creative Activities Volume 5 Article 3 June 2013 Neural Correlates of Complex Tone Processing and Hemispheric Asymmetry Whitney R. Arthur Central Washington
S P O U S A L R ES E M B L A N C E I N PSYCHOPATHOLOGY: A C O M PA R I SO N O F PA R E N T S O F C H I LD R E N W I T H A N D WITHOUT PSYCHOPATHOLOGY
 Aggregation of psychopathology in a clinical sample of children and their parents S P O U S A L R ES E M B L A N C E I N PSYCHOPATHOLOGY: A C O M PA R I SO N O F PA R E N T S O F C H I LD R E N W I T H
Week 2: Disorders of Childhood
 Week 2: Disorders of Childhood What are neurodevelopmental disorders? A group of conditions with onset in the developmental period Disorders of the brain The disorders manifest early in development, often
Processed by HBI: Russia/Switzerland/USA
 1 CONTENTS I Personal and clinical data II Conclusion. III Recommendations for therapy IV Report. 1. Procedures of EEG recording and analysis 2. Search for paroxysms 3. Eyes Open background EEG rhythms
CHAPTER 6 INTERFERENCE CANCELLATION IN EEG SIGNAL
 116 CHAPTER 6 INTERFERENCE CANCELLATION IN EEG SIGNAL 6.1 INTRODUCTION Electrical impulses generated by nerve firings in the brain pass through the head and represent the electroencephalogram (EEG). Electrical
Human Brain Institute Russia-Switzerland-USA
 1 Human Brain Institute Russia-Switzerland-USA CONTENTS I Personal and clinical data II Conclusion. III Recommendations for therapy IV Report. 1. Procedures of EEG recording and analysis 2. Search for
Serena M. King, Ph.D., L.P. Associate Professor of Psychology
 Serena M. King, Ph.D., L.P. Associate Professor of Psychology sking02@hamline.edu Chuck E. Cheese: A Gambling Gateway Restaurant? http://newsfeed.time.com/2011/05/17/chuck e cheese a gambling gateway restaurant/
Brain Signals and Alcoholism
 Brain Signals and Alcoholism Gopal Krishan Assistant Professor, Department of Electronics & Instrumentation The Technological Institute of Textile & Sciences, Bhiwani (India) Abstract- Electroencephalogram
Stefan Debener a,b, *, Scott Makeig c, Arnaud Delorme c, Andreas K. Engel a,b. Research report
 Cognitive Brain Research 22 (2005) 309 321 Research report What is novel in the novelty oddball paradigm? Functional significance of the novelty P3 event-related potential as revealed by independent component
A Brain Computer Interface System For Auto Piloting Wheelchair
 A Brain Computer Interface System For Auto Piloting Wheelchair Reshmi G, N. Kumaravel & M. Sasikala Centre for Medical Electronics, Dept. of Electronics and Communication Engineering, College of Engineering,
Gender Differences and Developmental Change in Externalizing Disorders From Late Adolescence to Early Adulthood: A Longitudinal Twin Study
 Journal of Abnormal Psychology Copyright 2007 by the American Psychological Association 2007, Vol. 116, No. 3, 433 447 0021-843X/07/$12.00 DOI: 10.1037/0021-843X.116.3.433 Gender Differences and Developmental
Transcranial direct current stimulation modulates shifts in global/local attention
 University of New Mexico UNM Digital Repository Psychology ETDs Electronic Theses and Dissertations 2-9-2010 Transcranial direct current stimulation modulates shifts in global/local attention David B.
What do you notice? Woodman, Atten. Percept. Psychophys., 2010
 What do you notice? Woodman, Atten. Percept. Psychophys., 2010 You are trying to determine if a small amplitude signal is a consistent marker of a neural process. How might you design an experiment to
Fear of faces: a psychophysiological investigation of facial affect processing in social phobia
 University of Wollongong Research Online University of Wollongong Thesis Collection 1954-2016 University of Wollongong Thesis Collections 2004 Fear of faces: a psychophysiological investigation of facial
SCOTT J. BURWELL, M.A.
 Burwell CV 1 SCOTT J. BURWELL, M.A. burwell@umn.edu University of Minnesota N523 Elliott Hall 75 East River Road Minneapolis, MN 55455 0344 EDUCATION 2011 present Doctoral Program in Biological Psychopathology
Novel single trial movement classification based on temporal dynamics of EEG
 Novel single trial movement classification based on temporal dynamics of EEG Conference or Workshop Item Accepted Version Wairagkar, M., Daly, I., Hayashi, Y. and Nasuto, S. (2014) Novel single trial movement
Operationalizing proneness to externalizing psychopathology as a multivariate psychophysiological phenotype
 Psychophysiology, 48 (2011), 64 73. Wiley Periodicals, Inc. Printed in the USA. Copyright r 2010 Society for Psychophysiological Research DOI: 10.1111/j.1469-8986.2010.01047.x Operationalizing proneness
 Provided by the author(s) and NUI Galway in accordance with publisher policies. Please cite the published version when available. Title Prefrontal cortex and the generation of oscillatory visual persistence
An Electrophysiological Study on Sex-Related Differences in Emotion Perception
 The University of Akron IdeaExchange@UAkron Honors Research Projects The Dr. Gary B. and Pamela S. Williams Honors College Spring 2018 An Electrophysiological Study on Sex-Related Differences in Emotion
APPENDIX 11: CASE IDENTIFICATION STUDY CHARACTERISTICS AND RISK OF BIAS TABLES
 APPENDIX 11: CASE IDENTIFICATION STUDY CHARACTERISTICS AND RISK OF BIAS TABLES 1 Study characteristics table... 3 2 Methodology checklist: the QUADAS-2 tool for studies of diagnostic test accuracy... 4
An investigation of the effect of preparation on response execution and inhibition in the go/nogo task
 University of Wollongong Research Online University of Wollongong Thesis Collection 1954-2016 University of Wollongong Thesis Collections 2005 An investigation of the effect of preparation on response
An ERP Examination of the Different Effects of Sleep Deprivation on Exogenously Cued and Endogenously Cued Attention
 Sleep Deprivation and Selective Attention An ERP Examination of the Different Effects of Sleep Deprivation on Exogenously Cued and Endogenously Cued Attention Logan T. Trujillo, PhD 1 ; Steve Kornguth,
Neurophysiologically Driven Image Triage: A Pilot Study
 Neurophysiologically Driven Image Triage: A Pilot Study Santosh Mathan 3660 Technology Dr Minneapolis, MN 55418 USA santosh.mathan@honeywell.com Stephen Whitlow 3660 Technology Dr Minneapolis, MN 55418
Early posterior ERP components do not reflect the control of attentional shifts toward expected peripheral events
 Psychophysiology, 40 (2003), 827 831. Blackwell Publishing Inc. Printed in the USA. Copyright r 2003 Society for Psychophysiological Research BRIEF REPT Early posterior ERP components do not reflect the
Neurotechnology for Special Needs Children
 ISSN 4-956 (Print) ISSN -849 (Online) Sep Dec 5 Neurotechnology for Special Needs Children Norsiah Fauzan Faculty of Cognitive Science and Human Development, Universiti Malaysia Sarawak Abstract This paper
MENTAL WORKLOAD AS A FUNCTION OF TRAFFIC DENSITY: COMPARISON OF PHYSIOLOGICAL, BEHAVIORAL, AND SUBJECTIVE INDICES
 MENTAL WORKLOAD AS A FUNCTION OF TRAFFIC DENSITY: COMPARISON OF PHYSIOLOGICAL, BEHAVIORAL, AND SUBJECTIVE INDICES Carryl L. Baldwin and Joseph T. Coyne Department of Psychology Old Dominion University
Nature Neuroscience: doi: /nn Supplementary Figure 1
 Supplementary Figure 1 Hippocampal recordings. a. (top) Post-operative MRI (left, depicting a depth electrode implanted along the longitudinal hippocampal axis) and co-registered preoperative MRI (right)
Frontal midline theta and N200 amplitude reflect complementary information about expectancy and outcome evaluation
 Psychophysiology, 50 (2013), 550 562. Wiley Periodicals, Inc. Printed in the USA. Copyright 2013 Society for Psychophysiological Research DOI: 10.1111/psyp.12040 Frontal midline theta and N200 amplitude
Classification of People using Eye-Blink Based EOG Peak Analysis.
 Classification of People using Eye-Blink Based EOG Peak Analysis. Andrews Samraj, Thomas Abraham and Nikos Mastorakis Faculty of Computer Science and Engineering, VIT University, Chennai- 48, India. Technical
WAVELET ENERGY DISTRIBUTIONS OF P300 EVENT-RELATED POTENTIALS FOR WORKING MEMORY PERFORMANCE IN CHILDREN
 WAVELET ENERGY DISTRIBUTIONS OF P300 EVENT-RELATED POTENTIALS FOR WORKING MEMORY PERFORMANCE IN CHILDREN Siti Zubaidah Mohd Tumari and Rubita Sudirman Department of Electronic and Computer Engineering,
CS/NEUR125 Brains, Minds, and Machines. Due: Friday, April 14
 CS/NEUR125 Brains, Minds, and Machines Assignment 5: Neural mechanisms of object-based attention Due: Friday, April 14 This Assignment is a guided reading of the 2014 paper, Neural Mechanisms of Object-Based
P300, Alcoholism Heritability, and Stimulus Modality
 PII S0741-8329(98)00047-0 Alcohol, Vol. 17, No. 2, pp. 149 156, 1999 1999 Elsevier Science Inc. Printed in the USA. All rights reserved 0741-8329/99 $ see front matter P300, Alcoholism Heritability, and
Event-Related Potentials Recorded during Human-Computer Interaction
 Proceedings of the First International Conference on Complex Medical Engineering (CME2005) May 15-18, 2005, Takamatsu, Japan (Organized Session No. 20). Paper No. 150, pp. 715-719. Event-Related Potentials
Working Memory Impairments Limitations of Normal Children s in Visual Stimuli using Event-Related Potentials
 2015 6th International Conference on Intelligent Systems, Modelling and Simulation Working Memory Impairments Limitations of Normal Children s in Visual Stimuli using Event-Related Potentials S. Z. Mohd
Event Related Potentials: Significant Lobe Areas and Wave Forms for Picture Visual Stimulus
 Available Online at www.ijcsmc.com International Journal of Computer Science and Mobile Computing A Monthly Journal of Computer Science and Information Technology ISSN 2320 088X IMPACT FACTOR: 6.017 IJCSMC,
Nature Methods: doi: /nmeth Supplementary Figure 1. Activity in turtle dorsal cortex is sparse.
 Supplementary Figure 1 Activity in turtle dorsal cortex is sparse. a. Probability distribution of firing rates across the population (notice log scale) in our data. The range of firing rates is wide but
Effects of Light Stimulus Frequency on Phase Characteristics of Brain Waves
 SICE Annual Conference 27 Sept. 17-2, 27, Kagawa University, Japan Effects of Light Stimulus Frequency on Phase Characteristics of Brain Waves Seiji Nishifuji 1, Kentaro Fujisaki 1 and Shogo Tanaka 1 1
EEG anomalies in Attention- Deficit/Hyperactivity disorder: linking brain and behaviour.
 EEG anomalies in Attention- Deficit/Hyperactivity disorder: linking brain and behaviour. Adam R. Clarke a, Robert J. Barry a, Rory McCarthy b, Mark Selikowitz b a School of Psychology, and Brain & Behaviour
Auditory P3 in Female Alcoholics
 0145-6008/03/2707-1064$03.00/0 ALCOHOLISM: CLINICAL AND EXPERIMENTAL RESEARCH Vol. 27, No. 7 July 2003 Auditory P3 in Female Alcoholics Sudha Suresh, Bernice Porjesz, David B. Chorlian, Keewhan Choi, Kevin
QEEG Informed Protocol Recommendation
 Protocol ecommendation Psychopathology ating Substance Use AD(H)D (page 2) Depression (page 3) Anxiety Disorder OCD Autism Schizophrenia Memory Disorder Insomnia Stimulants Anti depressants Anxiolytics/Sedatives
Testing Hypotheses Regarding the Causes of Comorbidity: Examining the Underlying Deficits of Comorbid Disorders
 Journal of Abnormal Psychology Copyright 2005 by the American Psychological Association 2005, Vol. 114, No. 3, 346 362 0021-843X/05/$12.00 DOI: 10.1037/0021-843X.114.3.346 Testing Hypotheses Regarding
Case Study Activity: Management of Attention-Deficit/Hyperactivity Disorder Answers to Interactive Questions and Resources
 Case Study Activity: Management of Attention-Deficit/Hyperactivity Disorder Answers to Interactive Questions and Resources Case 3. Risk of Abuse of ADHD Medications Provider: American Pharmacists Association
PCA Enhanced Kalman Filter for ECG Denoising
 IOSR Journal of Electronics & Communication Engineering (IOSR-JECE) ISSN(e) : 2278-1684 ISSN(p) : 2320-334X, PP 06-13 www.iosrjournals.org PCA Enhanced Kalman Filter for ECG Denoising Febina Ikbal 1, Prof.M.Mathurakani
From single-trial EEG to brain area dynamics
 Neurocomputing 44 46 (2002) 1057 1064 www.elsevier.com/locate/neucom From single-trial EEG to brain area dynamics A. Delorme a;, S. Makeig a, M. Fabre-Thorpe b, T. Sejnowski a a The Salk Institute for
American Addiction Centers Outcomes Study Long-Term Outcomes Among Residential Addiction Treatment Clients. Centerstone Research Institute
 American Addiction Centers Outcomes Study Long-Term Outcomes Among Residential Addiction Treatment Clients Centerstone Research Institute 2018 1 AAC Outcomes Study: Long-Term Outcomes Executive Summary
Final Summary Project Title: Cognitive Workload During Prosthetic Use: A quantitative EEG outcome measure
 American Orthotic and Prosthetic Association (AOPA) Center for Orthotics and Prosthetics Leraning and Outcomes/Evidence-Based Practice (COPL) Final Summary 2-28-14 Project Title: Cognitive Workload During
McLaughlin, K. A., Fox, N. A., Zeanah, C. H., Sheridan, M. A., Marshall, P., & Nelson, C. A. (2010). Delayed maturation in brain electrical activity
. Delayed maturation in brain electrical activity") McLaughlin, K. A., Fox, N. A., Zeanah, C. H., Sheridan, M. A., Marshall, P., & Nelson, C. A. (2010). Delayed maturation in brain electrical activity partially explains the association between early environmental
McLaughlin, K. A., Fox, N. A., Zeanah, C. H., Sheridan, M. A., Marshall, P., & Nelson, C. A. (2010). Delayed maturation in brain electrical activity partially explains the association between early environmental
A Clinical Translation of the Research Article Titled Antisocial Behavioral Syndromes and. Additional Psychiatric Comorbidity in Posttraumatic Stress
 1 A Clinical Translation of the Research Article Titled Antisocial Behavioral Syndromes and Additional Psychiatric Comorbidity in Posttraumatic Stress Disorder among US Adults: Results from Wave 2 of the
Topographical Analysis of Electrical Brain Activity: Methodological Aspects
 A P P E N D I X E Topographical Analysis of Electrical Brain Activity: Methodological Aspects Wolfgang Skrandies INTRODUCTION In general, human electrophysiological studies have to rely on noninvasive
SUPPLEMENTARY INFORMATION. Table 1 Patient characteristics Preoperative. language testing
 Categorical Speech Representation in the Human Superior Temporal Gyrus Edward F. Chang, Jochem W. Rieger, Keith D. Johnson, Mitchel S. Berger, Nicholas M. Barbaro, Robert T. Knight SUPPLEMENTARY INFORMATION
Submitted report on Sufi recordings at AAPB 2013 in Portland. Not for general distribution. Thomas F. Collura, Ph.D. July, 2013
 Submitted report on Sufi recordings at AAPB 2013 in Portland Not for general distribution. Thomas F. Collura, Ph.D. July, 2013 Summary of EEG findings The intent of the EEG monitoring was to see which
Electroencephalography
 The electroencephalogram (EEG) is a measure of brain waves. It is a readily available test that provides evidence of how the brain functions over time. The EEG is used in the evaluation of brain disorders.
Joshua D. Isen University of South Alabama Psychology Department UCOM 1102 Mobile, AL (251)
") _ Joshua D. Isen University of South Alabama Psychology Department UCOM 1102 Mobile, AL 36688 (251) 460-7153 isen@southalabama.edu EDUCATION 2010 Ph.D. in Psychology University of Southern California,
_ Joshua D. Isen University of South Alabama Psychology Department UCOM 1102 Mobile, AL 36688 (251) 460-7153 isen@southalabama.edu EDUCATION 2010 Ph.D. in Psychology University of Southern California,
Absence of Visual and Auditory P300 Reduction in Nondepressed Male and Female Alcoholics
 Absence of Visual and Auditory P300 Reduction in Nondepressed Male and Female Alcoholics Shirley Y. Hill, Jeannette Locke, and Stuart R. Steinhauer Background: The P300 component of the event-related potential
Entrainment of neuronal oscillations as a mechanism of attentional selection: intracranial human recordings
 Entrainment of neuronal oscillations as a mechanism of attentional selection: intracranial human recordings J. Besle, P. Lakatos, C.A. Schevon, R.R. Goodman, G.M. McKhann, A. Mehta, R.G. Emerson, C.E.
Updates to NHSP guidance for post-screening diagnostic testing Update 1: August 2015 Author: BSA Electrophysiology Special Interest Group (BSA EP SIG)
") Updates to NHSP guidance for post-screening diagnostic testing Update 1: August 2015 Author: BSA Electrophysiology Special Interest Group (BSA EP SIG) Introduction This document is intended to update and
Updates to NHSP guidance for post-screening diagnostic testing Update 1: August 2015 Author: BSA Electrophysiology Special Interest Group (BSA EP SIG) Introduction This document is intended to update and
Processing Interaural Cues in Sound Segregation by Young and Middle-Aged Brains DOI: /jaaa
 J Am Acad Audiol 20:453 458 (2009) Processing Interaural Cues in Sound Segregation by Young and Middle-Aged Brains DOI: 10.3766/jaaa.20.7.6 Ilse J.A. Wambacq * Janet Koehnke * Joan Besing * Laurie L. Romei
PSD Analysis of Neural Spectrum During Transition from Awake Stage to Sleep Stage
 PSD Analysis of Neural Spectrum During Transition from Stage to Stage Chintan Joshi #1 ; Dipesh Kamdar #2 #1 Student,; #2 Research Guide, #1,#2 Electronics and Communication Department, Vyavasayi Vidya
Selection of Feature for Epilepsy Seizer Detection Using EEG
 International Journal of Neurosurgery 2018; 2(1): 1-7 http://www.sciencepublishinggroup.com/j/ijn doi: 10.11648/j.ijn.20180201.11 Selection of Feature for Epilepsy Seizer Detection Using EEG Manisha Chandani
DCNV RESEARCH TOOL: INVESTIGATION OF ANTICIPATORY BRAIN POTENTIALS
 DCNV RESEARCH TOOL: INVESTIGATION OF ANTICIPATORY BRAIN POTENTIALS Roman Golubovski, Dipl-Eng J.Sandanski 116-3/24 91000 Skopje, Macedonia Phone: + 389 91 165 367, Fax: + 389 91 165 304 email: roman.golubovski@iname.com
How Long Depends on How Fast Perceived Flicker Dilates Subjective Duration
 How Long Depends on How Fast Perceived Flicker Dilates Subjective Duration Sophie K. Herbst 1,2 *, Amir Homayoun Javadi 3, Elke van der Meer 1,2, Niko A. Busch 1,4 1 Berlin School of Mind and Brain, Berlin,
Developmental Course of Auditory Event-Related Potentials in Autism
 Developmental Course of Auditory Event-Related Potentials in Autism Marco R. Hoeksma Chantal Kemner Cisca Aerts Marinus N. Verbaten Herman van Engeland 35Chapter Three Chapter 3 Previous studies of auditory
Brain wave synchronization and entrainment to periodic acoustic stimuli
 Neuroscience Letters 424 (2007) 55 60 Brain wave synchronization and entrainment to periodic acoustic stimuli Udo Will, Eric Berg School of Music, Cognitive Ethnomusicology, Ohio State University, 110
ERP Components and the Application in Brain-Computer Interface
 ERP Components and the Application in Brain-Computer Interface Dr. Xun He Bournemouth University, 12 th July 2016 The 1 st HCI and Digital Health Forum: Technologies and Business Opportunities between