Nature Neuroscience: doi: /nn Supplementary Figure 1
|
|
|
- Anis Rodgers
- 5 years ago
- Views:
Transcription
 Post-operative MRI (left, depicting a depth electrode implanted along the longitudinal hippocampal axis) and co-registered preoperative MRI (right) of a sample participant.")
1 Supplementary Figure 1 Hippocampal recordings. a. (top) Post-operative MRI (left, depicting a depth electrode implanted along the longitudinal hippocampal axis) and co-registered preoperative MRI (right) of a sample participant. (bottom) Power spectra (NREM/WAKE) for all 10 electrode contacts of the same participant, showing a maximum in the spindle range (12-16 Hz, dashed vertical lines) in a posterior hippocampus contact which was then carried forward to the group analysis (red arrow). (inset) NREM/WAKE power spectrum for scalp electrode Cz. Y axes are identical across panels, where a ratio of 1 demarks the same spectral power during NREM and WAKE. b. Hippocampal contacts included in the analysis for all participants. Each panel shows sagittal and coronal slices of the post-operative (top) and the co-registered pre-operative (bottom) MRI for a participant. Crosshairs highlight the contact showing the largest spindle amplitudes during NREM sleep relative to WAKE of all hippocampal contacts (as shown in a for a sample participant). MRIs were unavailable for 3 of the 12 participants. Note the different implantation scheme in one participant (right bottom).
 Average of spindle-trough-locked TFR (% change from pre-event baseline). Y-axis starts at 5 Hz to circumvent the dominance of power in the SO range.")
2 Supplementary Figure 2 Event-locked analysis of scalp EEG (Cz) PAC. Left: SO-spindle PAC. (a) Grand average unfiltered EEG trace across participants (mean s.e.m.), aligned to the maximum of the SO trough (time 0). (b) Average of spindle-trough-locked TFR (% change from pre-event baseline). Y-axis starts at 5 Hz to circumvent the dominance of power in the SO range. (c) Statistically significant change from pre-event baseline (P <.05, corrected). Inset shows unit circle of preferred phases of the SO-spindle modulation for each participant, which illustrates the preferred clustering of spindle power towards the SO peak (328, white line). Yellow circles represent participants whose Rayleigh test for non-uniformity was significant at P <.05. Right: Spindle-ripple PAC. While the EEG trace in (a) reveals the typical waxing and waning pattern of sleep spindles, no reliable ripple power modulation was observed in the spindle-peak-locked TFR (b) (see also Supplementary Table 3b; presumably due to attenuated signal-to-noise ratio of scalp EEG recordings for higher frequencies). Note that the spindle s mean potential is above zero, reflecting the grouping of spindles in the SO peak (.25 s to +.25 s, t(11) = 3.45, P <.01). This is further illustrated in the inset, which shows the grand average EEG trace bandpass filtered from Hz (SO range) and from Hz (spindle range), respectively.
 PETH of SO occurrences time-locked to SO down-states for Cz (left) and HC (right), highlighting multiple peaks at the distance of one SO cycle (multi-event oscillations).")
3 Supplementary Figure 3 Peri-event time histograms (PETH). (top) PETH of SO occurrences time-locked to SO down-states for Cz (left) and HC (right), highlighting multiple peaks at the distance of one SO cycle (multi-event oscillations). (bottom) PETH of spindle occurrences time-locked to spindle centers, revealing discernable peaks repeating at the SO frequency.
4 Supplementary Figure 4 Example hippocampal EEG traces illustrating multi-event SOs along with nested spindles. Top: Unfiltered raw EEG traces, highlighting data segments identified as a SO (green) and spindle (blue) by our automated algorithm. Bottom: Same data segments after applying the event-specific bandpass filters (SO: Hz, spindle: Hz).

5 Supplementary Figure 5 Temporal relation of spindles with respect to ripples. Bar graphs show the peri-event time histogram (PETH) of spindle center occurrences relative to ripple centers. Spindle centers show the tendency to occur after ripple centers: Within a search interval from -1 s to +1 s around ripple centers, 15.2% (s.d. = 5.0) of all ripples were followed by spindle centers and 12.6% (s.d. = 4.6) of all ripples were preceded by spindle centers. Note however that this difference in occurrence probabilities was not reliable across participants (t(11) = 1.44, P =.177). Importantly, the tendency of spindle centers to occur after ripple centers does not indicate that ripples trigger spindles, as the spindle onset occurs at least 250 ms before the spindle center (given our spindle detection duration criterion of 500 ms). The inset shows the onsets of spindles with respect to the onset of ripples, revealing that 17.1% (s.d. = 5.4) of all ripple onsets were preceded by a spindle onset from -1 to 0 s, whereas only 9.9% (s.d. = 3.2) of all ripple onsets were followed by a spindle onset from 0 to +1 s (t(11) = 4.08, P =.002). This indicates that ripples reliably occur after a spindle has already started. Note that the same statistical result was obtained when reducing the time window to.5 s to +.5 s around ripple onset.
6
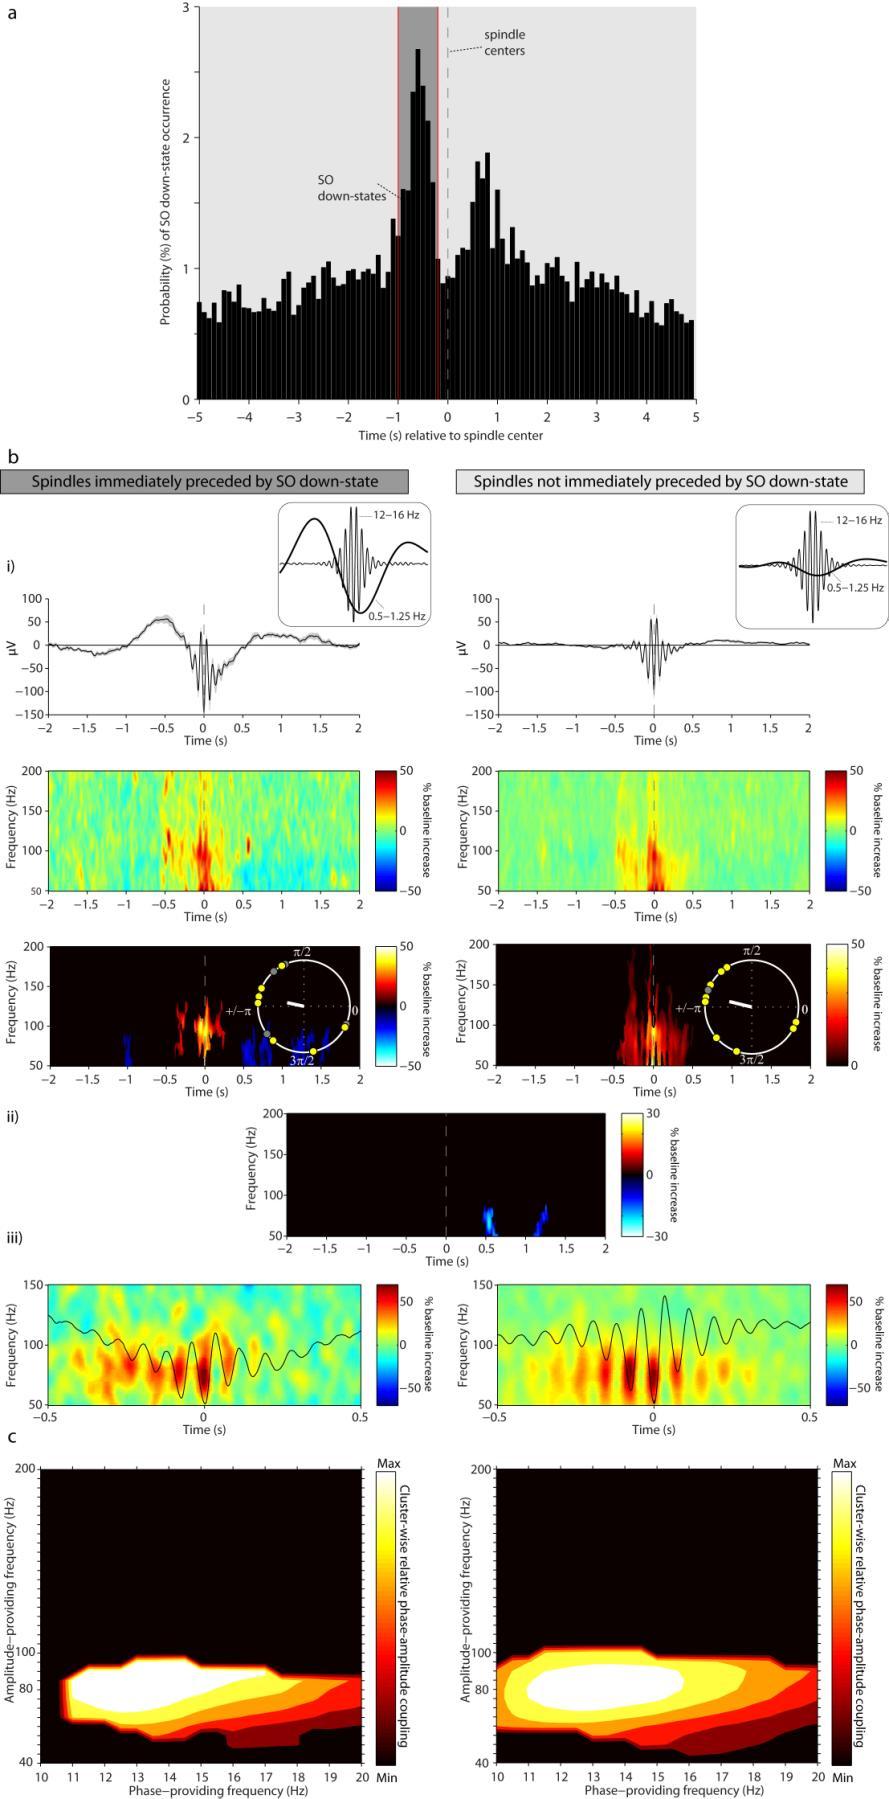
7 Supplementary Figure 6 Spindle-ripple coupling as a function of associated SOs. a. Peri-event time histogram (PETH) showing the probability of SO occurrence (SO down-state) relative to spindle centers (t = 0 s, dashed vertical line). Dark gray area shows time interval used to determine whether a given spindle is located in the up-state of an SO (i.e., a SO down-state is temporally preceding a spindle at 1 to 0.2 s). Note that while there is a clear peak of SO occurrences in the temporal vicinity of spindles (with the asymmetry pointing to a predominant SO -> spindle sequence), many spindles occurred independently of SOs. The subsequent analyses separated spindle-ripple coupling into spindles immediately preceded by SO downstates (left column, average number of events across participants = 124, range = ) and spindles not immediately preceded by SO down-states (right column, average number of events across participants = 697, range = ). b. Event-locked analysis. (i) (top) Grand average unfiltered ieeg trace across participants (mean s.e.m.), aligned to the maximum of the spindle trough. Insets show the bandpass filtered trace from Hz (SO range) and from Hz (spindle range) to better illustrate the relation of the spindle to the SO down-state. Note the pronounced SO emerging in spindle-locked raw traces on the left. (middle) Average of spindletrough-locked TFR (% change from pre-event baseline). (bottom) Statistically significant change from pre-event baseline (P <.05, corrected, with the initial cluster threshold also set to P <.05 to accommodate smaller trial numbers). Inset shows unit circle of preferred phases of the spindle-ripple modulation for each participant. Both V tests (testing for preferred phase at 180 ) are significant: spindles immediately preceded by SO down-states: V = 4.36, P =.037, spindles not immediately preceded by SO down-states: V = 5.75, P =.010. (ii) Direct comparison of spindle-trough-locked TFRs (immediately preceded by SO down-states vs. not immediately preceded by SO down-states), revealing only a relative power decrease at SO down-states, but no differential spindle-ripple modulation. (iii) Example data from one participant (same as in main Fig. 2-4), showing the nesting of ripples in spindle troughs for both event types. c. Comodulogram analysis. PAC was calculated for data segments around spindles ( 2.5 s to +2.5 s relative to the maximum spindle trough). Maps show cluster-corrected comparisons against phase-scrambled surrogate data (all P <.05). Direct comparison of MI averaged from Hz phase-providing frequency and Hz amplitude-providing frequency revealed no difference between spindles immediately preceded by SO down-states vs. spindles not immediately preceded by SO down-states (using surrogate corrected MI or non-surrogate-corrected MI, both t(11) < 0.71, P >.49).
8
9 Supplementary Figure 7 Example hippocampal EEG traces containing a SO-spindle-ripple interaction. Top: Unfiltered raw EEG traces, highlighting data segments identified as a SO (green), spindle (blue) and ripple (red) by our automated algorithm. Bottom: Same data segments after applying the event-specific bandpass filters (SO: Hz, spindle: Hz, ripple: Hz). Insets zoom in on the ripple event, highlighting its oscillatory nature and its nesting in spindle troughs.
 depicting the occurrence probability of hippocampal SOs time-locked to Cz SOs (a) and of")
10 Supplementary Figure 8 Cross-regional CFC between Cz and hippocampus. Peri-event time histograms (PETH) depicting the occurrence probability of hippocampal SOs time-locked to Cz SOs (a) and of hippocampal spindles time-locked to Cz spindles (b).
 when comparing NREM PAC with WAKE PAC (left) and with trial-shuffled NREM surrogate data (right).")
11 Supplementary Figure 9 Hippocampal phase-amplitude coupling (PAC) during NREM sleep. Clusters showing a significant Modulation Index (MI) when comparing NREM PAC with WAKE PAC (left) and with trial-shuffled NREM surrogate data (right). Maps are thresholded to show t value clusters whose P < 0.05 and whose size exceeds 25 contiguous frequency pairs.
 Contact used for re-referencing in a sample participant (red line). (b) Grand average unfiltered EEG trace across participants (mean s.e.m.) and (c) average of event-locked TFR (% change from pre-event baseline), locked to SO peak (left) and spindle trough (right).")
12 Supplementary Figure 10 Event-locked analysis of hippocampal PAC after re-referencing hippocampal data against the most anterior (11 participants) or lateral (1 participant) contact on the same depth electrode. (a) Contact used for re-referencing in a sample participant (red line). (b) Grand average unfiltered EEG trace across participants (mean s.e.m.) and (c) average of event-locked TFR (% change from pre-event baseline), locked to SO peak (left) and spindle trough (right). Spindle power (12 16 Hz) shows a significant increase vs. baseline from.25 to.75 s after SO peak (t(11) = 2.69, P =.021) and ripple power ( Hz) shows a significant increase vs. baseline from.25 to +.25 s around maximal spindle trough (t(11) = 4.00, P =.002). Spindle power (12 16 Hz) also showed a significant increase in the re-referenced data when aligning the TFR to the ripple center (as done in main text Fig. 4a, t(11) = 4.81, P <.001,.25 to +.25 s around ripple center).
13 Supplemental Tables Table S1: Mean proportions of time spent in different sleep stages out of total time asleep. Sleep efficiency denotes time spent in Stages 1-4 or REM between sleep onset and last wake up. mean s.d. Stage1 28% 21% Stage2 41% 15% Stage3 12% 9% Stage4 3% 4% REM 16% 9% Sleep time 8.42h 2.00h Sleep efficiency 90% 10% Table S2a: Length of artifact free NREM data segments ( dataminutes ), total number of events and event densities (n events/dataminutes) for SOs, spindles and ripples detected in the hippocampus. SOs spindles ripples participant dataminutes n events density n events density n events density p p p p p p p p p p p p mean s.d HC
14 Table S2b: Length of artifact free NREM data segments ( dataminutes ), total number of events and event densities (n events/dataminutes) for SOs and spindles detected at Cz. SOs spindles participant dataminutes n events density n events density p p p p p p p p p p p p mean s.d Cz Table S3a. EEG SO metrics and results for SO-spindle coupling using various event detection criteria. EEG metrics include the number of detected events (avg n) as well as the across-participant average of the peak, trough and peak-to-peak amplitude after bandpass filtering the EEG in the SO frequency ranges. PAC results include (i) the change in spindle power (12 16 Hz, relative to the 2.5 s to 1.5 s pre-event baseline) during the SO up-state (.25 s to.75 s relative to maximal down-state) along with results of a two-tailed t-test against 0, (ii) P values of a V-test against the hypothesized mean direction of 180 (i.e., modulation by the SO up-state) and (iii) number of significant participant-specific Rayleigh tests against the H 0 of uniform distribution of preferred phase angles across all detected events (in the overall group of 12 participants). Percentiles denote the p2p amplitude cut-off, such that only the top 25% SOs were included for the 75 th percentile criterion. Mean + 2SD denotes the SOs whose p2p amplitude mean + 2 standard deviations of all SO candidates. Multi-event SOs denotes SOs that were preceded and/or followed by another SO down-state within 1.3 s (~.75 Hz). 75th perc., cons.art.det. denotes SOs whose p2p amplitude 75th percentile (i.e., the top 25%), as used in the main text, but after raising the thresholds for automated artifact detection (resulting in fewer rejected data segments).
15 SO EEG PAC Hippocampus avg n peak trough p2p spindle power ( s, Hz) V-test (180 ) P value individually significant (Rayleigh test) % change t p 75 th percentile th percentile (both halfwaves 400 ms) 75 th percentile (for both half-waves separately) th - 95 th percentile th percentile th percentile th percentile mean + 2SD multi-event SOs th perc., cons.art.det SO EEG PAC Cz avg n peak trough p2p spindle power ( s, Hz) V-test (0 ) P value individually significant (Rayleigh test) % change t p 75 th percentile th percentile (both halfwaves 400 ms) 75 th percentile (for both half-waves separately) th - 95 th percentile th percentile th percentile th percentile mean + 2SD multi-event SOs th perc., cons.art.det
16 Table S3b. EEG spindle metrics and results for spindle-ripple coupling using various event detection criteria. EEG metrics include the number of detected events (avg n) as well as the across-participant average of the peak, trough and peak-to-peak amplitude after bandpass filtering the EEG in the spindle range. PAC results include (i) the change in ripple power ( Hz, relative to the 2.5 s to 1.5 s preevent baseline) from.25 s to +.25 s relative to the maximal spindle trough (HC) or peak (Cz) along with results of a two-tailed t-test against 0, (ii) P values of a V-test against the hypothesized mean direction of 180 (HC, i.e., modulation by the spindle trough) or 0 (Cz, i.e., modulation by the spindle peak) and (iii) number of significant participant-specific Rayleigh tests against the H 0 of uniform distribution of preferred phase angles across all detected events (in the overall group of 12 participants). Percentiles denote the RMS amplitude cut-off, such that only the top 25% spindles were included for the 75 th percentile criterion. Mean + 2SD denotes the spindles whose RMS amplitude mean + 2 standard deviations of all spindle candidates. 75th perc., cons.art.det. denotes spindles whose RMS amplitude 75th percentile (i.e., the top 25%), as used in the main text, but after raising the thresholds for automated artifact detection (resulting in fewer rejected data segments). Hippocampus avg n peak spindle EEG trough p2p ripple power (.25 s, Hz) % change t p PAC V-test (180 ) P value individually significant (Rayleigh test) 75 th percentile th percentile th percentile th percentile mean + 2SD th perc., cons.art.det Cz avg n peak spindle EEG trough p2p ripple power (.25 s, Hz) % change t p PAC V-test (0 ) P value individually significant (Rayleigh test) 75 th percentile th percentile th percentile th percentile mean + 2SD th perc., cons.art.det
17 Table S3c. Results for spindle-ripple coupling in ripple-locked TFR using various event detection criteria. PAC results include the change in spindle power (12 16 Hz, relative to the 1.5 s to 1.0 s pre-event baseline) from.25 s to +.25 s relative to the ripple peak along with results of a two-tailed t-test against 0. Percentiles denote the RMS amplitude cut-off, such that only the top 1% ripples were included for the 99 th percentile criterion. Mean + 3SD denotes the ripples whose RMS amplitude mean + 3 standard deviations of all ripple candidates. 99th perc., cons.art.det. denotes ripples whose RMS amplitude 99th percentile (i.e., the top 1%), as used in the main text, but after raising the thresholds for automated artifact detection (resulting in fewer rejected data segments). PAC Hippocampus avg n spindle power (.25 s, Hz) % change 99 th percentile th percentile mean + 3SD th perc., cons.art.det t p Table S4. Participant s drug regimen at the time of recordings participant Anticonvulsant Antidepressant p01 Clobazam, Valproat - p02 Clobazam, Valproat - p03 Lamotrigin, Levetiracetam - p04 Lacosamide, Levetiracetam - p05 Lamotrigin, Levetiracetam - p06 Lamotrigin, Oxcarbazepin - p07 Lamotrigin, Oxcarbazepin Citalopram p08 Lamotrigin - p09 Levetiracetam - p10 Lamotrigin Sertralin p11 Levetiracetam, Oxcarbazepin - p12 Oxcarbazepin -
18 Table S5. Documented effects of anticonvulsant and antidepressant drugs on sleep architecture/oscillations. increase decrease. N1-3 sleep stages according to Iber, C., Ancoli- Israel, S., Chesson, A. & Quan, S.F. The AASM manual for the scoring of sleep and associated events: rules, terminology and technical specifications. (2007) D. Neckelmann, B. Bjorvatn, A. Bjørkum, R. Ursin, Behavioural brain research 79, 183 (1996) A. L. van Bemmel, R. H. van den Hoofdakker, D. G. Beersma, A. L. Bouhuys, Psychopharmacology 113, 225 (1993) S. Wilson et al., European neuropsychopharmacology 14, 367 (2004) S. V. Jain, T. A. Glauser, Epilepsia 55, 26 (2014) J. D. Hudson et al., Seizure 25, 155 (2014) R. D. Jindal et al., Journal of clinical psychopharmacology 23, 540 (2003). Drug Effects on sleep structure Citalopram REM ; REM alpha power ( 1-3 ) Clobazam N2, N1, SWS ( 4 ) Lacosamide none ( 5 ) Lamotrigin REM, N2, SWS ( 4 ) Levetiracetam N2, REM ( 4 ) Oxcarbazepin unknown Sertralin delta power during first sleep cycle ( 6 ) Valproat N1, REM ( 4 )
Theta sequences are essential for internally generated hippocampal firing fields.
 Theta sequences are essential for internally generated hippocampal firing fields. Yingxue Wang, Sandro Romani, Brian Lustig, Anthony Leonardo, Eva Pastalkova Supplementary Materials Supplementary Modeling
Nature Medicine: doi: /nm.4084
 Supplementary Figure 1: Sample IEDs. (a) Sample hippocampal IEDs from different kindled rats (scale bar = 200 µv, 100 ms). (b) Sample temporal lobe IEDs from different subjects with epilepsy (scale bar
Hierarchical nesting of slow oscillations, spindles and ripples in the human hippocampus during sleep
 Hierarchical nesting of slow oscillations, spindles and ripples in the human hippocampus during sleep Bernhard P Staresina 1,2,1, Til Ole Bergmann 3 6,1, Mathilde Bonnefond 3, Roemer van der Meij 3, Ole
Nature Neuroscience: doi: /nn Supplementary Figure 1. Large-scale calcium imaging in vivo.
 Supplementary Figure 1 Large-scale calcium imaging in vivo. (a) Schematic illustration of the in vivo camera imaging set-up for large-scale calcium imaging. (b) High-magnification two-photon image from
Supplementary Material for
 Supplementary Material for Selective neuronal lapses precede human cognitive lapses following sleep deprivation Supplementary Table 1. Data acquisition details Session Patient Brain regions monitored Time
Nov versus Fam. Fam 1 versus. Fam 2. Supplementary figure 1
 a Environment map similarity score (mean r ).5..3.2.1 Fam 1 versus Fam 2 Nov versus Fam b Environment cofiring similarity score (mean r ).7.6.5..3.2.1 Nov versus Fam Fam 1 versus Fam 2 First half versus
Exclusion criteria and outlier detection
 1 Exclusion criteria and outlier detection 1 2 Supplementary Fig. 1 31 subjects complied with the inclusion criteria as tested during the familiarization session. The upper part of the figure (ovals) indicates
The AASM Manual for the Scoring of Sleep and Associated Events
 The AASM Manual for the Scoring of Sleep and Associated Events Summary of Updates in Version 2.1 July 1, 2014 The American Academy of Sleep Medicine (AASM) is committed to ensuring that The AASM Manual
Supplementary Figure 1
 Supplementary Figure 1 Miniature microdrive, spike sorting and sleep stage detection. a, A movable recording probe with 8-tetrodes (32-channels). It weighs ~1g. b, A mouse implanted with 8 tetrodes in
Supplementary Figure 1: Kv7 currents in neonatal CA1 neurons measured with the classic M- current voltage-clamp protocol.
 Supplementary Figures 1-11 Supplementary Figure 1: Kv7 currents in neonatal CA1 neurons measured with the classic M- current voltage-clamp protocol. (a), Voltage-clamp recordings from CA1 pyramidal neurons
Reporting Checklist for Nature Neuroscience
 Corresponding Author: Manuscript Number: Manuscript Type: Bernhard Staresina A51406B Article Reporting Checklist for Nature Neuroscience # Main Figures: 5 # Supplementary Figures: 10 # Supplementary Tables:
Large-scale structure and individual fingerprints of locally coupled sleep oscillations
 Original Article Large-scale structure and individual fingerprints of locally coupled sleep oscillations Roy Cox 1,2,3, *,, Dimitris S. Mylonas 2,4,5, Dara S. Manoach 2,4,5 and Robert Stickgold 1,2 1 Department
Nature Neuroscience: doi: /nn Supplementary Figure 1. Trial structure for go/no-go behavior
 Supplementary Figure 1 Trial structure for go/no-go behavior a, Overall timeline of experiments. Day 1: A1 mapping, injection of AAV1-SYN-GCAMP6s, cranial window and headpost implantation. Water restriction
Effects of Light Stimulus Frequency on Phase Characteristics of Brain Waves
 SICE Annual Conference 27 Sept. 17-2, 27, Kagawa University, Japan Effects of Light Stimulus Frequency on Phase Characteristics of Brain Waves Seiji Nishifuji 1, Kentaro Fujisaki 1 and Shogo Tanaka 1 1
Matrix Energetics Research Brainwaves and Heart waves Research on Matrix Energetics in Action
 Matrix Energetics Research Brainwaves and Heart waves Research on Matrix Energetics in Action QEEG (quantitative electroencephalography) and HRV (heart rate variability analysis) tests revealed Dr. Richard
An electrocardiogram (ECG) is a recording of the electricity of the heart. Analysis of ECG
 is a recording of the electricity of the heart. Analysis of ECG") Introduction An electrocardiogram (ECG) is a recording of the electricity of the heart. Analysis of ECG data can give important information about the health of the heart and can help physicians to diagnose
Introduction An electrocardiogram (ECG) is a recording of the electricity of the heart. Analysis of ECG data can give important information about the health of the heart and can help physicians to diagnose
Nature Neuroscience doi: /nn Supplementary Figure 1. Characterization of viral injections.
 Supplementary Figure 1 Characterization of viral injections. (a) Dorsal view of a mouse brain (dashed white outline) after receiving a large, unilateral thalamic injection (~100 nl); demonstrating that
Sum of Neurally Distinct Stimulus- and Task-Related Components.
 SUPPLEMENTARY MATERIAL for Cardoso et al. 22 The Neuroimaging Signal is a Linear Sum of Neurally Distinct Stimulus- and Task-Related Components. : Appendix: Homogeneous Linear ( Null ) and Modified Linear
Supplementary materials for: Executive control processes underlying multi- item working memory
 Supplementary materials for: Executive control processes underlying multi- item working memory Antonio H. Lara & Jonathan D. Wallis Supplementary Figure 1 Supplementary Figure 1. Behavioral measures of
SUPPLEMENTARY INFORMATION
 doi:1.138/nature1139 a d Whisker angle (deg) Whisking repeatability Control Muscimol.4.3.2.1 -.1 8 4-4 1 2 3 4 Performance (d') Pole 8 4-4 1 2 3 4 5 Time (s) b Mean protraction angle (deg) e Hit rate (p
Grouping of Spindle Activity during Slow Oscillations in Human Non-Rapid Eye Movement Sleep
 The Journal of Neuroscience, December 15, 2002, 22(24):10941 10947 Grouping of Spindle Activity during Slow Oscillations in Human Non-Rapid Eye Movement Sleep Matthias Mölle, Lisa Marshall, Steffen Gais,
SUPPLEMENTARY INFORMATION
 SUPPLEMENTARY INFORMATION METHODS Participants. All participants were mentally and physically healthy. The average (± SD) body mass index was 21.4 ± 2.7 kg/m 2 in women and 22.8 ± 2.4 kg/m 2 in men (p=0.18).
Nature Methods: doi: /nmeth Supplementary Figure 1. Activity in turtle dorsal cortex is sparse.
 Supplementary Figure 1 Activity in turtle dorsal cortex is sparse. a. Probability distribution of firing rates across the population (notice log scale) in our data. The range of firing rates is wide but
SUPPLEMENTARY INFORMATION. Supplementary Figure 1
 SUPPLEMENTARY INFORMATION Supplementary Figure 1 The supralinear events evoked in CA3 pyramidal cells fulfill the criteria for NMDA spikes, exhibiting a threshold, sensitivity to NMDAR blockade, and all-or-none
SUPPLEMENTARY INFORMATION
 doi: 10.1038/nature06310 SUPPLEMENTARY INFORMATION www.nature.com/nature 1 www.nature.com/nature 2 www.nature.com/nature 3 Supplementary Figure S1 Spontaneous duration of wake, SWS and REM sleep (expressed
Lateralized hippocampal oscillations underlie distinct aspects of human spatial memory and navigation. Jacobs et al.
 Lateralized hippocampal oscillations underlie distinct aspects of human spatial memory and navigation Jacobs et al. Supplementary Information Lateralized hippocampal oscillations underlie distinct aspects
Recognition of Sleep Dependent Memory Consolidation with Multi-modal Sensor Data
 Recognition of Sleep Dependent Memory Consolidation with Multi-modal Sensor Data The MIT Faculty has made this article openly available. Please share how this access benefits you. Your story matters. Citation
SedLine Sedation Monitor
 SedLine Sedation Monitor Quick Reference Guide Not intended to replace the Operator s Manual. See the SedLine Sedation Monitor Operator s Manual for complete instructions, including warnings, indications
Informationsverarbeitung im zerebralen Cortex
 Informationsverarbeitung im zerebralen Cortex Thomas Klausberger Dept. Cognitive Neurobiology, Center for Brain Research, Med. Uni. Vienna The hippocampus is a key brain circuit for certain forms of memory
SUPPLEMENTARY INFORMATION
 doi:10.1038/nature11239 Introduction The first Supplementary Figure shows additional regions of fmri activation evoked by the task. The second, sixth, and eighth shows an alternative way of analyzing reaction
Supplementary figures
 Supplementary figures Supplementary Figure 1. Temporal distributions of flight behaviors and sleep across days for frigatebird 1. The top plot shows the number of wing flaps and drops. The middle plot
SLEEP STAGING AND AROUSAL. Dr. Tripat Deep Singh (MBBS, MD, RPSGT, RST) International Sleep Specialist (World Sleep Federation program)
 International Sleep Specialist (World Sleep Federation program)") SLEEP STAGING AND AROUSAL Dr. Tripat Deep Singh (MBBS, MD, RPSGT, RST) International Sleep Specialist (World Sleep Federation program) Scoring of Sleep Stages in Adults A. Stages of Sleep Stage W Stage
SLEEP STAGING AND AROUSAL Dr. Tripat Deep Singh (MBBS, MD, RPSGT, RST) International Sleep Specialist (World Sleep Federation program) Scoring of Sleep Stages in Adults A. Stages of Sleep Stage W Stage
Supplementary Information on TMS/hd-EEG recordings: acquisition and preprocessing
 Supplementary Information on TMS/hd-EEG recordings: acquisition and preprocessing Stability of the coil position was assured by using a software aiming device allowing the stimulation only when the deviation
Supplementary Information Methods Subjects The study was comprised of 84 chronic pain patients with either chronic back pain (CBP) or osteoarthritis
 or osteoarthritis") Supplementary Information Methods Subjects The study was comprised of 84 chronic pain patients with either chronic back pain (CBP) or osteoarthritis (OA). All subjects provided informed consent to procedures
Supplementary Information Methods Subjects The study was comprised of 84 chronic pain patients with either chronic back pain (CBP) or osteoarthritis (OA). All subjects provided informed consent to procedures
Supplementary Figure 1 Information on transgenic mouse models and their recording and optogenetic equipment. (a) 108 (b-c) (d) (e) (f) (g)
 108 (b-c) (d) (e) (f) (g)") Supplementary Figure 1 Information on transgenic mouse models and their recording and optogenetic equipment. (a) In four mice, cre-dependent expression of the hyperpolarizing opsin Arch in pyramidal cells
Supplementary Figure 1 Information on transgenic mouse models and their recording and optogenetic equipment. (a) In four mice, cre-dependent expression of the hyperpolarizing opsin Arch in pyramidal cells
Students will be able to determine what stage of sleep someone is in by analyzing their EEG.
 Outline 2Lesson Unit1.2 OVERVIEW Rationale: This lesson is intended to engage students with the concept of the neural circuit. The lesson and unit as a whole use sleep, a behavior everyone is familiar
Submitted report on Sufi recordings at AAPB 2013 in Portland. Not for general distribution. Thomas F. Collura, Ph.D. July, 2013
 Submitted report on Sufi recordings at AAPB 2013 in Portland Not for general distribution. Thomas F. Collura, Ph.D. July, 2013 Summary of EEG findings The intent of the EEG monitoring was to see which
Human Brain Institute Russia-Switzerland-USA
 1 Human Brain Institute Russia-Switzerland-USA CONTENTS I Personal and clinical data II Conclusion. III Recommendations for therapy IV Report. 1. Procedures of EEG recording and analysis 2. Search for
Beyond the Basics in EEG Interpretation: Throughout the Life Stages
 Beyond the Basics in EEG Interpretation: Throughout the Life Stages Steve S. Chung, MD, FAAN Chairman, Neuroscience Institute Director, Epilepsy Program Banner University Medical Center University of Arizona
Supplementary material
 Supplementary material S1. Event-related potentials Event-related potentials (ERPs) were calculated for stimuli for each visual field (mean of low, medium and high spatial frequency stimuli). For each
Supporting Information
 Revisiting default mode network function in major depression: evidence for disrupted subsystem connectivity Fabio Sambataro 1,*, Nadine Wolf 2, Maria Pennuto 3, Nenad Vasic 4, Robert Christian Wolf 5,*
Correlation Dimension versus Fractal Exponent During Sleep Onset
 Correlation Dimension versus Fractal Exponent During Sleep Onset K. Šušmáková Institute of Measurement Science, Slovak Academy of Sciences Dúbravská cesta 9, 84 19 Bratislava, Slovak Republic E-mail: umersusm@savba.sk
Seizure onset can be difficult to asses in scalp EEG. However, some tools can be used to increase the seizure onset activity over the EEG background:
 This presentation was given during the Dianalund Summer School on EEG and Epilepsy, July 24, 2012. The main purpose of this introductory talk is to show the possibilities of improved seizure onset analysis
EEG Analysis on Brain.fm (Focus)
") EEG Analysis on Brain.fm (Focus) Introduction 17 subjects were tested to measure effects of a Brain.fm focus session on cognition. With 4 additional subjects, we recorded EEG data during baseline and while
EEG Analysis on Brain.fm (Focus) Introduction 17 subjects were tested to measure effects of a Brain.fm focus session on cognition. With 4 additional subjects, we recorded EEG data during baseline and while
Characterization of Sleep Spindles
 Characterization of Sleep Spindles Simon Freedman Illinois Institute of Technology and W.M. Keck Center for Neurophysics, UCLA (Dated: September 5, 2011) Local Field Potential (LFP) measurements from sleep
Intracranial Studies Of Human Epilepsy In A Surgical Setting
 Intracranial Studies Of Human Epilepsy In A Surgical Setting Department of Neurology David Geffen School of Medicine at UCLA Presentation Goals Epilepsy and seizures Basics of the electroencephalogram
Hippocampal mechanisms of memory and cognition. Matthew Wilson Departments of Brain and Cognitive Sciences and Biology MIT
 Hippocampal mechanisms of memory and cognition Matthew Wilson Departments of Brain and Cognitive Sciences and Biology MIT 1 Courtesy of Elsevier, Inc., http://www.sciencedirect.com. Used with permission.
Early Learning vs Early Variability 1.5 r = p = Early Learning r = p = e 005. Early Learning 0.
 The temporal structure of motor variability is dynamically regulated and predicts individual differences in motor learning ability Howard Wu *, Yohsuke Miyamoto *, Luis Nicolas Gonzales-Castro, Bence P.
Ultrasound Physics & Terminology
 Ultrasound Physics & Terminology This module includes the following: Basic physics terms Basic principles of ultrasound Ultrasound terminology and terms Common artifacts seen Doppler principles Terms for
EEG Analysis on Brain.fm (Sleep)
") EEG Analysis on Brain.fm (Sleep) Slow-Wave Sleep: What Is it? All of us can relate to feeling sleepy, foggy-headed and hungry after a night of poor sleep. The answer to why we feel this way can be found
EEG Analysis on Brain.fm (Sleep) Slow-Wave Sleep: What Is it? All of us can relate to feeling sleepy, foggy-headed and hungry after a night of poor sleep. The answer to why we feel this way can be found
EEG Arousals: Scoring Rules and Examples. A Preliminary Report from the Sleep Disorders Atlas Task Force of the American Sleep Disorders Association
 EEG Arousals: Scoring Rules and Examples A Preliminary Report from the Sleep Disorders Atlas Task Force of the American Sleep Disorders Association Sleep in patients with a number of sleep disorders and
SUPPLEMENTARY INFORMATION. Rett Syndrome Mutation MeCP2 T158A Disrupts DNA Binding, Protein Stability and ERP Responses
 SUPPLEMENTARY INFORMATION Rett Syndrome Mutation T158A Disrupts DNA Binding, Protein Stability and ERP Responses Darren Goffin, Megan Allen, Le Zhang, Maria Amorim, I-Ting Judy Wang, Arith-Ruth S. Reyes,
Supplementary figure 1: LII/III GIN-cells show morphological characteristics of MC
 1 2 1 3 Supplementary figure 1: LII/III GIN-cells show morphological characteristics of MC 4 5 6 7 (a) Reconstructions of LII/III GIN-cells with somato-dendritic compartments in orange and axonal arborizations
Supplementary Figure S1: Histological analysis of kainate-treated animals
 Supplementary Figure S1: Histological analysis of kainate-treated animals Nissl stained coronal or horizontal sections were made from kainate injected (right) and saline injected (left) animals at different
Regional Slow Waves and Spindles in Human Sleep
 Article Regional Slow Waves and Spindles in Human Sleep Yuval Nir, 1 Richard J. Staba, 2 Thomas Andrillon, 1,4 Vladyslav V. Vyazovskiy, 1 Chiara Cirelli, 1 Itzhak Fried, 3,5 and Giulio Tononi 1, * 1 Department
Supplementary Figure 1. Nature Neuroscience: doi: /nn.4547
 Supplementary Figure 1 Characterization of the Microfetti mouse model. (a) Gating strategy for 8-color flow analysis of peripheral Ly-6C + monocytes from Microfetti mice 5-7 days after TAM treatment. Living
Processed by HBI: Russia/Switzerland/USA
 1 CONTENTS I Personal and clinical data II Conclusion. III Recommendations for therapy IV Report. 1. Procedures of EEG recording and analysis 2. Search for paroxysms 3. Eyes Open background EEG rhythms
Sleep stages. Awake Stage 1 Stage 2 Stage 3 Stage 4 Rapid eye movement sleep (REM) Slow wave sleep (NREM)
 Slow wave sleep (NREM)") Sleep stages Awake Stage 1 Stage 2 Stage 3 Stage 4 Rapid eye movement sleep (REM) Slow wave sleep (NREM) EEG waves EEG Electrode Placement Classifying EEG brain waves Frequency: the number of oscillations/waves
Sleep stages Awake Stage 1 Stage 2 Stage 3 Stage 4 Rapid eye movement sleep (REM) Slow wave sleep (NREM) EEG waves EEG Electrode Placement Classifying EEG brain waves Frequency: the number of oscillations/waves
EE 4BD4 Lecture 11. The Brain and EEG
 EE 4BD4 Lecture 11 The Brain and EEG 1 Brain Wave Recordings Recorded extra-cellularly from scalp (EEG) Recorded from extra-cellularly from surface of cortex (ECOG) Recorded extra-cellularly from deep
Thought Technology Ltd.
 Thought Technology Ltd. 8205 Montreal/ Toronto Blvd. Suite 223, Montreal West, QC H4X 1N1 Canada Tel: (800) 361-3651 ۰ (514) 489-8251 Fax: (514) 489-8255 E-mail: mail@thoughttechnology.com Webpage: http://www.thoughttechnology.com
Place-selective firing contributes to the reverse-order reactivation of CA1 pyramidal cells during sharp waves in open-field exploration
 European Journal of Neuroscience, Vol. 26, pp. 704 716, 2007 doi:10.1111/j.1460-9568.2007.05684.x Place-selective firing contributes to the reverse-order reactivation of CA1 pyramidal cells during sharp
Microcircuitry coordination of cortical motor information in self-initiation of voluntary movements
 Y. Isomura et al. 1 Microcircuitry coordination of cortical motor information in self-initiation of voluntary movements Yoshikazu Isomura, Rie Harukuni, Takashi Takekawa, Hidenori Aizawa & Tomoki Fukai
Nature Neuroscience: doi: /nn Supplementary Figure 1. Behavioral training.
 Supplementary Figure 1 Behavioral training. a, Mazes used for behavioral training. Asterisks indicate reward location. Only some example mazes are shown (for example, right choice and not left choice maze
Report Reference Guide. THERAPY MANAGEMENT SOFTWARE FOR DIABETES CareLink Report Reference Guide 1
 Report Reference Guide THERAPY MANAGEMENT SOFTWARE FOR DIABETES CareLink Report Reference Guide 1 How to use this guide Each type of CareLink report and its components are described in the following sections.
LEARNING MANUAL OF PSG CHART
 LEARNING MANUAL OF PSG CHART POLYSOMNOGRAM, SLEEP STAGE SCORING, INTERPRETATION Sleep Computing Committee, Japanese Society of Sleep Research LEARNING MANUAL OF PSG CHART POLYSOMNOGRAM, SLEEP STAGE SCORING,
Robust disruptions in electroencephalogram cortical oscillations and large-scale functional networks in autism
 Matlis et al. BMC Neurology (2015) 15:97 DOI 10.1186/s12883-015-0355-8 RESEARCH ARTICLE Open Access Robust disruptions in electroencephalogram cortical oscillations and large-scale functional networks
Analysis of in-vivo extracellular recordings. Ryan Morrill Bootcamp 9/10/2014
 Analysis of in-vivo extracellular recordings Ryan Morrill Bootcamp 9/10/2014 Goals for the lecture Be able to: Conceptually understand some of the analysis and jargon encountered in a typical (sensory)
AUTOCORRELATION AND CROSS-CORRELARION ANALYSES OF ALPHA WAVES IN RELATION TO SUBJECTIVE PREFERENCE OF A FLICKERING LIGHT
 AUTOCORRELATION AND CROSS-CORRELARION ANALYSES OF ALPHA WAVES IN RELATION TO SUBJECTIVE PREFERENCE OF A FLICKERING LIGHT Y. Soeta, S. Uetani, and Y. Ando Graduate School of Science and Technology, Kobe
Testing the Accuracy of ECG Captured by Cronovo through Comparison of ECG Recording to a Standard 12-Lead ECG Recording Device
 Testing the Accuracy of ECG Captured by through Comparison of ECG Recording to a Standard 12-Lead ECG Recording Device Data Analysis a) R-wave Comparison: The mean and standard deviation of R-wave amplitudes
CROSSMODAL PLASTICITY IN SPECIFIC AUDITORY CORTICES UNDERLIES VISUAL COMPENSATIONS IN THE DEAF "
 Supplementary Online Materials To complement: CROSSMODAL PLASTICITY IN SPECIFIC AUDITORY CORTICES UNDERLIES VISUAL COMPENSATIONS IN THE DEAF " Stephen G. Lomber, M. Alex Meredith, and Andrej Kral 1 Supplementary
SLEEP. -in 1953, first demonstration that brain was active during sleep. 4. Stages 3& 4: Delta Waves, large slow waves; deep sleep
 SLEEP DEF: altered state, between waking and unconsciousness, defined by specific patterns of brain activity. I. How much sleep do I need? 1. Long vs. Short Sleepers -across developmental stages -individual
Slow oscillations in human non-rapid eye movement sleep electroencephalogram: effects of increased sleep pressure
 J. Sleep Res. () 9, 8 37 Slow oscillations in human EEG doi:./j.365-869.9.775.x Slow oscillations in human non-rapid eye movement sleep electroencephalogram: effects of increased sleep pressure ALESSIA
Supplementary Online Content
 Supplementary Online Content Miocinovic S, de Hemptinne C, Qasim S, Ostrem JL, Starr PA. Patterns of cortical synchronization in isolated dystonia compared with Parkinson disease. JAMA Neurol. Published
Supplemental Information. Night Watch in One Brain Hemisphere during Sleep. Associated with the First-Night Effect in Humans
 Current Biology, Volume 26 Supplemental Information Night Watch in One Brain Hemisphere during Sleep Associated with the First-Night Effect in Humans Masako Tamaki, Ji Won Bang, Takeo Watanabe, and Yuka
PEER REVIEW FILE. Reviewers' Comments: Reviewer #1 (Remarks to the Author)
") PEER REVIEW FILE Reviewers' Comments: Reviewer #1 (Remarks to the Author) Movement-related theta rhythm in the hippocampus is a robust and dominant feature of the local field potential of experimental
PEER REVIEW FILE Reviewers' Comments: Reviewer #1 (Remarks to the Author) Movement-related theta rhythm in the hippocampus is a robust and dominant feature of the local field potential of experimental
File name: Supplementary Information Description: Supplementary Figures, Supplementary Table and Supplementary References
 File name: Supplementary Information Description: Supplementary Figures, Supplementary Table and Supplementary References File name: Supplementary Data 1 Description: Summary datasheets showing the spatial
Supporting Information
 1 2 3 4 5 6 7 8 9 10 11 12 13 14 15 16 17 18 19 20 21 22 23 24 25 26 27 28 29 30 31 32 33 34 35 36 37 38 39 40 Supporting Information Variances and biases of absolute distributions were larger in the 2-line
Ultrashort Sleep-Wake Cycle: Timing of REM Sleep. Evidence for Sleep-Dependent and Sleep-Independent Components of the REM Cycle
 Sleep 10(1):62-68, Raven Press, New York 1987, Association of Professional Sleep Societies Ultrashort Sleep-Wake Cycle: Timing of REM Sleep. Evidence for Sleep-Dependent and Sleep-Independent Components
Nature Neuroscience: doi: /nn Supplementary Figure 1
 Supplementary Figure 1 Atlas representations of the midcingulate (MCC) region targeted in this study compared against the anterior cingulate (ACC) region commonly reported. Coronal sections are shown on
ABSTRACT 1. INTRODUCTION 2. ARTIFACT REJECTION ON RAW DATA
 AUTOMATIC ARTIFACT REJECTION FOR EEG DATA USING HIGH-ORDER STATISTICS AND INDEPENDENT COMPONENT ANALYSIS A. Delorme, S. Makeig, T. Sejnowski CNL, Salk Institute 11 N. Torrey Pines Road La Jolla, CA 917,
Interictal epileptiform discharges and phasic phenomena of REM sleep
 Original article Epileptic Disord 2010; 12 (3): 217-21 Interictal epileptiform discharges and phasic phenomena of REM sleep Petr Busek, Jitka Buskova, Sona Nevsimalova Department of Neurology, 1 st Faculty
Entrainment of neuronal oscillations as a mechanism of attentional selection: intracranial human recordings
 Entrainment of neuronal oscillations as a mechanism of attentional selection: intracranial human recordings J. Besle, P. Lakatos, C.A. Schevon, R.R. Goodman, G.M. McKhann, A. Mehta, R.G. Emerson, C.E.
Incorporation of Imaging-Based Functional Assessment Procedures into the DICOM Standard Draft version 0.1 7/27/2011
 Incorporation of Imaging-Based Functional Assessment Procedures into the DICOM Standard Draft version 0.1 7/27/2011 I. Purpose Drawing from the profile development of the QIBA-fMRI Technical Committee,
Electroencephalography
 The electroencephalogram (EEG) is a measure of brain waves. It is a readily available test that provides evidence of how the brain functions over time. The EEG is used in the evaluation of brain disorders.
A Modified Method for Scoring Slow Wave Sleep of Older Subjects
 Sleep, 5(2):195-199 1982 Raven Press, New York A Modified Method for Scoring Slow Wave Sleep of Older Subjects Wilse B. Webb and Lewis M. Dreblow Department of Psychology, University of Florida, Gainesville,
Sleep Spindle Detection Based on Complex Demodulation Jia-bin LI, Bei WANG* and Yu ZHANG
 International Conference on Biomedical and Biological Engineering (BBE 216) Sleep Spindle Detection Based on Complex Demodulation Jia-bin LI, Bei WANG* and Yu ZHANG Department of Automation, School of
Basics of Polysomnography. Chitra Lal, MD, FCCP, FAASM Assistant professor of Medicine, Pulmonary, Critical Care and Sleep, MUSC, Charleston, SC
 Basics of Polysomnography Chitra Lal, MD, FCCP, FAASM Assistant professor of Medicine, Pulmonary, Critical Care and Sleep, MUSC, Charleston, SC Basics of Polysomnography Continuous and simultaneous recording
Optimal preictal period in seizure prediction
 Optimal preictal period in seizure prediction Mojtaba Bandarabadi, Jalil Rasekhi, Cesar A. Teixeira, António Dourado CISUC/DEI, Center for Informatics and Systems of the University of Coimbra, Department
Meaning-based guidance of attention in scenes as revealed by meaning maps
 SUPPLEMENTARY INFORMATION Letters DOI: 1.138/s41562-17-28- In the format provided by the authors and unedited. -based guidance of attention in scenes as revealed by meaning maps John M. Henderson 1,2 *
linkedin.com/in/lizziehillsleeptechservices 1
 BSS2015 Hands-On Tech Breakfast SCORING SLEEP USING AASM GUIDELINES: A BRIEF INTRODUCTION Lizzie Hill BSc RPSGT EST Specialist Respiratory Clinical Physiologist, Royal Hospital for Sick Children, Edinburgh
Nature Neuroscience: doi: /nn Supplementary Figure 1. Confirmation that optogenetic inhibition of dopaminergic neurons affects choice
 Supplementary Figure 1 Confirmation that optogenetic inhibition of dopaminergic neurons affects choice (a) Sample behavioral trace as in Figure 1d, but with NpHR stimulation trials depicted as green blocks
Northeast Center for Special Care Grant Avenue Lake Katrine, NY
 300 Grant Avenue Lake Katrine, NY 12449 845-336-3500 Information Bulletin What is Brain Mapping? By Victor Zelek, Ph.D., Director of Neuropsychological Services Diplomate, National Registry of Neurofeedback
Nature Neuroscience: doi: /nn Supplementary Figure 1. Task timeline for Solo and Info trials.
 Supplementary Figure 1 Task timeline for Solo and Info trials. Each trial started with a New Round screen. Participants made a series of choices between two gambles, one of which was objectively riskier
CHAPTER 6 INTERFERENCE CANCELLATION IN EEG SIGNAL
 116 CHAPTER 6 INTERFERENCE CANCELLATION IN EEG SIGNAL 6.1 INTRODUCTION Electrical impulses generated by nerve firings in the brain pass through the head and represent the electroencephalogram (EEG). Electrical
Double dissociation of value computations in orbitofrontal and anterior cingulate neurons
 Supplementary Information for: Double dissociation of value computations in orbitofrontal and anterior cingulate neurons Steven W. Kennerley, Timothy E. J. Behrens & Jonathan D. Wallis Content list: Supplementary
Proceedings 23rd Annual Conference IEEE/EMBS Oct.25-28, 2001, Istanbul, TURKEY
 AUTOMATED SLEEP STAGE SCORING BY DECISION TREE LEARNING Proceedings 23rd Annual Conference IEEE/EMBS Oct.25-28, 2001, Istanbul, TURKEY Masaaki Hanaoka, Masaki Kobayashi, Haruaki Yamazaki Faculty of Engineering,Yamanashi
EEG in the ICU. Quiz. March Teneille E. Gofton
 EEG in the ICU Quiz March 2012 Teneille E. Gofton Quiz The next several slides will show 15 subhairline EEGs. Choose the best possible answer in each scenario. Your score and solutions will be provided
Ube3a is required for experience-dependent maturation of the neocortex
 Ube3a is required for experience-dependent maturation of the neocortex Koji Yashiro, Thorfinn T. Riday, Kathryn H. Condon, Adam C. Roberts, Danilo R. Bernardo, Rohit Prakash, Richard J. Weinberg, Michael
Real-time State of Vigilance Detection for Probing Seizure Mechanisms and Seizure Control
 Real-time State of Vigilance Detection for Probing Seizure Mechanisms and Seizure Control Andrew M. Alexander, McNair Scholar The Pennsylvania State University McNair Faculty Research Advisor: Bruce J.
Head Direction Cells in the Postsubiculum Do Not Show Replay of Prior Waking Sequences During Sleep
 HIPPOCAMPUS 22:604 618 (2012) Head Direction Cells in the Postsubiculum Do Not Show Replay of Prior Waking Sequences During Sleep Mark P. Brandon,* Andrew R. Bogaard, Chris M. Andrews, and Michael E. Hasselmo*