Mali. Factsheets of Health Statistics 2010
|
|
|
- Hilda Harmon
- 5 years ago
- Views:
Transcription


1 Factsheets of Health Statistics 2010
 in and neighboring countries, 2008 12,706 34,373 20,591 15,234 14,704 12,211")
2 Figure 1 : and neighboring countries Côte d Ivoire Figure 2 : Population size (in thousands) in and neighboring countries, ,706 34,373 20,591 15,234 14,704 12,211 9,833 3,215
3 1. Health Status Life expectancy Figure 3 : Life expectancy i at birth in years, in and neighboring countries, 2008 and Figure 4 : Life expectancy at birth in years, in and neighboring countries, by sex, 2008 Male Female i Definition: average number of years that a newborn is expected to live if current mortality rates continue to apply
4 Figure 5 : Healthy life expectancy ii at birth in years, in and neighboring countries, by sex, 2007 Male Female Mortality Figure 6 : Adult mortality rate iii per 1,000 population in and neighboring countries, 2008 and ii Definition: average number of years that a person can expect to live in full health by taking into account years lived in less than full health due to disease and/or injury iii Definition: probability that a 15-year-old person will die before reaching his/her 60th birthday. Mortality data. Geneva, World Health Organization, 2010 (
5 Figure 7 : Adult mortality rate per 1,000 population in and neighboring countries, by sex, 2008 Male Female Figure 8 : Under-five mortality rate iv (per 1, 000 live births) in and neighboring countries, both sexes, 2009 and Source : Levels and Trends in Child Mortality; Report Estimates Developed by the UN Inter-Agency Group for Child Mortality Estimation. UNICEF, WHO, The World Bank and United Nations DESA/Population Division. New York: UNICEF, 2010 iv Definition: under-five mortality rate is the probability of a child born in a specific year or period dying before reaching the age of five, if subject to age-specific mortality rates of that period
6 Figure 9 : Infant mortality rate v per 1,000 lives births in and neighboring countries, 2009 and Source : Levels and Trends in Child Mortality; Report Estimates Developed by the UN Inter-Agency Group for Child Mortality Estimation. UNICEF, WHO, The World Bank and United Nations DESA/Population Division. New York: UNICEF, 2010 Figure 10 : Distribution of causes of death among children aged <5 years (%) in, 2008 Other diseases 17 Injuries 2 HIV/AIDS 1 Diarrhoea 19 Congenital abnormalities 2 Neonatal sepsis 4 Birth asphyxia 7 Meas les 0 Malaria 21 Prematurity 8 Pneumonia 19 v Infant mortality rate is the probability of a child born in a specific year or period dying before reaching the age of one, if subject to age-specific mortality rates of that period.
7 Figure 11 : Maternal mortality ratio vi per 100,000 live births in and neighboring countries, 2008 and , ,200 1, Source : Trends in Maternal Mortality: 1990 to Estimates Developed by WHO, UNICEF, UNFPA and The World Bank. Geneva: WHO, 2010 Burden of Disease Figure 12 : Distribution burden of diseases as % of total DALYs vii by broader causes in and neighboring countries, by country, 2004 Communicable diseases, maternal and perinatal conditions and nutritional deficiencies Noncommunicable conditions Injuries 76% 18% 6% 79% 15% 5% 73% 20% 7% 68% 24% 8% 66% 21% 13% 64% 27% 8% 63% 28% 9% 34% 55% 12% 71% 21% 8% vi Definition: number of maternal deaths per live births during a specified time period, usually one year. vii DALY is a health gap measure that extends the concept of potential years of life lost due to premature death (PYLL) to include equivalent years of healthy life lost by virtue of being in states of poor health or disability (1). DALYs for a disease or health condition are calculated as the sum of the years of life lost due to premature mortality (YLL) in the population and the years lost due to disability (YLD) for incident cases of the health condition.
8 Figure 13 : Distribution of years of life lost viii by broader causes in and neighboring countries, 2004 Communicable disease Non communicable conditions Injuries The Health System Health financing Figure 14 : Per capita total expenditure on health (PPP int. $) in and neighboring countries, 2007 and viii Definition: YLL are calculated from the number of deaths multiplied by a standard life expectancy at the age at which death occurs. The standard life expectancy used for YLL at each age is the same for deaths in all regions of the world and is the same as that used for the calculation of disability-adjusted-life years (DALY). Additionally 3% time discounting and non-uniform age weights which give less weight to years lived at young and older ages were used as for the DALY. With non-uniform age weights and 3% discounting, a death in infancy corresponds to 33 YLL, and deaths at ages 5 to 20 to around 36 YLL.
9 Figure 15 : Total expenditure on health as percent of GDP ix in and neighboring countries, 2007 and Figure 16 : General government expenditure on health as % of total expenditure on health in and neighboring countries, 2007 and ix Gross domestic product (GDP) is the value of all goods and services provided in a country by residents and non-residents. This corresponds to the total sum of expenditure (consumption and investment) of the private and government agents of the economy during the reference year.
10 Figure 17 : General government expenditure on health as % of total government expenditure in and neighboring countries, 2007 and Figure 18 : External resources for health as percent of total expenditure on health in and neighboring countries, 2007 and
11 Figure 19 : Private expenditure on health as percent of total expenditure on health in and neighboring countries, 2007 and Figure 20 : Out-of-Pocket expenditure x as % of private expenditure on health in and neighboring countries, 2007 and x Household out-of-pocket spending (OOPS): the direct outlays of households, including gratuities and in-kind payments made to health practitioners and to suppliers of pharmaceuticals, therapeutic appliances and other goods and services. This includes household direct payments to public and private providers of health care services, nonprofit institutions, and non-reimbursable cost sharing, such as deductibles, copayments and fee for services
12 Figure 21: Per capita government expenditure on health (PPP int.$) in and neighboring countries, 2007 and Health workforce Figure 22 : The physician to population ratio (per 10,000 population) in and neighboring countries, <
13 Figure 23 : The nursing and midwifery personnel to population ratio (per 10,000 population) in and neighboring countries, < Medical products and equipment Figure 24 : Median percent availability of selected generic medicines in a sample of health facilities in and neighboring countries with data in Public Private : No data
14 Figure 25 : Median consumer price ratio of selected generic medicines (ratio of median local unit price to management sciences for health international reference price), and neighboring countries, Public Private : No data Figure 26 : Hospital beds xi per 10,000 population in and neighboring countries, xi Definition: number of inpatient beds per population
15 Health information Civil registration coverage Figure 27 : Percentage of civil registration coverage for births xii in and neighboring countries, >90 : No data Figure 28 : Percentage of civil registration coverage of deaths xiii in and neighboring countries, <25 <25 <25 <25 <25 <25 < : No data xii Definition: percentage of estimated total births that are counted through civil registration system. xiii Definition: percentage of estimated total deaths that are counted through civil registration system.
16 3. Specific Programs and Services HIV/AIDS Figure 29 : HIV/AIDS mortality rate (per populations) in and neighboring countries, < < Figure 30 : Percentage of antiretroviral therapy among people with HIV/AIDS in need of treatment in and neighboring countries, 2009 and
17 Figure 31 : Percentage of people years of age living with HIV in and neighboring countries, 2007 and Figure 32 : Percentage of men aged years who used a condom at last high-risk sex in and neighboring countries, : No data Source: United Nations Statistical Division-MDG database-accessed 10 June 2010
18 Figure 33 : Percentage of women aged years who used a condom at last high-risk sex in and neighboring countries, : No data Source: United Nations Statistical Division-MDG database-accessed 10 June 2010 Figure 34 : Proportion of men years old with comprehensive correct knowledge of HIV/AIDS in and neighboring countries, : No data Source: United Nations Statistical Division-MDG database-accessed 10 June 2010
19 Figure 35 : Proportion of women Years age with comprehensive correct knowledge of HIV/AIDS in and neighboring countries, : No data Source: United Nations Statistical Division-MDG database-accessed 10 June 2010 Figure 36 : Ratio of orphans to non-orphans school attendance, and in and neighboring countries : No data Source: United Nations Statistical Division-MDG database-accessed 10 June
20 Tuberculosis Figure 37 : Tuberculosis incidence rate per 100,000 population per year in and neighboring countries, 2008 et Figure 38 : Tuberculosis prevalence per 100,000 per year population in and neighboring countries, 2008 and
21 Figure 39 : Tuberculosis death rate (per 100,000 population per year) in and neighboring countries, 2007 and Source: United Nations Statistical Division-MDG database-accessed 10 June 2010 Figure 40 : Percentage of tuberculosis detection under DOTS xiv in and neighboring countries, 2007 and : No data Source: United Nations Statistical Division-MDG database-accessed 10 June 2010 xiv Definition: the proportion of new smear-positive TB cases registered under DOTS in a given year that successfully completed treatment, whether with bacteriologic evidence of success ( cured ) or without ( treatment completed )
22 Malaria Figure 41 : Notified cases of malaria, in thousands, in and neighboring countries, , , , , : No data Figure 42 : Percentage of under five children sleeping an insecticide-treated bed nets in and in with neighboring countries : No data
23 Figure 43 : Percentage of under five children with fever being treated with anti-malarial drugs in and in with neighboring countries : No data Vaccine preventable diseases Figure 44 : Percentage of neonates protected at birth against neonatal tetanus in and neighboring countries, 2008 and
24 Figure 45 : Percent immunization coverage among 1-year-olds for DTP3 in and neighboring countries, 2008 and Figure 46 : Immunization coverage among 1-year-olds for HepB3 in and neighboring countries, : No data
25 Maternal and newborn health Figure 47 : Percentage of infants exclusively breastfed for the first 6 months of life in and neighboring countries, Figure 48 : Percentage of low-birth-weight newborns in and neighboring countries,
26 Figure 49 : Percentage of births attended by skilled health personnel in and neighboring countries, and Figure 50: Percentage of births by caesarean xv section in and neighboring countries, ,4 3.4 : No data xv Definition: percentage of births by caesarean section among all live births in a given time period
27 Figure 51 : Percentage of antenatal care coverage, at least one visit, in and neighboring countries, and Sexual and reproductive health Figure 52 : Percentage of unmet need for family planning- in and neighboring countries, and : No data
28 Figure 53 : Percentage of current contraceptive use xvi (any method) among married women years of age in and neighboring countries, and : No data Neglected tropical diseases Figure 54 : Number of reported cases of leprosy in and neighboring countries, ,814 : No data xvi Percentage of women aged married or in-union who are currently using, or whose sexual partner is using, at least one method of contraception, regardless of the method used. See details in World Health Organization (2006), Reproductive Health Indicators: Guidelines for their Generation, Interpretation and Analysis for Global Monitoring, Geneva (available from : or in the Web site :
29 Non-communicable diseases and conditions Figure 55 : Distribution of causes of non-communicable burden of diseases (% of total DALYs) in, 2004 gnant neoplasms Other neoplasms Diabetes mellitus Endocrine disorders Neuropsychiatric conditions Sense organ diseases Cardiovascular diseases Respiratory diseases Digestive diseases Genitourinary diseases Skin diseases Musculoskeletal diseases Congenital anomalies Oral conditions Figure 56 : Distribution of causes of intentional and non-intentional injuries (% of total DALYs) in, 2004 Unintentional injuries 4.7 Road traffic accidents Poisonings Falls Fires Drownings Other unintentional injuries Intentional injuries 1.5 Self-inflicted injuries 1.1 Violence War
30 Figure 57 : Distribution of causes of neuropsychiatric burden of diseases (% of total DALYs) in, 2004 Unipolar depressive disorders 1.0 Bipolar disorder 0.4 Schizophrenia 0.4 Epilepsy 0.4 Alcohol use disorders 0.2 Alzheimer and other dementias 0.2 Parkinson disease 0.1 Multiple sclerosis 0.1 Drug use disorders 0.1 Post-traumatic stress disorder 0.1 Obsessive-compulsive disorder 0.1 Panic disorder 0.0 Insomnia (primary) 0.0 Migraine 0.0 Risk Factors for Health Figure 58 : Percent of current tobacco use in persons 15 years of age or older in and neighboring countries, 2006 Male Female : No data
31 Figure 59 : Alcohol consumption (liters per person) among adults aged 15 years of age or older in and neighboring countries, <0.1 < Food and Nutrition Figure 60 : Percentage of underweight children under five in and neighboring countries, and
32 Figure 61 : Percentage of stunted children under five years of age in and neighboring countries, and : No data Figure 62 : Percentage of overweight children under five years of age in and neighboring countries, and : No data
33 4. Broader Determinants of Health Demography Figure 63 : Total fertility rate per woman in and neighboring countries, 2008 and Figure 64 : Age distribution of the population in and neighboring countries, 2008 Aged under 15 (%) Aged (%) Aged over 60 (%)
34 Figure 65 : Annual growth rate (in percent) of population in and neighboring countries, and Resources and infrastructure Figure 66 : Gross national income per capita xvii (PPP int. $) in and neighboring countries, 2008 and ,090 1, , , ,580 1,760 4,340 7,940 : No data 1,319 2,279 xvii Gross national income per capita: is the sum of value added by all resident producers plus any product taxes (less subsidies) not included in the valuation of output plus net receipts of primary income (compensation of employees and property income) from abroad. GNI per capita is gross national income divided by mid-year population. For further details:
35 Figure 67 : Electrification rate in and neighboring countries, : No data Figure 68 : Paved roads xviii as percentage of all roads in and neighboring countries, : No data Source: World Bank Database 2010 Accessed on 10 June 2010 xviii Paved roads are those surfaced with crushed stone (macadam) and hydrocarbon binder or bituminized agents, with concrete, or with cobblestones, as a percentage of all the country's roads, measured in length. Source:
36 Poverty and income inequality Figure 69: Percentage of the population living under $1 (PPP int. $) a day (i.e. in absolute poverty) in and neighboring countries, : No data Figure 70: Share of incomes by poorest and richest section of the population in and neighboring countries, Poorest 10% Poorest 20% Richest 20% Richest 10% , , Source: World Bank 2010
37 Gender equity Figure 71 : Percentage of female and male combined gross enrolment ratio xix for primary-secondarytertiary education in and neighboring countries, 2005 Male Female Source: United Nations Statistical Division-MDG database-accessed 10 June 2010 xix Number of students enrolled in primary, secondary and tertiary levels of education, regardless of age, as percentage of the population of official school age for the three levels. The gross enrolment ratio can be greater than 100% as a result of grade repetition and entry at ages younger or older than the typical age at that grade level (UNDP definition).
38 Figure 72 : Percentage of seats xx held by women in national parliaments in and neighboring countries, 2009 and : No data Source: United Nations Statistical Division-MDG database-accessed 10 June 2010 xx Number of seats held by women expressed as a percentage of all occupied seats. Women s representation in parliaments is one aspect of women s opportunities in political and public life, and it is therefore linked to women s empowerment. For additional, see the Website
39 Education Figure 73 : Percentage of the population aged years who can both read and write (i.e. youth literacy rate xxi ) in and neighboring countries, and : No data Source: United Nations Statistical Division-MDG database-accessed 10 June Figure 74 : Adult literacy rate (% aged 15 and older) in and neighboring countries, male and female, Male Female : No data Source: UNESCO Institute for Statistics xxi The youth literacy rate reflects the outcomes of primary education over the previous 10 years or so. As a measure of the effectiveness of the primary education system, it is often seen as a proxy measure of social progress and economic achievement. The literacy rate for this analysis is simply the complement of the illiteracy rate. For details, see the Web sites :
40 Environment Figure 75 : Percentage of the population using improved drinking water sources xxii in and neighboring countries, 2008 and Figure 76 : Percentage of the urban and rural population with access to improved drinking-water source in and neighboring countries, 2008 Urban Rural xxii Improved drinking water source, by nature of its construction and design, is likely to protect the source from outside contamination, in particular from faecal matter. Improved drinking water sources include: -piped water into dwelling, plot or yard - public tap/stand pipe - tube well/borehole - protected dug well - protected spring and - rainwater collection. Note: Joint monitoring programme for water supply and sanitation [online database]. Geneva, WHO, UNICEF, 2008 (
41 Figure 77 : Percentage of the population using improved sanitation facilities in and neighboring countries, 2008 and Figure 78 : Percentage of the population using improved sanitation facilities in and neighboring countries, urban and rural, 2008 Urban Rural
42 Figure 79 : Percentage of the population living in urban areas in and neighboring countries, 2008 and Figure 80 : Percentage of urban population living in slums xxiii in and neighboring countries, 2005 and : No data Source: United Nations Statistical Division-MDG database-accessed 10 June 2010 xxiii A slum household is defined as a group of individuals living under the same roof lacking one or more1 of the following conditions: Access to improved water, Access to improved sanitation, Sufficient-living area, Durability of housing, Security of tenure. However, since information on secure tenure is not available for most of the countries, only the first four indicators are used to define slum household, and then to estimate the proportion of urban population living in slums. The indicator is intended to provide an overview of the share of urban population living in conditions of poverty and physical and environmental deprivation. For details, see United Nations Human Settlements Programme (UN-HABITAT) (2003). Global Urban Observatory. Nairobi (Available at the Web site
43 Global partnerships and financial flows Figure 81 : Per capita official development assistance (ODA) xxiv received (US$) in and neighboring countries, Source: OECD-DAC 2007, World Bank2007 Figure 82 : Official development assistance (ODA) received as percentage of GDP in and neighboring countries, 2005 and xxiv Official Development Assistance (ODA): is defined as those flows to countries and territories on the DAC List of ODA Recipients/(available at and to multilateral development institutions which are: 1. provided by official agencies, including state and local governments, or by their executive agencies; and 2. each transaction of which: a) is administered with the promotion of the economic development and welfare of developing countries as its main objective; and b) is concessional in character and conveys a grant element of at least 25 per cent (calculated at a rate of discount of 10 per cent).
44 Figure 83 : Total debt service as percentage of GDP in and neighboring countries, 2005 and Source: World Bank Figure 84 : Total external debt stocks xxv, (in millions of US $) in and neighboring countries, ,018 13,938 5,541 3,268 2,588 1,704 1, : No data xxv Total external debt is debt owed to nonresidents repayable in foreign currency, goods, or services. Total external debt is the sum of public, publicly guaranteed, and private nonguaranteed long-term debt, use of IMF credit, and short-term debt. Short-term debt includes all debt having an original maturity of one year or less and interest in arrears on long-term debt. Data are in current U.S. dollars. Source: World Bank, Global Development Finance
45 Science &Technology Figure 85 : Percentage of population with telephone in and neighboring countries, 2005 and Source: International Telecommunication Union -Accessed 19 September 2009 Figure 86 : Percentage of population who are cellular or mobile subscribers in and neighboring countries, 2006 and , : No data Source: International Telecommunication Union -Accessed 19 September 2009
46 Figure 87 : Percentage of population who are telephone (fixed & mobile) subscribers in and neighboring countries, Source: International Telecommunication Union -Accessed 19 September 2009 Figure 88 : Percentage of the population who are Internet users in and neighboring countries, Source: United Nations Statistical Division-MDG database-accessed 10 June 2010
47 Emergencies and Disasters Figure 89 : The total number of internally displaced xxvi people (thousands) in and neighboring countries, , ,113.5 : No data Figure 90 : The total number of refugees (in thousands) in and neighboring countries of origin, ,738 : No data Source: UNHCR 2007 xxvi Internally displaced people (IDPs, thousand): Number (in thousand) of "persons or groups of persons who have been forced or obliged to flee or to leave their homes or places of habitual residence, in particular as a result of or in order to avoid the effects of armed conflict, situations of generalized violence, violations of human rights or natural or human-made disasters, and who have not crossed an internationally recognized State border." Read more, see

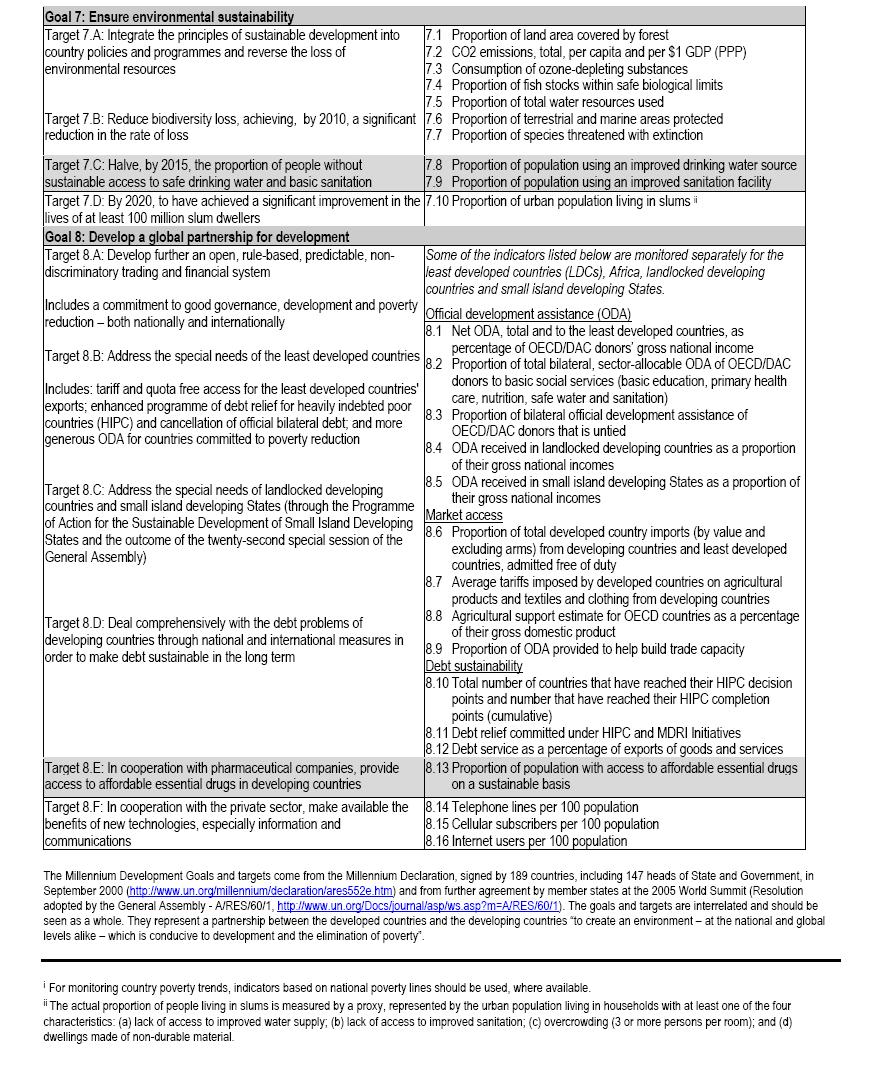
48 5. Progress on the Health-Related MDGs Official list of MDG indicators
49
50 MDG-4 (Child health) Figure 91 : Under Five Mortality Rate per 1,000 live births in 2009 and the MDG target rate in and neighboring countries, 2009 and MDG Target 2009 MDG Target Source : Levels and Trends in Child Mortality; Report Estimates Developed by the UN Inter-Agency Group for Child Mortality Estimation. UNICEF, WHO, The World Bank and United Nations DESA/Population Division. New York: UNICEF, 2010 MDG-5 (Maternal health) Figure 92: Maternal mortality ratio (per 100,000 live births) in 2008 and the MDG target ratio in and neighboring countries 2008 MDG Target Source : Trends in Maternal Mortality: 1990 to Estimates Developed by WHO, UNICEF, UNFPA and The World Bank. Geneva: WHO, 2010
51 Figure 93: Percentage of Births Attended by Skilled Health Personnel in and neighboring countries, and MDG Target MDG Target Figure 94: Percentage of contraceptive use among currently married women years of age, in and neighboring countries, and : No data
52 MDG-6 (AIDS, malaria and TB) Figure 93 : Prevalence of HIV among adults aged years (%) in and neighboring countries, 2007 and Figure 94 : Percentage of population in need of treatment with access to antiretroviral drugs in 2009 and 2007 in and neighboring countries
53 Figure 95 : Percentage of under five children sleeping under insecticide-treated bed nets in and in and neighboring countries : No data Figure 98: Percentage of under five children with fever being treated with anti-malarial drugs in and in and neighboring countries : No data
54 Figure 99 : Prevalence of tuberculosis (/100,000 pop) in 2008 and the MDG target prevalence in and neighboring countries 2008 MDG Target MDG-1 (Malnourished children) Figure 100 : Percentage of underweight children under five years of age and the MDG target percentage in and neighboring countries, and MDG target MDG Target
55 MDG-7 (Water and sanitation) Figure 101 : Percentage of the population using improved drinking water sources in 2008 and MDG target in and neighboring countries 2008 MDG Target Figure 102: Percentage of the population using improved sanitation facilities in 2008 and MDG target percentage in and neighboring countries 2008 MDG Target
56 MDG-8 (exports of goods, services and income) Figure 103: Total debt service as percentage of exports of goods, services and income in and neighboring countries, 2007and Sub-saharian Region : No data
57 6. Explanatory notes The following provides the definition of the health statistics categories included in this statistical annex, as well as the rationale for including them and the estimation methods used to produce them. 1. Life expectancy at birth Rationale for use: life expectancy at birth reflects the overall mortality level of a population. It summarizes the mortality pattern that prevails across all age groups children and adolescents, adults and the elderly. Definition: average number of years that a newborn is expected to live if current mortality rates continue to apply. Methods of estimation: WHO has developed a model life table based on about 1800 life tables from vital registration judged to be of good quality. For countries with vital registration, the level of completeness of recorded mortality data in the population is assessed and mortality rates are adjusted accordingly. Where vital registration data for 2003 were available, these were used directly to construct the life table. For countries where the information system provided a time series of annual life tables, parameters from the life table were projected using a weighted regression model, giving more weight to recent years. Projected values of the two life table parameters were then applied to the modified logit life table model, where the most recent national data provided an age pattern, to predict the full life table for In case of inadequate sources of age-specific mortality rates, the life table is derived from estimated under-5 mortality rates and adult mortality rates that are applied to a global standard (defined as the average of all the 1800 life tables using a modified logit model.) 2. Healthy life expectancy (HALE) Rationale for use: substantial resources are devoted to reducing the incidence, duration and severity of major diseases that cause morbidity but not mortality and to reducing their impact on people s lives. It is important to capture both fatal and non-fatal health outcomes in a summary measure of average levels of population health. Healthy life expectancy (HALE) at birth adds up expectation of life for different health states, adjusted for severity distribution making it sensitive to changes over time or differences between countries in the severity distribution of health states. Definition: average number of years that a person can expect to live in full health by taking into account years lived in less than full health due to disease and/or injury. Methods of estimation: since comparable health state prevalence data are not available for all countries, a four-stage strategy is used. Data from the WHOGBD study are used to estimate severity-adjusted prevalence by age and sex for all countries. Data from the WHOMCSS and WHS are used to make independent estimates of severity-adjusted prevalence by age and sex for survey countries. Prevalence for all countries is calculated based on GBD, MCSS and WHS estimates. Life tables constructed by WHO are used with Sullivan s method to compute HALE for countries. 3. Probability of dying (per 1000) between ages 15 and 60 years (adult mortality rate) Rationale for use: disease burden from non-communicable diseases among adults the most economically productive age span is rapidly increasing in developing countries due to ageing and health transitions. Therefore, the level of adult mortality is becoming an important indicator for the comprehensive assessment of the mortality pattern in a population. Definition: probability that a 15-year-old person will die before reaching his/her 60th birthday. 4. Life table (see life expectancy at birth). Data sources: civil or sample registration: Mortality by age and sex are used to calculate age specific rates. Census: Mortality by age and sex tabulated from questions on recent deaths that occurred in the household during a given period preceding the census (usually 12 months). Census or surveys: Direct or indirect methods provide adult mortality rates based on information on survival of parents or siblings. Methods of estimation: empirical data from different sources are consolidated to obtain estimates of the level and trend in adult mortality by fitting a curve to the observed mortality points. However, to obtain the best possible estimates, judgement needs to be made on data quality and how representative it is of the population. Recent statistics based on data availability in most countries are point estimates dated by at least 3 4 years which need to be projected forward in order to obtain estimates of adult mortality for the current year. When no adequate source of age-specific mortality exists, the life table is derived as described in the life expectancy indicator. 5. Probability of dying (per 1000) under age five years (under-five mortality rate) / Probability of dying (per 1000) under age one year (infant morality rate) Rationale for use: under-five mortality rate and infant mortality rate are leading indicators of the level of child health and overall development in countries. They are also MDG indicators. Definition: under-five mortality rate is the probability of a child born in a specific year or period dying before reaching the age of five, if subject to age-specific mortality rates of that period. Infant mortality rate is the probability of a child born in a specific year or period dying before reaching the age of one, if subject to age-specific mortality rates of that period. Methods of estimation: empirical data from different sources are consolidated to obtain estimates of the level and trend in under-five mortality by fitting a curve to the observed mortality points. However, to obtain the best possible estimates, judgement needs to be made on data quality and how representative it is of the population. Recent statistics based on data availability in most countries are point estimates dated by at least 3 4 years which need to be projected forward in order to obtain estimates of under-five mortality for the current year. Those are then converted to their corresponding infant mortality rates through model life table systems: the one developed by WHO for countries with adequate vital registration data; Coale-Demeny model life tables for the other countries. It should be noted that the infant mortality from surveys are exposed to recall bias, hence their estimates are derived from under-five mortality, which leads to a supplementary step to estimate infant mortality rates. 6. Neonatal mortality rate (per 1000 live births) Rationale for use: neonatal deaths account for a large proportion of child deaths. Mortality during neonatal period is considered a useful indicator of both maternal and newborn health and care. Definition: number of deaths during the first 28 completed days of life per 1000 live births in a given year or period. Neonatal deaths may be subdivided into early neonatal deaths, occurring during the first seven days of life, and late neonatal deaths, occurring after the seventh day but before the 28 completed days of life.
58 7. Maternal mortality ratio (per live births) Rationale for use: complications during pregnancy and childbirth are leading causes of death and disability among women of reproductive age in developing countries. Maternal mortality ratio (MMR) represents the risk associated with each pregnancy, i.e. the obstetric risk. It is also an MDG indicator for monitoring goal 5 of improving maternal health. Definition: number of maternal deaths per live births during a specified time period, usually one year. Methods of estimation: measuring maternal mortality accurately is difficult except where comprehensive registration of deaths and their causes exist. Else-where, censuses or surveys can be used to measure levels of maternal mortality. Data derived from health services records are problematic where not all births take place in health facilities because of biases whose dimensions and direction cannot be determined. Reproductive-age mortality studies (RAMOS) use triangulation of different sources of data on deaths of women of reproductive age including record review and/or verbal autopsy to accurately identify maternal deaths. Based on multiple sources of information, RAMOS are considered the best way to estimate levels of maternal mortality. Estimates derived from household surveys are usually based on information retrospectively collected about the deaths of sisters of the respondents and could refer back up to an average 12 years and they are subject to wide confidence intervals. For countries without any reliable data on maternal mortality, statistical models are applied. Global and regional estimates of maternal mortality are developed every five years, using a regression model. 8. Estimated rate of adults (15 years and older) dying of HIV/AIDS (per 1000) / Estimated rate of children below 15 years of age dying of HIV/AIDS (per 1000) Rationale for use: adult and children below 15 mortality rate are leading indicators of the level of impact of HIV/AIDS epidemic and impact of interventions specially scale up of treatment and prevention to mother to child transmission in countries. Definition: estimated mortality due to HIV/AIDS is the number of adults and children that have died in a specific year based in the modeling of HIV surveillance data using standard and appropriate tools. Methods of estimation: empirical data from different HIV surveillance sources are consolidated to obtain estimates of the level and trend in adults and children mortality by using standard methods and tools for HIV estimates appropriate to the level of HIV epidemic. However, to obtain the best possible estimates, judgement needs to be made on data quality and how representative it is of the population. UNAIDS/WHO produce country specific estimates every two years. 9. Tuberculosis mortality Rationale for use: prevalence and mortality are direct indicators of the burden of tuberculosis (TB), indicating the number of people suffering from the disease at a given point in time, and the number dying each year. Furthermore, prevalence and mortality respond quickly to improvements in control, as timely and effective treatment reduce the average duration of disease (thus decreasing prevalence) and the likelihood of dying from the disease (thus reducing diseasespecific mortality). Definition: estimated number of deaths due to TB in given time period. Expressed in this database as deaths per population per year. Includes deaths from all forms of TB, and deaths from TB in people with HIV. Methods of estimation: estimates of TB incidence, prevalence and mortality are based on a consultative and analytical process in WHO and are published annually. The methods used to estimate TB mortality rates are described in detail elsewhere. Country-specific estimates of TB mortality are, in most instances, derived from estimates of incidence, combined with assumptions about the case fatality rate. The case fatality rate is assumed to vary according to whether the disease is smearpositive or not; whether the individual receives treatment in a DOTS programme or non-dots programmes, or is not treated at all; and whether the individual is infected with HIV. 10. Years of life lost (percentage of total) Rationale for use: years of life are lost (YLL) take into account the age at which deaths occur by giving greater weight to deaths at younger age and lower weight to deaths at older age. The years of life lost (percentage of total) indicator measures the YLL due to a cause as a proportion of the total YLL lost in the population due to premature mortality. Definition: YLL are calculated from the number of deaths multiplied by a standard life expectancy at the age at which death occurs. The standard life expectancy used for YLL at each age is the same for deaths in all regions of the world and is the same as that used for the calculation of disability-adjusted-life years (DALY). Additionally 3% time discounting and non-uniform age weights which give less weight to years lived at young and older ages were used as for the DALY. With nonuniform age weights and 3% discounting, a death in infancy corresponds to 33 YLL, and deaths at ages 5 to 20 to around 36 YLL. 11. The disability-adjusted-life-year or DALY DALY is a health gap measure that extends the concept of potential years of life lost due to premature death (PYLL) to include equivalent years of healthy life lost by virtue of being in states of poor health or disability (1). DALYs for a disease or health condition are calculated as the sum of the years of life lost due to premature mortality (YLL) in the population and the years lost due to disability (YLD) for incident cases of the health condition. Methods of estimation: life tables specifying all-cause mortality rates by age and sex for 192 WHO Member States were developed for 2002 from available death registration data, sample registration systems (India, China) and data on child and adult mortality from censuses and surveys. Cause of death distributions were estimated from death registration data for 107 countries, together with data from population-based epidemiological studies, disease registers and notifications systems for selected specific causes of death. Causes of death for populations without useable death registration data were estimated using cause-of-death models together with data from population-based epidemiological studies, disease registers and notifications systems for 21 specific causes of death. 12. Causes of death among children under five years of age (percentage) Rationale for use: MDG4 consists in the reduction of under-five mortality by two-thirds in 2015, from its level in Child survival efforts can be effective only if they are based on reasonably accurate information about the causes of childhood deaths. Cause-of-death information is needed to prioritize interventions and plan for their delivery, to determine the effectiveness of disease-specific interventions, and to assess trends in disease burden in relation to national and international goals. Definition: the cause(s) of death (CoD) as entered on the medical certificate of cause of death in countries with civil (vital) registration system. The underlying CoD is being analysed. In countries with incomplete or no civil registration, causes of death are those reported as such in epidemiological studies that use verbal autopsy algorithms to establish CoD. Methods of estimation: CoD data from civil registration systems were evaluated for their completeness. Complete and nationally-representative data were then grouped by ICD codes into the cause categories and their proportions to total under-five deaths were then computed. For countries with incomplete data or no data, the distribution of deaths by cause was estimated in two steps. In the first step, a statistical model was used to assign deaths to one of three broad categories of causes: communicable diseases; noncommunicable diseases; or injuries and external causes. In a second step, cause-specific under-five mortality estimates from Child Health Epidemiology Reference Group (CHERG), WHO Technical Programmes, and the Joint United Nations Programme on HIV/AIDS (UNAIDS) were taken into account in assigning the distribution of deaths to specific causes. A variety of methods, including proportional mortality and natural history models, were used by CHERG and WHO to develop country-level cause-specific mortality estimates. All CHERG working groups developed comparable and standardized procedures to generate estimates from the databases.
59 13. HIV prevalence among the population aged years Rationale for use: HIV and AIDS has become a major public health problem in many countries and monitoring the course of the epidemic and impact of interventions is crucial. Both the Millenium Development Goals (MDG) and the United Nations General Assembly Special Session on HIV and AIDS (UNGAS) have set goals of reducing HIV prevalence. Definition: percent of people with HIV infection among all people aged years. Methods of estimation: HIV prevalence data from HIV sentinel surveillance systems, which may include national population surveys with HIV testing, are used to estimate HIV prevalence using standardized tools and methods of estimation developed by UNAIDS and WHO in collaboration with the UNAIDS Reference Group on Estimation, Modelling and Projections. Tools for estimating the level of HIV infection are different for generalized epidemics, and concentrated or low level epidemic. 14. Incidence of tuberculosis Rationale for use: incidence (cases arising in a given time period) gives an indication of the burden of tuberculosis (TB) in a population, and of the size of the task faced by a national TB control programme. Incidence can change as the result of changes in transmission (the rate at which people become infected with M. tuberculosis, the bacterium which causes TB), or changes in the rate at which people infected with M. tuberculosis develop TB disease (e.g. as a result of changes in nutritional status or of HIV infection). Because TB can develop in people who became infected many years previously, the effect of TB control on incidence is less immediate than the effect on prevalence or mortality. Millennium Development Goal 6, Target 8 is have halted by 2015 and begun to reverse the incidence of TB. WHO estimates that in 2004 the per capita incidence of TB was stable or falling in 5 out of 6 WHO regions, but growing globally at 0.6% per year. The exception was the, where incidence is apparently still increasing, but less rapidly each year. Implementation of the Stop TB Strategy, following the Global Plan to Stop TB , is expected to reverse the rise in incidence globally by Definition: estimated number of TB cases arising in a given time period (expressed as per capita rate). All forms of TB are included, as are cases in people with HIV. Methods of estimation: estimates of TB incidence, prevalence and mortality are based on a consultative and analytical process in WHO and are published annually. Estimates of incidence for each country are derived using one or more of four approaches, depending on the available data: 1. incidence = case notifications / proportion of cases detected 2. incidence = prevalence / duration of condition 3. incidence = annual risk of TB infection x Stýblo coefficient 4. incidence = deaths / proportion of incident cases that die. 15. Prevalence of tuberculosis Rationale for use: prevalence and mortality are direct indicators of the burden of tuberculosis (TB), indicating the number of people suffering from the disease at a given point in time, and the number dying each year. Furthermore, prevalence and mortality respond quickly to improvements in control, as timely and effective treatment reduce the average duration of disease (thus decreasing prevalence) and the likelihood of dying from the disease (thus reducing disease-specific mortality). Millennium Development Goal 6 is to combat HIV/AIDS, malaria and other diseases [including TB]. This goal is linked to Target 8 to have halted by 2015 and begun to reverse the incidence of malaria and other major diseases and MDG Indicator 24 prevalence and mortality rates associated with TB. The Stop TB Partnership has endorsed the related targets of reducing per capita TB prevalence and mortality by 50% relative to 1990, by the year There are few good data with which to establish TB prevalence and mortality, particularly for the baseline year of However, current best estimates suggest that implementation of the Global Plan to Stop TB will halve 1990 prevalence and mortality rates globally and in most regions by 2015, though not in Africa and eastern Europe. Definition: the number of cases of TB (all forms) in a population at a given point in time (sometimes referred to as point prevalence ) expressed in this database as number of cases per population. Methods of estimation: estimates of TB incidence, prevalence and mortality are based on a consultative and analytical process in WHO and are published annually. The methods used to estimate TB prevalence and mortality rates are described in detail elsewhere. Country-specific estimates of prevalence are, in most instances, derived from estimates of incidence [please link to incidence page of compendium], combined with assumptions about the duration of disease. The duration of disease is assumed to vary according to whether the disease is smear-positive or not; whether the individual receives treatment in a DOTS programme, non-dots programmes, or is not treated at all; and whether the individual is infected with HIV. 16. One-year-olds immunized with: one dose of measles (%) three doses of diphtheria, tetanus toxoid and pertussis (DTP3) (%) three doses of hepatitis B (HepB3 )(%) Rationale for use: immunization coverage estimates are used to monitor immunization services, to guide disease eradication and elimination efforts, and are a good indicator of health systems performance. Definition: measles immunization coverage is the percentage of one-year-olds who have received at least one dose of measles containing vaccine in a given year. For countries recommending the first dose of measles among children older than 12 months of age, the indicator is calculated as the proportion of children less than 24 months of age receiving one dose of measles containing vaccine. DTP3 immunization coverage is the percentage of one-year-olds who have received three doses of the combined diphtheria and tetanus toxoid and pertussis vaccine in a given year. HepB3 immunization coverage is the percentage of one-year-olds who have received three doses of Hepatitis B3 vaccine in a given year. Methods of estimation: WHO and UNICEF rely on reports from countries, household surveys and other sources such as research studies. Both organizations have developed common review process and estimation methodologies. Draft estimates are made, reviewed by country and external experts and then finalized. 17. Antenatal care coverage (%) Rationale for use: antenatal care coverage is an indicator of access and utilization of health care during pregnancy. Definition: percentage of women who utilized antenatal care provided by skilled health personnel for reasons related to pregnancy at least once during pregnancy as a percentage of live births in a given time period. Methods of estimation: empirical data from household surveys are used. At global level, facility data are not used. 18. Births attended by skilled health personnel (%) Rationale for use: all women should have access to skilled care during pregnancy and at delivery to ensure detection and management of complications. More-over, because it is difficult to measure accurately maternal mortality and model-based maternal mortality ratio (MMR) estimates cannot be used for monitoring short -term trends. The proportion of births attended by skilled health personnel is used as a proxy indicator for this purpose.
Lesotho. Factsheets of Health Statistics 2010
 Factsheets of Health Statistics 2010 Figure 1 : and neighboring countries Figure 2 : Population size (in thousands) in and neighboring countries, 2008 2,049 49,668 1,168 1. Health Status Life expectancy
Côte d Ivoire Factsheets of Health Statistics 2010
 Côte d Ivoire Factsheets of Health Statistics 2010 Figure 1 : Côte d Ivoire and neighboring countries Côte d Ivoire Figure 2 : Population size (in thousands) in Côte d Ivoire and neighboring countries,
Benin Factsheets of Health Statistics 2010
 Factsheets of Health Statistics 2010 Figure 1 : and neighboring countries Figure 2 : Population size (in thousands) in and neighboring countries, 2008 8,662 151,212 15,234 14,704 6,459 1. Health Status
Guinea-Bissau. Factsheets of Health Statistics 2010
 -Bissau Factsheets of Health Statistics 2010 Figure 1 : -Bissau and neighboring countries, 2008 -Bissau Figure 2 : Population size (in thousands) in -Bissau and neighboring countries, 2008 Bissau 1,575
Ethiopia. Factsheets of Health Statistics 2010
 Factsheets of Health Statistics 2010 Novembre 2010 Figure 1 : and neighboring countries Figure 2 : Population size (in thousands) in and neighboring countries, 2008 80,713 41,348 38,765 8,926 4,927 849
Congo. Factsheets of Health Statistics 2010
 Factsheets of Health Statistics 2010 Figure 1 : and neighboring countries Democratic Republic of the Figure 2 : Population size (in thousands) in and neighboring countries, 2008 3,615 Democratic Republic
Mozambique. Factsheets of Health Statistics 2010
 Factsheets of Health Statistics 2010 Novembre 2010 Figure 1 : and neighboring countries Figure 2 : Population size (in thousands) in and neighboring countries, 2008 22,383 49,668 42,484 14,846 12,620 12,463
Central African Republic. Factsheets of Health Statistics 2010
 Central African Republic Factsheets of Health Statistics 2010 Figure 1 : and neighboring countries Central African Republic Democratic Republic of the Figure 2 : Population size (in thousands) in and neighboring
Chad. Factsheets of Health Statistics 2010
 Factsheets of Health Statistics 2010 Figure 1 : and neighboring countries ia Figure 2 : Population size (in thousands) in and neighboring countries, 2008 10,914 ia 151,212 41,348 19,088 14,704 Central
Mauritius. Factsheets of Health Statistics 2010
 Factsheets of Health Statistics 2010 Figure 1 : and neighboring countries Figure 2 : Population size (in thousands) in and neighboring countries, 2008 1,280 19,111 661 84 1. Health Status Life expectancy
Liberia. Factsheets of Health Statistics 2010
 Factsheets of Health Statistics 2010 Figure 1 : and neighboring countries Côte d Ivoire Figure 2 : Population size (in thousands) in and neighboring countries, 2008 3,793 20,591 9,833 5,560 1. Health Status
Algeria. Factsheets of Health Statistics 2010
 Factsheets of Health Statistics 2010 Figure 1 : and neighboring countries Figure 2 : Population size (in thousands) in and neighboring countries, 2008 34,373 31,606 14,704 12,706 10,169 6,294 3,215 1.
Equatorial Guinea. Factsheets of Health Statistics 2010
 Factsheets of Health Statistics 2010 December 2010 Figure 1 : and neighboring countries Figure 2 : Population size (in thousands) in and neighboring countries, 2008 659 19,088 1,448 160 1. Health Status
Country Health System Fact Sheet 2006 Angola
 Population Total fertility rate (per woman) Adolescent fertility proportion Adult literacy rate Net primary school enrolment ratio Gross national income per capita Population living below the poverty line
WHO Library Cataloguing-in-Publication Data. World health statistics 2011.
 WORLD HEALTH STATISTICS 2011 WHO Library Cataloguing-in-Publication Data World health statistics 2011. 1.Health status indicators. 2.World health. 3.Health services - statistics. 4.Mortality. 5.Morbidity.
Millennium Development Goals
 Millennium Development s The Millennium Development s focus the efforts of the world community on achieving significant, measurable improvements in people's lives. They establish yardsticks for measuring
WHO Library Cataloguing-in-Publication Data. World health statistics 2015.
 WHO Library Cataloguing-in-Publication Data World health statistics 2015. 1.Health status indicators. 2.World health. 3.Health services - statistics. 4.Mortality. 5.Morbidity. 6.Life expectancy. 7.Demography.
At a glance: Nigeria. Statistics. 1 von 15 14/11/ :41. Basic Indicators
 At a glance: Nigeria Statistics Please note that the data for all countries is in the process of being updated. For the most recent data (including 2013 data), download the State of The World's Children
LAO PEOPLE'S DEMOCRATIC REPUBLIC
 COUNTRY HEALTH INFORMATION PROFILE LAO PEOPLE'S DEMOCRATIC REPUBLIC WESTERN PACIFIC REGION HEALTH BANK, 2011 Revision Demographics 1 Area (1 000 km2) 236.80 2009 1 2 Estimated population ('000s) 6128.00
PAPUA NEW GUINEA 330 COUNTRY HEALTH INFORMATION PROFILES. WESTERN PACIFIC REGION HEALTH DATABANK, 2011 Revision. Female. Total. Male.
 COUNTRY HEALTH INFORMATION PROFILE PAPUA NEW GUINEA WESTERN PACIFIC REGION HEALTH BANK, 2011 Revision Demographics 1 Area (1 000 km2) 462.84 2010 1 2 Estimated population ('000s) 6744.96 3478.10 3266.85
Accelerating progress towards the health-related Millennium Development Goals
 Accelerating progress towards the health-related Millennium Development Goals The critical role of the national health policy & strategy in strengthening health systems and delivering effective interventions
WESTERN PACIFIC REGION HEALTH DATABANK, 2011 Revision. Total Total. Number of new cases. Total
 COUNTRY HEALTH INFORMATION PROFILE WESTERN PACIFIC REGION HEALTH BANK, 2011 Revision Demographics 1 Area (1 000 km2) 299.76 1 2 Estimated population ('000s) 94 013.20 47 263.60 46 749.60 2010 est 2 3 Annual
WESTERN PACIFIC REGION HEALTH DATABANK, 2011 Revision. Total
 COUNTRY HEALTH INFORMATION PROFILE CHINA WESTERN PACIFIC REGION HEALTH BANK, 2011 Revision Demographics 1 Area (1 000 km2) 9600.00 2010 1 2 Estimated population ('000s) 1370537.00 686853.00 652872.00 2010
OUTCOME AND IMPACT LEVEL INTERVENTION LOGIC & INDICATORS HEALTH SECTOR WORKING PAPER: DRAFT - OCTOBER 2009
 EC EXTERNAL SERVICES EVALUATION UNIT OUTCOME AND IMPACT LEVEL INTERVENTION LOGIC & INDICATORS HEALTH SECTOR WORKING PAPER: DRAFT - OCTOBER 2009 This working paper outlines a set of indicators at the outcome
Why do we need SD goals on climate change, environment and health
 Why do we need SD goals on climate change, environment and health Roberto Bertollini, M.D, MPH Chief Scientist and WHO Representative to the EU World Health Organization Joint DEVE-ENVI public hearing
Countdown to 2015: tracking progress, fostering accountability
 Countdown to 2015: tracking progress, fostering accountability Countdown to 2015 is a global movement to track, stimulate and support country progress towards achieving the health-related Millennium Development
On the way to. the Millennium Development Goals
 On the way to the Millennium Development Goals 2015 Goal 1: Eradicate Extreme Poverty and Hunger 1.A: Halve, between 1990 and 2015, the proportion of people whose income is less than one dollar a day Proportion
Completion rate (upper secondary education, female)
") Annex C. Country profile indicators and data sources Indicator Data source Global database Demographics and contextual factors Demographics Total population Total under-5 population Total adolescent (10
Annex C. Country profile indicators and data sources Indicator Data source Global database Demographics and contextual factors Demographics Total population Total under-5 population Total adolescent (10
SUSTAINABLE DEVELOPMENT GOALS
 SUSTAINABLE DEVELOPMENT GOALS (SDGs) ETHIOPIA FACT SHEET JULY 2017 Federal Democratic Republic of Ethiopia Central Statistical Agency (CSA) Demographics Indicator Source Value Total population 2017 Projection
ustainable Development Goals
 26 April 2018 ustainable Development Goals Peter Okoth enya Pediatric Association Conference 3-27 April 2018 ombasa, Kenya UNICEF/UNI197921/Schermbrucker MDG Global Achievements: The Benefits of Global
Executive Board of the United Nations Development Programme, the United Nations Population Fund and the United Nations Office for Project Services
 United Nations Executive Board of the United Nations Development Programme, the United Nations Population Fund and the United Nations Office for Project Services Distr.: General 12 July 2011 Original:
Human Development Indices and Indicators: 2018 Statistical Update. Benin
 Human Development Indices and Indicators: 2018 Statistical Update Briefing note for countries on the 2018 Statistical Update Introduction Benin This briefing note is organized into ten sections. The first
Bangladesh Resource Mobilization and Sustainability in the HNP Sector
 Bangladesh Resource Mobilization and Sustainability in the HNP Sector Presented by Dr. Khandakar Mosharraf Hossain Minister for Health and Family Welfare Government of the People's Republic of Bangladesh
CHILDREN IN EGYPT A statistical digest
 CHILDREN IN EGYPT 2015 A statistical digest Statistics contained in this publication are those available to UNICEF Egypt up to June 2015 and refer to 2015 and/ or previous years. UNICEF encourages the
11 Indicators on Thai Health and the Sustainable Development Goals
 11 11 Indicators on Thai Health and the Sustainable Development Goals 11 Indicators on Thai Health and the Sustainable Development Goals The Post -2015 Development Agenda began upon completion of the monitoring
Balance Sheets 1. CHILD HEALTH... PAGE NUTRITION... PAGE WOMEN S HEALTH... PAGE WATER AND ENVIRONMENTAL SANITATION...
 Balance Sheets A summary of the goals, gains and unfinished business of the 1990-2000 decade as included in the Report of the Secretary-General, 'We the Children: End-decade review of the follow-up to
Achieving the health-related Millennium Development Goals in the Western Pacif ic Region
 Achieving the health-related Millennium Development Goals in the Western Pacif ic Region 2010 1 4 5 6 7 8 These Millennium Development Goals are a promise of world leaders. They re a blueprint to help
LAO PDR - PREVALENCE OF UNDERWEIGHT CHILDREN (UNDER FIVE YEARS OF AGE)
") LAO PDR 4. Prevalence of underweight children (under five years of age) Ministry of Public Health. Women and children in the Lao People s Democratic Republic. Results from the LAO social indicator survey
LAO PDR 4. Prevalence of underweight children (under five years of age) Ministry of Public Health. Women and children in the Lao People s Democratic Republic. Results from the LAO social indicator survey
Achieve universal primary education
 GOAL 2 Achieve universal primary education TARGET Ensure that, by 2015, children everywhere, boys and girls alike, will be able to complete a full course of primary schooling Considerable progress has
MONGOLIA - PREVALENCE OF UNDERWEIGHT CHILDREN (UNDER FIVE YEARS OF AGE)
") MONGOLIA 4. Prevalence of underweight children (under five years of age) Kachondham Y. Report of a consultancy on the Mongolian Child Nutrition Survey. Institute of Nutrition. Nakompathom, Thailand; 1992
MONGOLIA 4. Prevalence of underweight children (under five years of age) Kachondham Y. Report of a consultancy on the Mongolian Child Nutrition Survey. Institute of Nutrition. Nakompathom, Thailand; 1992
World Health Statistics Definition of Indicators
 World Health Statistics 2007 Definition of Indicators 1 Table of contents Health status: mortality...6 Life expectancy at birth (years)...6 Healthy life expectancy (HALE) at birth (years)...8 Probability
MYANMAR. Data source and type
 MYANMAR 4. Prevalence of underweight children (under five years of age) Acronym Daw Cho New Oo. Feeding Practices in young children and infants. Department of Medical Research, Rangoon, Myanmar, 1986 DoMR
Millennium Developmental Goals Indian Association of Preventive and Social Medicine Gujarat Chapter
 Module 1: Chapter 7 Millennium Developmental Goals Indian Association of Preventive and Social Medicine Gujarat Chapter Learning objectives: Millennium Development Goals 1. To understand MDG 2. To know
Disease Control Priorities. Presentation Sub-title Seventh International Rotavirus Symposium Lisbon June 12, 2006
 Disease Control Priorities and Rotavirus Presentation Vaccines Title Presentation Sub-title Seventh International Rotavirus Symposium Lisbon June 12, 2006 1 What is the DCPP? DCPP is an alliance of organizations
SPECIAL EVENT ON PHILANTHROPY AND THE GLOBAL PUBLIC HEALTH AGENDA. 23 February 2009, United Nations, New York Conference Room 2, 3:00 p.m. 6:00 p.m.
 SPECIAL EVENT ON PHILANTHROPY AND THE GLOBAL PUBLIC HEALTH AGENDA 23 February 2009, United Nations, New York Conference Room 2, 3:00 p.m. 6:00 p.m. ISSUES NOTE Improving the Health Outcomes of Women and
Executive Board of the United Nations Development Programme and of the United Nations Population Fund
 United Nations DP/FPA/CPD/CIV/6 Executive Board of the United Nations Development Programme and of the United Nations Population Fund Distr.: General 6 October 2008 Original: English UNITED NATIONS POPULATION
GLOBAL HEALTH SPESIALISERING IN. Austen Davis
 GLOBAL HEALTH SPESIALISERING IN SAMFUNNSMEDISIN 16.02.2016 Austen Davis SUSTAINABLE DEVELOPMENT GOALS THE POST 2015 AGENDA Where do we come from? 14 th C quarantine Tropical Health International Health
The Millennium Development Goals and Sri Lanka
 The Millennium Development Goals and Sri Lanka Abstract H.D. Pavithra Madushani 1 The Millennium Development Goals (MDGs) are targeted at eradicating extreme hunger and poverty in the 189 member countries
MATERNAL HEALTH IN AFRICA
 MATERNAL HEALTH IN AFRICA This Fact Sheet was prepared in January 2013 for the Summit of CARMMA (Campaign on Accelerated Reduction of Maternal, New Born and Child Mortality in Africa) in Addis Ababa Where
TB 2015 burden, challenges, response. Dr Mario RAVIGLIONE Director
 TB 2015 burden, challenges, response Dr Mario RAVIGLIONE Director Addis Ababa, Ethiopia 11-13 November 2015 Overview TB basics TB burden & challenges Response: End TB Strategy DAY 1 What is TB? Definition
Executive Board of the United Nations Development Programme, the United Nations Population Fund and the United Nations Office for Project Services
 United Nations Executive Board of the United Nations Development Programme, the United Nations Population Fund and the United Nations Office for Project Services Distr.: General 25 April 2014 Original:
Situational Analysis of Equity in Access to Quality Health Care for Women and Children in Vietnam
 Situational Analysis of Equity in Access to Quality Health Care for Women and Children in Vietnam Presentation by Sarah Bales and Jim Knowles Ha Long Bay, 8 April 2008 Organization of the Presentation
Part I. Health-related Millennium Development Goals
 11 1111111111111111111111111 111111111111111111111111111111 1111111111111111111111111 1111111111111111111111111111111 111111111111111111111111111111 1111111111111111111111111111111 213 Part I Health-related
What are the Millennium goals? There are 8 Millennium Development Goals (MDGs) which the UN set out to achieve by 2015:
 which the UN set out to achieve by 2015:") How successful was the UN in meeting their Millennium Development Goals for 2015? Hello everyone, the secretary generals for our upcoming MUN conference are myself, Joshua Fried, and Rachel Fox. We are
How successful was the UN in meeting their Millennium Development Goals for 2015? Hello everyone, the secretary generals for our upcoming MUN conference are myself, Joshua Fried, and Rachel Fox. We are
THAILAND THAILAND 207
 THAILAND 27 List of Country Indicators Selected Demographic Indicators Selected demographic indicators Child Mortality and Nutritional Status Trends in neonatal, infant and child mortality rates Distribution
Authors: Jennifer Kates (Kaiser Family Foundation), Eric Lief (The Stimson Center), Carlos Avila (UNAIDS).
, Eric Lief (The Stimson Center), Carlos Avila (UNAIDS).") Financing the response to AIDS in low- and middleincome countries: International assistance from the G8, European Commission and other donor Governments in 2008 Authors: Jennifer Kates (Kaiser Family Foundation),
Financing the response to AIDS in low- and middleincome countries: International assistance from the G8, European Commission and other donor Governments in 2008 Authors: Jennifer Kates (Kaiser Family Foundation),
2004 Update. Luxembourg
 2004 Update Luxembourg 2 Luxembourg HIV/AIDS estimates In 2003 and during the first quarter of 2004, UNAIDS and WHO worked closely with national governments and research institutions to recalculate current
Monitoring the achievement of the health-related Millennium Development Goals
 SIXTY-SIXTH WORLD HEALTH ASSEMBLY A66/13 Provisional agenda item 14.1 14 May 2013 Monitoring the achievement of the health-related Millennium Development Goals Report by the Secretariat 1. In response
Ending preventable maternal and child mortality
 REGIONAL COMMITTEE Provisional Agenda item 9.3 Sixty-ninth Session SEA/RC69/11 Colombo, Sri Lanka 5 9 September 2016 22 July 2016 Ending preventable maternal and child mortality There has been a significant
The Unfinished Agenda in Global Health. Richard Skolnik
 The Unfinished Agenda in Global Health Richard Skolnik Objectives Objectives: What do poor people in poor countries get sick and die from? What are the risk factors for this burden of disease? What can
ZIMBABWE: Humanitarian & Development Indicators - Trends (As of 20 June 2012)
") ZIMBABWE: Humanitarian & Development Indicators - Trends (As of 20 June Indicators Sub-Saharan Africa DEMOGRAPHY Population (million 842 (2012, UNDP Africa HDR) Zimbabwe Current Value (Data Date, Source)
ZIMBABWE: Humanitarian & Development Indicators - Trends (As of 20 June Indicators Sub-Saharan Africa DEMOGRAPHY Population (million 842 (2012, UNDP Africa HDR) Zimbabwe Current Value (Data Date, Source)
8 millenium development goals. illustrated by joséphine moser
 8 millenium development goals illustrated by joséphine moser To all those who can t read this. The information used in this book is taken from the millennium development goals report 2008 by the United
Executive Board of the United Nations Development Programme, the United Nations Population Fund and the United Nations Office for Project Services
 United Nations DP/FPA/CPD/NGA/7 Executive Board of the United Nations Development Programme, the United Nations Population Fund and the United Nations Office for Project Services Distr.: General 18 July2013
Executive Board of the United Nations Development Programme, the United Nations Population Fund and the United Nations Office for Project Services
 United Nations Executive Board of the United Nations Development Programme, the United Nations Population Fund and the United Nations Office for Project Services Distr.: General 29 September 2011 Original:
Equatorial Guinea. Epidemiological Fact Sheet on HIV and AIDS Update. July 2008 / Version 0.1 beta. Core data on epidemiology and response
 Epidemiological Fact Sheet on HIV and AIDS Core data on epidemiology and response Equatorial Guinea 2008 Update July 2008 / Version 0.1 beta 29/07/08 1 (WHO/Second Generation Surveillance on HIV/AIDS,
2004 Update. Seychelles
 2004 Update Seychelles 2 Seychelles HIV/AIDS estimates In 2003 and during the first quarter of 2004, UNAIDS and WHO worked closely with national governments and research institutions to recalculate current
The Millennium Development Goals. A Snapshot. Prepared by DESA based on its annual Millennium Development Goals Report
 The Millennium Development Goals A Snapshot Prepared by DESA based on its annual Millennium Development Goals Report New York, March 2010 Eradicate extreme poverty and hunger Halve the proportion of people
Executive Board of the United Nations Development Programme and of the United Nations Population Fund
 United Nations DP/FPA/CPD/TGO/5 Executive Board of the United Nations Development Programme and of the United Nations Population Fund Distr.: General 12 October 2007 Original: English UNITED NATIONS POPULATION
Integrating family planning and maternal health into poverty alleviation strategies
 08_XXX_MM1 08_XXX_MM2 Integrating family planning and maternal health into poverty alleviation strategies Dr Michael Mbizvo Director a.i., Department of Reproductive Health and Research (RHR) World Health
WHO analysis of causes of maternal death: a proposed protocol for a global systematic review
 WHO analysis of causes of maternal death: a proposed protocol for a global systematic review R. Champaneria 1, J. Daniels 1,2, K.S. Khan 1, L. Say 3, A.M. Gulmezoglu 3, S. Cousens 4, A.J.Howman 2 1 Academic
NIGERIA SUMMARY REPORT. Multiple Indicator Cluster Survey Monitoring the situation of children and women
 NIGERIA Monitoring the situation of children and women Multiple Indicator Cluster Survey 2011 SUMMARY REPORT Federal Republic of Nigeria National Bureau of Statistics United Nations Population Fund United
Monitoring the Health-Related Sustainable Development Goals (SDGs)
") Background paper for the regional technical consultation on: Monitoring the Health-Related Sustainable Development Goals (SDGs) 9 10 February 2017, SEARO, New Delhi, India Introduction to the Sustainable
Background paper for the regional technical consultation on: Monitoring the Health-Related Sustainable Development Goals (SDGs) 9 10 February 2017, SEARO, New Delhi, India Introduction to the Sustainable
The Sustainable Development Goals: The implications for health post Ties Boerma, Director of Information, Evidence and Research, WHO, Geneva
 The Sustainable Development Goals: The implications for health post-2015 Ties Boerma, Director of Information, Evidence and Research, WHO, Geneva Outline SDGs: general process and features 2030 Agenda:
Epidemiological Fact Sheet on HIV and AIDS. Core data on epidemiology and response. Costa Rica Update. July 2008 / Version 0.
 Epidemiological Fact Sheet on HIV and AIDS Core data on epidemiology and response Costa Rica 2008 Update July 2008 / Version 0.1 beta 29/07/08 1 (WHO/Second Generation Surveillance on HIV/AIDS, Contract
XV. THE ICPD AND MDGS: CLOSE LINKAGES. United Nations Population Fund (UNFPA)
") XV. THE ICPD AND MDGS: CLOSE LINKAGES United Nations Population Fund (UNFPA) A. INTRODUCTION A global consensus emerged at the Millennium Summit, where 189 world leaders adopted the Millennium Declaration
XV. THE ICPD AND MDGS: CLOSE LINKAGES United Nations Population Fund (UNFPA) A. INTRODUCTION A global consensus emerged at the Millennium Summit, where 189 world leaders adopted the Millennium Declaration
HEALTH. Sexual and Reproductive Health (SRH)
") HEALTH The changes in global population health over the last two decades are striking in two ways in the dramatic aggregate shifts in the composition of the global health burden towards non-communicable
HEALTH The changes in global population health over the last two decades are striking in two ways in the dramatic aggregate shifts in the composition of the global health burden towards non-communicable
Progress has been made with respect to health conditions.
 health Strong performers in reducing child mortality 199-2 Niger Guinea-Bissau Guinea Ethiopia Benin 2 199 Strong performers in reducing maternal mortality 199-2 Djibouti Madagascar Eritrea Comoros Somalia
THE GLOBAL STRATEGY FOR WOMEN S, CHILDREN S AND ADOLESCENTS HEALTH ( )
") THE GLOBAL STRATEGY FOR WOMEN S, CHILDREN S AND ADOLESCENTS HEALTH (2016-2030) SURVIVE THRIVE TRANSFORM AT A GLANCE SURVIVE THRIVE TRANSFORM The Global Strategy for Women s, Children s and Adolescents
THE GLOBAL STRATEGY FOR WOMEN S, CHILDREN S AND ADOLESCENTS HEALTH (2016-2030) SURVIVE THRIVE TRANSFORM AT A GLANCE SURVIVE THRIVE TRANSFORM The Global Strategy for Women s, Children s and Adolescents
PROVIDING EMERGENCY OBSTETRIC AND NEWBORN CARE
 URGENT RESPONSE: PROVIDING EMERGENCY OBSTETRIC AND NEWBORN CARE Updated with technical feedback December 2012 Introduction Women everywhere face a risk in giving birth. Worldwide, about 15 per cent of
Priorities for achieving Millennium Development Goals (MDGs) 4 and 5 in the European Region
 4 and 5 in the European Region") Priorities for achieving Millennium Development Goals (MDGs) 4 and 5 in the European Region Zsuzsanna Jakab WHO Regional Director for Europe A big challenge Globally every year 7.6 million children die
Priorities for achieving Millennium Development Goals (MDGs) 4 and 5 in the European Region Zsuzsanna Jakab WHO Regional Director for Europe A big challenge Globally every year 7.6 million children die
PROJECT INFORMATION DOCUMENT (PID) APPRAISAL STAGE Report No.: PIDA Project Name. Region. Country. Sector(s) Health (100%) Theme(s)
 APPRAISAL STAGE Report No.: PIDA Project Name. Region. Country. Sector(s) Health (100%) Theme(s)") Public Disclosure Authorized Public Disclosure Authorized Public Disclosure Authorized Public Disclosure Authorized PROJECT INFORMATION DOCUMENT (PID) APPRAISAL STAGE Report No.: PIDA62480 Project Name
Public Disclosure Authorized Public Disclosure Authorized Public Disclosure Authorized Public Disclosure Authorized PROJECT INFORMATION DOCUMENT (PID) APPRAISAL STAGE Report No.: PIDA62480 Project Name
NIGERIA DEMOGRAPHIC AND HEALTH SURVEY. National Population Commission Federal Republic of Nigeria Abuja, Nigeria
 NIGERIA DEMOGRAPHIC AND HEALTH SURVEY 2013 National Population Commission Federal Republic of Nigeria Abuja, Nigeria ICF International Rockville, Maryland, USA June 2014 USAID FROM THE AMERICAN PEOPLE
Executive Board of the United Nations Development Programme, the United Nations Population Fund and the United Nations Office for Project Services
 United Nations Executive Board of the United Nations Development Programme, the United Nations Population Fund and the United Nations Office for Project Services Distr.: General 12 July 2011 Original:
2004 Update. Serbia and Montenegro
 2004 Update Serbia and Montenegro 2 Serbia and Montenegro HIV/AIDS estimates In 2003 and during the first quarter of 2004, UNAIDS and WHO worked closely with national governments and research institutions
Adult rate (%) 0.1 Low estimate. 0.0 High estimate 0.2
 0.1 Low estimate. 0.0 High estimate 0.2") 2004 Update Fiji 2 Fiji HIV/AIDS estimates In 2003 and during the first quarter of 2004, UNAIDS and WHO worked closely with national governments and research institutions to recalculate current estimates
2004 Update Fiji 2 Fiji HIV/AIDS estimates In 2003 and during the first quarter of 2004, UNAIDS and WHO worked closely with national governments and research institutions to recalculate current estimates
Background. Proposed to develop a framework for action. Address by Foreign Minister Koumura
 July 2008 Ministry of Foreign Affairs of Japan Background Address by Foreign Minister Koumura Global Health and Japan s Foreign Policy From Okinawa to Toyako (25 November 2007) Special Address by Prime
Inter Regional MDG Indicators Meeting Sharing Knowledge to Improve MDG Monitoring & Reporting Chile, 2012 May
 Experience of Bahrain in & Reporting MDGs Indicators Inter Regional MDG Indicators Meeting Sharing Knowledge to Improve MDG & Reporting Chile, 2012 May Coordination &Mechanism Kingdom of Bahrain Constitutional
Financing for Family Planning: Options and Challenges
 Repositioning Family Planning and Reproductive Health in the region. Financing for Family Planning: Options and Challenges BASINGA Paulin, MD,MSc, PhD Senior Lecturer School of Public Health National University
Executive Board of the United Nations Development Programme and of the United Nations Population Fund
 United Nations DP/FPA/CPD/ALB/2 Executive Board of the United Nations Development Programme and of the United Nations Population Fund Distr.: General 11 October 2005 Original: English UNITED NATIONS POPULATION
Monitoring of the achievement of the health-related Millennium Development Goals
 SIXTY-THIRD WORLD HEALTH ASSEMBLY WHA63.15 Agenda item 11.4 21 May 2010 Monitoring of the achievement of the health-related Millennium Development Goals The Sixty-third World Health Assembly, Having considered
2.1 Communicable and noncommunicable diseases, health risk factors and transition
 1. CONTEXT 1.1 Demographics The Futuna and Wallis Islands are located in the Oceania Islands in the South Pacific Ocean, about twothirds of the way from Hawaii to New Zealand. The total area is 142 square
The Millennium Development Goals Report. asdf. Gender Chart UNITED NATIONS. Photo: Quoc Nguyen/ UNDP Picture This
 The Millennium Development Goals Report Gender Chart asdf UNITED NATIONS Photo: Quoc Nguyen/ UNDP Picture This Goal Eradicate extreme poverty and hunger Women in sub- are more likely than men to live in
Executive Board of the United Nations Development Programme, the United Nations Population Fund and the United Nations Office for Project Services
 United Nations Executive Board of the United Nations Development Programme, the United Nations Population Fund and the United Nations Office for Project Services Distr.: General 15 April 2011 Original:
Good Health & Well-Being. By Alexandra Russo
 Good Health & Well-Being By Alexandra Russo SDG 3 Goal 3 aims to ensure healthy living and promote well-being for all at all ages There are 9 targets associated with SDG 3 The targets encompass a wide
Global health sector strategies on HIV, viral hepatitis and sexually transmitted infections ( )
") Regional Committee for Europe 65th session EUR/RC65/Inf.Doc./3 Vilnius, Lithuania, 14 17 September 2015 2 September 2015 150680 Provisional agenda item 3 ORIGINAL: ENGLISH Global health sector strategies
Regional Committee for Europe 65th session EUR/RC65/Inf.Doc./3 Vilnius, Lithuania, 14 17 September 2015 2 September 2015 150680 Provisional agenda item 3 ORIGINAL: ENGLISH Global health sector strategies
Authors: Jennifer Kates (Kaiser Family Foundation), José-Antonio Izazola (UNAIDS), Eric Lief (CSIS).
, José-Antonio Izazola (UNAIDS), Eric Lief (CSIS).") Financing the response to AIDS in low- and middleincome countries: International assistance from the G8, European Commission and other donor Governments, 2006 Authors: Jennifer Kates (Kaiser Family Foundation),
Financing the response to AIDS in low- and middleincome countries: International assistance from the G8, European Commission and other donor Governments, 2006 Authors: Jennifer Kates (Kaiser Family Foundation),
CONTRACEPTIVES SAVE LIVES
 CONTRACEPTIVES SAVE LIVES Updated with technical feedback December 2012 Introduction In the developing world, particularly in Sub-Saharan Africa and South Asia, progress in reducing maternal and newborn
ANNEX 1 Healthy Islands monitoring framework
 ANNEX 1 Healthy Islands monitoring framework For Pacific Health Ministers Review (Version as of 24 July 2017) Principles Agreed principles of the framework included: a strong link to the Sustainable Development
UNICEF Strategic Plan,
 UNICEF Strategic Plan, 2018-2021 Orientation, October 2017 The Executive Board decision The UNICEF Executive Board Endorses the UNICEF Strategic Plan, 2018-2021 as contained in document E/ICEF/2017/17/Rev.1
United States. HDI values and rank changes in the 2013 Human Development Report
 Human Development Report 2013 The Rise of the South: Human Progress in a Diverse World Explanatory note on 2013 HDR composite indices United States HDI values and rank changes in the 2013 Human Development