UNIVERSITAT DE BARCELONA IMMUNE PROFILING OF OPERATIONAL TOLERANCE IN LIVER TRANSPLANTATION
|
|
|
- Susanna Moody
- 5 years ago
- Views:
Transcription
1 UNIVERSITAT DE BARCELONA Faculty of Medicine IMMUNE PROFILING OF OPERATIONAL TOLERANCE IN LIVER TRANSPLANTATION Thesis presented by Marc Martínez Llordella to obtain the degree of Doctor in Biology This work was realized under supervision of Dr. Alberto Sánchez Fueyo, at the Liver Transplant Unit, Hospital Clínic de Barcelona, IDIBAPS Marc Martínez Llordella Dr. Alberto Sánchez Fueyo Director The thesis is registered in the doctoral program of Cell Biology and Pathology at the Cell Biology, Immunology and Neurosciences Department Faculty of Medicine,
2
3 TABLE OF CONTENTS TABLE OF CONTENTS TABLE OF CONTENTS... II ABBREVIATIONS...VI I.- INTRODUCTION... 1 II.- STATE OF THE ART THE ALLOIMMUNE RESPONSE The innate and adaptive immune system Innate immune responses Adaptive immune responses Antigen presentation T Cell Receptor Complex Major Histocompatibility Complex T cell selection Co-stimulatory pathways The alloimmune response Graft allorecognition Direct allorecognition Indirect allorecognition The rejection response Hyperacute rejection Acute rejection Chronic rejection Graft survival and acceptance Pharmacological immunosuppression Mechanisms of action of immunosuppressive drugs Side effects of immunosuppressive drugs New strategies of immunosuppression I
4 TABLE OF CONTENTS 2.- TRANSPLANTATION TOLERANCE Basic concepts in transplantation tolerance Mechanisms of transplantation tolerance Clonal deletion Clonal anergy Clonal exhaustion Immunoregulation CD4 + CD25 + regulatory T cells Natural CD4 + CD25 + regulatory T cells Adaptive CD4+CD25+ regulatory T cells NK cells NKT cells T cells Dendritic Cells Other regulatory T-cell subsets Allograft tolerance induction Mechanisms of tolerance induction Central tolerance and donor cell chimerism Peripheral tolerance Cell deletion Co-stimulation blockade Targeting leukocyte trafficking Therapeutic infusion of Tregs Challenges of applying tolerance induction strategies to the clinic Translational research obstacles Difficulties with the infusion of regulatory cells in the clinic Viral infection and memory immune responses Ethical conflicts THE LIVER IMMUNE SYSTEM The liver immune response Liver physiology...48 II
5 TABLE OF CONTENTS Liver immune cells Innate immunity in the liver Hepatic APCs Adaptive immunity in the liver T cell priming Hepatic immune tolerance Liver transplantation tolerance Tolerance induced by donor passenger leukocytes Tolerance induced by liver tissue Tolerance induced by regulatory cells Immune evasion in hepatic infections MONITORING OF ALLOGENIC IMMUNERESPONSES Monitoring assays in transplantation Immune monitoring assays Antigen specific assays Mixed lymphocyte reaction Enzyme-linked immunospot Trans vivo DTH Direct antigen detection Antigen non-specific assays Polyclonal T cell response TCR repertoire characterization Flow cytometric phenotyping Gene expression analysis Gene polymorphisms and proteomics Immune characterization of operationally tolerant graft recipients Development of genomic biomarkers Design of the study Internal validation Assay reproducibility and platform translation Independent validation Functional analysis of genomic biomarkers III
6 TABLE OF CONTENTS III.- GOALS OF OUR STUDIES...79 IV.- RESULTS AND DISCUSSION...83 ARTICLE Multiparameter immune profiling of operational tolerance in liver transplantation...84 DISCUSSION...96 ARTICLE Using transcriptional profiling to develop a diagnostic test of operational tolerance in liver transplant recipients DISCUSSION V.- CONCLUSIONS AND FUTURE ASPECTS CONCLUSIONS PRESPECTIVES AND RELEVANCE VI.- BIBLIOGRAPHY IV
7 ABBREVIATIONS ABBREVIATIONS AP1 Activator protein 1 APC AZA CDR CFSE CNI CTL Antigen presenting cell Azathioprine Complementarity determining region Carboxyfluorescein succinimidyl ester Calcineurin inhibitor Cytotoxic T lymphocyte CTLA-4 Cytotoxic T lymphocyte-associated antigen 4 CyA DC DTH EAE ELISA ELISPOT FOXP3 GITR GMP GVHD HAV HBV HCV HIV Cyclosporine A Dendritic cell Delayed-type hypersensitivity Experimental autoimmune encephalomyelitis Enzyme Linked Inmunoabsorvent Assay Enzyme-linked immunospot Forkhead box P3 Glucocorticoid induced tumor necrosis factor receptor Good manufacturing practice Graft-versus-host disease Hepatitis A virus Hepatitis B virus Hepatitis C virus Human immunodeficiency virus V
8 ABBREVIATIONS HLA HO HSC IDO IFN Ig IL Human leukocyte antigen Haemoxygenase Hepatic stellate cell Indoleamine 2,3-dioxygenase Interferon Immunoglobulin Interleukin ILT3 Immunoglobulin-like transcript 3 inkt Invariant natural killer T IRF-3 Interferon regulatory factor 3 ITAM JNK KIR LDA LDT LOOCV LPS LSEC mdc MHC MICA MICB MLR MMF Immunoreceptor tyrosine-based activation motif JUN N-terminal kinase Killer cell immunoglobulin-like receptor Limiting dilution assay Living donor transplantation Leave-one-out cross validation Lipopolysaccharide Liver sinusoidal endothelial cells Myeloid DC Major histocompatibility complex MHC class I-related chain A MHC class I-related chain B Mixed lymphocyte reaction Mycophenolate mofetil VI
9 ABBREVIATIONS MPA NFAT NF-kB NK NKT NO NOD OKT3 PBMC PD-1 pdc PRR RIG-I RT-PCR S1P TcLand TCR TGF- Th TLR TNF Tr1 Treg Mycophenolic acid Nuclear factor of activated T cell Nuclear factor-kb Natural killer Natural killer T Nitric oxide Nucleotide-binding oligomerization domain Muromonab-CD3 Peripheral blood mononuclear cell Programmed death-1 Plasmacytoid DC Pattern recognition receptor Retinoid acid inducible protein-i Real time PCR Sphingosine-1-phosphate T cell receptor landscape T cell receptor Transforming growth factor- T helper Toll-like receptor Tumor necrosis factor Type 1 regulatory T cell T regulatory TSDR VII
10 INTRODUCTION INTRODUCTION 1
11 INTRODUCTION In many clinical circumstances transplantation is currently the treatment of choice to prolong life by the replacement of damaged or non-functional organs and tissues. This procedure, which nowadays is almost routine clinical practice in developed countries, has been made possible by remarkable progresses in surgical, immunological and medical research that have taken place over the last century. Given that almost all aspects of the immune system are disturbed by the performance of allogeneic organ transplantation, the clinical development of this field has been instrumental in the advancement of our understanding of the fundamental rules of the immune system. The first modern studies in the field of organ transplantation took place at the beginning of the 20th century in animal models. In 1912 Alexis Carrel was awarded with the Nobel Prize in Medicine for his demonstration that renal autografts in dogs survived indefinitely while renal allografts rapidly ceased to function [1, 2]. This pioneering work led to the concept of histocompatibility, which refers to the fact that even within a same species there are polymorphic tissue antigens (alloantigens) that are targeted by the immune system and lead to graft rejection. Subsequent experiments contributed to the unraveling of other fundamental immunological concepts such as immunological memory (originally described in skin transplant models [3]) and the major histocompatibility complex (MHC), called human leukocyte antigen (HLA) in humans [4]. Furthermore, the discovery of the phenomenon of neonatal tolerance demonstrated that it was possible to prevent immune responses to alloantigens and to induce acceptance of the graft in the absence of immunosuppression [5]. Later on, the precise identification of the separate roles of T and B lymphocytes in cellular and humoral immunity emerged [6]. In clinical kidney transplantation, the first immunosuppressive strategy employed to circumvent rejection was total body irradiation. This resulted in ineffective protection and 2
12 INTRODUCTION only sibling graft transplantation was occasionally successful. Although graft and patient outcomes slightly improved after the implementation of novel strategies to select graft donors based on MHC-similarities with the recipient, the most important clinical advances took place after the introduction of chemical immunosuppressive therapies. The first regimen, employed in living non-related kidney transplantation in the early 1960s was the combination of 6- mercaptopurine with intermittent doses of corticosteroids. This treatment (with the subsequent substitution of 6-mercaptopurine by a less toxic derivate, azathioprine) became the standard regimen for renal transplantation, and allowed the performance of the first successful liver and lung transplantations conducted between unrelated donor-recipient pairs, which took place in 1966 and 1967 respectively. The drug that had the most important impact in clinical transplantation and revolutioned immunosuppressive therapy was however cyclosporine A, an antifungal antibiotic isolated from the fungus Tolypocladium inflatum and found to have remarkable immunosuppressive properties in the early 1970s. Later on, additional highly effective drugs such as tacrolimus and the monoclonal antibody muromonab-cd3 were also introduced in the clinic. The availability of these drugs, together with the advances in surgical technique and the donor selection parameters, spectacularly increased the short-term survival of transplanted grafts, and contributed to the remarkable popularization of organ transplantation that took place in the 1980s all over the world. Although the immunological research emerged during the last decades proved to be extremely successful at reducing the risk of acute rejection and expanding transplantation as a reliable medical practice in many countries, several challenges remain to be solved before transplantation can be considered as the ultimate treatment for organ failure. Principally, the unspecific activity of the immunosuppressive drugs used to disable the recipient immune system results in increased risk of infections and malignancies, and also provokes substantial 3
13 INTRODUCTION morbidity and mortality in the form side effects such as hypertension, diabetes or renal failure. Furthermore, many transplanted organs suffer a chronic damage that eventually causes graft loss and that it is not prevented by current immunosuppressive drugs. Current research in transplantation immunology is focused on finding solutions to these difficulties. The employment of basic immunologic knowledge from preceding immunological studies together with the recent revolution in molecular biology, represent a new source of information about how the immune system works. In this recent evolution, the use of animal models is playing an essential role. The emergence of transgenic and knockout mice helped to uncover the immunological mechanisms of transplantation, to identify the cells participating in alloantigen recognition, and to elucidate the molecular and cellular pathways involved in the different stages of rejection. A more accurate understanding of the alloimmune response will provide a new source of targets to focus subsequent studies to make organ transplantation a more effective procedure. Among these fronts emerges a new pool of immunosuppressive agents involving higher specificity and fewer side effects. Ultimately, the major aim of transplant immunologists is to achieve the indefinite acceptance of the graft without immunosuppression and with maintenance of normal activity of the immune system against the remaining foreign antigens not expressed by the allograft. This concept, known as allograft tolerance, has been widely described in animal models. Its clinical application is considered as a highly desirable goal since it could not only improve patient survival and quality of life, but also reduce costs and indirectly decrease organ demand by prolonging graft survival. In most clinical transplantation settings, however, this phenomenon has been observed only anecdotically. Liver transplantation is an exception though, since it can spontaneously develop approximately 20% of liver recipients who can successfully discontinue all immunosuppressive drugs. This unique immunologic property of 4
14 INTRODUCTION liver grafts result in liver transplantation being currently considered as probably the best clinical model to study the mechanisms of allograft tolerance in humans. This could bring insights into the mechanisms responsible allospecific organ acceptation. In addition, immune monitoring of tolerant liver recipients could also provide an immune profiling of tolerance and create a predictive assay of tolerance. This footprint of tolerance would allow the identification of patients with high probability of successful drug withdrawal and would also facilitate the efficacy assessment of novel tolerance-inducing strategies. 5
15 STATE OF THE ART STATE OF THE ART 6
16 STATE OF THE ART THE ALLOIMMUNE RESPONSE 1.- THE ALLOIMMUNE RESPONSE 7
17 THE ALLOIMMUNE RESPONSE STATE OF THE ART The innate and adaptive immune system The immune system has developed a highly specialized and tightly regulated series of mechanisms that evolved with the aim of detecting and responding to different sources of danger. These aggressions can be external like bacterial and viral infection or an internal damage like malignancy cell growing. The recognition of these menaces, traditionally described as the capacity to discriminate between self and non-self, involves two different but linked responses, the non-specific and the specific immune response mediated by the innate and the adaptive immune system, respectively. Organ or tissue transplantation represents an important introduction of non-self antigens graft into the recipient. Recognition of donor antigens by the recipient immune system elicits a cascade of events similar to that occurring in response to a foreign invader that if it is left unchecked results in graft rejection. Historically, the field of transplant immunology essentially focused on targeting the mechanisms of adaptive immunity, based on the observation that T cells are both necessary and sufficient for rejection of allogeneic organs. However, recent advances in our understanding of how the immune response is influenced by a variety of antigen non-specific factors, have highlighted the participation of the innate immune system in solid organ transplantation and its critical role in shaping adaptive immune responses Innate immune responses The innate immune system comprises the cells and mechanisms that recognize and provide immediate defense against aggressions such as pathogenic infectious agents in a non-specific manner. This first-line sentinel function is accomplished through genetically non-rearranged receptors that are referred to as pattern recognition receptors (PRRs). These receptors not only 8
18 STATE OF THE ART THE ALLOIMMUNE RESPONSE discriminate infectious non-self from self by detecting conserved pathogen-derived molecules, but they also sense the presence of host-derived molecules that are released from damaged or stressed tissues [7]. Transplantation causes an ischemic damage and a surgical trauma in the graft that liberate endogenous molecules capable of activating PRRs. Therefore, the innate system contributes in the early immune activation in absence of antigen specific recognition [8]. Toll-like receptors (TLRs) are a family of PRRs that are expressed on the surface of various cells populations including macrophages, dendritic cells (DCs), and natural killer (NK) cells. TLRs have been shown to initiate an up-regulation of proinflammatory mediators in the allograft before the T cell response [9]. This cascade of accessory signals, including the activation of the complement, secretion of cytokines, chemokines and other co-stimulatory molecules, is necessary for the activation and modulation of adaptive immune response [10]. Macrophages and DCs are specialized antigen presenting cells (APCs) that play a crucial role in initiating the immune responses. APCs are highly efficient at capturing antigen through phagocytosis and processing them into peptide fragments that are specifically presented by MHC class I or class II molecules to T cells. Antigen recognition entails a co-stimulatory molecules presentation and a secretion of proinflammatory cytokines to modulate the response. NK cells have been shown to supply an early source of IFN- to initiate T cell priming after allogenic recognition. Further, they are also capable of lysing a variety of non-self, viralinfected and tumor cells by providing potent cytotoxic activity through expression of perforin, granzymes, and Fas-ligand. The capacity to kill many cell types without prior antigen activation is inactivated if the target cell MHC class I molecules is recognized as self-antigen 9
19 THE ALLOIMMUNE RESPONSE STATE OF THE ART by killer cell immunoglobulin-like receptors (KIRs) on NK cells, which inhibit signals from activating receptors. Natural killer T (NKT) cells are a heterogeneous group of T cells that share properties of both NK and T cells. These cells co-express a variety of molecular markers that are typically associated with NK cells together with a T cell receptor (TCR) expression. However, in invariant NKT (inkt) cells subset, their TCRs repertoire differ from conventional T cells in that they have less diversity and recognize lipids and glycolipids presented by a member of the CD1 family of antigen presenting molecules [11]. NKT cells are able to generate large quantities of IFN- and other cytokines and chemokines, such as IL-2 and TNF-, in addition to the cytotoxic activity mediated by granzyme production. γδ T cells are preferentially located in epithelia of various organs playing a role in their infection defense. In addition, it has been proposed that their different subsets bridge innate and adaptive immune response [12]. On one hand, γδ T cells undergo somatic gene rearrangement to generate highly diverse TCRs genes. Thus, they have been shown another adaptive immunity feature acting as professional APCs by processing complex protein and presenting them such antigens to conventional T cells [13]. On the other hand, γδ T cell subsets may also be considered part of the innate immune system. They use restricted TCRs or TLR ligands as PRRs in infection reactivity and tumor defense promoting IFN-, TNF- and cytokines release. Besides, the reactivity pattern of T cells is modulated through the activation and inhibition of several NK receptors Adaptive immune responses The adaptive immune system is composed of highly specialized cells and processes that recognize and eliminate non-self antigens in an extremely specific manner. In addition, the 10
20 STATE OF THE ART THE ALLOIMMUNE RESPONSE adaptive immunity, in contrast to the innate immune response, is initially delayed in time, but provides long-lasting protective immunity through the ability to create an antigen specific memory that produce a stronger and faster immune response each time the antigen is encountered. The adaptive response is mediated by two different but related mechanisms: humoral and cellular immune responses. Humoral immunity is based on antibody production by the B lymphocytes and on the accessory processes that accompany this immune activity. Some of them involve an innate system control, as the classical complement activation and opsonin promotion of phagocytosis elimination. But also, it could modulate the adaptive immune response by T helper activation and cytokine production. T lymphocytes are the central elements of cellular immunity, which plays a crucial role in the adaptive response against foreign antigens. Naïve T cells are specifically activated when the TCR strongly interacts with a non-self peptide-bound MHC. The two principle T cell populations are classified based on reciprocal expression of either the CD4 or CD8 glycoproteins. CD4+ T cells have MHC class II-restricted TCRs, and CD8+ T cells are MHC class I-restricted in their antigen recognition. CD4+ T cells, also known as T helper (Th) cells, regulate both the innate and adaptive immune responses through their polarization into different Th subtypes and their expression of specific surface membrane receptors and secreted cytokines. Thus, these cells have a central role in determining the type of immune response that the body produces against specific antigens. For instance, the Th1 subset stimulates the cellular response and consequently it maximizes the killing efficacy of the macrophages and the proliferation of cytotoxic T cells; Th2 cells activate humoral and anti-parasitic responses; Th3 and CD4+CD25+Foxp3+ regulatory T (Tregs) cells suppress a variety of immune responses and 11
21 THE ALLOIMMUNE RESPONSE STATE OF THE ART are crucial for the maintenance of immunological tolerance [14], and the Th17 subset play a role in protection against extracellular bacteria, however, its activity could develop autoimmune diseases under pathologic conditions [15]. Cytotoxic T lymphocytes (CTLs), which are characterized by CD8 co-receptor expression, actively destroy virally infected and tumor cells, as well as allogeneic cells present in transplanted grafts. Activated CTLs possess two mechanisms to kill their targets, both of which require cell-to-cell contact and are shared by other cytotoxic cells such as NK cells [16]. The first is the secretion of cytotoxins such as perforin (that form pores in the plasma membrane of attached cells allowing ions, water and toxins to enter the cytoplasm) and granzymes (that mediate the proteolytic activation of apoptosis on the targeted cells). The second mediator of CTL killing is the activation of Fas receptors on the target cell. Crosslinking of Fas with Fas ligands leads to caspase-dependent apoptosis. The magnitude of the pool of potential foreign antigens is enormous. T and B lymphocytes require therefore a massive repertoire of TCRs and Immunoglobulins (Ig) respectively, to specifically recognize non-self antigens. In principle this would require a huge genomic space. Thanks to the highly adaptable system to rearrange TCR and Ig genes, however, a small amount of genes are capable of generating a vast number of different antigen receptors, each of which is uniquely expressed on an individual lymphocyte Antigen presentation The T cell receptor is restricted to recognizing antigenic peptides only when are presented through the appropriate molecules of the major histocompatibility complex (MHC). Thus, T cell activation requires antigens to be processed and adequately presented on MHC molecules by antigen presenting cells (there is one important exception which are superantigens). Although under certain circumstances many cells are capable of presenting antigens and 12
22 STATE OF THE ART THE ALLOIMMUNE RESPONSE prompting adaptive immune responses, only some of them are specifically equipped to do so in a highly efficient way and to prime naive T cells. These highly immunogenic cells area termed professional APCs and mainly comprise dendritic cells, B cells, and macrophages T Cell Receptor Complex The T Cell Receptor Complex comprises the TCR chains, the CD3 complex and the CD4 or CD8 co-receptors (in Th and CTL subsets, respectively). Altogether this complex is responsible not only for the engagement and recognition of antigen-mhc complexes, but also for the signaling cascade leading to the initiation of the T cell activation (first signal). TCR is a heterodimer composed of two chains, which are in most cases α and β and on a minority of lymphocytes γ and δ. These chains contain a constant (C) and a variable (V) domain, which have three hypervariable or complementarity determining regions (CDRs). The TCR and chains are generated by Variable-Joining (VJ) gene recombination, whereas generation of the TCR and chains occurs by Variable-Diversity-Joining (V(D)J) gene recombination [17]. The junction area between these specific regions corresponds to the CDR3 region, which is the main CDR responsible for recognizing processed antigen bound to MHC molecules. The CD3 complex is composed of three different dimmers resulting from the combination of the CD3 molecules (CD3γ, CD3δ and two CD3ε chains) and a ζ-chain dimer. The CD3 complex is essential to the transport and the signaling capacity of the TCR complex. The intracellular tails of the CD3 molecules contain a single conserved motif known as an immunoreceptor tyrosine-based activation motif (ITAM). Phosphorylation of the ITAM is important in the signaling cascades of the T cell [18]. 13
23 THE ALLOIMMUNE RESPONSE STATE OF THE ART Major Histocompatibility Complex The classical MHC molecules also referred as HLA molecules in humans, are anchored in the cell membrane, where they display both self and non-self peptides to T cells, via the TCR. The HLA molecules are encoded by a highly polyallelic group of genes, and they are organized in two classes that present different types of antigens [19]. HLA class I molecules (A, B and C) present peptides from inside the cell, either self or foreign antigens, such as viral peptides, and are strongly expressed in all nucleated cells. These peptides are produced from cytoplasmic proteins that are digested by the proteasome into small polymers of 7 to 10 amino acids in length. The complex presents the antigens to CTLs via the CD8 molecule and also binds inhibitory receptors on NK cells. HLA class II molecules (DR, DP and DQ) typically present antigens from outside the cell that have been phagocytosed and their expression is restricted to APCs such as DCs, B cells, macrophages and activated endothelial cells. APCs use lysosome associated enzymes to digest exogenous proteins into smaller peptides, from 13 to 26 amino acids, and display them on their surface by coupling them to HLA class II molecules that interact with Th cells by binding to the CD4 co-receptor. Because of the high levels of allelic diversity found within the MHC genes, the HLA molecules are critical determinants of the immunogenicity of transplanted grafts. Thus, donor cells displaying HLA molecules not present in the recipient are rapidly recognized as foreign antigens and rejected T cell selection T cells are originated from hematopoietic stem cells in the bone marrow. The progenitor cells populate the thymus and expand by cell division to generate a large population of immature 14
24 STATE OF THE ART THE ALLOIMMUNE RESPONSE thymocytes. The earliest thymocytes express neither CD4 nor CD8, and are classified as double-negative cells. They progress to become double-positive and they finally mature to single-positive thymocytes. During their thymic development T cells undergo two types of selection. Through positive selection thymocytes capable of properly interacting with MHCs and binding the MHC/antigen complexes presented by thymic cortex receive a survival signal. On the other hand, those with low affinity die by apoptosis. The double-positive cells that are positive selected on MHC class II molecules will become CD4+ cells, while cells positively selected on MHC class I molecules mature into CD8+ cells. Negative selection removes thymocytes that bind MHC/antigen complexes presented by DCs and macrophages in the thymic medulla by the induction of apoptosis. This process is an important component of immunological tolerance and serves to prevent the formation of selfreactive T cells that are capable of generating autoimmune diseases. About 98% of thymocytes die during the development processes in the thymus by failing either positive selection or negative selection, whereas the other 2% survive and leave the thymus to become mature immunocompetent T cells in the peripheral tissues [20]. However, the negative selection in the thymus is not totally efficient and some auto-reactive T cells escape the process and reach the periphery, where they might or might not be suppressed by regulatory T cells Co-stimulatory pathways Once the TCR specifically binds the antigen presented by the MHC molecule, a cascade of signaling pathways is activated. These signals initiated by the TCR complex, however, are not sufficient to enable cells to undergo optimal activation, proliferation and cytokine production. 15
25 THE ALLOIMMUNE RESPONSE STATE OF THE ART In order to do so, a second co-stimulatory signal is required [21]. In fact, TCR engagement without co-stimulation leads to anergy induction and/or accelerated T cell apoptosis. A large number of molecules have been demonstrated to mediate co-stimulation. CD28 is expressed constitutively on the surface of T cells, while its ligands B7-1 (CD80) and B7-2 (CD86) are found on a variety of APCs including DCs, B cells and macrophages. CD28 costimulation enhances cell-cycle entry, expression of IL-2 and induction of anti-apoptotic proteins [22]. CD40 and CD40 ligand (CD154), members of the tumor necrosis factor (TNF) receptor family can also provide co-stimulatory signals to T cells. CD40 is expressed on APCs, but also on non-immune cells including endothelial cells, mast cells and epithelial cells. CD154 is expressed on T cells after activation and their consequent binding with CD40 enhances APC to up-regulate CD80 and CD86 expression and cytokine production [23]. In addition to positive or activation signals, negative second signals that down-regulate or terminate T cell responses are also important in co-stimulation. Cytotoxic T lymphocyteassociated antigen 4 (CTLA-4), which has approximately 20-fold higher affinity for B7-1 and B7-2 than CD28, is up-regulated after T cell activation and prevents positive co-stimulation by the dephosphorylation of CD3 and inhibition of cytokine production [24]. Similar inhibitory effects are exerted by the programmed death-1 (PD-1) molecule, which is also induced after activation of T cells and, following its engagement with the PD-1 ligand, results in an inhibition of T cell proliferation [25]. The ultimate fate of cellular immune responses is determined by the balance between positive and negative signals delivered by co-stimulatory molecules to T cells. 16
 1.2.")
26 STATE OF THE ART THE ALLOIMMUNE RESPONSE Figure 1: TCR/MHC antigen presentation and co-stimulatory pathways (Rosen H; Gastroenterology 2008) The alloimmune response Transplantation constitutes an immunological situation where an allogeneic graft (an organ or tissue coming from an individual from the same species exhibiting genetic polymorphisms) promotes in the recipient a characteristic immune response directed against the graft. This alloimmunity can be divided into several successive stages: the response is initiated through the recognition of the alloantigens by the host innate and adaptive immune system; it is followed by the activation and the expansion of alloreactive T cells; and is completed by the destruction or rejection of the donor cells (effector phase). 17
27 THE ALLOIMMUNE RESPONSE STATE OF THE ART Graft allorecognition Transplanted grafts are first damaged by a combination of the lesions promoted by donor brain death and organ procurement and by the ischemia/reperfusion injury. These lesions enhance the immunogenicity of the graft via danger signals that lead to the recruitment of innate immune system cells [26]. This promotes a rapid infiltration of leukocyte into the allograft by proinflammatory mediators and facilitates the DCs and T cells trafficking between lymph nodes and the transplant. Thus, an early allorecognition by the innate response results in a specific alloimmune response mediated by T cells Direct allorecognition The direct pathway involves the specific stimulation of the recipient T cells by intact MHC molecules expressed on the surface of donor APCs present in the graft. The TCR/MHC interaction in the course of direct allorecognition not only depends on the sequence disparity between donor and recipient MHC molecules, the associated allopeptide contributes increasingly more energy to the overall binding affinity. Direct recognition predominates early after transplantation when large numbers of graftderived APCs migrate to secondary lymphoid tissues and encounter allospecific T cells [27]. However, since donor-derived passenger leukocytes have a limited lifespan, the influence of the direct pathway probably diminishes with time after transplantation Indirect allorecognition The indirect pathway corresponds to the processing of soluble extracellular proteins that APCs perform under physiological circumstances. In transplantation, this takes place when donor alloantigens are engulfed by recipient APCs and then processed and presented on recipient MHC-II molecules to allospecific CD4 T. To a lesser extent, CD8 T cells interacting 18
![STATE OF THE ART THE ALLOIMMUNE RESPONSE with MHC class I molecules cross-presenting some of the allogeneic peptides are also involved [28].](/docs-images/96/127271065/images/28-0.jpg "Trafficking donor APCs provide a vehicle for the supply of donor antigens to recipient APCs located in the lymph nodes.")
28 STATE OF THE ART THE ALLOIMMUNE RESPONSE with MHC class I molecules cross-presenting some of the allogeneic peptides are also involved [28]. Trafficking donor APCs provide a vehicle for the supply of donor antigens to recipient APCs located in the lymph nodes. Furthermore, migrant recipient APCs invading the graft also capture alloantigens and transports them to draining lymph nodes. Transplants can express major and minor histocompatibility specific antigens. While major alloantigens consist in MHC class I and class II molecules, which large polymorphism increase the probability to find MHC disparities between unrelated transplanted patients [29]. The minor alloantigens are those polymorphic peptides derived from non-mhc proteins differently expressed between donor and receptor presented by either class I or class II MHC molecules. They are characterized to be able to entail a comparable response as MHC molecules [30]. In contrast to the direct pathway, the indirect anti-donor response often persists over time since the perpetual trafficking of recipient DCs through the transplanted organ provides a continuous influx of indirectly presented alloantigen into the draining lymphoid tissue [31]. Figure 2: Direct and Indirect allorecognition pathways (Rosen H; Gastroenterology 2008) 19
29 THE ALLOIMMUNE RESPONSE STATE OF THE ART The rejection response Transplant rejection is the final consequence of the recipient's alloimmune response directed against the non-self antigens expressed by the graft. Distinct effector pathways and complex immune mechanisms appear in a time-sequential manner during the rejection response eventually leading to the loss of the function of the graft [32] Hyperacute rejection The hyperacute response is induced by pre-formed recipient antibodies against the donor antigens. This type of graft rejection, which occurs within 48 hours of engraftment, is mediated by the binding of antibodies to antigens that are expressed by the vascular endothelium of the graft, predominantly blood-group antigens and MHC class I molecules [33]. This activates the complement system and the coagulation cascade, leading to platelet and fibrin deposition, and granulocyte and monocyte, but not lymphocyte, infiltration Acute rejection The acute rejection response, in contrast to the hyperacute form, is a T cell-mediated process. Graft damage is caused by mechanisms that include direct T cell cytotoxicity and classic delayed-type hypersensitivity (DTH). Because of the necessity for specific T cell priming and maturation, acute rejection usually does not occurs before one week after engraftment, and the risk is highest during the first three months. Acute rejection, however, can also occur months or years after transplantation. The innate response predominates in the early phase of the acute rejection. Chemokines and cell adhesion molecules play an essential role in DCs trafficking between graft and lymph nodes. There, APCs evokes a direct alloresponse involving both CD4+ and CD8+ effector T cells. Subsequently, T cells and cells from innate immune system function synergistically 20
30 STATE OF THE ART THE ALLOIMMUNE RESPONSE destroy the allograft through contact-dependent T cell cytotoxicity, granulocyte/macrophage/nk activation and alloantibody production after B cells activation [34] Chronic rejection Chronic rejection is a multifactorial and not well understood process probably involving multiple immunological and non-immunological factors. The graft extracellular matrix is slowly destroyed by macrophage and granulocyte derived inflammatory proteases. Interstitial fibroblasts are induced to produce collagen, which together with smooth muscle cell hyperplasia result in the narrowing of the graft blood vessels. Various immune cells as well as chemokines, pro-inflammatory cytokines and alloantibodies have all been implicated in both the initiation and progression of long term graft injury [35]. Besides, non-immunological factors such as hypertension, hyperlipidemia and infection may also contribute to the atherosclerotic vascular disease through increasing the incidence of fibrosis and the chronic allograft vasculopathy associated with loss of graft function [36, 37]. Eventually this process leads to progressive graft dysfunction and graft loss Graft survival and acceptance The principal aim in transplantation is to restore the functionality of damaged organs or tissues by replacing them with healthier surrogates. When conducted across allogeneic barriers, however, the recipient immune system recognizes the graft as foreign and attempts to remove it by attacking it using different cytophatic immune strategies. To prevent the graft from being destroyed and ensure long-term graft function it is critical to neutralize the effector arms of the alloimmune response. Strategies employed to better preserve the grafts 21
31 THE ALLOIMMUNE RESPONSE STATE OF THE ART and diminish their immunogenicity together with the use of pre-transplantation crossmatch to exclude recipients bearing anti-donor preformed antibodies have both been major advances that have had a significant impact on graft survival. However, given the continuous activation of the recipient s adaptive immune system through both direct and indirect allorecognition pathways, avoidance of rejection requires in most circumstances the indefinite administration of therapies capable of inhibiting the principal effector immune cells Pharmacological immunosuppression The immunosuppressive agents are drugs that inhibit or prevent activity of the immune system; hence, they are also used to treat autoimmune and inflammatory diseases. Since the first description of their immunosuppressive properties in animal models in 1960s, the efficacy and safety of immunosuppressive agents have markedly improved and this has probably been the most important factor responsible for the improvement of graft and patient survival observed in the last 30 years. Immunosuppression can be attained by blocking different pathways involved in effector immune responses. Given the central role of lymphocytes in graft rejection, most therapeutic strategies have targeted lymphocyte molecules with the aim of directly eliminating these cells or at least blocking their activation, proliferation, and/or trafficking [38, 39]. In most cases, however, blockade of an individual pathway does not prevent allograft rejection, and longterm graft survival requires the simultaneously blocking of several pathways through a combination of different agents Mechanisms of action of immunosuppressive drugs Multiple immunosuppressive drugs with different sites of action are currently available to interfere with the normal activity of the immune system. Most of them are small molecules 22
32 STATE OF THE ART THE ALLOIMMUNE RESPONSE capable of crossing the cell membrane and blocking immune pathways inside the target cell. Calcineurin inhibitors (CNIs) such as cyclosporine A (CyA) and tacrolimus, antagonize the activity of calcineurin (a serine-threonine phosphatase), the actions of which are essential for the generation of gene transcription factors, including nuclear factor of activated T cells (NFAT), nuclear factor-kb (NF-kB) and JUN N-terminal kinase (JNK). These agents selectively inhibit the synthesis of various cytokines by lymphoid cells such as IL-2, critical for their activation [40]. The inhibition of co-stimulatory pathways constitutes another principal mechanism of action. Rapamycin (sirolimus) blocks signals transduced from a variety of growth factor receptors to the nucleus, such as IL-2 or IL-15, by acting on the mtor pathway; important for T-cell proliferation, B-cell stimulation and antibody production [41, 42]. Corticosteroids are the most frequently used non-cni agents. Through DNA binding, they abrogate the expression of multiple cytokines, including IL-1, IL-2, IL-3 and IL-6, by targeting transcription factors such as activator protein 1 (AP1) and NF-kB. In addition, corticosteroids suppress eicosanoid production and down-regulate adhesion molecules. To block the source of necessary metabolites for needed normal cell activity is a further important mechanism of immunosuppression. Lymphocytes require the synthesis of purine and pyrimidine nucleotides for replication. Antimetabolites used in transplantation include azathioprine (AZA), mycophenolate mofetil (MMF) and mycophenolic acid (MPA), which blocks differentiation and proliferation of T and B lymphocytes. Antibodies constitute a different group of immunosuppressive agents in transplantation. They can target a wide variety of different pathways through binding and thereby blocking membrane receptors. Polyclonal antibody preparations (such as thymoglobulin, AteGe, or 23

33 THE ALLOIMMUNE RESPONSE STATE OF THE ART antilymphocyte serum) target multiple epitopes on T cells and other lymphocytes (CD2, CD3, CD4, CD8, CD28, CD16) and result in functional alterations and/or depletion. Monoclonal antibodies are used to block single specific targets inhibiting different steps in the immune response activation. Muromonab-CD3 (OKT3) binds the CD3 antigen on the surface of T- cells inactivating the adjacent TCR complex signal and leading to T lymphocyte depletion. Basiliximab and Daclizumab attach to the IL-2 receptor alfa-chain (CD25 antigen), depleting activated T cells and inhibiting IL2-induced T-cell proliferation. Other lymphocyte depleting antibodies are campath-1h, that targets the CD52 antigen in different cell types, and rituximab that binds CD20 on B cells. Another type of antibodies are those capable of blocking co-stimulatory pathways and preventing the transduction of the second signal required for T cell activation. The best example of the latter is belatacept (LEA29Y), a CTLA-4 fusion protein that contains a high-affinity binding site for B7 expressed in APCs. Figure 3: Immunosuppressive drugs and sites of action. (Rosen H; Gastroenterology 2008) 24
34 STATE OF THE ART THE ALLOIMMUNE RESPONSE Side effects of immunosuppressive drugs Current immunosuppressive agents are not selective for alloreactive cells and exert a widespread non-specific effect on the immune system rendering it less effective in the combat against infections and in its immunosurveillance function. This results in higher rates of infections (some of them opportunistics) and cancer [43, 44]. In addition to the negative consequences of a compromised immune system, each drug exhibits intrinsic metabolic side effects, such as hypertension, dyslipidemia, hyperglycemia, ulcers, nauseas, vomiting, and liver and kidney toxicity [38, 45]. Immunosuppressive agents also interact with other medications and affect their metabolism, action and blood concentration New strategies of immunosuppression The progress of immunosuppressive therapy has dramatically improved the short-term results of organ transplantation. For this reason, the amelioration of long-term survival and the reduction of toxicity secondary to chronic immunosuppressive treatment have gain much more relevance in recent years. Several therapeutic strategies have been attempted in order to use currently available immunosuppressive drugs in a less toxic manner and to prevent chronic allograft failure. However, no immunosuppressive drug is devoid of side effects, and despite multiple studies having been performed, calcineurin inhibitors continue to be the cornerstone in the immunosuppressive therapy or graft recipients, and no alternative regimen has so far seriously challenged the almost universal use of these drugs. Another subject that has been also explored is the use of immune monitoring tools to tailor the doses of immunosuppressive drugs administered. [46]. While this filed is extremely promising, and several reports of immune monitoring tools with potential clinical utility have been published, their impact in routine clinical practice is still minimal [47-49]. The ultimate answer to solve 25
35 THE ALLOIMMUNE RESPONSE STATE OF THE ART these problems would be the shift from non-specific immunosuppression to donor-specific immunoregulation (i.e. the selective tolerarization of donor-specific lymphocytes), Again, while this is very actively being pursued in experimental transplantation, the field of tolerance induction is still far from being ready for routine clinical application in organ transplantation. 26
36 STATE OF THE ART TRANSPLANTATION TOLERANCE 2.- TRANSPLANTATION TOLERANCE 27
37 TRANSPLANTATION TOLERANCE STATE OF THE ART Basic concepts in transplantation tolerance Immunologic tolerance is traditionally defined as a state of antigen-specific unresponsiveness in the absence of immune system ablation and maintaining the normal immunocompetence against other non-self antigens [50]. Under physiological conductions, tolerance against selfantigens is established at the central and peripheral levels. Central tolerance results from intrathymic deletion of T cells with high avidity for thymicallyexpressed self-antigens. Peripheral tolerance de-activates those lymphocytes with selfreactivity escaping central tolerance. Many mechanisms contribute to peripheral tolerance including ignorance, deletion by apoptosis, the induction of anergy, and active immunosuppression by regulatory T cells. The correct functioning of these mechanisms ensures the absence of autoimmune diseases. In addition, these same mechanisms are responsible for the acquisition of tolerance directed against foreign antigens both in physiological (pregnancy, intestinal microbiota, mucosal immunity), and non-physiological (e.g. transplantation [51]) conditions. Transplantation tolerance is defined as indefinite donor-specific unresponsiveness that persists despite cessation of immunosuppressive therapy. In experimental animal models, tolerance is demonstrated by the acceptance of subsequent donor allografts in a recipient that retains the ability to reject third-party allografts. In the past decades, remarkable progress has been made to define the molecular basis of transplantation tolerance in rodents [52]. However, a complete understanding of these underlying mechanisms in both human and animal models is far from complete. In clinical transplantation, patients spontaneously accepting their grafts despite complete discontinuation of all immunosuppressive therapy are occasionally identified (particularly in liver transplantation [53]) and constitute the best proof-of-principle available that 28
38 STATE OF THE ART TRANSPLANTATION TOLERANCE immunological allograft tolerance is achievable in humans. However, the absence of a clinical opportunity to prove the preservation of an otherwise normal immune response, maintaining the capacity to reject third-party allograft and to accept a second donor-specific allograft, evokes to redefine the concept for operationally tolerant state, as a long-term functional graft survival in a patient not requiring maintenance immunosuppression [54] Mechanisms of transplantation tolerance Transplantation tolerance as described in rodents is an actively acquired and highly regulated process [55]. Although the precise nature underlying allograft tolerance is still not firmly established, multiple processes involving several cellular components that evolve over time are responsible for definitive allospecific immunoregulation Clonal deletion Clonal deletion of alloreactive lymphocytes has been shown to be highly efficient to obtain a prolonged state of tolerance. The specific deletion of donor-antigen reactive T cells can be achieved centrally in the thymus or in the periphery. Infusion and permanence of donor APCs in the recipient s thymus enables these cells to trigger the central deletion of maturing allospecific thymocytes though cell-death mechanism used naturally in the negative selection to promote central self-tolerance [56]. Although deletion is primarily confined to developing thymocytes, mature allospecific T cells can also undergo apoptosis following a passive or active induced cell death in the periphery. The passive death signal can be triggered by antigen allorecognition under suboptimal conditions, such as absence of co-stimulatory signals and IL-2 secretion, evoking an inhibition of anti-apoptotic gene expression, including Bcl-2 and Bcl-xL. Contrary, the active 29
39 TRANSPLANTATION TOLERANCE STATE OF THE ART death signal requires immune activation and IL-2 secretion together with a Fas ligand or TNF receptor interaction [57]. Apoptosis of activated alloreactive T cells in certain peripheral microenvironments may contribute to the induction, maintenance, and regulation of allograft tolerance. Tissues and organs such as cornea, testis, placenta and liver have the benefit of immune privilege state [58]. The existence of regulatory mechanism in grafts that trigger apoptotic cell death on invading host lymphocytes confers a privileged immune status during transplantation Clonal anergy Naïve T cells require a several different stimulatory signals to attain complete activation. Defective signals following TCR engagement by altered ligands or the absence of costimulatory signals, such as CD28 interaction, entails induction of anergy [59]. Clonal anergy refers to functionally inactivated antigen-specific T cells in absence of lymphocyte deletion. This state is characterized by inhibition of IL-2 production, profound defect in CD40 ligand expression and decreased TCR ζ-chain and ZAP-70 phosphorylation. Consequently, the allospecific T cells loose proliferation capacity and reduce their lifespan Clonal exhaustion Clonal exhaustion can occur as a result of chronic alloantigen stimulation or alloantigen recognition under suboptimal conditions. The consequence is either deletion or functional inactivation of the cells that are responding to donor alloantigen. The large number of donorderived APCs migrating from the graft to the draining lymphoid tissues could trigger this type of response after transplantation at organs highly populated with APCs such as the liver [60]. 30
40 STATE OF THE ART TRANSPLANTATION TOLERANCE Immunoregulation Immunoregulation is an active process of peripheral tolerance whereby one population of cells controls or regulates the activity of other lymphocyte population. Various lymphocyte subsets have been described to be capable of influence both the innate and adaptive immune responsiveness against alloantigens, resulting in the actively promotion and maintenance of graft acceptance by the recipient s immune system [51, 61] CD4 + CD25 + regulatory T cells The suppressive capacity mediated through a CD4 T-cell population was first described during the 1990s in animal models. Various studies demonstrated that CD4 cells expressing the IL-2 receptor chain (CD25) were able to inhibit allograft rejection in rats. In addition, their suppressive action was necessary to maintain the immunological self-tolerance to avoid autoimmune diseases in mice models [62, 63]. Subsequently, several groups described the existence of these cells in the peripheral blood and lymphoid tissues in humans as well [64]. Research on CD4 + CD25 + T cells has experienced an enormous growth showing that these regulatory cells play an important role in autoimmune disorders, infection, tumors, allergy and transplantation. They are potent suppressor cells and are capably of suppressing the effector cell functions of various lymphocytes including effector CD4 + CD25 - T cells, cytotoxic CD8+ T cells, NK cells, and B cells. Moreover, CD4 + CD25 + Tregs can also suppress the response of T cells activated by the same or by different APCs, so-called bystander or linked suppression [65]. Multiple efforts have been made to describe the mechanisms of action and the origin of their different subsets. 31
41 TRANSPLANTATION TOLERANCE STATE OF THE ART Natural CD4 + CD25 + regulatory T cells Naturally occurring CD4 + CD25 + Tregs are derived from the thymus and comprise 5-10% of the CD4 + T cell population in peripheral blood. Their intrathymic generation requires higher affinity of their TCRs for self-peptide MHC class II complex than those expressed by effector T cells, but lower avidity than the autoreactive T-cells that are negatively selected by clonal deletion [66, 67]. CD4 + CD25 + Tregs express several characteristic markers. In addition to the high expression of CD25, they also express CTLA-4, glucocorticoid induced tumor necrosis factor receptor family-related gene (GITR or TNFRSF18), CD103 ( E 7 integrin), CD62L (L-selectin) and CD122 (interleukin-2 receptor b-chain). These extracellular markers, however, are not exclusive for CD4 + CD25 + Tregs, as they are also expressed on other T-cell subsets, making them unreliable to precisely identify this cell lineage (particularly in humans, where the distinction between Tregs and activated effector T cells is more difficult than in rodents). The transcription factor forkhead box P3 (FOXP3) is the key regulatory gene for thymic development and function of CD4 + CD25 + Tregs. FOXP3 gene mutation or expression absence gives rise to severe immune dysregulation in rodents and human [68, 69]. FOXP3 expression is restricted to CD4 + CD25 + Tregs, although T-cell activation might also induce transient FOXP3 expression in non-regulatory human cells. The expression of the IL-7 receptor a chain (CD127) inversely correlates with FOXP3 expression and with the activity of regulatory T cells, and be employed as a highly selective marker to identify CD4 + CD25 + Foxp3 + Tregs [70]. To exert their function in transplantation tolerance, CD4 + CD25 + Tregs require antigen specific activation via their TCR and provision of IL-2 signaling. Once activated, they employ different mechanisms to suppress the proliferation and cytokine production of effector cells, 32
42 STATE OF THE ART TRANSPLANTATION TOLERANCE including the secretion of immunosuppressive cytokines (e.g. transforming growth factor- (TGF- ) and IL-10), and the inhibition of effector lymphocytes though direct cell-to-cell taking place via binding of cell-surface molecules such as CTLA-4 [71-74]. Furthermore, CD4 + CD25 + Tregs induce apoptosis of effector T cells by both deprivation of cytokines or perforin-dependent pathway [75]. In addition, they may also down-modulate the function of APCs and render them unable to activate effector T cells Adaptive CD4+CD25+ regulatory T cells In addition thymic-derived naturally occurring regulatory T cells, other CD4 + regulatory T cell populations are generated in the periphery from CD4 + CD25 - FOXP3 - effector T cells after cytokine-dependent stimulation. This so called adaptive CD4 + CD25 + Tregs share similar regulatory properties with natural Tregs. Although the induced Tregs express the same characteristic makers including FOXP3, their suppressive capacity seems to be unstable in time, correlating with the epigenetic control of FOXP3 gene properties [76]. Contrary to natural Tregs, the persistent hypermethylation of the Treg-specific demethylation region (TSDR) in adaptive Tregs is the only way to distinguish both regulatory T cell populations [77]. Type 1 regulatory T cells (Tr1) are a different type of adaptive regulatory T cells that can be generated: a) from naive CD4 T cells by antigenic stimulation in the presence of IL-10 in combination with IFN- b) by a combination of vitamin D3 and dexamethasone [78, 79]; and c) after stimulation of CD4+ naïve T cells by allogenic immature DCs [80]. Tr1 regulatory cells regulate alloantigen specific responses by producing high levels of the immunosuppressive cytokines IL-10 and TGF-. A further subset of adaptive Tregs, the Th3 cells, are generated in experimental models after oral administration of alloantigens [82]. These cells produce high levels of TGF- with varying amounts of IL-4 and IL-10, thereby 33
43 TRANSPLANTATION TOLERANCE STATE OF THE ART evoking an immunological state known as oral tolerance, generating an important means of suppressing the alloimmune response [82, 83] NK cells NK cells seem to have a dual role in mediating both rejection and tolerance in transplantation. In addition to their contribution to surveillance against transformed cells, certain viruses and other intracellular pathogens, NK cells can act as regulatory cells to influence various other cell types, such as DCs, T cells, B cells and endothelial cells [84]. A series of experiments have shown that NK cells, but not NKT cells, are necessary for tolerance induction in a fully mismatched islet transplantation model [85]. Furthermore, NK cells have a crucial role in eliminating graft-derived APCs, thereby preventing donor DCs from migrating to lymphoid and non-lymphoid sites in the recipient, where they can directly activate alloreactive T cells to respond against the graft [86]. NK cells also perform an immunoregulatory activity during the pregnancy through the highly enrichment of uterine NK cells in the placenta. In addition, the maintenance of the fetal graft depends of their presence [87]. Although the reported evidences, the specific contribution of NK cells to transplantation tolerance remains partially unknown and further studies must be done NKT cells NKT cells are generated in the thymus and represent less than 0.1% of peripheral blood lymphocytes in human beings. Although they are found in various tissues, they are located primarily in the liver and bone marrow and less commonly in the spleen and peripheral lymph nodes [88]. Several studies have shown their important role as regulatory lymphocytes in different immune features. 34
44 STATE OF THE ART TRANSPLANTATION TOLERANCE Both in rodents and in humans, altered function of NKT cells has been associated with several autoimmune diseases such as type 1 diabetes and systemic sclerosis [89, 90]. The mechanism underlying their regulatory functions in autoimmunity could be due to the rapid secretion of Th2 type cytokines such as IL-4 and IL-10 after activation [91]. NKT cells can also regulate cytotoxic T-cell responses possibly via IL-13 secretion and signaling by the IL-4R-STAT6 pathway [92], or promoting antitumor immunity by IFN- secretion. In transplantation, NKT cells are able to prevent graft-versus-host disease (GVHD) after allogenic bone marrow transplantation [93]. NKT cells also seem to be required for the induction of cardiac transplant tolerance by costimulation blockade by CD28/B7 and LFA- 1/ICAM-1 [94], where IFN- secretion and expression of the chemokine receptor CXCR6 were shown to be responsible for allograft acceptance [95]. Moreover, in animal models graftderived NKT cells play an important role in the spontaneous tolerance of orthotopic liver transplantation [96]. Long-term survival of corneal allografts has also been shown to be NKT cells dependent through their induction of Tregs T cells T cells expressing TCR chains represent only a small subset of around 1-10% within the total T cell population in human peripheral blood. T cells recognize antigens directly without any requirement for antigen processing and presentation by MHC molecules, such as small non-peptide molecules or either MHC class I-related chain A or B (MICA or MICB). While the V 2 T-cell subset predominates in peripheral blood, the other major subset, V 1 T cells, comprises 70-90% of the T cells in epithelial tissues [97]. T cells have been demonstrated to possess Treg activity in several animal models and in humans, including transplantation tolerance, organ immune privilege, autoimmune diseases 35
45 TRANSPLANTATION TOLERANCE STATE OF THE ART and cancer [98-100]. In a portal tolerance model, adoptive transfer of T cells can transferred unresponsiveness to allogeneic skin grafts [101] and infusion of anti- TCR monoclonal antibody into transplant recipients blocked allograft enhancement [102]. Thus, antigen specific oral tolerance cannot be generated in T cells knock-out mice [103]. In clinical transplantation, the number of T cells in the blood of kidney transplanted patients positively correlated with stable allograft function and negatively correlated with rejection [104]. In addition, a preponderance of peripheral Vd1 subset was described in liver allograft tolerance [105]. Finally, T cells also play a regulatory role in GVHD [106] and in antitumor immunity by suppression of T cells and DCs [107]. The mechanism by which Treg cells prolong graft survival and induce tolerance is still unclear. Treg cells have been suggested to downregulate immune responses by secretion of Th2 cytokines, such as IL-4 and/or IL-10 or by their cytotoxic activity through FasL expression [108, 109]. Moreover, T cells may regulate the function of T cells and suppress CTL activity though the secretion of the inhibitory cytokines IL-10 and TGF Dendritic Cells DCs can modulate the differentiation of naïve T cells into polarized Th cells and thus are a major component in the regulation of T cell responsiveness [111]. Upon maturation, DCs increase their expression of MHC, adhesion and co-stimulation molecules and secrete cytokines necessary to enhance T lymphocytes activation and generate immune responses. Therefore, the lack of this activation raises immature DCs which provoke less efficient allospecific activation in transplantation, promoting a donor-specific anergy. Immature DCs have been shown to induce tolerance in various experimental models [112, 113] by promoting 36
46 STATE OF THE ART TRANSPLANTATION TOLERANCE the generation of T cells with regulatory properties [80]. Therefore, the continuous acquisition of alloantigens from the engrafted organ by DCs could either promote or private the donorspecific tolerance depending on their activation state [114]. Several mechanisms may be responsible for the peripheral tolerance induced by myeloid DCs (mdcs) and plasmacytoid DCs (pdcs). The suppressive functions of mdcs include induction of T lymphocyte anergy in the absence of co-stimulatory signals, peripheral deletion of reactive T cells through Fas/FasL or PD/PD-L1 interactions and the capture of apoptotic cells [115], followed by antigen presentation in a context where proinflammatory cytokine production is inhibited [116]. In addition, the synthesis of nitric oxide (NO), haemoxygenase (HO)-1 or indoleamine 2,3-dioxygenase (IDO) inhibits T, B and NK cell activation [117, 118] and through the synthesis of IL-10 and TGF-, mdcs also induce differentiation of regulatory T cell [80]. The tolerogenic potential of pdcs was demonstrated through the administration of murine liver pdcs in a cardiac allograft model. These cells acquire alloantigens in the graft and after trafficking to peripheral lymph nodes, they induce the generation of CD4 + CD25 + FOXP3 + Tregs expressing the chemokine CCR4 [119, 120]. In human transplantation an increase in the frequency of pdc precursors was observed in tolerant liver transplant recipients in comparison to those who required immunosuppression [121] Other regulatory T-cell subsets CD8 + CD28 - regulatory T cells (CD8 + Ts) were the first suppressor cells described 30 years ago. CD8 + Ts play an important role in preventing experimental autoimmune encephalomyelitis (EAE) in mice [122]. More importantly, their presence in humans could be detected in renal graft patients with drug-free tolerance [123], in cardiac transplantation 37
47 TRANSPLANTATION TOLERANCE STATE OF THE ART patients without rejection [124], and in pediatric liver-intestine graft recipients with reduced immunosuppression [125]. These cells suppress the proliferation of T effector cells by inhibiting the CD40 signaling pathway of APCs, through the upregulation of immunoglobulin-like transcript 3 (ILT3) and ILT4 on monocytes, endothelial cells and DCs [126]. An additional subset of regulatory T cells described is the double-negative CD4 - CD8 - TCR + (DN) population present in animal models and in peripheral blood in humans. The DN regulatory cells are able to prevent allograft rejection in an antigen-specific manner [127, 128]. These cells use FasL mediated apoptosis to kill alloreactive T cells. Thus, the chemokine CXCR5 expressed on DN Tregs played an important role in their homing to the allograft [129]. The induction of T-cell anergy is an important process for immunologic tolerance to selfantigens. However, anergic T cells can actively regulate other T cells in an antigen-specific manner and function as suppressor cells [130]. Inhibition of CD4+ T cell proliferation and cytokine production by anergic T cells has been shown in human cell cultures though cell-cell contact dependent suppression. In addition, anergic T cells were able to effect linked suppression if the APCs presented simultaneously the same specific antigen as the anergic and the target T cells recognized [131]. By these mechanisms, anergic T cells could prolong skin allograft survival and prevent renal transplant rejection in animal models [132]. 38
48 STATE OF THE ART TRANSPLANTATION TOLERANCE Allograft tolerance induction Treatment with immunosuppressive drugs has greatly improved graft survival after solid organ transplantation. However, long-term results remain relatively disappointing because of chronic allograft dysfunction and drug-related patient morbidity and mortality. Therefore, the induction of specific immunological tolerance of the recipient towards the allograft remains an important objective in clinical transplantation research Mechanisms of tolerance induction Over recent years, experimental models have shown that it is possible to exploit the mechanisms that normally maintain immune homeostasis and tolerance to self-antigens to induce tolerance to alloantigens. The regulation of the immune response and the induction of tolerance involve central and peripheral mechanisms Central tolerance and donor cell chimerism The thymus plays an important role in the maintenance of tolerance to self-antigens, and many experimental data support its role in the induction of sustained tolerance to alloantigens as well [133, 134]. The physiological process of autoreactive T-cell deletion can be exploited in transplantation by the delivery of donor alloantigens to the thymus prior to solid organ engraftment. This can be achieved by the induction of hematopoietic mixed chimerism in the recipient s repertoire allowing donor APCs to migrate to the thymus and induce negative selection of donor-reactive T cells. Importantly, aggressive deletion of pre-existing crossreactive peripheral T cells that could reject the donor bone marrow must be achieved prior to the infusion [ ]. In the clinic, a small number of highly selected patients underwent HLA-matched combined bone marrow and kidney transplantation from the same living donor, inducing long-term 39
49 TRANSPLANTATION TOLERANCE STATE OF THE ART acceptance of the renal allograft in the absence of ongoing immunosuppression [ ]. A recent study extended these protocols to HLA-mismatched patients [142]. Interestingly, all of the recipients displayed only transient chimerism post-transplantation, suggesting that peripheral mechanisms may be involved in the long-term maintenance of transplantation tolerance Peripheral tolerance Organ transplantation entails allospecific T cells circulation, which are crucial on the initiation and coordination of rejection response. Peripheral tolerance encloses the mechanisms responsible to minimize the alloreactive effector T-cell pool outside the thymus. Various strategies have been explored to achieve peripheral tolerance to alloantigens in experimental models, and some of them have been attempted in clinical trials as well. These strategies are based on either: a) the interruption of specific signals required for the activation and differentiation of alloreactive T cells leading to depletion, anergy or apoptosis [143]; or b) the use of Tregs to suppress cytophatic effector immune responses Cell deletion Depletion strategies have been extensively studied in non-human primate models obtaining encouraging results using rabbit ATG or anti-cd3 alone [144] or in combination with deoxyspergualin or rapamycin [145, 146]. Subsequent clinical studies, using either anti-cd52 antibodies or polyclonal anti-lymphocyte antibodies, confirmed that T-cell depleting antibodies greatly reduce conventional immunosuppressive drug requirements, although in most cases they do not allow for the complete discontinuation of these drugs [ ]. Based on available clinical data therefore, T cell depleting antibodies are more useful to ensure successful minimization of conventional immunosuppressive drugs than to formally induce transplantation tolerance. 40
50 STATE OF THE ART TRANSPLANTATION TOLERANCE Co-stimulation blockade Co-stimulation blockade is based on the paradigm that specific immune responses require two signals for optimal activation. In the absence of a facilitating co-stimulatory signal, antigen stimulation induces anergy or apoptosis. In contrast to lymphocyte-depleting protocols, antigen exposure combined with co-stimulation molecule inhibition, has the effect of eliminating cells in an antigen-specific manner [150, 151]. Although their applicability is not proved in humans, many experimental models in rodents and non-human primates have been reported tolerance induction by blocking co-stimulatory pathways employing CD154 antibodies [152]; anti-cd25, which has not shown deleterious effects on CD4 + CD25 + Tregs [153, 154]; or CTLA4 fusion protein, actually used as immunosuppressor in clinical renal transplantation [155, 156] Targeting leukocyte trafficking For an efficient immune response against the allograft, primed alloreactive T cells and accessory cells have to migrate and infiltrate the graft. Several studies using rodent models reported the cell trafficking interference as a promising approach of tolerance induction [157]. Related with these finding, the employment of sphingosine-1-phosphate (S1P) analogue [158] or adhesion molecules blocking such as ICAM-1 or LFA-1 [159] are in a trial phase to be tested as immunosuppressor agents for a clinical application Therapeutic infusion of Tregs Compelling data generated in preclinical animal models indicate that the infusion of various regulatory cell populations can induce allospecific tolerance. In particular, CD4 + CD25 + FOXP3 + Tregs [160] and tolerogenic DCs [115] have demonstrated impressive experimental results. The main advantage of these strategies is the potential for antigen specificity with lack of general immunosuppression. 41
51 TRANSPLANTATION TOLERANCE STATE OF THE ART Successful ex vivo expansion of natural and inducible CD4 + CD25 + Tregs has been achieved in both mice and human after stimulation in the presence of T-cell growth factors. Importantly, these expanded cells retain their suppressor function both in vitro and in vivo [ ]. Several strategies have been reported to induce tolerance employing tolerogenic DCs. Principally, exploiting their efficient cooperation with CD4 + CD25 + Tregs to stimulate allospecific immunoregulation [120]. In addition, the infusion of immature host DCs previously ex-vivo pulsed with donor alloantigens prolong the graft survival in animal models [164]. In humans, the therapeutic potential of Tregs infusion is currently being tested in kidney allograft recipients Challenges of applying tolerance induction strategies to the clinic The induction of transplantation tolerance, the indefinite allograft acceptance independent of chronic immunosuppressive therapy, remains the definite objective in clinical transplantation. Although promising data from animal models have been achieved, we currently lack a robust strategy to accomplish this goal in the clinic. Several barriers have been encountered in the search for a means to induce allograft tolerance in the clinic Translational research obstacles Although the induction of tolerance in mice was first described more than 40 years ago, the attempts to transfer this phenomenon to large-animals models and to the clinic have proven to be more challenging than initially envisioned. In most rodent experiments investigators have used highly inbred murine laboratory strains, which are: a) genetically homogeneous; b) too young and too clean and thus bearing a predominantly naïve T cell repertoire. This is very different from the clinical scenario, where 42
52 STATE OF THE ART TRANSPLANTATION TOLERANCE recipients are extremely heterogeneous and have a large compartment of memory lymphocytes (which are much more difficult to be targeted with current immunotherapeutic strategies). Memory T cells are less dependent on co-stimulatory signals for their activation and may therefore be more resistant to tolerance induction strategies than naïve T cells [165]. There are other critical differences between clinical transplantation and experimental animal models. For instance, donor brain death leads to a marked inflammatory damage in the graft that is very difficult to mimic in experimental models. The exact histopathological lesions observed in human grafts are also difficult to replicate in most animal models. Finally, laboratory animals tolerate different doses of therapeutic reagents (usually higher), and exhibit a different drug toxicity profile as compared with humans. All these issues can lead to different outcomes when tolerance promoting strategies are tested Difficulties with the infusion of regulatory cells in the clinic Adoptive transfer of regulatory cells to prevent rejection and promote tolerance has many potential advantages as compared with conventional immunosuppressive therapies used in the clinic. However, there are certain challenges that still remain to be solved before such therapeutic cell infusions can be routinely applied in the clinic. From a practical point of view, it is important to take into consideration that cell isolation, expansion and reinfusion into patients are procedures that require quality control with good manufacturing practice (GMP) to ensure safety and reproducible results. In addition, an exhaustive purity control must be performed with the selected cells after their expansion and culture in vitro. The isolation of non-stable regulatory T cells or non-completely pure population could entail the infusion of highly activated alloreactive T cells in the recipient, potentially causing rejection. In terms of the possibility of using adoptively transferred Treg cells to induce tolerance, a significant barrier is the high precursor frequency of alloreactive T cells in the recipient, 43
53 TRANSPLANTATION TOLERANCE STATE OF THE ART which is estimated to be as high as 1-10% of the total T cell repertoire in fully allogeneic combinations [29]. If tolerance or rejection is in part determined by the balance between Treg and effector T cells [166], far more Treg may be needed to induce tolerance to alloantigens than to autoantigens. For this reason, at the moment the use of Treg-mediated tolerance seems to be more plausible to treat autoimmunity than to induce tolerance or prevent rejection in organ transplantation. A second insight concerns the potential interplay between the adoptively transferred Tregs and the immunosuppressive drugs conventionally used in the clinic. For an effective adoptive Treg therapy it is crucial reduce the alloreactive T cell pool first (which requires the use of some sort of pharmacological immunosuppressive strategy) and then start the enhancement of Tregs. Consequently, a careful selection of the type and the timing of the immunosuppressive treatment employed is critical in order not to affect the function of Tregs, because different effects are related in the Tregs function depending of the therapy. While high doses of calcineurin inhibitors have shown abrogates Tregs development [167, 168], the treatment with rapamycin could specifically deplete alloreactive T cells whereas preserve Treg [169] Viral infection and memory immune responses There are multiple mechanisms by which viral infections may modify tolerance induction and allograft survival. Virus-specific CD4+ T cells facilitate the maturation of virus-presenting APCs via CD154-CD40 interactions. Consequently, the APC is stimulated to upregulate costimulatory molecules, as well as to secrete proinflammatory cytokines. Allospecific T cells that have encountered cognate alloantigens can be activated in this inflammatory milieu even if they do not cross-react with viral antigens. This process is referred to as bystander activation [170, 171]. 44
54 STATE OF THE ART TRANSPLANTATION TOLERANCE Furthermore, viral infections can modulate regulatory mechanisms [172]. Release of inflammatory cytokines by virus-infected cells can prevent the differentiation of uncommitted naive CD4+ T cells into Tregs. Even in the presence of TGF-β, the existence of proinflammatory cytokines such as IL-6, and perhaps IL-21, naive T cells can turn into effector T cells such as the IL-17-producing Th17 cells [173]. Therefore, virus infection may precipitate allograft rejection by preventing the generation of Tregs following costimulation blockade and instead favor development of proinflammatory effector T cells. Virus infection may also lead to the generation of virus-specific T cells that can cross-react with alloantigens. This phenomenon is known as heterologous immunity and is considered to be a major barrier in the induction of tolerance [ ]. Although the frequency of naïve T cells available to respond to any given pathogen is relatively small, the proportion that can directly recognize foreign MHC represents a substantial fraction of up to 1-10% of the total T-cell repertoire. Therefore, it is not surprising that a proportion of T cells with TCRs that recognize alloantigens may arise as a result of viral infection that induces virus-specific T cells that cross-react with allo-mhc [ ]. Activation of these T cells together with the pre-existing pool of memory T cells in the adult human recipient may result in the recognition of MHC molecules found on donor tissues, such as the endothelium of transplanted organs, precipitating allograft rejection Ethical conflicts Nowadays in most clinical centers short and mid-term graft survival are excellent. These good results provide little impulse and some ethical concerns for the evaluation of new tolerancepromoting strategies. Additionally, the envisioned short-term use of therapeutic regimens in tolerance-inducing protocols, and the fact that as compared to other fields the number of 45
55 TRANSPLANTATION TOLERANCE STATE OF THE ART patients that receive transplants is small, do not encourage pharmaceutical and/or biotechnology companies to develop and test new strategies to promote tolerance in the clinic. So far, the only strategy to unambiguously demonstrate the feasibility of purposely inducing tolerance in HLA-mismatched situations in the clinic is the use of donor bone marrow infusion to induce mixed chimerism and promote tolerance to kidney allografts. Unfortunately, the conditioning regimen required to promote this outcome is very aggressive and only applicable to selected recipients. The risk inherent to this approach is difficult to justify for most clinicians, and clearly cannot compete in terms of safety and efficacy with currently employed conventional immunosuppressive strategies. Given the limitations and constrains of this field, there is an urgent need to identify convincing biomarkers and/or predictive assays of tolerance to determine who can benefit from tolerant-promoting protocols and when has tolerance been achieved. These biomarkers will only be obtained if existing and new clinical trials are accompanied by robust assays to monitor clinical tolerance and its underlying mechanisms. Without such assays, the only measure of success is graft survival and other endpoints are ethically difficult to justify, because it is hard to withdraw drugs from patients who are doing well on current immunosuppressive regimens unless there is a good reason to believe that drug withdrawal will be successful. 46
56 STATE OF THE ART THE LIVER IMMUNE SYSTEM 3.- THE LIVER IMMUNE SYSTEM 47
57 THE LIVER IMMUNE SYSTEM STATE OF THE ART The liver immune response The liver exhibits a distinctive and unique form of immune behavior not comparable with any other organ. This immune microenvironment is a consequence of the liver s particular cell composition and physiology, which are especially organized to carry out its functions, but also to regulate immunological effects. The liver is continuously exposed to food-derived and microbial antigens from the intestine and displays barrier functions towards environmental antigens. The constitutive presence, under normal conditions, of this huge quantity of non-self molecules in the liver imposes a conditional immunological response, resulting in a distinctive set of immune mechanisms to maintain tolerance to harmless antigens and deliver an active immunity to infections. Consequently, the regulatory mechanisms responsible to avoid the overactivation of the immune system also could entail the creation of a window of vulnerability for well-adapted pathogens, such as malaria parasite, hepatitis C virus (HCV), and malignant cells, as well as the possible contribution to the state of tolerance in liver transplantation. The hepatic immune response, which seems to favor immune tolerance, is characterized by a local concentration of overlapping innate immune mechanisms, together with an unusual number of cell types capable to act as APCs and a particular pool of intrahepatic lymphocytes. In addition, the liver could act as a secondary lymphoid organ by priming circulating T cells and mediating the systemic and local immune activation or regulation Liver physiology The liver is the largest organ in the adult body and, in addition to its central metabolic function, it makes an important contribution to host defense by synthesizing several defensive molecules, including complement components and clotting factors. Importantly, the exclusive 48
58 STATE OF THE ART THE LIVER IMMUNE SYSTEM physiology and anatomy of the liver, and especially its vasculature, determine the particular immunological characteristics of this organ, which promote the constant interaction between self and non-self antigens with the immune system in its highly specific microenvironment. The liver is morphologically localized between the gastrointestinal tract and the systemic circulation. Blood from the intestines, which is rich in food antigens, environmental toxins and bacterial products, such as lipopolysaccharide (LPS) endotoxine, is collected in the hepatic portal vein; additionally, the oxygenated blood from the systemic circulation is delivered to the liver via the hepatic artery. These two blood supplies are mixed in the hepatic sinusoids, where they flow at low velocity. Liver sinusoids are lined with a specialized type of endothelial cell layer composed of liver sinusoidal endothelial cells (LSECs) that lack basement membranes but are equipped with fenestrations. Blood plasma, lymphocytes and DCs pass from the sinusoids into a sub-endothelial space, known as the space of Disse. From there, the lymph is collected and flows through lymphatic vessels to the draining lymph nodes. This organization allows the liver to carry out its functions of digestion, detoxification and synthesis of plasma proteins. In addition, the combination of the permeable endothelium and the slow blood flow distinguishes the hepatic sinusoids from other vascular organs. Importantly, it provides circulating T cells a greatest access to the different hepatic cells types and facilitates their interaction Liver immune cells The hepatic immune environment is formed by a particular composition of cells, which promote the special immune properties of the liver. Complex repertoires of lymphoid and non-lymphoid cells are fundamental to hepatic defense and immunoregulation. Intrahepatic 49
59 THE LIVER IMMUNE SYSTEM STATE OF THE ART lymphocytes are distinct both in phenotype and function from their counterparts in any other organ, which are characterized by an enrichment of activated and memory T cells. However, the innate immune system seems to be predominant in the liver immune response Innate immunity in the liver The liver serves as a physical barrier responsible for filtration of potentially harmful antigens reaching the body via the gastrointestinal tract to the systemic circulation. In addition, its constant exposure to recirculating blood increases exposure to blood pathogens and metastasizing cells. Therefore, this organ is particularly enriched in complex repertoires of immune cells capable of mediating effective surveillance and defense. Besides, all the acute phase proteins, most of the complement components and the majority of circulating growth factors and cytokines are synthesized in the liver. The special immune scenario of the liver confers the innate immune cells a particular behavior not shared in other organs. Many cells of the innate immune system express LPS receptors, which consist of TLR4 together with the CD14 and MD2 molecules. Although these cells effectively remove endotoxine, engagement of these receptors on most cell types usually delivers a strong activating signal, something that not happens in the liver, where the continuously presentation of low levels of LPS to these receptors produces an altered unresponsiveness to these signal pathways. Furthermore, in addition to LPS, the PRRs in the liver also sense the presence of other immune stimuli through TLRs, cytoplasmic nucleotide-binding oligomerization domain (NOD)-like receptors, and RNA helicases such as retinoid acid inducible protein-i (RIG-I) [180]. The activation of these receptors by continuous presence of bacterial products or by viral infection converges on two signaling pathways, the NF- B activation and nuclear 50
60 STATE OF THE ART THE LIVER IMMUNE SYSTEM localization of IFN regulatory factor 3 (IRF-3). The permanent low level stimulation of these pathways is one of the distinctive features of the liver environment and entails the hepatic immunity to favor immunological tolerance rather than immunity. Innate lymphoid cells dominate in human liver, especially those that express NK receptors. NK cells are present at higher frequency in the liver than in most tissues, constituting as many as 50% of liver lymphocytes [181]. These NK cells in the liver share similar activation and response mechanisms as elsewhere, including reaction after cytokine activation and engagement of membrane receptors. Once activated, they manifest their function through cytokine secretion and cytotoxicity. Although NK cells in the healthy human liver display surface markers indicating a high degree of activation, low amounts of activating receptors are expressed constitutively. However, liver NK cells are induced to synthesize IFN- in response to IL-12 and to execute perforin-dependent cytoxicity in response to IL-18 produced by hepatic APCs. Thus, the activating receptors can raise after diverse circumstances, such as NKG2D, which ligands include MICA and MICB, could lead in hepatocellular carcinoma [182]. The liver lymphocytes also contain an unusually high frequency of NKT cells. After their thymic generation, these cells can patrol the hepatic sinusoids due to their endogenous CXCR6 receptor [183] and through the expression of invariant TCR that binds to CD1d complexes and other ligands recognizing bacterial antigens. The liver NKT cell response, like other T cell and NK cell responses depends on resident APCs for signaling and activation. NKT cells are capable of producing both pro- and anti-inflammatory cytokines when activated, such as IFN- and IL-4 respectively [184]. Besides, just like NK cells, they exert both perforin and Fas-ligand dependent cytotoxic activities [185]. 51
61 THE LIVER IMMUNE SYSTEM STATE OF THE ART The frequency of T cells in the liver is similar to peripheral circulation, representing a minor population, approximately 3-5% of total liver cells and 15-25% of hepatic T cells. A high proportion of human hepatic T cells are V 3, a subgroup that has not been described elsewhere in the body [186]. Interestingly, the percentage of T cells increases in hepatic sinusoids and in periphery during HCV [187] and malaria [188] infections. T cells and they have also been shown to have a role in bacterial liver infections as a source of IL-17 [189]. However, it is not known by exactly which mechanisms they participate in maintaining liver homeostasis as a bridge between innate and adaptive immune responses and the role they play in liver pathologies Hepatic APCs Multiple cell populations can act as APCs in the liver distinguished by their location, specific antigen responsiveness, T cell activation abilities, and cytokine secretion profile. The DCs, the only professional APCs on a systemic level, are not the only population that harbors the capacity to engage T cells in the liver. There are specialized APCs which are found restrictively in the liver. Hepatic DCs, which contain mdcs and pdcs, seem to have a role in determining the balance between liver tolerance and immunity. They appear to be important in the establishment of oral and portal tolerance and in the pathogenesis of infectious and autoimmune liver diseases [190, 191]. Hepatic DCs are comparably less immunogenic than DCs found in other tissues due to an immature phenotype which is characterized by the lack of constitutive expression of costimulatory molecules. Nevertheless, they are capable of producing higher amounts of cytokines and carry out more phagocytosis than their counterparts in other classical lymphoid organs [192]. The pdcs are a major source of IFN-, consistent with the importance of innate 52
62 STATE OF THE ART THE LIVER IMMUNE SYSTEM immune mechanisms in the liver. In addition pdcs synthesize both IL-10 and IL-12, but harbor reduced capacity to activate allogenic T cells compared to splenic DCs [193]. The liver also contains a large macrophage population, the so called Kupffer cells, which, in addition to their phagocytic role, express MHC and co-stimulatory molecules, rendering them as potential APCs. Kupffer cells might mediate immunosuppression through their synthesis of nitric oxide and respond to TLR4 ligation by secreting IL-10 and TGF- 1 [194]. In addition, Kupffer cells can express FasL, thereby inducing apoptosis of alloreactive CD4 + T cells [195]. However, their capacity to induce T cell activation or inhibition could depend on the interactions with other liver cells, such as NK cells [196]. The liver sinusoidal endothelial cells are unusual in several aspects upon comparison to other endothelial cells. The LSECs respond to LPS via TLR4 and can acquire circulating proteins via scavenger receptors. They also express MHC class I and class II and co-stimulatory molecules including CD40, CD80 and CD86, conferring them characteristic of activated APCs [197]. LSECs might present multiple adhesion molecules, such as ICAM-1 or VCAM- 1, implicated in T cell retention in the liver sinusoids. Antigens presented by LSECs to naïve T cells fail to develop a Th1 phenotype and induce IL-4 and IL-10 cytokine production characteristic of Th2 and regulatory T cells [198, 199]. The hepatic stellate cells (HSCs) reside in the subendothelial space of Disse and regulate the hepatic sinusoidal blood flow. Together with the potential to respond to innate immune signals through their expression of TLR4, CD14 and MD2 [200], the HSCs have been shown to present lipid antigens to NKT cells in a CD1d-restricted manner. Also, they can enhance the proliferation of NKT cells by IL-15 release and present antigen using MHC class I and class II to naïve T cells [201]. Although, among the numerous APCs of the liver, HSCs seem to be the only one primarily promoting immunity over tolerance. It is conceivable that they 53
63 THE LIVER IMMUNE SYSTEM STATE OF THE ART may also exhibit tolerogenic function through converting CD4 T cells to Tregs by vitamin A derived retinoic acid and TGF- secretion [202] or expression of the negative co-stimulator PD-L1 [203] Adaptive immunity in the liver Adaptive immune cells resident to the liver differs phenotypically, functionally and perhaps even developmentally from those populations in the blood [204]. The predominance of CD8 T cells above CD4 T cells in human liver is the opposite of what is found in conventional lymphoid organs and in the blood. The percentage of activated and memory lymphocytes is much higher while naïve and resting T cells, as well as B lymphocytes are underrepresented in the liver [205]. Although the common immune activity in a healthy liver is mediated primarily by the innate immune system, the adaptive immunity, plays an important role during the resolution of viral and bacterial infections by incrementing the activation and the number of T cells. These cells are distributed through the sinusoidal spaces and also organized in small lymphoid aggregates in the portal tracts [206]. Th1 cells, primarily responsible for the initiation of cellular immune responses against intracellular pathogens, secrete IFN- in response to IL-12. Th2 cells are mainly responsible for the activation of humoral immune responses by stimulation of B cells and additionally they are responsible for the recruitment of eosinophils and granulocytes [207]. Among the intrahepatic lymphocytes Th17 cells have been shown to increase in number and to upregulate the secretion of characteristic cytokines in blood and liver tissue of patients suffering from primary biliary cirrhosis and bacterial infection [189, 208]. Furthermore, Tregs are detectable in the liver although there are fewer than in lymph nodes or in the spleen. 54
64 STATE OF THE ART THE LIVER IMMUNE SYSTEM However, upon the appearance of locally or peripherally activated CD8 T cells, the liver is capable of increasing the number of natural Tregs rapidly [209]. The frequency of natural Tregs has been shown to play a role in the liver immune response favoring tolerance or immunity against self or non-self antigens [210] T cell priming The distinctive architecture of the hepatic sinusoids permits circulating T cells to interact directly with underlying hepatocytes and other APCs, conferring the concept that the liver is a secondary lymphoid organ capable to act as a site of primary T-cell activation. The presence of all these distinct subsets of APCs in the liver increases the complexity of understanding which one is the main APC responsible of T-cell activation or inhibition. Besides this, also hepatocytes themselves could act as primary APCs in the priming of T cells [ ]. In addition to examining diverse APCs resident in the sinusoids, the antigens that are expressed in the liver might be taken up by immature DCs, and might then be presented to CD4 and CD8 T cells, either in lymphoid tissue aggregates in the portal tracts or in secondary lymphoid tissues [214]. The outcome of antigen recognition in the liver, depending on resident cell and cytokine composition, could be full T-cell activation, immune deviation leading to the differentiation of T cells to a suppressive or regulatory phenotype, or abortive activation leading to T-cell apoptosis. However, the predominantly immunosuppressive milieu of the liver entails tolerance against the antigens presented by hepatic myeloid cells. This presentation might lead to the elimination of CD4 cells secreting IFN- and the positive selection of IL-4, IL-10 and TGF- secreting/producing helper cells, as well as the induction of compromised CD8 T cells. 55
65 THE LIVER IMMUNE SYSTEM STATE OF THE ART Furthermore, circulating neutrophils and cytotoxic T cells that have been activated are attracted to the liver in an antigen-independent manner to die in a high rate by apoptosis [215]. Sequestration of distinct repertoires of innate lymphoid and myeloid cells in the liver during viral inflammation is accomplished by the upregulated expression of an extensive panel of T-cell interaction molecules, including ICAM1, MHC class II, VCAM1, costimulatory molecules of the B7 family and FAS [ ]. However, under normal conditions, liver cells also constitutively express several adhesion molecules, which could be induced by the constant infusion of LPS from the intestines [219, 220]. The expression of these molecules might modify cell trafficking, priming and the induction of tolerance in the liver Hepatic immune tolerance The special physiologic features of the liver determine their singular mechanisms of immune surveillance. While the innate and adaptive immune systems have to preserve their immunoreactivity against dangerous pathogens that infiltrate the liver, the constant immune activation for the presence of non-self antigens must be thwarted to avoid possible chronic tissue damage. This unique dualistic immunogenicity balanced to avoid the overactivation of the immune system against alloantigens confers the hepatic immune tolerance. The hepatic tolerogenic mechanisms favor that the allogenic liver graft is the most readily accepted transplanted organ, in some species even across full MHC barriers and often without or after withdrawal of immunosuppressive therapies [221]. Furthermore, hepatic tolerance may not only function locally in the liver, but also systemically. Indeed, liver allograft can facilitate the acceptance of other non-hepatic allografts from the same donor [222]. In addition, the effect of oral tolerance which is induced by oral administration of antigen, seems 56
66 STATE OF THE ART THE LIVER IMMUNE SYSTEM to be at least in part facilitated by the liver [223]. However, hepatic tolerance may also cause clinical problems: the development of chronic infections disease such as hepatitis B or C or malaria, where either the virus or the parasite persists despite the development of an immune response. Besides, several tumors or metastasize in the liver which evade the immune surveillance could be related to the tolerogenic properties of the liver. The complete understanding of these mechanisms would help to develop specific immune therapies either to augment or break the tolerance Liver transplantation tolerance Liver transplantation constitutes the best clinical proof-of-principle for hepatic immune tolerance and the bias toward immunoregulation when T cells encounter antigens in the liver. The indefinite survival of liver allografts in absence of immunosuppressive treatment can be achieved in pigs [222], rats [224] and mice [225]. In addition, the recipients can accept organs from the same donor but not from third-party, demonstrating a complete donor-specific tolerance state [226]. In the clinical experience, liver allografts report lower susceptibility to rejection in comparison to other organs. Besides, they are associated with the capacity to resist poor HLA matching, ABO incompatibility and positive cross-matches; together with lower requirements of immunosuppression treatment. Although complete immunosuppressive therapy withdrawal has been rarely performed, increasing data from accumulated experiences proves that this strategy is achievable in 20-25% of liver transplant recipients [Table 1]. These patients are therefore considered as operationally tolerant, while several explanations have been considered to explain this tolerogenic property of the liver, further research is needed to better understand the mechanisms responsible for this immunological unresponsiveness.. 57
67 THE LIVER IMMUNE SYSTEM STATE OF THE ART Publication year Author Patients number Successful weaning % Rejection % Graft lost % 1997 Mazariegos / Devlin 18 16,7 28/5,6 5, Takatsuki 26 23,8 12/ Eason 18 5,6 61/ Tryphonopoulos /1,9 0, Tisone 34 23,4 76,4/ Assy / Pons /0 0 Total Numbers ,9 0,6 Table 1: Reported cases of complete elective immunosuppression withdrawal in liver transplantation Tolerance induced by donor passenger leukocytes Solid organ transplants consist of tissue cells and non-parenchymal cells that include hematopoietic stem cells and passenger leukocytes. Donor cells including DCs, T cells, and B cells are often found within secondary lymphoid tissues after liver transplantation [227, 228]. Thus, hematopoietic stem cells might home to the recipient bone marrow, where they could give rise to donor-derived populations including DCs and T cells [229]. The tolerogenic properties of donor leukocytes were confirmed in several transplant models. Depletion of donor leukocytes by irradiation before liver transplantation was able to break spontaneous liver tolerance [230]. Besides, adoptive transfer of donor splenocytes at the time of transplantation was able to prolong allograft survival [231]. These observations led to the conclusion that liver tolerance could be the consequence of an active process mediated by donor leukocytes in recipient lymphoid tissues. Such leukocytes could induce an inappropriate activation of host T cells that eventually resulted in death by neglect related to an insufficient supply of survival cytokines [232]. 58
68 STATE OF THE ART THE LIVER IMMUNE SYSTEM The persistence of donor hematopoietic cells in the recipient following transplantation is known as chimerism. This phenomenon is often observed at low frequency (less than 1%) in long-term surviving liver transplant patients [133, 233]. Several animal models suggests that this microchimerism is required to maintain tolerance through deletion of alloreactive host T cells [234]. However, in human liver transplantation, microchimerism neither correlates with the integrity state of the graft nor identifies patients suitable for successful weaning of immunosuppression [235, 236]. Therefore, donor cell chimerism could be the consequence instead of the cause of hepatic immune tolerance [237] Tolerance induced by liver tissue Although donor passenger leukocytes could be involved in liver transplantation tolerance, the liver parenchymal tissue seems to be necessary to the final acceptance of the graft [238]. The liver tissue, composed of parenchymal and endothelial cells, is able to induce hepatic tolerance through actively neutralizing both naïve and activated/effector allogenic T cell compartments. The atypical hepatic architecture allows intimate contact between naïve circulating lymphocytes and a variety of liver cells providing the ability to act as a site of primary activation of naïve T cells [239]. The infiltration of allospecific T cells into the transplanted liver and their activation by resident Kupffer cells, LSECs, HSC and also hepatocytes evokes T-cell anergy or deletion owing their immunosuppressive co-signals such as secretion of IL- 10 and TGF- [199, 212, 240]. Additionally to the hepatic property to trap naïve T cells, the liver accumulates numerous T cells activated in the periphery undergoing apoptosis. This T cell immunoregulation displayed 59
69 THE LIVER IMMUNE SYSTEM STATE OF THE ART by liver cells led to the conclusion that parenchymal cells presenting apoptotic signals such as FasL, TRAIL or PD-L1 are implicated in the liver allograft tolerance [ ] Tolerance induced by regulatory cells The total number of DCs in a normal liver is higher than in other solid organs. However, the hepatic DCs are immature and are less immunogenic than splenic DCs. This situation links to the important role of DCs in the induction and maintenance of hepatic tolerance on a local and peripheral level [115]. Hepatic DCs express low levels of MHC class II and costimulatory molecules, which fits with their poor allostimulatory ability. Thus, hepatic DCs also secrete IL-10 [244], which adds to the hepatic environment rich in TGF- thereby inhibiting T-cell expansion and inducing delayed T cell apoptosis. Moreover, they might participate in the generation of Treg population [245]. Hepatic DCs also could participate in the induction of allograft tolerance in peripheral immune tissues. A variant of the microchimerism model suggests that DCs derived from donor hematopoietic stem cells emigrate to the thymus and serve for central deletion of recipient T cells specifically reactive against the donor [246, 247]. In addition, migration of tolerogenic hepatic DCs into secondary lymphoid tissues could induce apoptosis of alloreactive T cells and promote the development of Tregs. An active regulation by suppressor T cells could also explain the tolerance mediated by the liver [51]. However, the impact of liver transplantation on Tregs is controversial. In a animal models, it has been shown that the number of CD4 + CD25 + FOXP3 + CTLA4 + Tregs increases after liver transplantation [248]. The depletion of these cells using anti-cd25 antibodies caused acute rejection of the graft [249]. Additionally, the adoptive transfer of splenocytes from a recipient rat bearing a donor liver into another recipient rat resulted in prolonged 60
70 STATE OF THE ART THE LIVER IMMUNE SYSTEM survival of normally rejected allografts [250]. Conversely, after human liver transplantation the overall frequency of Tregs in the circulation is reduced, probably a consequence of immunosuppressive therapy. Indeed, among these cells, the biggest part express high amounts of CD127 [251], consequently, it is hard to assume that this cells subset could induce tolerance. Considering the effect on Treg numbers and activity mediated by immunosuppression, further approaches need to be investigated before correlating data from animal models to clinical transplantation Immune evasion in hepatic infections The balanced immune response of the liver promoting tolerance can be exploited in transplantation to confer allogenic acceptance, but similarly, various hepatic infections can take the advantage of this lack of effective immunity to evade the innate and the adaptive responses. While the immune system is competent to eliminate hepatitis A virus (HAV) infection, a state of persistent infection is a common outcome in hepatitis B virus (HBV) and the usual outcome in HCV infection. The mechanisms leading to the fail of liver immune responses in the defense of these well-adapted pathogens are not completely understood. Many escape mechanisms have been described in chronic HCV infection resulting in evasion of the host immune response. During HCV infection antigen specific CD8 + T cells, which play a critical role in the clearance of many viral infections, frequently display an exhausted phenotype, which is characterized by low levels of CD127 and high levels of inhibitory receptor PD-1 [252]. In addition, the liver seems to be a preferential site for inhibiting PD- 1/PD-L1 interaction, because PD-L1 is expressed on several liver cell types [253]. CD8 + T cells with exhausted phenotype are neither able to secrete IFN- nor to produce IL-2, comparable to in human immunodeficiency virus (HIV) infection [254]. 61
71 THE LIVER IMMUNE SYSTEM STATE OF THE ART Another unusual feature of the liver and especially during chronic HCV infection is the high level of the immunosuppressive IL-10, secreted by LSECs, Kupffer cells, liver pdcs and also CD4 + T cells [255]. Under conditions of chronic activation, IL-10 synthesis predominates resulting in limited tissue injury. Additionally, the continuous presence of low levels of LPS in the liver may emulate chronic inflammation, evoking IL-10 production as a regulatory response. Furthermore, chronic HCV in humans may be associated with very weak or absent CD4 + T cell responses, making these cells incapable to act as T helper cells. This state termed helpless could be linked with the low CD8 + T-cell activation during infection [256]. The liver s promotion of CD8 + T-cell helplessness can be explained by the incomplete intrahepatic T-cell priming, resulting in poor function, in comparison to lymph node priming [257]. 62
72 STATE OF THE ART MONITORING OF ALLOGENIC IMMUNERESPONSES 4.- MONITORING OF ALLOGENIC IMMUNERESPONSES 63
73 MONITORING OF ALLOGENIC IMMUNERESPONSE STATE OF THE ART Monitoring assays in transplantation The development of consistent in vitro assays that could allow for the quantification and characterization of anti-donor alloimmune responses has been promoted efficiently in clinical transplantation. Such an assay could be applied to predict specific presensitization to the transplanted tissue and to identify rejection without the need of more invasive tests. The recent progress in the understanding of transplantation biology in combination with advanced monitoring analysis to describe the immunologic response might be used to identify allogenic tolerance as well as to predict rejection. The potential information obtained from these monitoring assays could also provide a better understanding of the mechanisms underlying the generation of tolerance and rejection in clinical transplantation. A reliable index of the immune status based on biomarkers could allow for customization of the prescription of immunosuppressive drugs and would permit the partial or complete withdrawn of immunosuppressors. Furthermore, such a test would ameliorate the evaluation of tolerance induction strategies and open the door to new and better therapeutic targets. The ideal test of immunologic biomarkers would be a fast simple, highly reproducible, and inexpensive assay that requires noninvasively obtained samples, such as blood or urine, which predicts clinical outcome with notable specificity. Although the use of peripheral blood in clinical transplantation does not necessarily reflect the situation inside the graft, several studies indicated a correlation, supporting the desire for reduced biopsy frequency in the clinical follow up of the patients. Each particular monitoring assay analyzes the immune response in a different biological level. Considering the complexity of transplantation allogenic response, the combination of several tests would provide a better immune characterization. In addition, despite the constant 64
74 STATE OF THE ART MONITORING OF ALLOGENIC IMMUNERESPONSES improvements in clinical biomarker monitoring, several obstacles remain to be solved. The intra- and inter-laboratory hindrance of reproducibility is a constant factor, circumventing broad applications and pinpointing the need for robust controls. Further limitations will be hardly solved, such as the availability of donor antigens and the individualized effects of the immunosuppression agents in the monitoring assay Immune monitoring assays The immunologic analysis currently used to monitoring the cellular alloresponse in transplantation can be divided into antigen specific and antigen non-specific assays. Their different employment depends on the availability of donor antigens Antigen specific assays The application of HLA typing techniques has improved the clinical results both for longterm and early post-transplant acute rejection, especially in renal transplantation [258, 259]. However, several strategies to monitoring the allospecific response against the donor before and after the transplantation have been shown to be more powerful tools to predict rejection Mixed lymphocyte reaction Antigen specific methods generally require in-vitro stimulation known as mixed lymphocyte reaction (MLR), where responder cells from the recipient react against donor through the direct allorecognition of intact donor MHC antigens or, as a control, against third party cells. Different strategies are employed for several assays to quantify and qualify the donor response. 65
75 MONITORING OF ALLOGENIC IMMUNERESPONSE STATE OF THE ART The limiting dilution assay (LDA) has become a standard experimental tool for the evaluation of the alloresponse. Therefore, receptor cells such as unselected peripheral blood lymphocytes or purified T-cell subpopulations are co-cultured with donor stimulator cells in multiple replicates of graded dilutions. LDAs have been shown to be specific and reproducible as a means of measuring alloreactivity [260]. Different effector responses can be investigated, including alloreactive T-cell proliferation through tritiated (3H) thymidine incorporation as well as the production of different cytokines. The analysis of cytokine production may help to dissect the roles of mechanisms participating in the reaction between the donor and the receptor. Their detection could be done by enzyme linked immunoabsorvent assay (ELISA) or through flow cytometry of intracellular or secreted cytokines. Studying the kinetics of Th1 and Th2 cytokines can predict a subsequent rejection or state of tolerance [261, 262]. In addition, the carboxyfluorescein succinimidyl ester (CFSE) staining, an intracellular fluorescent label, that in each division is dispersed to the daughter cells, resulting in halved fluorescence intensity, can accurately distinguish the proliferating cells activated by the alloreactive T-cell response [29, 263]. The advantage of this method is that different phenotypically defined subsets of cells can be studied simultaneously; including regulatory T cells, evading analysis by cytokine profiling Enzyme-linked immunospot The cytokine-specific enzyme-linked immunospot (ELISPOT) assay detects and quantifies single cytokine producing cells after stimulation either in a MLR, adding alloantigens or unspecific mitogens. The secreted cytokines are detected by specific monoclonal antibodies coated to a microfilter plate and revealed by the generation of discrete spots, reflecting the number of cells with cytokine secretion. The benefit of this assay over the LDA is that results 66
76 STATE OF THE ART MONITORING OF ALLOGENIC IMMUNERESPONSES are not dependent on clonal expansion, excluding one potential variable. An additional advantage is the possibility to also detect donor antigens presented by the indirect pathway. In clinic transplantation, this assay has been used to identify the presence of donor-specific T cells in patients prior to surgery [198, 199], and additionally after the engraftment to monitor allospecific responses in tolerant patients [ ] Trans vivo DTH The trans vivo delayed-type hypersensitivity (DTH) assay consists of the injection of human peripheral blood mononuclear cells (PBMCs) from the recipient together with donor antigens into the footpad of mice. The magnitude of the resultant swelling upon comparison of allospecific responses with third party and saline controls is taken as an index of alloreactivity. The DTH assay also detects the presence of donor reactive T cells primed through the direct or indirect allorecognition, together with the property to recognize regulatory signals through neutralizing them by cytokine antibodies [267] Direct antigen detection The presence of preformed anti-hla antibodies in the recipient s serum has been recognized as a prominent risk factor associated with rejection or graft loss [268]. Recent methodology improvement using ELISA or flow cytometry assays facilitated the patients screening on transplant waiting lists to provide an estimated degree of graft allosensibility. No studies have systematically examined tolerant transplant recipients for the presence of antidonor antibodies. However, it would be predictable that the presence of allospecific antibodies would not display tolerance. In addition, tetramer staining assays consisting of four defined MHC-peptide complexes labeled with a fluorochrome can detect donor reactive cells without allospecific stimulation. 67
77 MONITORING OF ALLOGENIC IMMUNERESPONSE STATE OF THE ART These complexes have the ability to detect TCRs reactive to specific immune dominant MHC/peptide complexes. Although this technique has been particularly helpful to monitor antiviral immunity [269], it seems impractical to develop large number of tetramers capable to recognize alloreactive T cells as a biomarker Antigen non-specific assays The immunological assays based on the monitoring of recipient responses against donor specific antigens represent the ideal strategy to identify a tolerance or rejection state. However, the technical complexity of some of these assays and mainly, the limitations related to the availability of donor cells, have led to the development of alternative approaches to determine the recipient s immune status through antigen non-specific assays, either by their surface marker phenotype or by identifying a pattern associated with this particular clinical status Polyclonal T cell response This assay was ideated to monitor cell-mediated immunity in transplanted patients to reflect their global state of immunosuppression and thereby facilitate decisions of immunosuppression dosing. The commercial assay ImmunKnow is used regularly in clinical practice to measure the ATP production of CD4 + T cells by luminescence following in-vitro stimulation of peripheral whole blood with mitogens. Although this methodology could be useful to identify over-immunosuppression correlating with the risk of opportunistic infections as well as to detect high immune function to avoid a possible rejection, its application in tolerance monitoring requires greater knowledge of the graft acceptance mechanisms. 68
78 STATE OF THE ART MONITORING OF ALLOGENIC IMMUNERESPONSES TCR repertoire characterization The T cell receptor landscape (TcLand) analysis combines the analysis of the length distribution of the highly polymorphic CRD3 region with the quantification of each V family mrna in a T cell pool. This assay allows the identification of preferential expansion or repression of individual T-cell clones. The TCR repertoire perturbation could represent a specific response to donor antigens and it could contribute to the development of a fingerprint of tolerance or rejection depending on which cells are clonally altered. This assay has been shown to be useful to differentiate between tolerant recipients of renal allografts and stable patients receiving conventional immunosuppression [270]. However, the major drawback of this method is the lack of donor specificity and the possible interference with the clonal expansion due to infection Flow cytometric phenotyping The use of flow cytometry for the analysis of PBMCs employing monoclonal antibodies has been demonstrated to be a fast, easy and reproducible method for the phenotyping of large numbers of different cell subsets. The quantification and characterization of regulatory and effector cells in peripheral blood provides valuable information about the immunologic activity in transplanted patients. For example, monitoring of the different DC subsets in tolerant liver transplant recipients revealed an increase in the relative frequency of plasmacytoid DC precursors and their ratio with respect to monocytoid DC [121, 271]. Moreover, consistent with the role of regulatory cells in transplantation tolerance, an increased frequency of CD4 + CD25 high T cells in the peripheral blood was observed in tolerant children after living-donor liver transplantation. Additionally, an increase of B cells, an enhanced ratio of V 1/V 2 TCRs and decreased rates of NK and NKT cells was described [105]. Furthermore, a population of Tregs expressing CD8 + CD28 + phenotype has also been 69
79 MONITORING OF ALLOGENIC IMMUNERESPONSE STATE OF THE ART reported to be associated with a low incidence of rejection and augmented success in weaning of the immunosuppression in kidney and liver transplant patients [272] Gene expression analysis Assays for the quantification of gene expression reveal associations between the expression of certain genes and the nature of the recipient s anti-donor immune response. Gene expression profiling has been applied to graft tissue, peripheral blood cells and urinary cell RNA to predict the outcome after organ transplantation. This led to the establishment of a molecular fingerprint defining disease or tolerance. The two different strategies currently used to quantify gene expression are microarray technology and real-time PCR. The real-time PCR analysis requires a prior knowledge of the pathways involved in the alloimmune response to select suitable candidate genes. Although the technique is less suited to analyze large numbers of genes, it allows a highly precise quantification of gene expression. The application of this method to examine the role of a limited number of individual genes such as perforin, granzyme B and FOXP3 in human transplantation shown a correlation with the outcome of acute rejection after kidney and heart transplantation [ ]. Microarray analysis of gene expression offers the advantage of simultaneous assessment of several thousand genes. Since the alloimmune response is mediated by numerous mechanisms and each is potentially associated with concordant expression and co-regulation of multiple gens, this method also may suggest new mechanisms of rejection or tolerance that are not revealed by traditional hypothesis-driven approaches. Several efforts had been done to characterize kidney tolerant patients using the microarray method for the analysis of peripheral blood samples [276, 277]. The gene expression profile observed by comparison of operational tolerance to selected clinical groups included the downregulation of co- 70
80 STATE OF THE ART MONITORING OF ALLOGENIC IMMUNERESPONSES stimulatory signaling and a main role for genes associated to B cells. The here observed correct discrimination of tolerant patients from chronic rejectors with high sensitivity and specificity could provide a test to identify patients in whom immunosuppression minimization or withdrawal may be possible Gene polymorphisms and proteomics Gene polymorphisms can affect the normal activity and presence of proteins, even without changing mrna proportions. The functional variability of several regulators involved in the immune response such as cytokines, co-stimulatory molecules or their receptors have been reported to affect autoimmunity or alloimmunity [278]. For example, gene polymorphisms in CTLA4 and CCR5 were correlated with rejection and overall survival, respectively, after renal transplantation [279, 280]. In liver transplant recipients, cytokine gene polymorphisms associated with low production of TNF- and high production of IL-10 have been associated with tolerance [281]. Also, a single nucleotide polymorphism in the CTLA4 gene is related with high risk of acute rejection [282]. Although the effect of gene polymorphisms on the alloimmune response will need to be validated in large numbers of transplanted recipients before being used as a clinical test, their current detection may allow to classify the patients in rejection risk stratification. Several proteins can be generated from a single gene by posttranslational modifications. Therefore, the analysis of mrna expression alone could be insufficient to determine whether the encoded proteins are really synthesized. The protein array has been proposed to provide a high throughput approach to describe the proteomic immune response in various circumstances [283]. However, these arrays are still subject to a number of challenges that are not encountered in designing DNA arrays. As an alternative approach, mass spectrometry has been used to quantify the amount of protein that is present in the urine after renal 71
81 MONITORING OF ALLOGENIC IMMUNERESPONSE STATE OF THE ART transplantation. This contributed to the finding of a unique pattern of protein expression that distinguish between acute cellular rejection and other causes of allograft failure [284] Immune characterization of operationally tolerant graft recipients Several analytic tools have been proven useful at monitoring immunologic responses in autoimmunity diseases and transplantation in both animal models and humans. The applicability of these assays could help to predict immunologic complications after transplantation such as GVHD or rejection, facilitating an advanced clinical therapy and providing enormous benefits for the recipients. A further main goal in clinical transplantation research is to design a sensible and specific analysis to characterize immune tolerance, which should provide an informative tool to minimize or if possible complete by remove immunosuppression. However, the development of a therapeutically relevant prognostic test of tolerance has various challenges to be exceeded. Although the spontaneous long-term acceptance of transplanted organs after discontinuation of immunosuppression has been reported in kidney and liver transplantation, it constitutes a reduced proportion among the transplanted population. The exhaustive monitoring of this small number of patients to characterize the immune features responsible for this phenomenon, referred to as operational tolerance, must undergo a powerful statistical validation. In addition, other limitations as the lack of donor antigens or the nonrecommended use of graft biopsies restrict the currently available immune monitoring assays and also their application in the clinic. Furthermore, the immune mechanisms responsible for graft acceptance are not completely understood and potentially, several distinct pathways play a role. Therefore, the number of 72
82 STATE OF THE ART MONITORING OF ALLOGENIC IMMUNERESPONSES possible targets to monitor is enormous, promoting the use of assays with a large collection of markers to study at the same time. The use of microarrays for gene expression profiling of operationally tolerant patients should provide a better understanding of the basis of allograft acceptance in humans and enable the identification of novel diagnostic biomarkers to predict tolerance and new therapeutic targets to induce it Development of genomic biomarkers DNA microarray experiments in transplantation research can be focused on two different strategies as in other clinical situations [285]. The class comparison studies have the purpose to determine which genes are differentially expressed among patients with different clinical conditions, such as recipients that accept the graft without immunosuppression and those that rejected it. Secondly, class prediction studies are focused on the generation of a mathematical algorithm know as genomic classifier which is based on gene expression data. This genomic classifier is capable of accurately classifying the different patients into predefined categories. Since a whole genome microarray study in operational by tolerant patients entails a great disproportion between the massive expression data from thousands of analyzed genes and the usually limited number of samples, the experimental analysis cannot be performed employing standard statistical methods. Thus, several key steps described below should be considered in clinical studies to develop and validate a therapeutically relevant genomic classifier [286]. Nevertheless, in addition to the intrinsic challenges and limitations of microarrays, these validation strategies are frequently applied incompletely in clinical research leading to highly biased results [287]. 73
83 MONITORING OF ALLOGENIC IMMUNERESPONSE STATE OF THE ART Design of the study Translational research is usually based on incomplete understanding of biological mechanism [288]. Therefore, to develop an appropriate genomic classifier it is important to define a clear and easily verifiable clinical state as outcome. The set of patients included in the study must be well-defined and sufficiently homogeneous. Some studies are performed using convenience samples of available patients, who often are from a heterogeneous collection of patients receiving non-uniform treatments. The selection of the kind of classifier, which is most useful in the given study is the next step, once the clinical outcome and the different groups of patients are have been defined. If the number of genes is greater than the number of cases, perfect separation of the training set is always possible with a linear classifier. Many algorithms have been used effectively with DNA microarray data differing in how the informative weights are determined for each gene. All analyzed genes have a different informative weight to discriminate among the selected clinical outcomes as a function of their expression. Consequently, one crucial step in the development of a classifier is to determine which genes to include. The recommendation is to select the most informative genes which are differentially expressed between the groups and usually these represent a small proportion compared to the number of non-informative or noise genes. Including too many noise genes can dilute and reduce the accuracy of the prediction. However, based on the complexity of immunologic mechanisms, the development of classifiers with very small numbers of genes could be difficult in many cases Internal validation The main challenge in microarray methodology derives from the fact that the number of candidate genes available for use in the classifier is much larger than the number of cases 74
84 STATE OF THE ART MONITORING OF ALLOGENIC IMMUNERESPONSES available for analysis. Consequently, it exists a plausible possibility to find a classifier that accurately discriminates the data even if there is no true relationship between gene expression and outcome [289]. Several internal validation strategies usually based on the division of the data in two portions, the training set and the test set, have been proposed to avoid this phenomenon. The most straightforward method to estimate the classifiers accuracy in clinical application is the split-sample validation [290, 291]. This strategy is based on the employment of one part of the patients as training set and the other part as test set, after evaluating the adequacy of the population size of each group by statistical computation. A single fully specified prediction model is selected from the multiple classifiers emerging after studying the training set. Subsequently, the test set is used for the first time to evaluate the prediction efficiency of the classifier. The cross validation is an alternative strategy based on repeated classifier model development and subsequent testing on random data partitions [292]. One representative model is the leave-one-out cross validation (LOOCV), which also starts with defining a training set of samples as well as a test set. However, the test set here consists of only one single sample and the residual samples are used to develop the classifier as a training set. This process is repeated omitting each of the biologically independent samples from the training set, one at a time. The number of different models generated is equal to the number of samples omitted and used to predict their class. The number of prediction errors is reported as the cross-validated error rate. Although this definitive model is constructed using all the samples, their exist several levels of cross validation on the error rate estimation [293]. 75
85 MONITORING OF ALLOGENIC IMMUNERESPONSE STATE OF THE ART Assay reproducibility and platform translation Although gene expression microarrays are currently one of the most robust assays to monitor the immunologic responses, the high sensitivity of this technology to experimental noise constitutes another challenge to solve by the statistical analysis. This intra-platform variability often arises when the assays are made in different laboratories or in the same laboratory but on different batches or by different experimenters. It is important to evaluate and achieve the assay reproducibility by standardization of protocols and platform reagents [294, 295]. Microarray expression profiling is useful for screening genes to find candidates that should be included in the classifier, but the clinical application of these biomarkers rarely requires the measurement of expression for thousands of genes. The validation of microarray results on a different transcriptional platform such as real time PCR (RT-PCR) is still highly recommended. Not only to design the classifier as a future clinical tool, but also to resolve some methodological challenges of microarrays such as the lower expression specificity and the frequent problems in gene annotations [296, 297] Independent validation Although the development of a classifier using microarray data can yield an impressive accuracy in predicting the outcome, several reasons support its external validation based on truly independent data before its use in clinical application. The complexity of the highdimensional gene expression analysis must to be added to the followed lacks in the study design. The included patients in the study often are selected in a manner that may not be representative of the global clinical diversity to whom the classifier would be applied. Thus, often the initial study in which the classifier is developed will not be large enough to estimate the positive and negative predictive values of the test with sufficient precision to determine the clinical utility of the test [298]. 76
86 STATE OF THE ART MONITORING OF ALLOGENIC IMMUNERESPONSES The objective of independent validation is not to repeat the developmental study and see if the same genes are prognostic or if the same classifier is obtained. The objective is to determine whether the use of the diagnostic classifier is able to make a therapeutic decision that results in a patient benefit Functional analysis of genomic biomarkers The microarrays gene expression assay has led to a surge of new statistical methods designed to find differentially expressed genes among clinical situations. While the class prediction studies in transplantation could provide a therapeutically source of information to create a predictive tool of tolerance, the class comparison studies should represent the best option to better understand the responsible immunologic mechanisms, indicating which genes and pathways are playing a major role in tolerance and providing new therapeutic targets in transplantation. However, before the application of any functional analysis tool it is important to verify if the probe annotation, provided by the microarray platform, correlates with the supposed gene. To ensure this, bioinformatic tools should be employed [299, 300]. Several strategies have been proposed to define the principal components, such as cells and molecular pathways, related to a clinical outcome employing a pre-specified group of genes. One of the options is based on the correlation of the differential gene expression profile with various potential clinical parameters [301]. This method employs a powerful bioinformatic tool to determine the influence of the global group of selected genes and the specific weight of each probe on every clinical variable measured. The studied parameters of interest can be either a discrete variable such as presence of infection and sex, or a continuous measurement such as metabolite levels or patient age. Another group of bioinformatic strategies to further explore the functional relationship between microarray data and the clinical outcome is based on a pre-designed database where 77
87 MONITORING OF ALLOGENIC IMMUNERESPONSE STATE OF THE ART every gene is associated with a specific biological function. These computational methods could be focused on sets of related genes pre-defined based on prior biological knowledge that has established major advantages over individual gene analysis, including greater robustness, sensitivity and biological relevance [302, 303]. Other commercial applications perform the gene expression analysis by uploading the identified genes into a global molecular network map developed from published data. This method generates a network of molecular pathways that represents the biological relationship between genes and the clinical status evaluated by a statistical score [304]. 78
88 GOALS OF OUR STUDIES GOALS OF OUR STUDIES 79
89 GOALS OF OUT STUDIES The achievement of indefinite acceptance of transplanted organs with complete functional preservation in the absence of toxic immunosuppressive therapies constitutes one of the main objectives of current transplantation research. Although this phenomenon has been exhaustively reported in multiple animal models, the translation of these findings into the clinic has been hampered by immunological, clinical, commercial and ethical limitations. The best proof of principal that tolerance is indeed achievable in humans is a selected group of transplant recipients who after having discontinued immunosuppressive drugs for a variety of reason did not undergo graft rejection. These patients are considered as operationally tolerant and are particularly prevalent following liver transplantation. The mechanisms responsible for operational tolerance are however not fully understood. The principal goal of our studies has been the immune characterization of operationally tolerant liver recipients. Within this general goal, we have addressed the following specific aims: 1) To assess the relative contribution of the principal immune subpopulations in allograft acceptance and the responsibility of the different immunologic mechanisms in the tolerogenic process. 2) To identify potential biomarkers capable of accurately discriminating operationally tolerant patients from liver recipients that require ongoing immunosuppressive drug maintenance. 3) To validate a potentially diagnostic fingerprint of tolerance capable of accurately predicting the success of immunosuppression withdrawal procedures in liver transplantation. To fulfill these specific aims we have profited from previous studies conducted in experimental animal models of transplantation tolerance and some limited knowledge generated in clinical studies involving operationally tolerant recipients. Due to the higher prevalence of recipients who do not require immunosuppressive drugs, liver transplantation currently constitutes without doubt the best clinical model to investigate the mechanisms of 80
90 GOALS OF OUR STUDIES operational allograft tolerance in humans. Despite this, the special characteristics of liver recipients and their immunologic status entail several limitations in the selection of immune monitoring assays and in the specific design of the study. One of the prerequisites of our study design was to include as many tolerant recipients as possible to be able to reach reproducible statistically meaningful results. Consequently, since even in liver transplantation operationally tolerant recipients are scarce, we designed a multicentre study to recruit liver recipients from five different clinical institutions. Related to the selection of patients, a main challenge was to identify the appropriate group of control recipients to be compared with the tolerant recipients. We finally selected for this comparison a group of immunosuppression-dependent patients in whom drug withdrawal had been attempted but led to acute rejection and required reintroduction of immunosuppressive therapy. These recipients had therefore been formally proven to be non-tolerant. In addition, the study was designed to use peripheral blood as a non-invasive sample collection procedure to facilitate the methodological standardization between the centers, to cause minimal inconvenience to patients, and to increase the chances of obtaining clinically-applicable results. Although several strategies are available to monitor the immune system and its response against alloantigens, our study design and the patient characteristics circumvented the application of some of the existing assays. One of the most important limitations was the lack of donor antigens, due to the fact that the available recipients had been transplanted with cadaveric organs. Consequently, the study had to be restricted to the use non-antigen specific strategies. We also discarded methodologies that entail difficulties for standardization among different clinical centers such as polyclonal T-cell response stimulation assays. Some other antigen non-specific assays, such as Immunoscope/TcLandscape, gene polymorphism and 81
91 GOALS OF OUT STUDIES proteomic assays, were also discarded because of cost and/or doubts about their applicability to the study of immunological tolerance in humans. Our final choice was based on the following considerations: 1) previous demonstration of effective application in the clinical monitoring of alloimmune responses; 2) feasibility of using tiny amounts of biological samples; and 3) provision of a vast number of informative variables to cover the whole spectrum of immunological tolerance. Thus, we selected whole genome microarray analysis to assess the full gene expression profile of peripheral blood cells and exhaustive flow cytometric immunophenotyping of peripheral blood samples quantify the main cell subpopulations potentially involved in the maintenance of tolerance. Data analysis was particularly challenging, particularly concerning microarray expression data. To achieve accurate and reproducible expression results we included several verification strategies, such as application of internal validation bioinformatic methods, addition of an independent validation cohort of patients, confirmation of assay reproducibility over time, and reproducibility in a different transcriptional platform such as RT-PCR methodology. Furthermore, to accomplish the immune characterization of operationally tolerant liver recipients, the main objective of this study, it was necessary to analyze the complete amount of data obtained from the immune monitoring assays together with all potentially relevant clinical variables that could modify the alloimmune response, such as presence of infection diseases (e.g. hepatitis C virus), age, gender, type of immunosuppressive treatment and time elapsed since transplantation. 82
92 RESULTS AND DISCUSSION RESULTS AND DISCUSSION 83
93 RESULTS AND DISCUSSION ARTICLE 1 Multiparameter immune profiling of operational tolerance in liver transplantation 84
94 American Journal of Transplantation 2007; 7: Blackwell Munksgaard C 2006 The Authors Journal compilation C 2006 The American Society of Transplantation and the American Society of Transplant Surgeons doi: /j x Multiparameter Immune Profiling of Operational Tolerance in Liver Transplantation M. Martínez-Llordella a, I. Puig-Pey a, G. Orlando b, M. Ramoni c, G. Tisone b, A. Rimola a, J. Lerut d, D. Latinne d, C. Margarit e,, I. Bilbao e, S. Brouard g, M. Hernández-Fuentes f, J. -P. Soulillou g and A. Sánchez-Fueyo a a Liver Transplant Unit, Hospital Clinic Barcelona, IDIBAPS, University of Barcelona, Barcelona, Spain b Liver Transplant Unit, Surgical Clinic, University of Rome Tor Vergata, Rome, Italy c Children s Hospital Bioinformatics Program, Harvard Medical School, Boston, MA d Cliniques Universitaires Saint-Luc, Université Catholique de Louvain, Brussels, Belgium e Liver Transplant Unit, Hospital Vall d Hebró, Autonomous University of Barcelona, Barcelona, Spain f Department of Immunology, King s College Hospital, London, UK g INSERM U643, CHU Hotel-Dieu, Nantes, France Corresponding author: A. Sánchez-Fueyo, afueyo@clinic.ub.es Immunosuppressive drugs can be completely withdrawn in up to 20% of liver transplant recipients, commonly referred to as operationally tolerant. Immune characterization of these patients, however, has not been performed in detail, and we lack tests capable of identifying tolerant patients among recipients receiving maintenance immunosuppression. In the current study we have analyzed a variety of biological traits in peripheral blood of operationally tolerant liver recipients in an attempt to define a multiparameter fingerprint of tolerance. Thus, we have performed peripheral blood gene expression profiling and extensive blood cell immunophenotyping on 16 operationally tolerant liver recipients, 16 recipients requiring on-going immunosuppressive therapy, and 10 healthy individuals. Microarray profiling identified a gene expression signature that could discriminate tolerant recipients from immunosuppression-dependent patients with high accuracy. This signature included genes encoding for cd T-cell and NK receptors, and for proteins involved in cell proliferation arrest. In addition, tolerant recipients exhibited significantly greater numbers of circulating potentially regulatory T-cell subsets (CD4 + CD25 + T-cells and Vd1 + T cells) than either non-tolerant patients or healthy individuals. Our data provide novel mechanistic insight on liver allograft operational tolerance, and Deceased 12/9/2005 constitute a first step in the search for a non-invasive diagnostic signature capable of predicting tolerance before undergoing drug weaning. Key words: Alloimmune responses, expression profiling, liver transplantation, regulatory T cells, tolerance Received 7 June 2006, revised 7 July 2006 and accepted for publication 26 July 2006 Introduction Induction of transplantation tolerance, clinically defined as graft acceptance without functional impairment and sustained for years in the absence of chronic immunosuppression (IS), is widely regarded as a solution for the two factors currently limiting long-term allograft survival, namely irreversible chronic rejection and side effects of standard IS. Multiple therapeutical strategies are capable of achieving allograft tolerance in experimental models, usually through the combined effects of alloreactive T-cell inactivation (anergy/deletion) and regulatory T-cell promotion (1). However, most attempts at bringing these strategies into the clinic have proven unsuccessful. Liver allografts are unique in that indefinite survival in the absence of IS therapy can be achieved in most animal models (2 4). In addition, human liver allografts have a lower susceptibility to rejection than other organs (5,6), and drug-free tolerance after IS interruption occurs much more frequently in liver transplantation than in any other transplantation setting (7 11). Indeed, accumulated experiences indicate that IS can be completely withdrawn in 20% of selected liver recipients (12), and these patients are considered as operationally tolerant. A variety of different immunological mechanisms appear to contribute to the spontaneous acceptance of liver grafts (13). However, none of these mechanisms has been convincingly validated in humans yet. Thus, the elucidation of the immune status of drug-free operationally tolerant human liver recipients remains a challenging issue, both as a means to understand the mechanisms of human allograft tolerance and to identify a signature of operational tolerance in stable immunosuppressed recipients. In the current study we have hypothesized that operationally tolerant liver recipients will exhibit in peripheral blood a number of immunological features characteristic of the tolerant state. Hence, we have assessed a variety of biological traits in stable IS-free liver recipients employing both peripheral blood cell immunophenotyping and gene 309
95 Martínez-Llordella et al. expression profiling, and compared the data with results obtained in patients requiring maintenance IS. Collectively, our findings suggest that it is feasible to obtain a biological fingerprint of tolerance in peripheral blood capable of discriminating between tolerant and IS-dependent liver transplant recipients. Our results provide novel information on the mechanisms mediating operational tolerance in human liver transplantation, and constitute a first step in the generation of a predictive rule capable of identifying liver recipients who can successfully interrupt IS therapy without undergoing graft rejection. Material and Methods Patients Peripheral blood samples were collected from a cohort of 16 operationally tolerant (TOL) recipients of adult deceased donor liver transplants (>1 year of successful IS discontinuation). For comparison, blood samples were obtained from 16 liver recipients in whom drug weaning was attempted but led to acute rejection requiring reintroduction of IS (immunosuppressiondependent, ID). In ID recipients blood was recovered at least 2 years after the complete resolution of the acute rejection episode. Samples were also collected from 10 age-matched healthy controls. Clinical characteristics of patients included in the study are summarized in Table 1. The study was accepted by the Institutional Review Boards of all participating institutions, and informed consent was obtained from all patients. With the exception of three non-compliant patients, weaning was intentionally performed in all cases in a gradual manner and under strict medical supervision. A history of post-transplant lymphoproliferative disease (PTLD) was present in one patient, who was weaned from IS therapy 9 years after PTLD diagnosis, and enrolled in our study 4 years after weaning. In one patient IS was discontinued after development of a bladder transitional cell carcinoma, although blood collection was not performed until 4 years after weaning, when no evidence of carcinoma remained. Hepatitis C virus (HCV) infection was present in 59% of liver recipients. In HCV-positive patients, protocol liver biopsies were performed yearly. Grading and staging scores from the last available biopsy are displayed on Table 1. No cases of cirrhosis were detected. A report containing additional clinical data on the HCV-positive patients enrolled in the study has been recently published (11). Microarray experiments After blood mononuclear cell isolation employing a Ficoll Hypaque layer (Amersham Biosciences, Uppsala, Sweden), total RNA was extracted with Trizol reagent (Life Technologies, Rockville, MD), and the derived crna samples were hybridized to Affymetrix Human Genome U133 Plus 2.0 Array containing probes for transcripts (Affymetrix, Inc, Santa Clara, CA). The complete database comprised the expression measurements of genes for nine TOL and eight ID samples. Only those genes with at least one expression measurement above 20 were considered. This threshold was selected based on previous experiments indicating that in Affymetrix microarray assays noise is significantly more pronounced at lower absolute expression levels (14). As a result, a total of genes were included in the analysis. To identify genes differentially expressed between TOL and ID recipients, data were analyzed employing a novel methodology implemented in the program BADGE (Bayesian Analysis of Differential Gene Expression, available from (15). BADGE utilizes a Bayesian methodology for differential analysis in which the evidence of differential expression is measured by the posterior probability that fold change exceeds a fixed threshold. This posterior probability is computed based on the assumption that the distributions of gene expression data are generated by a gamma distribution and a log-normal distribution. The choice of these two distributions is in agreement with evidence provided by several authors (16,17), and by combining both, BADGE gains robustness and reproducibility (15). Microarray data validation and interpretation We performed both computational and biological validation. First, a predictive evaluation of the results obtained employing BADGE was performed using leave-one-out cross-validation (18). This technique consists of removing from the database one case at the time, estimating the model parameters from the remaining cases, and predicting the condition of the removed case on the basis of these parameters. If the condition predicted corresponds to the condition of the removed case, the prediction is considered correct. Otherwise, it is taken as incorrect. Second, direct biological validation of gene expression employing real-time polymerase chain reaction (PCR) was conducted on a selected group of 22 genes. PCR studies were extended to incorporate all 32 patients and 10 healthy individuals included in the study. For functional annotation of the genes selected as differentially expressed we queried NetAffx Analysis Center ( and employed two different annotation enrichment strategies to identify functional gene classes: Ingenuity Canonical Pathway Analysis ( and Expression Analysis Systematic Explorer (EASE; EASE provides a statistical significance of gene families identified using standardized Kyoto Encyclopedia of Genes and Genomes (KEGG) or Gene Ontology database terms, and a normalized gene enrichment score and Fisher T -test are reported for each functional category. Real-time TaqMan PCR experiments The expression pattern of a group of 22 genes selected based on either their significant differential expression in the array experiments (CD94, IL1, IL23, TNFa, ICAM1) or their well-documented relevance in immune tolerance (BAX, BCL-2, CD103, FASL, FOXP3, GITR, GZMB, TIM1, TIM3, HO1, IFNc, IL10, IL15, TGFb1, A20, PRF1, IL6), was quantified employing the ABI 7900 Sequence Detector System and Assays-on-Demand primer/probe sets (PE Applied Biosystems, Foster City, CA). For these studies total RNA was treated with DNAse reagent (Ambion, Austin, TX), and reverse transcription performed using Multiscribed Reverse Transcriptase Enzyme (PE Applied Biosystems). To quantify the levels of mrna we normalized the expression of the target genes to the housekeeping gene 18S, and data were expressed as relative fold difference between cdna of the study samples and a calibrated sample. The Mann Whitney test was employed to compare mrna levels between two groups. In the case of IL6 expression a log transformation was first performed to reduce the positive skew. Flow cytometry immunophenotyping The following fluorescent antibodies were employed for immunophenotyping: CD3, CD4, CD8, CD19, CD11c, CD14, CD20, CD28, CD45RA, CD62L, CD123, HLA-DR, ab-tcr, cd-tcr, Vd1-TCR (from BD Biosciences, Mountain View, CA), and Vd2-TCR, Va24-TCR (from Beckman Coulter, Fullerton, CA). For staining, aliquots of 100 ll of EDTA-anticoagulated blood were incubated at room temperature for 15 min with a combination of the appropriate antibodies (Table 2). For CD4 + CD25 + T-cell staining, CD25 high cells were selected based on the fluorescent intensity of the CD25 marker observed in three different cord blood samples, as previously reported (19). Intracellular Foxp3 staining was performed on Ficoll-isolated peripheral blood mononuclear cells according to the manufacturer s instructions (Treg staining kit, ebioscience, San Diego, CA). Stained samples were analyzed using a FACScalibur flow cytometer with Cellquest Pro software (BD Biosciences). Comparisons between two groups were performed employing the Mann Whitney test. To assess the reproducibility of all immunophenotyping studies, analyses were duplicated on two blood samples obtained with a 2-month difference. 310 American Journal of Transplantation 2007; 7:
96 Table 1: Patient clinical data Operational Tolerance in Liver Transplantation Healthy individuals TOL recipients (n = 16) ID recipients (n = 16) (n = 10) p-value Median age (years) NS Original liver disease HCV cirrhosis (8) HCV-positive cirrhosis (12) Alcoholic cirrhosis (3) Alcoholic cirrhosis (3) Caroli s disease (1) Acute liver failure (1) Haemangioendothelioma (1) HBV cirrhosis (2) Acute liver failure (1) Reason for IS withdrawal Drug toxicity (4) Drug toxicity (6) Non-compliance (3) HCV infection (10) HCV infection (7) PTLD (1) Bladder transitional cancer (1) Median time from transplantation (years) 11 (6 16) 8.3 (2.5 14) Median time from IS resumption (years) 4 (2 6) Median time from weaning (years) 4 (1 6) HCV infection (at the time of analysis) 56% 62.5% NS Grading 4 (3 4) 4 (1 6) NS Staging 2.5 (1 5) 1 (0 5) NS IS treatment Tac (33%)MMF (33%)CsA (33%) Liver function tests AST (UI/L) NS ALT (UI/L) NS Bilirubin (mg/dl) NS Institution 25% UCL; 44% UTV; 63% UTV; 37% HCB HCB 19% HCB; 12% HVH NS = not significant; UCL = Université Catholique de Louvain; HCB = Hospital Clinic Barcelona; HVH = Hospital Vall d Hebró Barcelona; UTV = University Tor Vergata Rome; IS = immunosuppression; PTLD = post-transplant lymphoproliferative disease; HCV = hepatitis C virus; HBV = hepatitis B virus; Tac = tacrolimus; CsA = cyclosporine A; MMF = mycophenolate. The most recent liver biopsy from each HCV-positive recipient was scored according to Ishak classification (40). The necro-inflammatory activity was scored on a scale from 0 to 18, while fibrosis was scored on a scale from 0 to 6. Results Global gene expression profiling can discriminate between TOL and ID recipients With an expected false-positive rate of 1%, BADGE analysis selected the genes with more than 99.5% and less than 0.5% chances of being more expressed in TOL as compared to ID recipients (Figure 1A). This resulted in a total of 462 positively and 166 negatively changed genes. A color map of the selected genes is displayed in Figure 1B. A complete list of the selected genes is available from Computational validation employing leave-one-out cross-validation resulted in an accuracy of 94.12%, indicating that the model generated utilizing BADGE could very precisely discriminate between TOL and ID samples. The array results were further validated by employing real-time PCR to quantify the expression of a selected group of 22 genes (results for the differentially expressed CD94, IL1, IL23, ICAM1 and TNF-a genes are shown in Figure 1C; in agreement with the array data, no differences between TOL and ID samples were found in the expression of the remaining 17 genes). Real-time PCR studies were extended to include the whole series of 16 TOL, 16 ID recipients and 10 healthy controls, confirming the expression trends revealed by the arrays (data not shown), with the exception of IL6, which was found to be significantly up-regulated in ID patients (Figure 2B). Ingenuity Pathway Analysis identified 10 canonical pathways that were more significant to the complete data set (Table 3), while functional classification employing EASE identified 11 and 3 functional groups among up-regulated and down-regulated genes, respectively (Table 4). Markers of proliferative arrest and gammadelta (cd) T-cell function distinguish TOL recipients Among the 462 genes significantly up-regulated in TOL samples, some of the strongest associations corresponded to cd T-cell-specific transcripts: T-cell receptor delta locus, soluble T-cell receptor delta chain and T-cell receptor delta diversity 3 (probability value of being upregulated in TOL: , and , respectively). In addition, a significant enrichment for natural killer (NK) receptors was detected. This group of genes included those encoding for CD94, NKG2D-II, NKG7, KLRC2, BY55 (CD160), KLRB1 and KLRC1. Functional classification also American Journal of Transplantation 2007; 7:
97 Martínez-Llordella et al. Table 2: Immunophenotyping studies Lymphocytes Lymphocytes Memory T cells Dendritic cells CD3 + T cells CD3 + CD4 + T cells Effector memory: pdc: CD19 + B cells CD3 + CD8 + T cells CD62L CD45RA + CD4 + T cells CD3 CD14 CD19 CD20 CD3 + CD56 + NKT cells CD3 + CD4 CD8 T cells CD62L CD45RA + CD8 + T cells HLA-DR + CD11c CD123 + CD3 CD56 + NK cells Central memory: mdc: CD62L + CD45RA CD4 + T cells CD3 CD14 CD19 CD20 CD62L + CD45RA CD8 + T cells HLA-DR + CD11c + CD123 Potentially regulatory T cells Naïve T cells ab and cdt cells CD4 + CD25 + T cells CD45RA + CD62L + CD4 + abtcr + T cells CD4 + CD25 + CD62L + T cells T cells cdtcr + T cells CD4 + CD25 + Foxp3 + T cells CD45RA + CD62L + CD8 + cdtcr + CD4 CD8 T cells CD4 + Foxp3 + T cells T cells d1 + TCR + CD3 + T cells abtcr + CD4 CD8 T cells d2 + TCR + CD3 + T cells Va24 + CD3 + CD56 + NKT cells CD8 + CD28 T cells identified a cluster of 18 genes that encode for proteins participating in the regulation of transcription, mostly as transcription activators (GTF2A2, NFATC3, MAXD4, CRSP6, POLR3H, ASCC1, TAF1) but also as transcription suppressors (SMAD2, MBD2-interacting zinc finger protein). Not surprisingly, the expression levels of transcripts involved in IL2 receptor signaling (SOS-1, BCL-XL, AIOLOS, JAK1, IL2RB) were also increased in TOL samples. Additional clusters contained genes associated with mrna processing, protein biosynthesis (including genes encoding for translation factors and ribosomal proteins), DNA repair and a variety of cellular metabolic pathways (Tables 3 and 4). A statistically significant association with tolerance was also noted in the case of transcripts involved in cell cycle control (RAD21, RAD50, RAD52, PMSL3, UHMK1) and in the suppression of cell proliferation (RBBP9, APRIN, PML, GCIPinteracting protein p29, l (3)mbt-like, TES, MATK, RASA3 and TUSC1). Overall, these data indicate that, as compared to ID recipients, TOL individuals exhibit a gene expression signature characterized by up-regulation of genes involved in transcription, translation and protein synthesis, as well as genes participating in cell proliferation arrest. In addition, the array results suggest a potential role for cdt cells and NK receptors in the maintenance of liver allograft tolerance. Over-expression of immune activation genes characterizes HCV-positive ID recipients A significant enrichment of genes expressed during cellular stress and inflammatory responses was noted in the blood of ID recipients (Figure 2A). The most representative of these genes were those encoding for pro-inflammatory cytokines (IL1, TNF-a, IL23, TNFAIP6, corticotrophin), complement and coagulation cascades (thrombomodulin, urokinase, urokinase receptor, DAF, thromboplastin, PTX3), MAP kinase signaling pathway (Tp12/cot, CrkII, TNFa, IL1, GADD45), chemokine/chemokine receptors (CXCL1, CXCL2, CXCL3, CCL20, CCL4, BSF3) and immune activation/co-stimulatory membrane receptors (ICAM1, CD83). Further analyses taking into consideration the absence or presence of HCV infection revealed that the strong association between ID and inflammatory responses was mostly restricted to samples obtained from HCV-positive recipients (Figure 2A, B). Although HCV infection promoted the expression of certain pro-inflammatory genes in TOL recipients as well, this effect was significantly less marked than in ID patients (Figure 2A, B). In addition, only HCV-positive ID recipients consistently exhibited significantly greater expression levels of pro-inflammatory genes than healthy individuals (Figure 2B). Altogether, expression profiling suggests that maintenance IS is associated with the up-regulation of a wide variety of inflammatory mediators in peripheral blood of HCV-positive liver recipients. Peripheral blood cd T cells are increased in TOL recipients as compared to ID patients or healthy controls In order to confirm at the protein level the up-regulated expression of genes encoding for the cd T-cell receptor (TCR), we quantified the proportion and absolute numbers of peripheral blood cdt cells in all 42 individuals included in the study. TOL recipients exhibited significantly greater numbers of CD3 + TCRcd + T cells than either ID recipients or healthy individuals (Figure 3A). We also examined the proportion of the two main CD3 + TCRcd + T-cell subsets, namely Vd1 + and Vd2 +. In contrast to both ID recipients and control individuals, the Vcd1 + subtype was found to be the predominant cdt-cell subpopulation in TOL recipients (Figure 2B), indicating that in TOL patients the cd T-cell compartment is both quantitatively and qualitatively altered. No differences between HCV-positive and -negative recipients were detected (data not shown). TOL recipients display an increased proportion of CD4 + CD25 + potentially regulatory T cells In most experimental systems tolerance induction requires a substantial reduction in the pool of alloreactive effector T cells and/or an increase in the graft-protecting effects of 312 American Journal of Transplantation 2007; 7:
 Distribution of the posterior probability of being differentially expressed for each gene in the dataset. Red arrows indicate the genes with more than 99.5% and less than 0.")
98 Operational Tolerance in Liver Transplantation Figure 1: Microarray gene expression profiling can discriminate between TOL and ID recipients. (A) Distribution of the posterior probability of being differentially expressed for each gene in the dataset. Red arrows indicate the genes with more than 99.5% and less than 0.5% chances of being more expressed in TOL as compared to ID recipients. (B) Expression profiles of 628 genes differentially expressed between TOL and ID recipients (9 and 8, respectively). Results are represented as a full-matrix view of gene expression data where rows represent genes, and columns represent recipient samples. The intensity of each color denotes the standardized ratio between each value and the average expression of each gene across all samples. Yellow colored pixels correspond to an increased abundance of the messenger RNA in the indicated blood sample, whereas blue pixels indicate decreased RNA levels. (C) Real-time PCR validation of the microarray expression data performed for five differentially expressed genes (CD94, IL1, IL23, ICAM1 and TNF-a). These PCR experiments were performed on the same set of TOL and ID samples employed for microarray profiling without stratifying for HCV status. immunoregulatory lymphocytes. In the current study we employed the CD45RA and CD62L markers to define the memory/naïve phenotype of T cells. No significant differences were observed between TOL and ID recipients in effector memory, central memory, or naïve T cells (data not shown). Next, we investigated the frequency of peripheral blood cell subtypes with a potentially regulatory phenotype. TOL and ID recipients did not differ in the proportion of CD8 + CD28,Va24+ NKT and TCRab + CD4 CD8 T cells (data not shown). TOL, ID and healthy controls also had similar numbers of peripheral blood NK and B cells. In contrast, TOL recipients displayed a significant increase in the proportion of CD4 + CD25 high CD62L high T cells as compared to both ID recipients and healthy American Journal of Transplantation 2007; 7:
99 Martínez-Llordella et al. Table 3: List of top 10 canonical pathways (Ingenuity Pathway Analysis) NF-jB signaling PDGF signaling IL-6 signaling EGF signaling IL-2 signaling G-protein-coupled receptor signaling Fatty acid metabolism Valine, leucine and isoleucine biosynthesis Glutathione metabolism Interferon signaling controls (Figure 3C). Differences in the absolute numbers were equally significant, and these differences were not modified by the presence or absence of HCV infection (data not shown). A very good correlation was found between the proportion of CD4 + CD25 high CD62L high T cells and that of CD4 + intracellularly expressing the regulatory T-cell-specific transcription factor Foxp3 + (Figure 3D; left panel). Thus, despite the absence of differences between TOL and ID samples in Foxp3 gene expression, TOL recipients exhibited higher CD4 + Foxp3 + T-cell numbers than ID patients. On the other hand, no differences in the proportion of CD4 + Foxp3 + T cells were observed between TOL and control samples (Figure 3D; right panel). For all immunophenotyping studies, differences between TOL, ID and healthy individuals could be replicated in the two blood samples analyzed for each patient (data not shown). Peripheral blood dendritic cell subset analysis does not differentiate TOL from ID recipients Dendritic cells (DC) constitute a critical checkpoint in the decision between immunity and tolerance, and variations in the number and phenotype of peripheral blood DC subsets have been linked to a variety of clinical conditions, including transplantation tolerance (20). In our study we investigated whether quantification of plasmacytoid and myeloid DC subsets (pdc and pdc, respectively) could be used to identify liver allograft tolerance. Our findings indicate that both the relative/absolute numbers of pdc and mdc, and the ratio of pdc/mdcs are similar among all patient groups analyzed (Figure 3E). Discussion The immune characterization of operational tolerance in liver transplantation has been hampered by: (a) the paucity of tolerant recipients; (b) the lack of pertinent non-tolerant controls and (c) the multiplicity of mechanisms involved in the maintenance of allograft tolerance. In the current study we have enrolled a unique cohort of 16 TOL patients gathered from an international clinical consortium, and have assessed different immunological variables to define a multiparameter fingerprint of tolerance. In contrast to previous studies, we have restricted our analysis to adult liver recipients, and have employed for comparison both agematched stable non-tolerant recipients in whom tolerance had been formally excluded by a prior attempt at IS weaning, and age-matched healthy individuals. In addition, we have contrasted for the first time global gene expression profiles obtained from peripheral blood of tolerant and nontolerant recipients. While peripheral blood might not be the optimal tissue source to dissect the molecular mechanisms responsible for allograft tolerance, the use of noninvasive blood monitoring has obvious clinical advantages, and it has been widely validated for diagnostic purposes in transplantation studies employing both immunophenotyping and gene expression profiling (21 24). The same reasons apply to the use of PBMCs instead of selected Table 4: Functional classification of differentially expressed genes Functional Category EASE score (p-value) Number of genes Representative genes Up-regulated genes in TOL Transcription regulation SMURF1, SMAD2, POLR3H, NFAT3, PML, RAB DNA metabolism BLM, DHX9, ATRX DNA repair and cell cycle control RAD21, RAD50, RAD52, SYNPO2L mrna processing SF3B1, CUGBP1, RBPMS GTPase activity GNA11, RAP2A, RAB38 Cadherin PCDHGB5, PCDHGA12, PCDHGB1 Protein biosynthesis EIF2S1, EIF5B, RPL14 and RPS6, UBC. Response to external biotic stimulus CD160, KLRC1 (NKG2A), KLRC4 (NKG2F), KLRC3 (NKG2E), KLRD1 (CD94), KLRC2 (NKG2C), KLRB1, Klrk1 (NKG2D) Proteolysis USP34, USP10, USP30 Protein kinase activity PKC, JAK1, ROCK2, MATK, TAOK2 G-protein coupled receptor activity PTGDR, OR13C4, GPR114, FZD4, GPBAR1 Down-regulated genes in TOL Response to stress F3, DAF, CD83, PLAUR, SDC4,TNFa Transcription regulation RELB, MAFG, NR4A3, NFKB2 Inflammatory response CXCL1, CXCL2, TNFAIP6, CCL20, CXCL3, CXCL4 314 American Journal of Transplantation 2007; 7:
 Enlarged microarray color map involving a selected group of differentially expressed genes with samples grouped on the basis of both TOL/ID status and HCV positivity.")
100 Operational Tolerance in Liver Transplantation Figure 2: Up-regulation of pro-inflammatory genes is mainly restricted to HCV-positive recipients. (A) Enlarged microarray color map involving a selected group of differentially expressed genes with samples grouped on the basis of both TOL/ID status and HCV positivity. (B) Real-time PCR gene expression quantification of pro-inflammatory genes performed on 16 TOL, 16 ID and 10 healthy individual peripheral blood samples with results stratified on the basis of HCV infection status. blood cell populations, especially considering previous reports in which a variety of different cell populations have been correlated with immune tolerance and/or graft acceptance (19,20,23,24). The experiments employing oligonucleotide microarrays and real-time PCR reported here demonstrate for the first time the feasibility of utilizing global gene expression profiling and peripheral blood to non-invasively discriminate between TOL and ID liver transplant recipients. In addition, functional annotation of microarray data gives rise to the following potentially interesting observations. Overall, differentially expressed genes can be clustered into three main categories. The first one comprises genes American Journal of Transplantation 2007; 7:
101 Martínez-Llordella et al. Figure 3: Increased proportion of CD4 + CD25 + and cd T cells characterize TOL recipients. (A) TOL recipients display an increased proportion of peripheral blood CD3 + TCRcd + T cells than either ID patients or healthy individuals. (B) In TOL recipients Vd1 + /Vd2 + cdt-cell ratio is greater than in either ID recipients or healthy controls. (C) TOL recipients exhibit a greater proportion of CD4 + CD25 + CD62L high peripheral blood T cells than either ID or healthy controls. (D) Most CD4 + CD25 +, but very few CD4 + CD25, T cells express intracellular Foxp3 (left panel). Accordingly, TOL recipients display a greater proportion of CD4 + Foxp3 + T cells than ID recipients (right panel). (E) Increased pdc/mdc ratio fails to identify TOL recipients. 316 American Journal of Transplantation 2007; 7:
102 Operational Tolerance in Liver Transplantation involved in IL2 signaling, transcriptional regulation and protein biosynthesis. Up-regulated expression of these genes in TOL recipients most likely reflects the use of IS drugs by ID recipients. This is supported by reports addressing the effect of calcineurin inhibition on lymphocyte gene expression profiles (25 27). The second category consists of pro-inflammatory genes exhibiting marked overexpression on HCV-positive recipients. Microarrays have been previously employed to analyze intrahepatic gene expression profiles in HCV infection following transplantation, revealing significant up-regulation of genes involved in oxidative stress, inflammation, T-cell activation, matrix degradation/fibrogenesis and apoptosis (28 30). However, the influence of both HCV infection and pharmacological IS on peripheral blood gene expression patterns had not been previously explored. Our results indicate that in TOL recipients in whom successful withdrawal of all IS drugs is accomplished, marked down-regulation of proinflammatory genes in peripheral blood is noted. This information goes along with a recent report by our group at University Tor Vergata, showing that IS weaning results in improved HCV-related graft disease progression (11,12). Collectively, these findings raise the hypothesis that complete withdrawal of maintenance IS after liver transplantation may ameliorate both HCV-related inflammatory responses and histological liver damage, although we cannot exclude the possibility of this effect being a direct consequence of the same immune mechanisms responsible for the tolerant state. Elucidation of this question requires prospective validation in liver recipients selected for weaning and assessed before IS discontinuation is attempted. Furthermore, our results imply that viral-induced chronic inflammation might not necessarily preclude the development of operational tolerance after liver transplantation, at least when it arises from the withdrawal of standard IS regimens. Finally, we can identify a third category of differentially expressed genes that appear to be specifically related to the tolerant state. This group includes genes encoding for cd T-cell and NK receptors, genes known to regulate mitosis and inhibit cell proliferation, and other genes such as CD9 or members of the cadherin family, whose expression does not appear to be dependent on either HCV infection or IS treatment. A number of these tolerance-specific genes appear to be either regulated by TGF-b or implicated in TGF-b signaling pathways (SMAD2, SMURF1, CD9, NK receptors) (31 33). Interestingly, up-regulation of genes functionally involved in cell cycle control and cell proliferation arrest, as well as genes encoding for CD9, NK receptors and proteins involved in TGF-b signaling, have also been reported in operationally tolerant kidney recipients, as compared to either nontolerant recipients or healthy individuals (S. Brouard et al. submitted). cd T cells are non-conventional T cells that participate in both innate and adaptive immunity as cytolytic effector cells, but that are also involved in immunoregulatory responses. Among cd T cells, the Vd2 + subtype is the predominant subpopulation in peripheral blood of healthy adults, often representing more than 70% of circulating cd T cells (34). In contrast, the Vcd1 + subtype preferentially populates epithelial tissues such as the intestine, where it has been implicated in local immunoregulatory processes, most likely through the killing of either effector T cells, antigen-presenting cells or stressed epithelial cells (35). Our study indicates that in the peripheral blood of adult operationally tolerant liver recipients there is an expansion of Vd1 + T cells, which results in an increased number of total cdt cells and in the reversal of the normal ratio of Vd1 + /Vd2 + subsets. Vcd1 + T cells typically express the activating NK receptors NKG2D and CD160, which contribute to promote their cytolytic effector function (35). Thus, over-expression of NKG2D, CD160, and genes encoding for other NK receptors, in TOL samples very likely reflects the preferential expansion of Vcd1 + T cells. Reassuringly, reversal of the peripheral blood Vd1 + /Vd2 + cdt cell ratio has been recently reported in allograft tolerance following pediatric living donor liver transplantation (19). In addition, our results suggest that, together with Vcd1 + T cells, CD4 + CD25 + T cells might also facilitate the successful discontinuation of IS therapy after liver transplantation. This adds to previous studies highlighting the potential relevance of CD4 + CD25 + regulatory T cells in the acceptance of liver and kidney allografts (19,23,24,36). Interestingly, both CD4 + CD25 + regulatory T cells and Vd1 + - like T cells are involved in the induction of liver allograft tolerance in rodents (37 39). On the other hand, and in contrast to a recent publication concerning pediatric tolerant liver recipients (20), our data do not lend support to the use of peripheral blood pdc/mdc as a diagnostic test for tolerance in adult liver transplantation. Whether TOL and ID recipients may differ in the activation status or functional properties of DC subsets remains to be determined. In short, our study indicates that non-invasive identification of tolerant liver transplant recipients employing peripheral blood and gene expression profiling is feasible. Although our data cannot be directly employed to diagnose tolerance in patients receiving maintenance IS, prospective validation of our findings in an independent group of patients before undergoing IS weaning will very likely provide us with a clinically applicable algorithm capable of predicting the success of such procedures. In addition, our study offers novel insight on the pathogenesis of HCV-mediated liver damage after transplantation, suggesting that IS-induced non-specific inflammation may be related to the worsened prognosis of HCV-related liver disease. Our data also indicate that future attempts at employing gene expression profiling to dissect the immunological signature of tolerance will necessarily require patient stratification on the basis of HCV infection status. American Journal of Transplantation 2007; 7:
103 Martínez-Llordella et al. Acknowledgments This work was supported by a grant from the Ministerio de Educación y Ciencia, Spain (reference SAF to A.S-F.). JL was recipient of a grant from the Belgian FRSM (reference to JL), and IP-P was supported by a fellowship from the Societat Catalana de Transplantament. We thank Pedro Jases for his technical assistance in the performance of the microarray experiments and Dr. R. Barragan for providing us with the cord blood samples. References 1. Zheng XX, Sanchez-Fueyo A, Domenig C, Strom TB. The balance of deletion and regulation in allograft tolerance. Immunol Rev 2003; 196: Kamada N, Calne RY. A surgical experience with five hundred thirty liver transplants in the rat. Surgery 1983; 93: Kamada N. Animal models of hepatic allograft rejection. Semin Liver Dis 1992; 12: Qian S, Demetris AJ, Murase N, Rao AS, Fung JJ, Starzl TE. Murine liver allograft transplantation: tolerance and donor cell chimerism. Hepatology 1994; 19: Rydberg L. ABO-incompatibility in solid organ transplantation. Transfus Med 2001; 11: Chen M, Wade J, Levy GA, Greig PD. Effect of HLA matching and T- and B-cell crossmatch on acute rejection and graft survival following liver transplantation. Transplant Proc 1994; 26: Devlin J, Doherty D, Thomson L et al. Defining the outcome of immunosuppression withdrawal after liver transplantation. Hepatology 1998; 27: Mazariegos GV, Reyes J, Marino IR et al. Weaning of immunosuppression in liver transplant recipients. Transplantation 1997; 63: Pons JA, Yelamos J, Ramirez P et al. Endothelial cell chimerism does not influence allograft tolerance in liver transplant patients after withdrawal of immunosuppression. Transplantation 2003; 75: Takatsuki M, Uemoto S, Inomata Y et al. Weaning of immunosuppression in living donor liver transplant recipients. Transplantation 2001; 72: Tisone G, Orlando G, Palmieri G et al. Complete weaning off immunosuppression in HCV liver transplant recipients is feasible and favourably impacts on the progression of disease recurrence. J Hepatol 2006; 44: Lerut JP, Sanchez-Fueyo A. An appraisal of tolerance in liver transplantation. Am J Transplant 2006; 6: Sanchez-Fueyo A, Strom TB. Immunological tolerance and liver transplantation. J Hepatol 2004; 41: Butte AJ, Ye J, Haring HU, Stumvoll M, White MF, Kohane IS. Determining significant fold differences in gene expression analysis. Pac Symp Biocomput 2001; Sebastiani P, Jeneralzuk J, Ramoni M. Design and analysis of screening experiments with microarrays. In: Dean A, Lewis S, eds. Screening. New York: Springer, West M, Blanchette C, Dressman H et al. Predicting the clinical status of human breast cancer by using gene expression profiles. Proc Natl Acad Sci USA 2001; 98: Newton MA, Kendziorski CM, Richmond CS, Blattner FR, Tsui KW. On differential variability of expression ratios: improving statistical inference about gene expression changes from microarray data. J Comput Biol 2001; 8: Simon R. Roadmap for developing and validating therapeutically relevant genomic classifiers. J Clin Oncol 2005; 23: Li Y, Koshiba T, Yoshizawa A et al. Analyses of peripheral blood mononuclear cells in operational tolerance after pediatric living donor liver transplantation. Am J Transplant 2004; 4: Mazariegos GV, Zahorchak AF, Reyes J et al. Dendritic cell subset ratio in peripheral blood correlates with successful withdrawal of immunosuppression in liver transplant patients. Am J Transplant 2003; 3: Flechner SM, Kurian SM, Head SR et al. Kidney transplant rejection and tissue injury by gene profiling of biopsies and peripheral blood lymphocytes. Am J Transplant 2004; 4: Horwitz PA, Tsai EJ, Putt ME et al. Detection of cardiac allograft rejection and response to immunosuppressive therapy with peripheral blood gene expression. Circulation 2004; 110: Louis S, Braudeau C, Giral M et al. Contrasting CD25hiCD4+T cells/foxp3 patterns in chronic rejection and operational drugfree tolerance. Transplantation 2006; 81: Baeten D, Louis S, Braud C et al. Phenotypically and functionally distinct CD8+ lymphocyte populations in long-term drug-free tolerance and chronic rejection in human kidney graft recipients. J Am Soc Nephrol 2006; 17: Cristillo AD, Bierer BE. Identification of novel targets of immunosuppressive agents by cdna-based microarray analysis. J Biol Chem 2002; 277: Feske S, Giltnane J, Dolmetsch R, Staudt LM, Rao A. Gene regulation mediated by calcium signals in T lymphocytes. Nat Immunol 2001; 2: Diehn M, Alizadeh AA, Rando OJ et al. Genomic expression programs and the integration of the CD28 costimulatory signal in T cell activation. Proc Natl Acad Sci USA 2002; 99: Lau DT, Luxon BA, Xiao SY, Beard MR, Lemon SM. Intrahepatic gene expression profiles and alpha-smooth muscle actin patterns in hepatitis C virus induced fibrosis. Hepatology 2005; 42: Bigger CB, Guerra B, Brasky KM et al. Intrahepatic gene expression during chronic hepatitis C virus infection in chimpanzees. J Virol 2004; 78: Smith MW, Walters KA, Korth MJ et al. Gene expression patterns that correlate with hepatitis C and early progression to fibrosis in liver transplant recipients. Gastroenterology 2006; 130: Eriksson M, Meadows SK, Wira CR, Sentman CL. Unique phenotype of human uterine NK cells and their regulation by endogenous TGF-beta. J Leukoc Biol 2004; 76: Bellone G, Aste-Amezaga M, Trinchieri G, Rodeck U. Regulation of NK cell functions by TGF-beta 1. J Immunol 1995; 155: Yamashita M, Ying SX, Zhang GM et al. Ubiquitin ligase Smurf1 controls osteoblast activity and bone homeostasis by targeting MEKK2 for degradation. Cell 2005; 121: Parker CM, Groh V, Band H et al. Evidence for extrathymic changes in the T cell receptor gamma/delta repertoire. J Exp Med 1990; 171: Hayday A, Tigelaar R. Immunoregulation in the tissues by gammadelta T cells. Nat Rev Immunol 2003; 3: Yoshizawa A, Ito A, Li Y et al. The roles of CD25 + CD4 + regulatory T cells in operational tolerance after living donor liver transplantation. Transplant Proc 2005; 37: Li W, Zheng XX, Perkins J. CD25 + regulatory T cells are involved in liver transplant tolerance induction in mice (abstract). Am J Transplant 2004; 4: Fujino M, Kitazawa Y, Kawasaki M et al. Differences in lymphocyte 318 American Journal of Transplantation 2007; 7:
104 Operational Tolerance in Liver Transplantation gene expression between tolerant and syngeneic liver grafted rats. Liver Transpl 2004; 10: Okabe K, Yamaguchi Y, Takai E et al. CD45RC gammadelta T- cell infiltration is associated with immunologic unresponsiveness induced by prior donor-specific blood transfusion in rat hepatic allografts. Hepatology 2001; 33: Ishak K, Baptista A, Bianchi L et al. Histological grading and staging of chronic hepatitis. J Hepatol 1995; 22: American Journal of Transplantation 2007; 7:
105 RESULTS AND DISCUSSION DISCUSSION The immunologic characterization of tolerance has been a main objective in human transplantation research for the last decades. However, several difficulties interfered with a consistent monitoring of operational tolerance in liver recipients. Our study was designed to resolve some of these limitations, constituting a relevant precedent in this experimental field. In contrast to previous studies, we enrolled age-matched adults in the defined groups to exclude differences in the immune system as a consequence of patient age. In addition, the included non-tolerant controls defined as recipients in whom the attempted withdrawal of immunosuppression failed, represent the optimal approach for the evaluation of operational tolerance reported until the moment. Allograft acceptance has been associated with multiple molecular mechanisms and several cell populations seem to be involved. For that reason, our study has been designed to employ methodologies to screen the greatest number of immunological variables. The analysis of PBMCs, instead of selected cell populations, provides a non-restricted description of the involved mechanisms. Furthermore, the use of peripheral blood samples to perform our study represents an evident advantage for patient safety and clinical applicability. The reported results in this study demonstrate for the first time the feasibility of using global gene expression profiling and peripheral blood samples to discriminate between tolerant and immunosuppression-dependent (non-tolerant) liver recipients. These findings represent the most significant contribution to the exploration of tolerance in the field of clinical liver transplantation. In addition, the bioinformatic analysis of gene expression provides a potential source of information to define the mechanisms involved in allograft acceptance. In the microarray analysis three major cellular functions related to the immune response showed altered expression patterns. Tolerant recipients exhibited an up-regulation of genes 96
106 RESULTS AND DISCUSSION implicated in IL2 signaling, transcriptional regulation and protein biosynthesis. The differential expression of this category of genes reflects the absence of effects caused by immunosuppressive agents in tolerant patients. Calcineurin inhibitors antagonize the generation of transcription factors, essential for the synthesis of various cytokines such as IL- 2. Besides, the antimetabolites action of some immunosuppressive therapies such as MMF blocks proliferation of T and B cells by inhibiting protein synthesis. The second functional category comprises genes which are expressed during cellular stress and inflammatory responses. Up-regulation of those genes correlated directly with HCV infection in liver recipients. Although, similar HCV effects have been described by microarray assays of intrahepatic gene expression analysis, our study represents the first report describing this contribution of HCV infection in peripheral blood expression patterns. Importantly, the expression of pro-inflammatory genes is significantly less manifested in HCV-positive tolerant recipients than in infected patients with ongoing immunosuppression. This phenomenon, in concordance with other histological liver studies, indicates that either the state of operational tolerance or the absence of immunosuppression results in an improvement of HCV related disease progression in the graft. Finally, the third group of differently expressed genes appears to be related to the state of operational tolerance and it is independent of other clinical variables such as HCV infection. The genes included in this category encode for NK receptors, proteins related to T cells, groups of genes associated with cell proliferation and cell cycle control, and also genes like CD9 and cadherins. Tolerant patients exhibit up-regulation of this category of genes, which some of them are related with TGF- signaling pathway. These results correlate with other reported studies covering operational tolerance research and partially link to our findings of the immunophenotypic analysis. 97
107 RESULTS AND DISCUSSION Immunoflourescent staining of peripheral blood cells staining enabled an accurate quantification of the main immune cell populations in enrolled patients. This data allowed a correlation of the incidence of each subpopulation to gene expression and their implication in the immune response related to allograft acceptance. T cells are increased in operationally tolerant recipients upon comparison to immunosuppression dependent patients and healthy controls. This phenomenon is a consequence of specific expansion of the V 1 + T cells subpopulation, which is characterized by the expression of NK receptors and exerts cytotoxic functions. Interestingly, V 2 + T cells, which is the predominant subpopulation in the peripheral blood of healthy individuals, remains without significant changes between all analyzed groups. This contributes to the inverted ratio of V 1 + /V 2 + T cells in peripheral blood of tolerant recipients. These findings correlate with the observed increase of gene expression of NK receptors and genes related to T cells. Besides, V 1 + T-cell expansion is also reported in other immunophenotyping studies done in liver transplanted pediatric patients and it is described in various animal models after tolerance induction. Furthermore, tolerant recipients displayed a significant increase of CD4+CD25+ Tregs compared with immunosuppression dependent patients and healthy controls. Additionally, this Treg subset showed a high correlation with the intracellular staining of the FOXP3 transcription factor. Although, differences in FOXP3 expression between tolerant recipients and patients requiring ongoing immunosuppression are a probable consequence of pharmacological therapy, several studies in human and animal models support the immune regulatory activity of CD4+CD25+ Tregs in transplantation tolerance. Altogether these results constitute an initial step for a more complete immunologic characterization of operationally tolerant liver recipients. Although the main objectives had been achieved, several limitations have to be acknowledged here: 1) The availability of a 98
108 RESULTS AND DISCUSSION limited number of tolerant recipients precluded the performance of an independent validation of the results and the identification of a potentially diagnostic gene signature including a small number of genes; 2) While the global gene expression study from PBMCs provided an initial screen to define the principal mechanisms related with allograft acceptance, this approach did not substantially advance our knowledge on the principal PBMC subsets involved in the observed differences in gene expression; and 3) the potential confounding factor of pharmacological immunosuppression (which was only administered to non-tolerant recipients) could be adequately controlled. 99
109 RESULTS AND DISCUSSION ARTICLE 2 Using transcriptional profiling to develop a diagnostic test of operational tolerance in liver transplant recipients 100
110 Related Commentary, page 2684 Marc Martínez-Llordella, 1 Juan José Lozano, 1 Isabel Puig-Pey, 1 Giuseppe Orlando, 2 Giuseppe Tisone, 2 Jan Lerut, 3 Carlos Benítez, 1 Jose Antonio Pons, 4 Pascual Parrilla, 4 Pablo Ramírez, 4 Miquel Bruguera, 1 Antoni Rimola, 1 and Alberto Sánchez-Fueyo 1 1 Liver Transplant Unit, Hospital Clinic Barcelona, Institut d Investigacions Biomèdiques August Pi i Sunyer (IDIBAPS), Centro de Investigación Biomédica en Red de Enfermedades Hepáticas y Digestivas (CIBEREHD), Barcelona, Spain. 2 Liver Transplant Unit, Surgical Clinic, University of Rome Tor Vergata, Rome, Italy. 3 Abdominal Transplant Unit, Université Catholique de Louvain, Brussels, Belgium. 4 Liver Transplant Unit, Virgen de la Arrixaca University Hospital, Murcia, Spain. A fraction of liver transplant recipients are able to discontinue all immunosuppressive therapies without rejecting their grafts and are said to be operationally tolerant to the transplant. However, accurate identification of these recipients remains a challenge. To design a clinically applicable molecular test of operational tolerance in liver transplantation, we studied transcriptional patterns in the peripheral blood of 80 liver transplant recipients and 16 nontransplanted healthy individuals by employing oligonucleotide microarrays and quantitative real-time PCR. This resulted in the discovery and validation of several gene signatures comprising a modest number of genes capable of identifying tolerant and nontolerant recipients with high accuracy. Multiple peripheral blood lymphocyte subsets contributed to the tolerance-associated transcriptional patterns, although NK and γδtcr + T cells exerted the predominant influence. These data suggest that transcriptional profiling of peripheral blood can be employed to identify liver transplant recipients who can discontinue immunosuppressive therapy and that innate immune cells are likely to play a major role in the maintenance of operational tolerance in liver transplantation. Maintenance of a normal allograft function despite complete discontinuation of all immunosuppressive drugs is occasionally reported in clinical organ transplantation, particularly following liver transplantation (1 9). Patients spontaneously accepting their grafts are conventionally considered as operationally tolerant and provide a proof of concept that immunological tolerance can actually be attained in humans. We and others have documented differences in the phenotype and gene expression of PBMCs obtained from operationally tolerant liver recipients as compared with patients requiring ongoing pharmacological immunosuppression (10 12). While these observations have provided valuable information on the cellular and molecular basis of human operational tolerance, the translation of this information into a clinically applicable molecular diagnostic test capable of identifying tolerance remains a challenge. In the current study, we have employed gene-expression profiling technologies to construct and validate a series of genomic classifiers of operational tolerance in liver transplantation. Thus, we have analyzed peripheral blood specimens from 38 adult liver transplant recipients employing oligonucleotide microarrays and quantitative real-time PCR (qpcr) and have identified several predictive models containing Nonstandard abbreviations used: CONT, control nontransplanted healthy individuals; FDR, false discovery rate; MiPP, misclassified penalized posterior probability algorithm; non-tol, nontolerant liver transplant (recipient); PAM, predictive analysis of microarrays; qpcr, quantitative real-time PCR; SAM, significant analysis of microarrays; STA, stable liver transplant (recipient) under maintenance immunosuppressive therapy; TOL, tolerant liver transplant (recipient). Conflict of interest: The authors have declared that no conflict of interest exists. Citation for this article: J. Clin. Invest. 118: (2008). doi: /jci very low numbers of genes whose mrna levels accurately identify operationally tolerant liver recipients. This genomic footprint of operational tolerance has been compared with gene-expression patterns obtained from healthy individuals, validated in an independent cohort of 23 additional liver recipients, and employed to estimate the prevalence of tolerance among stable liver transplant recipients receiving maintenance immunosuppressive drugs (STA recipients). In addition, the influence of potentially confounding clinical variables and specific PBMC subsets on tolerance-related gene signatures has been thoroughly assessed. Our data suggest that measurement of the expression of a modest number of genes in peripheral blood could constitute a robust noninvasive diagnostic test of operational tolerance in clinical liver transplantation. Candidate gene discovery and internal validation of microarray data. To assess differential gene expression between tolerant and nontolerant recipients, oligonucleotide microarray experiments were conducted on PBMCs obtained from 17 tolerant liver transplant (TOL) and 21 nontolerant liver transplant (non-tol) recipients (Table 1 and Figure 1). An initial comparative statistical analysis employing significant analysis of microarrays (SAM) yielded a total of 2,482 probes (corresponding to 1,932 genes and 147 expressed sequence tags) with a false discovery rate (FDR) of less than 5% (Figure 2). To identify the minimal set of genes capable of predicting the tolerant state, predictive analysis of microarrays (PAM) was performed in parallel on the same 2 groups of samples, resulting in the identification of a subset of 26 probes corresponding to 24 genes (all of them present in the SAM list; Figure 3A) capable of correctly classifying tolerant recipients, with an overall error rate The Journal of Clinical Investigation Volume 118 Number 8 August 2008
111 Demographic characteristics of patient groups Clinical Number Age Time from Time from HCV Treatment Center diagnosis (yr) A transplantation (yr) A weaning (yr) A infection B TOL (total) (40 68) 10.9 (4 16) 5.6 (1 8) 21% Non-TOL (total) (39 67) 8.2 (4 15) 25% Training set TOL % B, R, M, L Non-TOL % 48% CsA, 38% FK, B, R, M, L 9% MMF, 5% SRL Test set TOL ,6 27% B, R, L Non-TOL % 25% MMF, 50% FK, B, R, L 25% CsA STA (45 74) 9 (5 12) 13% 40% CsA, 30% FK, B 30% MMF CONT (42 70) B of (sensitivity, 1; specificity, 0.944). Multidimensional scaling analysis was then performed to visually represent the proximity between TOL and non-tol samples according to the expression of the 26 probes. As depicted in Figure 3B, TOL and non-tol samples appeared as 2 clearly separated groups. Overall, analysis of microarray-derived expression data results in the identification of a genetic classifier that exhibits high accuracy in discriminating TOL from non-tol samples. Prediction of tolerance in STA recipients under maintenance immunosuppression employing microarray expression data. To estimate the proportion of potentially tolerant individuals among STA recipients and thus externally validate the tolerance-related 26-probe microarray signature, we employed PAM to classify a cohort of 19 STA patients under maintenance immunosuppressive therapy into TOL and non-tol categories. Tolerance was predicted in 26% of cases. This rate ranged from 21% to 31% when 3 other prediction algorithms, namely supervector machine learning using the kernel radial basis function (SVM-rbf) or linear kernel (SVM-lin), and K-nearest neighbors, were employed (data not shown). This estimation is concordant with the rate of successful weaning we have observed in similarly selected STA recipients (5, 8). Furthermore, STA recipients identified as tolerant based on microarray expression patterns exhibited a higher proportion of peripheral blood Vδ1TCR + T cells and Vδ1/Vδ2 T cell ratios than those identified as nontolerant recipients (Figure 4A), which is in agreement with 2 previous immunophenotyping studies (10, 11). Multidimensional scaling was next employed to plot TOL, non-tol, and STA samples together based on the PAM-derived microarray expression signature. Notably, STA samples were grouped together with TOL or non-tol samples in concordance with their predicted clinical phenotype (Figure 4B). Validation of microarray expression data by qpcr. We employed qpcr to confirm the expression of the target genes identified by microarrays and to compare the expression measurements obtained from liver recipients with those from nontransplanted healthy individuals (CONT). Selected target genes for qpcr experiments included the 24 genes selected by PAM, 44 genes selected among those most highly ranked in the SAM-derived gene list, and 6 genes (UBD, HLA-DOB, FOXP3, LTBP3, MAN1A1, LGALS3) previously reported to be associated with allograft tolerance (Table 2). Peripheral blood samples from 16 TOL, 15 non-tol, and 16 CONT individuals were employed for these experiments. TOL and non-tol samples differed in the expression of 34 genes (Table 3 and Figure 5A). Thirty genes were differentially expressed when assessed by microarrays but not by qpcr. Among these, PCR primers and microarray probes did not recognize the same transcripts in 11 cases. Hence, qpcr could confirm the differential expression of 64% of the genes selected by microarrays. The reproducibility of qpcr expression values was assessed by computing interpatient and interassay variation. Interpatient variation (median SD of ΔCt = 0.68) greatly exceeded interassay variation (median SD of ΔCt = 0.21). This suggests that the variability of the qpcr is small enough to reliably detect differences in gene expression between TOL and non-tol recipients. Although target genes had been selected on account of their differential expression between TOL and non-tol samples, there were 26 genes differentially expressed between TOL and CONT samples as well (Table 3 and Figure 5A). The similarities between TOL, non-tol, and CONT expression patterns were then assessed in an unsupervised manner through multidimensional scaling analysis. This resulted in CONT samples being clustered in between TOL and non-tol groups (Figure 5B). Taken together, qpcr expression results confirmed the validity of most genes identified by microarrays and revealed that tolerancerelated expression patterns differ from those of both non-tol recipients and nontransplanted healthy individuals. Expression patterns of TOL recipients, however, appear to be closer to those of healthy individuals than to those of non-tol recipients. Prediction of tolerance in an independent validation test employing qpcrderived gene models. Among the candidate biomarkers identified in qpcr experiments on the basis of their differential expression between TOL and non-tol samples, we searched for those that would form optimal parsimonious models capable of predicting tolerance status in an independent validation set. This was accomplished by utilizing a novel classification modeling approach based on the misclassified penalized posterior (MiPP) algorithm and incorporating an independent cohort of 11 TOL and 12 non- The Journal of Clinical Investigation Volume 118 Number 8 August 2008
112 TOL recipients not previously employed for data analysis and from whom no microarray data were available. MiPP selected 3 signatures of 2, 6, and 7 genes (altogether comprising 12 different genes), and these signatures were capable of correctly classifying samples included in both the training and validation sets (Table 3). These experiments indicate that qpcr can be employed on peripheral blood samples to derive robust, reproducible, and highly accurate gene models of liver operational tolerance. Identification of clinical variables implicated in the tolerance-associated gene signature. We performed globaltest to assess the influence of age, sex, type of immunosuppression, time from transplantation, peripheral blood leukocyte counts, and HCV infection status on peripheral blood microarray gene-expression patterns. No significant correlation was found between the tolerance-related expression profile and patient age, sex, pharmacological immunosuppression, and peripheral blood lymphocyte, neutrophil, and monocyte numbers (data not shown). Time from transplantation was marginally associated with the PAM-derived 26-probe signature (P value < 0.042) but not with the 2,462-probe set identified by SAM. HCV infection, in contrast, had a major impact both on global gene-expression patterns and on the tolerancerelated expression signatures (P < and P < for the 26- and the 2,462-probe sets, respectively). To further dissect the effects of HCV infection on gene-expression patterns following transplantation, we compared samples from chronically infected patients (HCV-positive) with those of noninfected (HCV-negative) recipients employing SAM. This resulted in the identification of 4,725 differentially expressed probes (FDR < 5%; data not shown). Further, we used SAM to compare TOL and non-tol samples stratified on the basis of HCV infection status. HCV-negative TOL and non-tol individuals differed in 117 probes, while 528 probes were differentially expressed between HCV-positive TOL and non-tol recipients (FDR < 5%; Figure 6A). HCV infection was also found to influence the expression of 12 out of the 26 probes included in the PAM-derived microarray genetic classifier, although correlation was tighter with tolerance than with HCV infection (Figure 6B). This is concordant with our finding that the 26-probe set classifies TOL and non-tol samples regardless of HCV infection status (Figure 3B). Thus, while HCV infection has a major influence on peripheral blood gene expression follow- The Journal of Clinical Investigation Volume 118 Number 8 August 2008
, we investigated in detail the differences in PBMC subsets between TOL and non-tol liver recipients (this report included 32 out of the 38 TOL and non-tol recipients")
113 ing liver transplantation, this does not prevent accurate discrimination between TOL and non-tol recipients. PBMC subsets involved in the tolerance-related gene-expression footprint. In a previous report (11), we investigated in detail the differences in PBMC subsets between TOL and non-tol liver recipients (this report included 32 out of the 38 TOL and non-tol recipients incorporated in our current microarray study). TOL recipients exhibited an increased number of CD4 + CD25 + Foxp3 +, γδtcr +, and δ1tcr + T cells. In contrast, no differences were observed in the frequency or absolute numbers of other T cell subsets, B, NK, and NKT cells (11). To determine the contribution of these PBMC subsets to tolerance-associated expression patterns, we employed The Journal of Clinical Investigation Volume 118 Number 8 August 2008
 were employed for this study.")
114 globaltest to correlate cell-subset frequencies with microarrayderived expression levels. All 57 patients from whom microarray data were available (including TOL, non-tol, and STA recipients) were employed for this study. First, we computed the number of probes from the SAM-derived 2,482-probe list whose expression correlated with the frequency of each specific PBMC subset. NK, Vδ1TCR +, and total γδtcr + T cells influenced 314, 296, and 438 probes, respectively, although statistical significance was only reached for NK (P < ) and γδtcr + T cells (P < ). For comparison, a similar analysis was then conducted on the 4,725- probe list differentiating HCV-positive from HCV-negative samples. This analysis identified CD8 + T cells as the lymphocyte subset influencing the greatest number of genes, although this did not reach statistical significance (328 probes; P < 0.14). NK, γδtcr +, and Vδ1TCR + peripheral blood lymphocyte proportions also correlated with the expression of multiple individual genes included in the PAM-derived 26-probe set (Figure 6C), although only γδtcr + T cell frequency was shown to be significantly associated with the 26-probe set as a whole (P < ). The results of these analyses indicate that both NK and γδtcr + T cells influence tolerance-associated peripheral blood expression patterns. Considering that TOL and non-tol recipients differ in the number of peripheral blood γδtcr + T cells (11), it is clear that tolerance-related differential gene expression can be attributed, at least in part, to an increased number of γδtcr + T cells in TOL recipients. Regarding NK cells, which are present in similar numbers in TOL and non-tol recipients, we hypothesized that the significant correlation observed might be due to changes in their transcriptional program. To test this hypothesis and further assess the contribution of other PBMC subsets, we conducted qpcr experiments to measure the expression of the 22 most significant genes from Table 3 on cell subsets sorted from a selected group of 5 TOL and 5 non-tol patients. The set of 22 genes was predominantly expressed by CD8 +, γδtcr +, and non T cell mononuclear cells (Figure 7 and Table 4). Comparison of TOL and non-tol samples revealed significant expression differences in CD4 +, CD8 +, γδtcr +, and non T cell subsets (Figure 7 and Table 4). In addition, protein levels of IL-2RB, KLRB1, CD244, CD9, KLRF1, CD160, and SLAMF7 were assessed by flow cytometry on CD4 +, CD8 +, γδtcr + T, NK, CD19 +, and NKT cells from 6 TOL, 6 non-tol, and 5 healthy individuals. These proteins were mainly expressed on NK, NKT, and γδtcr + T cells, with significant differences being noted between TOL, non-tol, and CONT individuals (Supplemental Figure 1, A and B; supplemental material available online with this article; doi: /jci35342ds1). These findings indicate that TOL and non-tol recipients differ in the expression program of several PBMC subsets, mainly Vδ1TCR + T cells and NK cells, and that in many cases these expression changes are unique to the tolerant state. Thus, tolerance-associated expression patterns appear to be shaped both by differences in γδtcr + T cell number and by functional changes in a variety of PBMC subsets. We have previously reported that gene-expression profiling employing peripheral blood specimens and oligonucleotide microarrays constitutes a high-throughput approach to dissect the biology underlying operational tolerance in human liver transplantation (11). The current study was designed to determine whether this approach could be employed to identify genomic classifiers that would (a) comprise modest numbers of genes, (b) provide high diagnostic accuracy in the identification of tolerant recipients, and (c) yield reproducible results across different transcriptional The Journal of Clinical Investigation Volume 118 Number 8 August 2008
115 δ δ δ platforms. We first analyzed peripheral blood samples obtained from operationally tolerant liver recipients and from nontolerant recipients requiring maintenance immunosuppression employing Affymetrix microarrays. The diagnostic applicability of the resulting 26-probe genetic classifier was tested on an independent cohort of 19 STA recipients. These patients were selected according to the clinical criteria most commonly used to enroll patients in immunosuppressive weaning trials (1) and are therefore representative of the diversity of patients to whom a diagnostic test based on the identified gene signature would be applied if adopted for broad clinical use. Prediction of tolerance status based on the identified gene signature resulted in the identification of 4 of 19 potentially tolerant recipients (26%), which matches the prevalence of operational tolerance observed in patients selected according to the above clinical criteria (1, 5, 8). The most informative genes selected in the microarray experiments were then validated on a qpcr platform. This resulted in the identification of 3 qpcr-derived composite models incorporating 2 7 genes exhibiting remarkable accuracy at discriminating TOL from non- TOL samples in both training and independent validation sets. qpcr experiments incorporated an additional group of samples collected from healthy nontransplanted individuals (CONT). This allowed comparison of TOL and CONT expression patterns. While tolerance-related expression signatures resembled CONT more than non-tol patterns, half of the genes differentially expressed between TOL and non-tol samples were also significantly different when comparing TOL and CONT samples. This indicates that a substantial proportion of identified genetic classifiers are very likely to be tolerance specific. The potential impact on tolerance-related gene-expression patterns of clinical variables such as age, time from transplantation, type of immunosuppressive therapy, and HCV status was specifically addressed on the microarray dataset. HCV infection had a striking impact on peripheral blood gene-expression patterns, markedly outweighing the effect of tolerance itself in terms of the number of genes influenced. The effect of HCV infection on the set of genes most strongly associated with tolerance was, however, weak, which explains why the 26-probe microarray signature could correctly identify tolerant recipients regardless of HCV-infection status. Time from transplantation was found to be marginally associated with the PAM-derived 26-probe signature. This is concordant with the clinical observation that liver recipients with a longer posttransplant follow-up are more likely to become operationally tolerant (1) but clearly does not account for the expression differences between TOL and non-tol recipients detected in our study population. A significant effect of pharmacological immunosuppression on tolerance-related gene-expression patterns was excluded by the negative result of the globaltest association analysis and by our finding that STA recipients predicted to be tolerant were grouped together with TOL recipients, which suggests that a common expression signature prevails regardless of the use of immunosuppressive drugs. Hence, we provide here The Journal of Clinical Investigation Volume 118 Number 8 August 2008
116 Results of qpcr gene-expression experiments Gene Fold change Fold change P value P value P < 0.05 P < 0.05 symbol TOL vs. non-tol CONT vs. TOL TOL vs. non-tol TOL vs. CONT TOL vs. non-tol TOL vs. CONT CLIC Y N KLRF Y Y SLAMF Y Y FEZ Y Y CD Y Y CTBP Y Y IL2RB Y Y OSBPL Y Y NKG Y Y FLJ Y N GNPTAB Y N PTGDR Y N FEM1C Y Y ZNF Y N KLRD Y N RGS Y N CX3CR Y N PSMD Y N WDR Y N PTCH Y N ERBB Y N GEMIN Y N CD Y Y CD Y N NCALD Y N EPS Y Y PDE4B Y N KLRB Y N ZNF Y Y FANCG Y N UBD Y Y ALG Y N MAN1A Y Y IL Y Y DCTN N N DAB N N FOXP N N UBE2V N N PPM1B N N NOTCH N Y DOCK N N THBD N N PPM1B N N UCHL N N NOLA N Y PSMF N N TGFBR N N C10orf N N DCUN1D N N HIP N N RAD23B N N TRIAP N N EIF5A N Y TRD@ N N LTBP N Y HLA DOB N N RB1CC N Y ATXN N Y TRA@ N Y MRPS N Y IKZF N N DTNBP N N GRSF N Y UBB N N NOLA N Y C10orf N N COPZ N N LGALS N Y S100A N N The Journal of Clinical Investigation Volume 118 Number 8 August 2008

117 Most predictive genetic classifiers identified by MiPP in qpcr expression data set and their performance in training and independent test sets Gene signatures Selection Prediction rule Class Mean ER Mean ER in method comparison in training set validation set KLRF1, SLAMF7 MiPP LDA, QDA, SVM-rbf 2 class KLRF1, NKG7, IL2RB, KLRB1, FANCG, GNPTAB MiPP SVM-rbf 2 class SLAMF7, KLRF1, CLIC3, PSMD14, ALG8, CX3CR1, RGS3 MiPP SVM-lin 2 class a series of robust predictive models containing a strikingly small number of features capable of accurately discriminating between operationally tolerant liver recipients and those requiring ongoing pharmacological immunosuppression on the basis of peripheral blood gene-expression patterns. The underlying biology of operational tolerance in humans is still largely unknown. In the current work we have conducted a whole genome gene-set analysis to gain unbiased insight into the mechanisms of operational tolerance following liver transplantation (see Supplemental Data). This analysis has revealed that the expression signature associated with operational liver allograft tolerance is mainly characterized by enrichment in genes encoding for a variety of NK cell surface receptors expressed by NK, CD8 +, and γδtcr + T cells. The influence of NK and γδtcr + T cells on toler- The Journal of Clinical Investigation Volume 118 Number 8 August 2008
 exhibit unique expression markers.")
118 ance-related expression patterns has been further confirmed by the demonstration of a significant association between the expression levels of the most informative genes and peripheral blood NK and γδtcr + T cell frequencies and by the finding that, in TOL recipients, both γδtcr + and NK cells (together with other PBMC subsets) exhibit unique expression markers. There are 2 main γδtcr + T cell subsets in human peripheral blood: Vδ1 and Vδ2. In healthy individuals, Vδ2TCR + T cells largely predominate in peripheral blood (>80%), while Vδ1TCR + T cells are the major subtype in tissues such as intestine, liver, and spleen (13). In operationally tolerant liver recipients, in contrast, peripheral blood Vδ1TCR + T cells expand and typically outnumber Vδ2TCR + T cells (10, 11). Our current analysis indicates that Vδ1TCR + T cells are the only γδtcr + T cell subset clearly influencing tolerance-related transcriptional signatures. In addition, we provide evidence that peripheral blood Vδ1TCR + T cells from tolerant liver recipients exhibit unique expression and cell-surface traits that distinguish them from those present in either nontolerant recipients or nontransplanted healthy individuals. Vδ1TCR + T cells have been reported to exert immunoregulatory functions in a variety of nontransplantation experimental and clinical settings (14 19). In liver transplantation, further studies are needed to dissect the functional properties of Vδ1TCR + T cells and to determine whether these cells have direct suppressive abilities on alloaggressive lymphocytes or act by pro- The Journal of Clinical Investigation Volume 118 Number 8 August 2008
119 γδ Δ ducing growth factors and repairing tissue damage, as has been shown for the intestinal mucosa (18, 20 22). On the basis of gene expression and flow cytometry data presented here, it is clear that tolerant liver recipients are distinct not only from recipients requiring maintenance immunosuppression but also from nontransplanted healthy individuals. This suggests that in liver transplantation, achievement of operational tolerance is unlikely to be due to a reinitialization of the immune system resulting in recognition of the transplanted graft as self. On the contrary, tolerant liver recipients appear to have developed The Journal of Clinical Investigation Volume 118 Number 8 August 2008
120 Statistical significance of the differences in gene expression between TOL and non-tol recipients in sorted lymphocyte subset. Gene symbol P value P value P value P value P value CD4 + CD8 + γδtcr + non T cell PBMCs SLAMF NKG CX3CR RGS FLJ CD CD FEZ KLRF PTGDR OSBPL C10orf CD CLIC IL2RB FANCG GEMIN CTBP GNPTAB KLRB PSMD ALG tolerogenic pathways not readily detectable in peripheral blood of healthy individuals but capable of ensuring the protection of the liver allograft. Functional profiling of human kidney allograft tolerance employing peripheral blood samples has been previously reported by Brouard et al. (23) utilizing a 2-color cdna microarray platform (lymphochip) mainly containing immune-related genes (24). While it would be critical to find common features between operationally tolerant kidney and liver recipients, comparison of both studies is problematic. First, the 2 array platforms employed (lymphochip and Affymetrix U133 Plus 2.0 arrays) have only 4,733 probes in common, with just 543 of them being present in the SAM-derived 2,482-gene list discriminating between TOL and non-tol liver recipients (data obtained employing the MatchMiner tool; ref. 25). This number is very low for detailed evaluation of genome-wide transcriptional similitudes, particularly when comparing 2 distant clinical settings and utilizing 2 different expression platforms. Second, the 2 studies analyze different patient groups (i.e., our study is focused on identifying tolerant individuals among STA recipients while Brouard et al. compare tolerant kidney recipients with chronic rejectors). Despite these limitations, a comparison restricted to functional pathway profiles suggests that the mechanisms accounting for operational tolerance in liver transplantation are distinct from those active in kidney recipients. Thus, operationally tolerant kidney recipients appear to be characterized by a state of immune quiescence with marked downregulation of genes involved in lymphocyte trafficking and activation and upregulation of genes responsible for cell-cycle control (23). In contrast, in operationally tolerant liver recipients, there is a manifest influence on expression patterns of cellular components of the innate immune cells while changes in proinflammatory pathways are barely noticeable except for HCV-positive recipients. Furthermore, a role for B cells in liver allograft tolerance is not supported by either immunophenotyping or gene expression data, in contrast to what has been reported in kidney transplantation (26, 27). In short, our study reveals that measurement of the expression levels of a small set of genes in peripheral blood could be useful to accurately identify liver recipients who are able to accept their grafts in the absence of pharmacological immunosuppression. Validation of our findings in prospective immunosuppression weaning trials would open the door to the possibility of withdrawing immunosuppressive drugs in recipients with high likelihood of being tolerant. Further, functional analysis of expression patterns suggests that molecular pathways involved in the activation and effector function of innate immunity cell types (NK and γδtcr + T cells) are central to the maintenance of operational tolerance following liver transplantation. Altogether, our work highlights the value of peripheral blood transcriptional profiling in the immune monitoring of liver transplant recipients and provides insight into the pathogenesis of human allograft tolerance. Patients. Peripheral blood samples were collected from a cohort of 28 TOL recipients and 33 liver recipients in whom drug weaning was attempted but led to acute rejection, requiring reintroduction of immunosuppressive drugs (non-tol). TOL recipients had been intentionally weaned from immunosuppressive therapy under medical supervision. Criteria employed in selecting patients for immunosuppression weaning in the participating institutions were as follows: (a) more than 3 years after transplantation; (b) single-drug immunosuppression; (c) absence of acute rejection episodes in the previous 12 months; (d) absence of signs of acute/chronic rejection in liver histology; and (e) absence of autoimmune liver disease before or after transplantation. In TOL recipients, blood was collected more than 1 year after successful immunosuppressive drug discontinuation, while in non-tol recipients, specimens were harvested more than 1 year after complete resolution of the acute rejection episode (at the time of blood collection, all non-tol recipients had normalized liver function tests and were receiving low-dose immunosuppression in monotherapy). Additionally, peripheral blood samples were also obtained from 16 age-matched healthy controls (CONT) and 19 STA recipients that fulfilled the aforementioned clinical criteria for drug weaning. In patients fulfilling these criteria, the prevalence of operational tolerance ranges between 20% and 30% (5, 8). Clinical and demographic characteristics of patients included in the study are summarized in Table 1. The study was accepted by the Institutional Review Boards of all participating institutions, and informed consent was obtained from all patients. A report containing blood-cell immunophenotyping findings together with preliminary microarray gene expression data obtained from a subset of the patients enrolled in the current study has been recently published (11). Microarray experiments. Microarray experiments were conducted on PBMCs obtained from 21 non-tol, 17 TOL, and 19 STA recipients. PBMCs were isolated employing a Ficoll-Hypaque layer (Amersham Biosciences), total RNA was extracted with TRIzol reagent (Life Technologies), and the derived crna samples were hybridized onto Affymetrix Human Genome U133 Plus 2.0 arrays containing 54,675 probes for 47,000 transcripts (Affymetrix). Sample handling and RNA extraction were performed by the same investigator in all cases (M. Martínez-Llordella). The Journal of Clinical Investigation Volume 118 Number 8 August 2008
121 Microarray data normalization. Microarray data from 57 samples (21 non- TOL, 17 TOL, and 19 STA) were normalized using the guanidine-cytosine content-adjusted robust multiarray algorithm, which computes expression values from probe-intensity values incorporating probe-sequence information (28). Next, we employed a conservative probe-filtering step excluding those probes not reaching a log 2 expression value of 5 in at least 1 sample, which resulted in the selection of a total of 23,782 probes out of the original 54,675 set. In order to eliminate nonbiological experimental variation or batch effects observed across successive batches of microarray experiments, we applied ComBat approach, which uses nonparametric empirical Bayes frameworks for data adjustment (29). Differential expression assessment and prediction. An outline of the study design is depicted in Figure 1. We first used SAM (30) to identify genes differentially expressed between the TOL and non-tol groups (17 and 21 samples, respectively) within the filtered 23,782-probe set. SAM uses modified t test statistics for each gene of a dataset and a fudge factor to compute the t value, thereby controlling for unrealistically low standard deviations for each gene. Furthermore, SAM allows control of the FDR by selecting a threshold for the difference between the actual test result and the result obtained from repeated permutations of the tested groups. For the current study, we employed SAM selection using FDR of less than 5% and 1,000 permutations on 3 comparison groups: TOL versus non-tol, TOL HCV-positive versus non-tol HCV-positive, and TOL HCV-negative versus non-tol HCV-negative. Differential gene expression was further explored by using the nearest shrunken centroid classifier implemented in the PAM (31) package to identify within the 23,782-probe set the minimal set of genes capable of predicting the tolerant state with an overall error rate of less than 5%. This method incorporates an internal cross-validation step during feature selection in which the model is fit on 90% of the samples and then the class of the remaining 10% is predicted. This procedure is repeated 10 times to compute the overall error (10-fold cross-validation). The PAM classifier was then used on the 38-sample set to perform multidimensional scaling analysis on the basis of between-sample Euclidean distances as implemented by the isomds function in R. This method is capable of visualizing high-dimensional data (such as multiple expression measurements) in a 3D graph in which the distances between samples are kept as unchanged as possible. Finally, the PAM classifier was employed to predict class in the set of 19 samples obtained from STA patients. Detailed information on the microarray expression dataset in available online ( Correlation of microarray data with clinical variables and PBMC subsets. The globaltest algorithm (32) from the Bioconductor package ( was employed to determine whether potentially confounding clinical variables such as patient age, sex, time from transplantation, HCV status, immunosuppressive therapy (tacrolimus, cyclosporine A, or mycophenolate mophetil), and peripheral blood monocyte, lymphocyte, and neutrophil counts could be influencing gene-expression levels. The same strategy was employed to estimate the correlation between microarray expression data and the proportion of peripheral blood CD4 + CD25 +, CD4 + Foxp3 +, CD4 +, CD8 +, CD19 +, NKT, total γδtcr +, Vδ1TCR +, and Vδ2TCR + T cells. Globaltest is a method to determine whether the expression pattern of a prespecified group of genes is related to a clinical variable, which can be either a discrete variable or a continuous measurement. This test is based on an empirical Bayesian generalized linear model, where the regression coefficients between gene-expression data and clinical measurements are random variables. A goodness-of-fit test is applied on the basis of this model. The globaltest method computes a statistic Q and a P value to measure the influence of our group of genes on the clinical variable measured. For each probe, the influence (Q) in predicting measured clinical variable is estimated against the expected value, and ranked among the probes under study. The weight of each probe is also assessed by the z-score considering the standard deviation of each probe in all samples used in the analysis. qpcr experiments. The expression pattern of a group of 68 target genes and 4 housekeeping genes (18S, GUS, HPRT1, and GAPDH) was measured by qpcr employing the ABI 7900 Sequence Detection System and LDA microfluidic PCR cards (PE Applied Biosystems) on peripheral blood samples obtained from 15 non-tol, 16 TOL, and 16 CONT individuals. Selected target genes included the 24 genes identified by PAM, 44 genes selected among those most highly ranked in the SAM-derived gene list, and 6 genes (UBD, HLA-DOB, FOXP3, LTBP3, MAN1A1, LGALS3) selected on the basis of previous reports (11, 23, 26, 33, 34). To quantify the levels of mrna, we normalized the expression of the target genes to the housekeeping gene HPRT1 (which was found to be the most stably expressed gene among the 4 housekeeping genes selected) and presented the results as relative expression between cdna of the target samples and a calibrated sample according to the ΔCt method. All qpcr experiments were performed in duplicate. Total RNA was treated with DNAse reagent (Ambion; Applied Biosystems), and reverse transcription performed using Multiscribed Reverse Transcriptase Enzyme (PE Applied Biosystems). Results were analyzed employing standard 2-class unpaired t test. Reproducibility of gene expression measurements was assessed by comparing interpatient and interassay variation in a set of qpcr experiments that included 22 genes and samples from 16 recipients. For these experiments, 2 peripheral blood samples collected at 2 separated time points (mean, 57 days; range, days) were employed. Interassay variation was defined as the variation between PCR runs carried out employing the 2 different peripheral blood samples from the same patient. To construct classification models containing a minimal set of features (genes) with the lowest possible classification error both in training and independent test sets, we employed MiPP (35) on the 34 target genes differentially expressed between TOL and non-tol samples (t test; P < 0.05). MiPP is a recently developed method for assessing the performance of a prediction model that computes the sum of the posterior classification probabilities penalized by the number of incorrectly classified samples. The MiPP application performs an exhaustive search for gene models by sequentially selecting the most predictive genes and automatically removing the selected genes in subsequent runs. For our analysis, we conducted 10 sequential runs and employed all predictive algorithms included in the MiPP application (linear discriminant analysis, quadratic discriminant analysis, support vector machine learning, and logistic regression). Internal computational validation was performed employing both 10-fold cross-validation and random-split validation (number of splits = 100). The composite models obtained were then employed to predict tolerance in the independent test set of 11 TOL and 12 non-tol samples from which no microarray data were available. The 3 models with a lower classification error rate (in training set and test set) were selected. Peripheral blood immunophenotyping. Flow cytometry immunophenotyping data from PBMCs obtained from 16 TOL and 16 non-tol recipients have been reported elsewhere (11). In the current study, we assessed the proportion of CD4 + CD25 +, CD4 + Foxp3 +, total γδtcr +, δ1 γδtcr +, δ2 γδtcr +, CD19 +, NK, and NKT cell subsets on peripheral blood specimens obtained from 19 STA recipients and from 1 TOL and 5 non-tol recipients (from whom no previous data were available). Immunophenotyping results from all 57 recipients were employed to correlate PBMC subset frequencies with microarray expression data. Foxp3 fluorescent monoclonal antibodies were purchased from ebioscience. All remaining antibodies were purchased from BD Biosciences. Peripheral blood cell sorting experiments. Positive selection of CD4 +, CD8 +, and γδtcr + T cell subsets from Ficoll-isolated PBMCs was performed employing Miltenyi magnetic beads according to the manufacturer s The Journal of Clinical Investigation Volume 118 Number 8 August 2008
122 instructions. Purity of sorted cell populations was consistently greater than 90%. Total RNA was extracted from CD4 +, CD8 +, γδtcr +, and non T mononuclear cell subsets employing TRIzol reagent, and gene expression quantification was conducted employing qpcr as described. Peripheral blood samples from 5 TOL and 5 non-tol patients were employed for these experiments. Statistics. Two-tailed Student s t test was employed to compare qpcr gene expression levels and immunophenotyping data. Statistical significance was defined as P < This work was supported by grants from the Ministerio de Educación y Ciencia, Spain (SAF to A. Sánchez-Fueyo), and from the Ministerio de Sanidad/ISCIII, Spain (PI to M. Bruguera). CIBEREHD is funded by the Instituto de Salud Carlos III (Spain). Received for publication February 14, 2008, and accepted in revised form June 11, Address correspondence to: Alberto Sánchez-Fueyo, Hospital Clínic Barcelona, Villarroel 170, Barcelona 08036, Spain. Phone: ; Fax: ; afueyo@clinic.ub.es. M. Martínez-Llordella and J.J. Lozano contributed equally to this work and are co first authors. 1. Lerut, J., and Sanchez-Fueyo, A An appraisal of tolerance in liver transplantation. Am. J. Transplant. 6: Starzl, T.E., et al Cell migration and chimerism after whole-organ transplantation: the basis of graft acceptance. Hepatology. 17: Devlin, J., et al Defining the outcome of immunosuppression withdrawal after liver transplantation. Hepatology. 27: Mazariegos, G.V., et al Weaning of immunosuppression in liver transplant recipients. Transplantation. 63: Pons, J.A., et al Endothelial cell chimerism does not influence allograft tolerance in liver transplant patients after withdrawal of immunosuppression. Transplantation. 75: Eason, J.D., Cohen, A.J., Nair, S., Alcantera, T., and Loss, G.E Tolerance: is it worth the risk? Transplantation. 79: Takatsuki, M., et al Weaning of immunosuppression in living donor liver transplant recipients. Transplantation. 72: Tisone, G., et al Complete weaning off immunosuppression in HCV liver transplant recipients is feasible and favourably impacts on the progression of disease recurrence. J. Hepatol. 44: Tryphonopoulos, P., et al The role of donor bone marrow infusions in withdrawal of immunosuppression in adult liver allotransplantation. Am. J. Transplant. 5: Li, Y., et al Analyses of peripheral blood mononuclear cells in operational tolerance after pediatric living donor liver transplantation. Am. J. Transplant. 4: Martinez-Llordella, M., et al Multi-parameter of immune profiling of operational tolerance in liver transplantation. Am. J. Transplant. 7: Mazariegos, G.V., et al Dendritic cell subset ratio in peripheral blood correlates with successful withdrawal of immunosuppression in liver transplant patients. Am. J. Transplant. 3: O Brien, R.L., et al gammadelta T-cell receptors: functional correlations. Immunol. Rev. 215: Kress, E., Hedges, J.F., and Jutila, M.A Distinct gene expression in human Vdelta1 and Vdelta2 gammadelta T cells following non-tcr agonist stimulation. Mol. Immunol. 43: Fu, Y.X., et al Immune protection and control of inflammatory tissue necrosis by gamma delta T cells. J. Immunol. 153: Girardi, M., et al Resident skin-specific gammadelta T cells provide local, nonredundant regulation of cutaneous inflammation. J. Exp. Med. 195: Szereday, L., Barakonyi, A., Miko, E., Varga, P., and Szekeres-Bartho, J Gamma/deltaT-cell subsets, NKG2A expression and apoptosis of Vdelta2+ T cells in pregnant women with or without risk of premature pregnancy termination. Am. J. Reprod. Immunol. 50: Bhagat, G., et al Small intestinal CD8 + TCRγδ + NKG2A + intraepithelial lymphocytes have attributes of regulatory cells in patients with celiac disease. J. Clin. Invest. 118: Okabe, K., et al CD45RC gammadelta T-cell infiltration is associated with immunologic unresponsiveness induced by prior donor-specific blood transfusion in rat hepatic allografts. Hepatology. 33: Itohara, S., et al Homing of a gamma delta thymocyte subset with homogeneous T-cell receptors to mucosal epithelia. Nature. 343: Hayday, A., and Tigelaar, R Immunoregulation in the tissues by gammadelta T cells. Nat. Rev. Immunol. 3: Chen, Y., Chou, K., Fuchs, E., Havran, W.L., and Boismenu, R Protection of the intestinal mucosa by intraepithelial gamma delta T cells. Proc. Natl. Acad. Sci. U. S. A. 99: Brouard, S., et al Identification of a peripheral blood transcriptional biomarker panel associated with operational renal allograft tolerance. Proc. Natl. Acad. Sci. U. S. A. 104: Alizadeh, A., et al The lymphochip: a specialized cdna microarray for the genomic-scale analysis of gene expression in normal and malignant lymphocytes. Cold Spring Harb. Symp. Quant. Biol. 64: Bussey, K.J., et al MatchMiner: a tool for batch navigation among gene and gene product identifiers. Genome Biol. 4:R Louis, S., et al Contrasting CD25hiCD4+T cells/foxp3 patterns in chronic rejection and operational drug-free tolerance. Transplantation. 81: Hernandez-Fuentes, M., et al Biomarkers of tolerance in kidney transplants [abstract]. Am. J. Transplant. 7: Wu, Z., Irizarri, R.A., Gentleman, R., Murillo, F.M., and Spencer, F A model-based background adjustment for oligonucleotide expression arrays. J. Am. Stat. Assoc. 99: Johnson, W.E., Li, C., and Rabinovic, A Adjusting batch effects in microarray expression data using empirical Bayes methods. Biostatistics. 8: Tusher, V.G., Tibshirani, R., and Chu, G Significance analysis of microarrays applied to the ionizing radiation response. Proc. Natl. Acad. Sci. U. S. A. 98: Tibshirani, R., Hastie, T., Narasimhan, B., and Chu, G Diagnosis of multiple cancer types by shrunken centroids of gene expression. Proc. Natl. Acad. Sci. U. S. A. 99: Goeman, J.J., van de Geer, S.A., de Kort, F., and van Houwelingen, H.C A global test for groups of genes: testing association with a clinical outcome. Bioinformatics. 20: Sawitzki, B., et al Identification of gene markers for the prediction of allograft rejection or permanent acceptance. Am. J. Transplant. 7: Ocklenburg, F., et al UBD, a downstream element of FOXP3, allows the identification of LGALS3, a new marker of human regulatory T cells. Lab. Invest. 86: Soukup, M., Cho, H., and Lee, J.K Robust classification modeling on microarray data using misclassification penalized posterior. Bioinformatics. 21(Suppl. 1):i423 i430. The Journal of Clinical Investigation Volume 118 Number 8 August 2008
123 SUPPLEMENTARY MATERIAL RESULTS Functional annotation and biological relevance To further explore the functional relationships between specific PBMC subsets and tolerance-related expression patterns we dissected the molecular pathways contained in the microarray differential gene expression data set employing both Gene set enrichment analysis (GSEA) and Ingenuity Pathway Analysis (IPA). Applying GSEA to manually curated gene set databases (C2 MsigDB; Table S5 in Supplementary Material) a number of canonical pathways comprising inflammatory and immune stimulatory genes were significantly associated with the non-tolerant phenotype, while only the propanoate pathway was significantly enriched in the tolerant phenotype. We also investigated whether gene expression measurements could be linked to conserved regulatory motifs (C3 MSigDB) but this yielded no significant results. In contrast, exploration of computed gene expression compendiums (C4 MsigDB) revealed that the tolerant phenotype was highly enriched in 3 overlapping gene sets (neighbourhood of IL2RB, PTPN4, CD7; Table S1) altogether comprising 76 genes known to be preferentially expressed by NK and other cytotoxic lymphocytes such as CD8 and TCR+ T cells (ref. S1). To exclude the effect of HCV infection on the functional profiling of operational tolerance, we then applied GSEA to compare HCV-neg TOL and Non-TOL recipients (Table S1). The use of C2 MsigDB to identify canonical pathways resulted in the detection of 3 pro-inflammatory gene sets significantly enriched in HCV-neg Non-TOL samples (CTLA4, CMAC and hypertrophy model pathways; Table S1). However, genes included within these three pathways (e.g. CD28, ICOS, CTLA4, JUN, TNF, IFNG, PIK3CA, ITK) were not present among the genes
124 discriminating between HCV-neg TOL and Non-TOL as assessed by SAM at FDR<5%. No clear functional differences were noted between HCV-neg TOL and Non-TOL recipients when employing C3 MSigDB (regulatory motifs) databases, while the use of computed gene expression databases (C4 MsigDB) showed again enrichment in HCVneg TOL samples of gene sets (neighbourhood of IL2RB, PTPN4, CD97; Table S1) commonly expressed by NK and other cytotoxic lymphocytes (ref. S1). The use of IPA on the complete TOL and Non-TOL differential expression data set identified SAPK/JNK signalling pathway and NK cell signalling pathway as the most significant canonical pathways associated with tolerance (Figure S2). The stress-activated SAPK/JNK pathway included a number of pro-inflammatory genes (CDK4, CDK8, CSNK1A1, DAXX, DUSP10, MAP4K4, MAPK9, SOS1, TRA@) that were differentially expressed between TOL and Non-TOL samples at FDR<5% only in HCV-pos recipients (data not shown). In contrast, NK signalling pathway comprised genes (CD244, CD300A, KLRC3, KLRD1, KLRK1, SH2D1B, and SOS1) significantly upregulated in TOL samples at FDR<5% regardless of HCV infection (data not shown). Next, to understand the potential biological relevance of the most informative set of genes, we used IPA to functionally analyse the 45 genes differentially expressed by qpcr between TOL and either Non-TOL or CONT samples. IPA identified 3 partially overlapping networks connecting 33 out of the 45-gene list (Figure S2). The first network, which was built from 14 genes and received the highest IPA score, was centred on IL-8, NFkB and Akt and associated with cancer, cellular movement and immune and lymphatic system function. The second network, incorporating 13 out of the 45 genes, was centred on TP53 and CDKN1A and associated with cancer, cell death and immunological disease. The third network built on 5 genes was mostly centred around IL-4 and associated with cell-to-cell signalling and cellular development. Taken
125 together, functional profiling reveals that tolerance-related expression signatures are highly enriched in genes involved in the regulation of innate immune cell function. While a number of pro-inflammatory pathways are over-represented in Non-TOL recipients, this appears to be mainly attributable to the effect of chronic HCV infection and not directly related to operational tolerance. MATERIAL AND METHODS Peripheral blood immunophenotyping on sorted PBMC subsets The expression at the protein level of 7 of the most discriminative genes identified by microarray and qpcr experiments (ILRB2, KLRB1, CD244, CD9, KLRF1, CD160, SLAMF7) was assessed on sorted PBMC subpopulations from a subset of 6 TOL, 6 Non-TOL and 5 CONT patients. CD160 fluorescent monoclonal antibodies were purchased from Beckman Coulter, SLAMF7 and KLRF1 from R&D Systems. All remaining antibodies were purchased from BD Biosciences. Functional annotation Gene Set Enrichment Analysis (GSEA) was employed to identify biological pathways significantly associated with the tolerant state (ref. S2). In comparison to other strategies for analysis of molecular profiling data that focus on high scoring individual genes, GSEA does not employ a significance threshold and evaluates microarray data at the level of gene sets defined based on prior biological knowledge. This approach has been reported to yield robust results even when dealing with heterogeneous samples with subtle sample class differences. For the current analysis (incorporating all probes collapsed by genes with at least one log2-expression measurement >5) gene sets were extracted from Molecular Signature Database (MSigDB v.2-0) C2 (manually curated
126 canonical pathways), C3 (gene sets containing genes that share transcription factor or microrna binding motifs) and C4 (computational gene sets generated in previous gene expression experiments) of MSigDB. Analysis were based on a t-test and a weighted scoring scheme with 1000 permutations on gene sets. Only gene sets with more than 15 genes were included in the analysis. Functional profiling was also performed on differentially expressed genes (SAM FDR<1%) employing the computational gene network prediction tool Ingenuity Pathway Analysis (IPA; This commercial application maps the uploaded gene identifiers into a global molecular network developed from a literature-supported Ingenuity Pathways Knowledge Base (IPKB), and then generates networks that represent the molecular relationships between the genes and their products. The biological functions significantly associated with the genes in the networks are provided and scored employing Fischer s exact test. FIGURE LEGENDS Figure S1: Differences in protein expression in peripheral mononuclear between TOL, Non-TOL and CONT recipients. A) Expression of ILRB2, KLRB1, CD244, CD9, KLRF1, CD160 and SLAMF7 on peripheral blood mononuclear cells. Representatitve flow cytometry histograms showing protein expression on TOL, Non- TOL and CONT samples. B) Differences in protein expression levels between TOL, Non-TOL and CONT samples. Bar plots represent mean expression (% of positive cells or mean fluorescence intensity (MFI) depending on the marker analysed) +/- SD from 6 TOL, 6 Non-TOL and 5 CONT samples. (*) = P-value <0.05 (t-test) between TOL and Non-TOL; (**) = P-value <0.05 (t-test) between TOL and CONT.
127 Figure S2: Functional analysis of tolerance-related gene expression patterns. A) Identification of the canonical pathways from Ingenuity Pathways Knowledge Base (IPKB) most significantly associated with the genes differentially expressed between TOL and Non-TOL samples. Genes selected by SAM at FDR <1% were considered for the analysis. The significance of the association was measured on the basis of the ratio of the number of genes from the data set that map to the pathway divided by the total number of genes that map to the canonical pathway (as displayed); and a P-value determining the probability that the association between the genes in the data set and the canonical pathway is explained by chance alone (Fischer s exact test). B-D) Gene and protein interaction networks defined by the 45 gene classifiers validated by qpcr. Three networks were built using Ingenuity Pathway Analysis (IPA) from 14 (B), 13 (C), and 5 (D) genes. Genes or gene products are represented as nodes and the biological relationship between two nodes is represented as an edge (line). The intensity of the node colour corresponds to up- (red) or down- (green) regulation.
128 REFERENCES S1. Su, A.I., Wiltshire, T., Batalov, S., Lapp, H., Ching, K.A., Block, D., Zhang, J., Soden, R., Hayakawa, M., Kreiman, G., et al A gene atlas of the mouse and human protein-encoding transcriptomes. Proc Natl Acad Sci U S A 101: S2. Subramanian, A., Tamayo, P., Mootha, V.K., Mukherjee, S., Ebert, B.L., Gillette, M.A., Paulovich, A., Pomeroy, S.L., Golub, T.R., Lander, E.S., et al Gene set enrichment analysis: a knowledge-based approach for interpreting genome-wide expression profiles. Proc Natl Acad Sci U S A 102:
129 Table S1: Functional gene set enrichment in tolerance-related differentially expressed gene lists (SAM; FDR<0.05) as assessed by gene-set enrichment analysis (GSEA) TOL / Non-TOL differential gene expression data set Enriched in TOL samples P-value FDR q-value Genes with highest enrichment scores Canonical pathways (C2 MSigDB) Propanoate metabolism MCEE, ECHS1, ALDH9A1, PCCA, ALDH3A2 Computational gene sets (C4 MSigDB) Neigborhood of PTPN Il2RB, CD160, PTGDR, KLRF1, KLRD1, KLRK1, KLRC3 Neighborhood of IL2RB Il2RB, CD160, PTGDR, CD244, CX3CR1, PRF1, KIR3DL1 Neigborhood of CD Il2RB, CD160, PTGDR, CD244, CX3CR1, PRF1, SPON2 Neigborhood of MATK IL2RB, PTGDR, ARHGEF3, KLRD1, PRF1, GZMA, ZAP70 Neigborhood of RAB7L IL2RB, KLRD1, KLRF1, APOBEC3G, PTGER2, BIN2, NCR3 Neigborhood of BMPR WDR67, DFFB, IPO8, HDAC9, SMYD2, C22ORF9 Enriched in Non-TOL samples Canonical pathways (C2 MSigDB) IL1R pathway TRAF6, IRAK3, IL1A, IL1R1, IL1R1, NFKBIA Hypertrophy model IFNG, IFDR1, VEGF, IL1A, IL1R1, ATF3 Brest cancer estrogen signaling ITGA6, CDKN2A, FOSL1, SLC7A5, CCNE1, VEGF NFAT signaling IFNG, ITK, RELA, NFKBIB, SLA, FOS, IL8RA Tumor necrosis factor pathway NFKB1, CFLAR, FADD, TNFAIP3, NFKB2, JUN NTHI pathway IL8, TNF, IL1B, NFKBIA, DUSP1, RELA, MAP2K6 CTLA4 pathway CD28, CTLA4, ICOS, PIK3R1, ITK, CD3E, TRA@ CMAC pathway TNF, JUN, NFKBIA, FOS, RELA, RAF1, MAPK3 NFKB pathway TNF,IL1R1, IL1A, TNFAIP3, TRAF6, RELA, FADD Computational gene sets (C4 MSigDB) Neigborhood of MMP CXCL1, TNFAIP6, IL6, PTX3, IL1B, CXCL3 HCV-negative TOL / Non-TOL differential gene expression data set Enriched in TOL samples P-value FDR q-value Genes with highest enrichment scores Canonical pathways (C2 MSigDB) VIPP pathway ERG2, ERG3, PRKAR1B Computational gene sets (C4 MSigDB) Neigborhood of PTPN XCL2, Il2RB, KLRC3, PTGER2, PTGDR, CD160, TUSC4 Neighborhood of CD PTGER2, DOK2, RIN3, CD300A, CD244, BIN2, CX3CR1 Neighborhood of IL2RB XCL2, Il2RB, KLRC3, PTGER2, PTGDR, CD160,ASCL2 Neigborhood of CD XCL2, Il2RB, KLRC3, PTGER2, PTGDR, CD160, TUSC4 Neigborhood of RAB7L XCL2, Il2RB, KLRC3, PTGER2,BIN2, PRF1, NCR3, KLRF1 Neigborhood of MATK IL2RB, PTGDR, ARHGEF3,PRF1, MATK, KLRK1, KLRD1 Neigborhood of RAP1B BIN2, CD97, ELF4, JARID1A, VPS16, RAP2B, Neigborhood of JAK PTGER2, BIN2, ARHGEF3, CD97, NCR3, LOC54103 Enriched in Non-TOL samples Canonical pathways CTLA4 pathway ICOS, CD28, CTLA4, TRA@, PIK3CA, PÎK3R1 CMAC pathway JUN, TNF, FOS, RAF1, PLCB1, MAPK3, RELA Hypertrophy model pathway NR4A3, IFNG, TCF8, IL1R1, HBEGF, ADAM10 Computational gene sets (C4 MSigDB) Neighborhood of EIF3S RPL27A, RPS29, FAU, EIF3S7, RPL11, RPS8 Neighborhood of TPT RPL27A, RPS29, FAU, RPL1, RPS5, RPS8, EEF2 Neighborhood of GLTSCR RPS29, FAU, EEF1B, RPS9, RPL13A, RPS16 Neighborhood of MAX C14ORF11, CSDE1, FAM76D, ABT1, COPS2, CCDC117 Neighborhood of NPM RPL27A, RPS29, FAU, NCL, EIF3S7, RPL11, RPS5, RPS8 Neighborhood of ACTG RPL27A, SSR2, RPS29, FAU, NCL, RPL11, RPS5, RPS8 Neighborhood of CEBPA CYP1A2, HP, ORM1, CYP27A1, CYP2D6, GSTM1, CES1


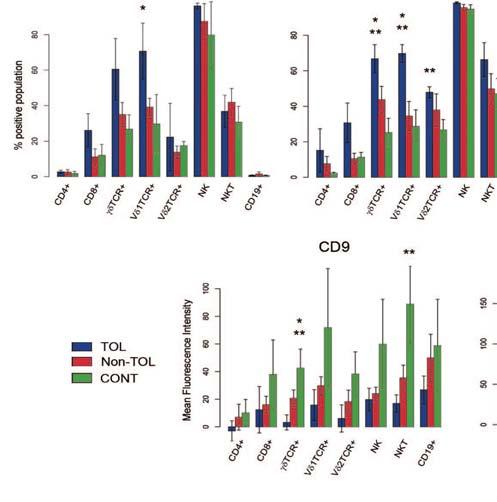

130

131
Structure and Function of Antigen Recognition Molecules
 MICR2209 Structure and Function of Antigen Recognition Molecules Dr Allison Imrie allison.imrie@uwa.edu.au 1 Synopsis: In this lecture we will examine the major receptors used by cells of the innate and
ACTIVATION OF T LYMPHOCYTES AND CELL MEDIATED IMMUNITY
 ACTIVATION OF T LYMPHOCYTES AND CELL MEDIATED IMMUNITY The recognition of specific antigen by naïve T cell induces its own activation and effector phases. T helper cells recognize peptide antigens through
T cell maturation. T-cell Maturation. What allows T cell maturation?
 T-cell Maturation What allows T cell maturation? Direct contact with thymic epithelial cells Influence of thymic hormones Growth factors (cytokines, CSF) T cell maturation T cell progenitor DN DP SP 2ry
Antigen Presentation and T Lymphocyte Activation. Abul K. Abbas UCSF. FOCiS
 1 Antigen Presentation and T Lymphocyte Activation Abul K. Abbas UCSF FOCiS 2 Lecture outline Dendritic cells and antigen presentation The role of the MHC T cell activation Costimulation, the B7:CD28 family
T-cell activation T cells migrate to secondary lymphoid tissues where they interact with antigen, antigen-presenting cells, and other lymphocytes:
 Interactions between innate immunity & adaptive immunity What happens to T cells after they leave the thymus? Naïve T cells exit the thymus and enter the bloodstream. If they remain in the bloodstream,
CELL BIOLOGY - CLUTCH CH THE IMMUNE SYSTEM.
 !! www.clutchprep.com CONCEPT: OVERVIEW OF HOST DEFENSES The human body contains three lines of against infectious agents (pathogens) 1. Mechanical and chemical boundaries (part of the innate immune system)
The development of T cells in the thymus
 T cells rearrange their receptors in the thymus whereas B cells do so in the bone marrow. The development of T cells in the thymus The lobular/cellular organization of the thymus Immature cells are called
T Cell Receptor & T Cell Development
 T Cell Receptor & T Cell Development Questions for the next 2 lectures: How do you generate a diverse T cell population with functional TCR rearrangements? How do you generate a T cell population that
Third line of Defense
 Chapter 15 Specific Immunity and Immunization Topics -3 rd of Defense - B cells - T cells - Specific Immunities Third line of Defense Specific immunity is a complex interaction of immune cells (leukocytes)
ACTIVATION AND EFFECTOR FUNCTIONS OF CELL-MEDIATED IMMUNITY AND NK CELLS. Choompone Sakonwasun, MD (Hons), FRCPT
, FRCPT") ACTIVATION AND EFFECTOR FUNCTIONS OF CELL-MEDIATED IMMUNITY AND NK CELLS Choompone Sakonwasun, MD (Hons), FRCPT Types of Adaptive Immunity Types of T Cell-mediated Immune Reactions CTLs = cytotoxic T lymphocytes
ACTIVATION AND EFFECTOR FUNCTIONS OF CELL-MEDIATED IMMUNITY AND NK CELLS Choompone Sakonwasun, MD (Hons), FRCPT Types of Adaptive Immunity Types of T Cell-mediated Immune Reactions CTLs = cytotoxic T lymphocytes
The Adaptive Immune Response: T lymphocytes and Their Functional Types *
 OpenStax-CNX module: m46560 1 The Adaptive Immune Response: T lymphocytes and Their Functional Types * OpenStax This work is produced by OpenStax-CNX and licensed under the Creative Commons Attribution
1. Overview of Adaptive Immunity
 Chapter 17A: Adaptive Immunity Part I 1. Overview of Adaptive Immunity 2. T and B Cell Production 3. Antigens & Antigen Presentation 4. Helper T cells 1. Overview of Adaptive Immunity The Nature of Adaptive
Adaptive immune responses: T cell-mediated immunity
 MICR2209 Adaptive immune responses: T cell-mediated immunity Dr Allison Imrie allison.imrie@uwa.edu.au 1 Synopsis: In this lecture we will discuss the T-cell mediated immune response, how it is activated,
LESSON 2: THE ADAPTIVE IMMUNITY
 Introduction to immunology. LESSON 2: THE ADAPTIVE IMMUNITY Today we will get to know: The adaptive immunity T- and B-cells Antigens and their recognition How T-cells work 1 The adaptive immunity Unlike
FIT Board Review Corner March 2016
 FIT Board Review Corner March 2016 Welcome to the FIT Board Review Corner, prepared by Sarah Spriet, DO, and Tammy Peng, MD, senior and junior representatives of ACAAI's Fellows-In-Training (FITs) to the
5/1/13. The proportion of thymus that produces T cells decreases with age. The cellular organization of the thymus
 T cell precursors migrate from the bone marrow via the blood to the thymus to mature 1 2 The cellular organization of the thymus The proportion of thymus that produces T cells decreases with age 3 4 1
COURSE: Medical Microbiology, MBIM 650/720 - Fall TOPIC: Antigen Processing, MHC Restriction, & Role of Thymus Lecture 12
 COURSE: Medical Microbiology, MBIM 650/720 - Fall 2008 TOPIC: Antigen Processing, MHC Restriction, & Role of Thymus Lecture 12 FACULTY: Dr. Mayer Office: Bldg. #1, Rm B32 Phone: 733-3281 Email: MAYER@MED.SC.EDU
Defensive mechanisms include :
 Acquired Immunity Defensive mechanisms include : 1) Innate immunity (Natural or Non specific) 2) Acquired immunity (Adaptive or Specific) Cell-mediated immunity Humoral immunity Two mechanisms 1) Humoral
Third line of Defense. Topic 8 Specific Immunity (adaptive) (18) 3 rd Line = Prophylaxis via Immunization!
 (18) 3 rd Line = Prophylaxis via Immunization!") Topic 8 Specific Immunity (adaptive) (18) Topics - 3 rd Line of Defense - B cells - T cells - Specific Immunities 1 3 rd Line = Prophylaxis via Immunization! (a) A painting of Edward Jenner depicts a cow
Topic 8 Specific Immunity (adaptive) (18) Topics - 3 rd Line of Defense - B cells - T cells - Specific Immunities 1 3 rd Line = Prophylaxis via Immunization! (a) A painting of Edward Jenner depicts a cow
Central tolerance. Mechanisms of Immune Tolerance. Regulation of the T cell response
 Immunoregulation: A balance between activation and suppression that achieves an efficient immune response without damaging the host. Mechanisms of Immune Tolerance ACTIVATION (immunity) SUPPRESSION (tolerance)
Mechanisms of Immune Tolerance
 Immunoregulation: A balance between activation and suppression that achieves an efficient immune response without damaging the host. ACTIVATION (immunity) SUPPRESSION (tolerance) Autoimmunity Immunodeficiency
Immunology Basics Relevant to Cancer Immunotherapy: T Cell Activation, Costimulation, and Effector T Cells
 Immunology Basics Relevant to Cancer Immunotherapy: T Cell Activation, Costimulation, and Effector T Cells Andrew H. Lichtman, M.D. Ph.D. Department of Pathology Brigham and Women s Hospital and Harvard
Effector mechanisms of cell-mediated immunity: Properties of effector, memory and regulatory T cells
 ICI Basic Immunology course Effector mechanisms of cell-mediated immunity: Properties of effector, memory and regulatory T cells Abul K. Abbas, MD UCSF Stages in the development of T cell responses: induction
Dr. Yi-chi M. Kong August 8, 2001 Benjamini. Ch. 19, Pgs Page 1 of 10 TRANSPLANTATION
 Benjamini. Ch. 19, Pgs 379-399 Page 1 of 10 TRANSPLANTATION I. KINDS OF GRAFTS II. RELATIONSHIPS BETWEEN DONOR AND RECIPIENT Benjamini. Ch. 19, Pgs 379-399 Page 2 of 10 II.GRAFT REJECTION IS IMMUNOLOGIC
Medical Virology Immunology. Dr. Sameer Naji, MB, BCh, PhD (UK) Head of Basic Medical Sciences Dept. Faculty of Medicine The Hashemite University
 Head of Basic Medical Sciences Dept. Faculty of Medicine The Hashemite University") Medical Virology Immunology Dr. Sameer Naji, MB, BCh, PhD (UK) Head of Basic Medical Sciences Dept. Faculty of Medicine The Hashemite University Human blood cells Phases of immune responses Microbe Naïve
Medical Virology Immunology Dr. Sameer Naji, MB, BCh, PhD (UK) Head of Basic Medical Sciences Dept. Faculty of Medicine The Hashemite University Human blood cells Phases of immune responses Microbe Naïve
RAISON D ETRE OF THE IMMUNE SYSTEM:
 RAISON D ETRE OF THE IMMUNE SYSTEM: To Distinguish Self from Non-Self Thereby Protecting Us From Our Hostile Environment. Innate Immunity Acquired Immunity Innate immunity: (Antigen nonspecific) defense
The Adaptive Immune Response. T-cells
 The Adaptive Immune Response T-cells T Lymphocytes T lymphocytes develop from precursors in the thymus. Mature T cells are found in the blood, where they constitute 60% to 70% of lymphocytes, and in T-cell
Immune Regulation and Tolerance
 Immune Regulation and Tolerance Immunoregulation: A balance between activation and suppression of effector cells to achieve an efficient immune response without damaging the host. Activation (immunity)
Scott Abrams, Ph.D. Professor of Oncology, x4375 Kuby Immunology SEVENTH EDITION
 Scott Abrams, Ph.D. Professor of Oncology, x4375 scott.abrams@roswellpark.org Kuby Immunology SEVENTH EDITION CHAPTER 13 Effector Responses: Cell- and Antibody-Mediated Immunity Copyright 2013 by W. H.
The Adaptive Immune Responses
 The Adaptive Immune Responses The two arms of the immune responses are; 1) the cell mediated, and 2) the humoral responses. In this chapter we will discuss the two responses in detail and we will start
Chapter 22: The Lymphatic System and Immunity
 Bio40C schedule Lecture Immune system Lab Quiz 2 this week; bring a scantron! Study guide on my website (see lab assignments) Extra credit Critical thinking questions at end of chapters 5 pts/chapter Due
The Immune System: Innate and Adaptive Body Defenses Outline PART 1: INNATE DEFENSES 21.1 Surface barriers act as the first line of defense to keep
 The Immune System: Innate and Adaptive Body Defenses Outline PART 1: INNATE DEFENSES 21.1 Surface barriers act as the first line of defense to keep invaders out of the body (pp. 772 773; Fig. 21.1; Table
General Overview of Immunology. Kimberly S. Schluns, Ph.D. Associate Professor Department of Immunology UT MD Anderson Cancer Center
 General Overview of Immunology Kimberly S. Schluns, Ph.D. Associate Professor Department of Immunology UT MD Anderson Cancer Center Objectives Describe differences between innate and adaptive immune responses
Principles of Adaptive Immunity
 Principles of Adaptive Immunity Chapter 3 Parham Hans de Haard 17 th of May 2010 Agenda Recognition molecules of adaptive immune system Features adaptive immune system Immunoglobulins and T-cell receptors
TCR, MHC and coreceptors
 Cooperation In Immune Responses Antigen processing how peptides get into MHC Antigen processing involves the intracellular proteolytic generation of MHC binding proteins Protein antigens may be processed
The Immune System. These are classified as the Innate and Adaptive Immune Responses. Innate Immunity
 The Immune System Biological mechanisms that defend an organism must be 1. triggered by a stimulus upon injury or pathogen attack 2. able to counteract the injury or invasion 3. able to recognise foreign
Transplantation. Immunology Unit College of Medicine King Saud University
 Transplantation Immunology Unit College of Medicine King Saud University Objectives To understand the diversity among human leukocyte antigens (HLA) or major histocompatibility complex (MHC) To know the
The T cell receptor for MHC-associated peptide antigens
 1 The T cell receptor for MHC-associated peptide antigens T lymphocytes have a dual specificity: they recognize polymporphic residues of self MHC molecules, and they also recognize residues of peptide
SEVENTH EDITION CHAPTER
 Judy Owen Jenni Punt Sharon Stranford Kuby Immunology SEVENTH EDITION CHAPTER 16 Tolerance, Autoimmunity, and Transplantation Copyright 2013 by W. H. Freeman and Company Immune tolerance: history * Some
Adaptive Immunity: Specific Defenses of the Host
 17 Adaptive Immunity: Specific Defenses of the Host SLOs Differentiate between innate and adaptive immunity, and humoral and cellular immunity. Define antigen, epitope, and hapten. Explain the function
General Biology. A summary of innate and acquired immunity. 11. The Immune System. Repetition. The Lymphatic System. Course No: BNG2003 Credits: 3.
 A summary of innate and acquired immunity General iology INNATE IMMUNITY Rapid responses to a broad range of microbes Course No: NG00 Credits:.00 External defenses Invading microbes (pathogens). The Immune
Overview of the Lymphoid System
 Overview of the Lymphoid System The Lymphoid System Protects us against disease Lymphoid system cells respond to Environmental pathogens Toxins Abnormal body cells, such as cancers Overview of the Lymphoid
There are 2 major lines of defense: Non-specific (Innate Immunity) and. Specific. (Adaptive Immunity) Photo of macrophage cell
 and. Specific. (Adaptive Immunity) Photo of macrophage cell") There are 2 major lines of defense: Non-specific (Innate Immunity) and Specific (Adaptive Immunity) Photo of macrophage cell Development of the Immune System ery pl neu mφ nk CD8 + CTL CD4 + thy TH1 mye
There are 2 major lines of defense: Non-specific (Innate Immunity) and Specific (Adaptive Immunity) Photo of macrophage cell Development of the Immune System ery pl neu mφ nk CD8 + CTL CD4 + thy TH1 mye
White Blood Cells (WBCs)
") YOUR ACTIVE IMMUNE DEFENSES 1 ADAPTIVE IMMUNE RESPONSE 2! Innate Immunity - invariant (generalized) - early, limited specificity - the first line of defense 1. Barriers - skin, tears 2. Phagocytes - neutrophils,
YOUR ACTIVE IMMUNE DEFENSES 1 ADAPTIVE IMMUNE RESPONSE 2! Innate Immunity - invariant (generalized) - early, limited specificity - the first line of defense 1. Barriers - skin, tears 2. Phagocytes - neutrophils,
Immunology - Lecture 2 Adaptive Immune System 1
 Immunology - Lecture 2 Adaptive Immune System 1 Book chapters: Molecules of the Adaptive Immunity 6 Adaptive Cells and Organs 7 Generation of Immune Diversity Lymphocyte Antigen Receptors - 8 CD markers
Immunology Lecture 4. Clinical Relevance of the Immune System
 Immunology Lecture 4 The Well Patient: How innate and adaptive immune responses maintain health - 13, pg 169-181, 191-195. Immune Deficiency - 15 Autoimmunity - 16 Transplantation - 17, pg 260-270 Tumor
Immunology for the Rheumatologist
 Immunology for the Rheumatologist Rheumatologists frequently deal with the immune system gone awry, rarely studying normal immunology. This program is an overview and discussion of the function of the
Immune System AP SBI4UP
 Immune System AP SBI4UP TYPES OF IMMUNITY INNATE IMMUNITY ACQUIRED IMMUNITY EXTERNAL DEFENCES INTERNAL DEFENCES HUMORAL RESPONSE Skin Phagocytic Cells CELL- MEDIATED RESPONSE Mucus layer Antimicrobial
Objectives. Abbas Chapter 11: Immunological Tolerance. Question 1. Question 2. Question 3. Definitions
 Objectives Abbas Chapter 11: Immunological Tolerance Christina Ciaccio, MD Children s Mercy Hospitals and Clinics February 1, 2010 To introduce the concept of immunologic tolerance To understand what factors
Major Histocompatibility Complex (MHC) and T Cell Receptors
 and T Cell Receptors") Major Histocompatibility Complex (MHC) and T Cell Receptors Historical Background Genes in the MHC were first identified as being important genes in rejection of transplanted tissues Genes within the MHC
Major Histocompatibility Complex (MHC) and T Cell Receptors Historical Background Genes in the MHC were first identified as being important genes in rejection of transplanted tissues Genes within the MHC
T Cell Effector Mechanisms I: B cell Help & DTH
 T Cell Effector Mechanisms I: B cell Help & DTH Ned Braunstein, MD The Major T Cell Subsets p56 lck + T cells γ δ ε ζ ζ p56 lck CD8+ T cells γ δ ε ζ ζ Cα Cβ Vα Vβ CD3 CD8 Cα Cβ Vα Vβ CD3 MHC II peptide
Immunology. T-Lymphocytes. 16. Oktober 2014, Ruhr-Universität Bochum Karin Peters,
 Immunology T-Lymphocytes 16. Oktober 2014, Ruhr-Universität Bochum Karin Peters, karin.peters@rub.de The role of T-effector cells in the immune response against microbes cellular immunity humoral immunity
Test Bank for Basic Immunology Functions and Disorders of the Immune System 4th Edition by Abbas
 Test Bank for Basic Immunology Functions and Disorders of the Immune System 4th Edition by Abbas Chapter 04: Antigen Recognition in the Adaptive Immune System Test Bank MULTIPLE CHOICE 1. Most T lymphocytes
All animals have innate immunity, a defense active immediately upon infection Vertebrates also have adaptive immunity
 1 2 3 4 5 6 7 8 9 The Immune System All animals have innate immunity, a defense active immediately upon infection Vertebrates also have adaptive immunity Figure 43.2 In innate immunity, recognition and
Immunological Tolerance
 Immunological Tolerance Introduction Definition: Unresponsiveness to an antigen that is induced by exposure to that antigen Tolerogen = tolerogenic antigen = antigen that induces tolerance Important for
T cell and Cell-mediated immunity
 T cell and Cell-mediated immunity Lu Linrong ( 鲁林荣 ) PhD Laboratory of Immune Regulation Institute of Immunology Zhejiang University, it School of Medicine i Medical Research Building B815-819 Email: Lu.Linrong@gmail.com
RAISON D ETRE OF THE IMMUNE SYSTEM:
 RAISON D ETRE OF THE IMMUNE SYSTEM: To Distinguish Self from Non-Self Thereby Protecting Us From Our Hostile Environment. Innate Immunity Adaptive Immunity Innate immunity: (Antigen - nonspecific) defense
CHAPTER 9 BIOLOGY OF THE T LYMPHOCYTE
 CHAPTER 9 BIOLOGY OF THE T LYMPHOCYTE Coico, R., Sunshine, G., (2009) Immunology : a short course, 6 th Ed., Wiley-Blackwell 1 CHAPTER 9 : Biology of The T Lymphocytes 1. 2. 3. 4. 5. 6. 7. Introduction
FOCiS. Lecture outline. The immunological equilibrium: balancing lymphocyte activation and control. Immunological tolerance and immune regulation -- 1
 1 Immunological tolerance and immune regulation -- 1 Abul K. Abbas UCSF FOCiS 2 Lecture outline Principles of immune regulation Self-tolerance; mechanisms of central and peripheral tolerance Inhibitory
Adaptive Immunity: Humoral Immune Responses
 MICR2209 Adaptive Immunity: Humoral Immune Responses Dr Allison Imrie 1 Synopsis: In this lecture we will review the different mechanisms which constitute the humoral immune response, and examine the antibody
Prof. Ibtesam Kamel Afifi Professor of Medical Microbiology & Immunology
 By Prof. Ibtesam Kamel Afifi Professor of Medical Microbiology & Immunology Lecture objectives: At the end of the lecture you should be able to: Enumerate features that characterize acquired immune response
The Adaptive Immune Response. B-cells
 The Adaptive Immune Response B-cells The innate immune system provides immediate protection. The adaptive response takes time to develop and is antigen specific. Activation of B and T lymphocytes Naive
The Major Histocompatibility Complex (MHC)
") The Major Histocompatibility Complex (MHC) An introduction to adaptive immune system before we discuss MHC B cells The main cells of adaptive immune system are: -B cells -T cells B cells: Recognize antigens
The Major Histocompatibility Complex (MHC) An introduction to adaptive immune system before we discuss MHC B cells The main cells of adaptive immune system are: -B cells -T cells B cells: Recognize antigens
WHY IS THIS IMPORTANT?
 CHAPTER 16 THE ADAPTIVE IMMUNE RESPONSE WHY IS THIS IMPORTANT? The adaptive immune system protects us from many infections The adaptive immune system has memory so we are not infected by the same pathogen
Determinants of Immunogenicity and Tolerance. Abul K. Abbas, MD Department of Pathology University of California San Francisco
 Determinants of Immunogenicity and Tolerance Abul K. Abbas, MD Department of Pathology University of California San Francisco EIP Symposium Feb 2016 Why do some people respond to therapeutic proteins?
Effector T Cells and
 1 Effector T Cells and Cytokines Andrew Lichtman, MD PhD Brigham and Women's Hospital Harvard Medical School 2 Lecture outline Cytokines Subsets of CD4+ T cells: definitions, functions, development New
IMMUNOBIOLOGY OF TRANSPLANTATION. Wasim Dar
 IMMUNOBIOLOGY OF TRANSPLANTATION Wasim Dar Immunobiology of Transplantation Overview Transplantation: A complex immunologic process Contributions Innate Immunity Adaptive immunity T Cells B Cells HLA Consequences
chapter 17: specific/adaptable defenses of the host: the immune response
 chapter 17: specific/adaptable defenses of the host: the immune response defense against infection & illness body defenses innate/ non-specific adaptable/ specific epithelium, fever, inflammation, complement,
Mucosal Immune System
 Exam Format 100 points - 60 pts mandatory; 40 points where 4, 10 point questions will be chosen Some open-ended questions, some short answer. Kuby question Cytokines Terminology How do cytokines achieve
T Cell Development. Xuefang Cao, MD, PhD. November 3, 2015
 T Cell Development Xuefang Cao, MD, PhD November 3, 2015 Thymocytes in the cortex of the thymus Early thymocytes development Positive and negative selection Lineage commitment Exit from the thymus and
Tolerance, autoimmunity and the pathogenesis of immunemediated inflammatory diseases. Abul K. Abbas UCSF
 Tolerance, autoimmunity and the pathogenesis of immunemediated inflammatory diseases Abul K. Abbas UCSF Balancing lymphocyte activation and control Activation Effector T cells Tolerance Regulatory T cells
TRANSPLANT IMMUNOLOGY. Shiv Pillai Ragon Institute of MGH, MIT and Harvard
 TRANSPLANT IMMUNOLOGY Shiv Pillai Ragon Institute of MGH, MIT and Harvard Outline MHC / HLA Direct vs indirect allorecognition Alloreactive cells: where do they come from? Rejection and Immunosuppression
T cell development October 28, Dan Stetson
 T cell development October 28, 2016 Dan Stetson stetson@uw.edu 441 Lecture #13 Slide 1 of 29 Three lectures on T cells (Chapters 8, 9) Part 1 (Today): T cell development in the thymus Chapter 8, pages
Mon, Wed, Fri 11:00 AM-12:00 PM. Owen, Judy, Jenni Punt, and Sharon Stranford Kuby-Immunology, 7th. Edition. W.H. Freeman and Co., New York.
 Course Title: Course Number: Immunology Biol-341/541 Semester: Fall 2013 Location: HS 268 Time: Instructor: 8:00-9:30 AM Tue/Thur Dr. Colleen M. McDermott Office: Nursing Ed 101 (424-1217) E-mail*: mcdermot@uwosh.edu
M.Sc. III Semester Biotechnology End Semester Examination, 2013 Model Answer LBTM: 302 Advanced Immunology
 Code : AS-2246 M.Sc. III Semester Biotechnology End Semester Examination, 2013 Model Answer LBTM: 302 Advanced Immunology A. Select one correct option for each of the following questions:- 2X10=10 1. (b)
T Lymphocyte Activation and Costimulation. FOCiS. Lecture outline
 1 T Lymphocyte Activation and Costimulation Abul K. Abbas, MD UCSF FOCiS 2 Lecture outline T cell activation Costimulation, the B7:CD28 family Inhibitory receptors of T cells Targeting costimulators for
Putting it Together. Stephen Canfield Secondary Lymphoid System. Tonsil Anterior Cervical LN s
 Putting it Together Stephen Canfield smc12@columbia.edu Secondary Lymphoid System Tonsil Anterior Cervical LN s Axillary LN s Mediastinal/Retroperitoneal LN s Thoracic Duct Appendix Spleen Inguinal LN
The Innate Immune Response
 The Innate Immune Response FUNCTIONS OF THE IMMUNE SYSTEM: Recognize, destroy and clear a diversity of pathogens. Initiate tissue and wound healing processes. Recognize and clear damaged self components.
Cellular Immune response. Jianzhong Chen, Ph.D Institute of immunology, ZJU
 Cellular Immune response Jianzhong Chen, Ph.D Institute of immunology, ZJU Concept of adaptive immune response T cell-mediated adaptive immune response I. Concept of immune response A collective and coordinated
Immunity. Acquired immunity differs from innate immunity in specificity & memory from 1 st exposure
 Immunity (1) Non specific (innate) immunity (2) Specific (acquired) immunity Characters: (1) Non specific: does not need special recognition of the foreign cell. (2) Innate: does not need previous exposure.
Preface and Acknowledgments Preface and Acknowledgments to the Third Edition Preface to the Second Edition Preface to the First Edition
 Preface and Acknowledgments p. xxi Preface and Acknowledgments to the Third Edition p. xxiii Preface to the Second Edition p. xxv Preface to the First Edition p. xxvii Acknowledgments to the First and
Cellular Pathology of immunological disorders
 Cellular Pathology of immunological disorders SCBM344 Cellular and Molecular Pathology Witchuda Payuhakrit, Ph.D (Pathobiology) witchuda.pay@mahidol.ac.th Objectives Describe the etiology of immunological
Physiology Unit 3. ADAPTIVE IMMUNITY The Specific Immune Response
 Physiology Unit 3 ADAPTIVE IMMUNITY The Specific Immune Response In Physiology Today The Adaptive Arm of the Immune System Specific Immune Response Internal defense against a specific pathogen Acquired
T cell and Cell-mediated immunity
 T cell and Cell-mediated immunity ( 第十章 第十二章第十二章 ) Lu Linrong ( 鲁林荣 ) PhD Laboratory of Immune Regulation Institute of Immunology Zhejiang University, School of Medicine Medical Research Building B815-819
Immunological Aspects of Parasitic Diseases in Immunocompromised Individuals. Taniawati Supali. Department of Parasitology
 Immunological Aspects of Parasitic Diseases in Immunocompromised Individuals Taniawati Supali Department of Parasitology 1 Defense mechanism in human Th17 (? ) Acute Chronic Th1 Th 2 Intracellular Treg
Chapter 1. Chapter 1 Concepts. MCMP422 Immunology and Biologics Immunology is important personally and professionally!
 MCMP422 Immunology and Biologics Immunology is important personally and professionally! Learn the language - use the glossary and index RNR - Reading, Note taking, Reviewing All materials in Chapters 1-3
1. The scavenger receptor, CD36, functions as a coreceptor for which TLR? a. TLR ½ b. TLR 3 c. TLR 4 d. TLR 2/6
 Allergy and Immunology Review Corner: Cellular and Molecular Immunology, 8th Edition By Abul K. Abbas, MBBS, Andrew H. H. Lichtman, MD, PhD and Shiv Pillai, MBBS, PhD. Chapter 4 (pages 62-74): Innate Immunity
Chapter 10 (pages ): Differentiation and Functions of CD4+ Effector T Cells Prepared by Kristen Dazy, MD, Scripps Clinic Medical Group
: Differentiation and Functions of CD4+ Effector T Cells Prepared by Kristen Dazy, MD, Scripps Clinic Medical Group") FIT Board Review Corner September 2015 Welcome to the FIT Board Review Corner, prepared by Andrew Nickels, MD, and Sarah Spriet, DO, senior and junior representatives of ACAAI's Fellows-In-Training (FITs)
FIT Board Review Corner September 2015 Welcome to the FIT Board Review Corner, prepared by Andrew Nickels, MD, and Sarah Spriet, DO, senior and junior representatives of ACAAI's Fellows-In-Training (FITs)
Lecture outline. Immunological tolerance and immune regulation. Central and peripheral tolerance. Inhibitory receptors of T cells. Regulatory T cells
 1 Immunological tolerance and immune regulation Abul K. Abbas UCSF 2 Lecture outline Central and peripheral tolerance Inhibitory receptors of T cells Regulatory T cells 1 The immunological equilibrium:
MCB 4211 Basic Immunology 2nd Exam; 10/26/17 Peoplesoft #:
 For this first section, circle the letter that precedes the best answer for each of the following multiple-choice questions. LOOK AT ALL ALTERNATIVES BEFORE CHOOSING YOUR ANSWER. 1. The TcR (T cell receptor)
T Cell Activation. Patricia Fitzgerald-Bocarsly March 18, 2009
 T Cell Activation Patricia Fitzgerald-Bocarsly March 18, 2009 Phases of Adaptive Immune Responses Phases of T cell responses IL-2 acts as an autocrine growth factor Fig. 11-11 Clonal Expansion of T cells
Shiv Pillai Ragon Institute, Massachusetts General Hospital Harvard Medical School
 CTLs, Natural Killers and NKTs 1 Shiv Pillai Ragon Institute, Massachusetts General Hospital Harvard Medical School CTL inducing tumor apoptosis 3 Lecture outline CD8 + Cytotoxic T lymphocytes (CTL) Activation/differentiation
Defense mechanism against pathogens
 Defense mechanism against pathogens Immune System What is immune system? Cells and organs within an animal s body that contribute to immune defenses against pathogens ( ) Bacteria -Major entry points ;open
Immune system. Aims. Immune system. Lymphatic organs. Inflammation. Natural immune system. Adaptive immune system
 Aims Immune system Lymphatic organs Inflammation Natural immune system Adaptive immune system Major histocompatibility complex (MHC) Disorders of the immune system 1 2 Immune system Lymphoid organs Immune
General information. Cell mediated immunity. 455 LSA, Tuesday 11 to noon. Anytime after class.
 General information Cell mediated immunity 455 LSA, Tuesday 11 to noon Anytime after class T-cell precursors Thymus Naive T-cells (CD8 or CD4) email: lcoscoy@berkeley.edu edu Use MCB150 as subject line
SINGLE CHOICE. 5. The gamma invariant chain binds to this molecule during its intracytoplasmic transport. A TCR B BCR C MHC II D MHC I E FcγR
 A Name: Group: SINGLE CHOICE 1. Which is the most important ligand of TLR5? A endospore B flagellin C polysaccharide capsule D DNA E pilus 2. The antibody-binding site is formed primarily by... A the constant
HLA and antigen presentation. Department of Immunology Charles University, 2nd Medical School University Hospital Motol
 HLA and antigen presentation Department of Immunology Charles University, 2nd Medical School University Hospital Motol MHC in adaptive immunity Characteristics Specificity Innate For structures shared
Chapter 11. B cell generation, Activation, and Differentiation. Pro-B cells. - B cells mature in the bone marrow.
 Chapter B cell generation, Activation, and Differentiation - B cells mature in the bone marrow. - B cells proceed through a number of distinct maturational stages: ) Pro-B cell ) Pre-B cell ) Immature
Clinical Basis of the Immune Response and the Complement Cascade
 Clinical Basis of the Immune Response and the Complement Cascade Bryan L. Martin, DO, MMAS, FACAAI, FAAAAI, FACOI, FACP Emeritus Professor of Medicine and Pediatrics President, American College of Allergy,