Cost of disorders of the brain in Europe 2010
|
|
|
- Buck Morgan
- 5 years ago
- Views:
Transcription
1 Cost of disorders of the brain in Europe 2010 Anders Gustavsson a, Mikael Svensson b, Frank Jacobi c, Christer Allgulander d, Jordi Alonso e, Ettore Beghi f, Richard Dodel g, Mattias Ekman a, Carlo Faravelli h, Laura Fratiglioni i, Brenda Gannon j, David Hilton Jones k, Poul Jennum l, Albena Jordanova m, n, o, Linus Jönsson a, Korinna Karampampa a, Martin Knapp p, q, Gisela Kobelt r, s, Tobias Kurth t, Roselind Lieb u, Mattias Linde v, w, Christina Ljungcrantz a, Andreas Maercker x, Beatrice Melin y, Massimo Moscarelli z, aa, Amir Musayev a, Fiona Norwood ab, Martin Preisig ac, Maura Pugliatti ad, Juergen Rehm ae, af, Luis Salvador-Carulla ag, ah, Brigitte Schlehofer ai, Roland Simon aj, Hans- Christoph Steinhausen ak, al, am, Lars Jacob Stovner an, Jean-Michel Vallat ao, Peter Van den Bergh ap, Jim van Os aq, ar, Pieter Vos as, Weili Xu i, Hans-Ulrich Wittchen c, Bengt Jönsson at, Jes Olesen au,* on behalf of the CDBE2010 study group 1 a OptumInsight, Stockholm, Sweden b Department of Economics and Statistics, Karlstad University, Sweden c Institute of Clinical Psychology and Psychotherapy, Centre of Epidemiology and Longitudinal Studies (CELOS), Technische Universität Dresden, Dresden, Germany d Department of Clinical Neuroscience, Karolinska University Hospital, Huddinge, Sweden e Health Services Research Unit, IMIM-Hospital del Mar, Barcelona, Spain f Laboratorio Malattie Neurologiche, Istituto Mario Negri, Milano, Italy g Department of Neurology Marburg, Philips University Marburg, Germany h Department of Psychology, Florence University, Italy i Aging Research Centre, Karolinska Institute, Stockholm, Sweden j Academic Unit of Health Economics, Leeds Institute of Health Sciences, Leeds, UK k Department of Clinical Neurology, John Radcliffe Hospital, Oxford, UK l Centre for Sleep Medicine, Glosptup Hospital, Copenhagen, Denmark m Department of Molecular Genetics, VIB, Antwerpen, Belgium n Neurogenetics Laboratory, Institute Born Bunge, University of Antwerp, Antwerpen, Belgium o Department of Chemistry and Biochemistry, Molecular Medicine Centre, Medical University-Sofia, Bulgaria p Personal Social Services Research Unit, London School of Economics, UK q Centre for the Economics of Mental Health at the Institute of Psychiatry, King's College London, UK r Lund University, Sweden s European Health Economics, Mulhouse, France t Department of Epidemiology, Harvard School of Public Health, USA u Department of Psychology, University of Basel, Switzerland v Department of Neuroscience, Norwegian University of Science and Technology, Trondheim, Norway w Division of Neurology and Neurophysiology, St Olavs Hospital, Trondheim, Norway x Department of Psychology, University of Zurich, Switzerland y Department of Oncology, University of Umeå, Umeå, Sweden z International Centre of Mental Health Policy and Economics, Milan, Italy aa Harvard Medical School, USA ab Department of Neurology, King's College Hospital, London, UK ac Department of Psychiatry, University Hospital Centre and University of Lausanne, Switzerland ad Department of Neurosciences, University of Sassari, Italy ae Technische Universität Dresden, Germany af Centre for Addiction and Mental Health, Toronto, Canada ag Asociación Científica PSICOST, Jerez de la Frontera, Spain ah Psiquiatría, Departamento de Neurociencias, Universidad de Cádiz, Spain ai German Cancer Research Centre, Heidelberg, Germany aj European Monitoring Centre for Drugs and Drug Addiction (EMCDDA), Lisbon, Portugal ak Aalborg Psychiatric Hospital, Denmark al Clinical Psychology and Epidemiology, Institute of Psychology, University of Basel, Switzerland am Department of Child and Adolescent Psychiatry, University of Zurich, Switzerland 1 See Table 1
2 an Norwegian National Headache Centre, Department of Neuroscience, Norwegian University of Science and Technology (NTNU) and St. Olavs Hospital, Trondheim, Norway ao Centre national de référence "neuropathies périphériques rares", Department of Neurology, University Hospital, Limoges, France ap Centre De Référence Neuromusculaire, Cliniques universitaires Saint-Luc, Université catholique de Louvain, Brussels, Belgium aq Department of Psychiatry and Psychology, South Limburg Mental Health Research and Teaching Network, Maastricht University Medical Centre, Maastricht, The Netherlands ar Division of Psychological Medicine, Institute of Psychiatry, King's College London, London, UK as Radboud University, Department of Neurology, Nijmegen, The Netherlands at Stockholm School of Economics, Stockholm, Sweden au Danish Headache Centre at the Department of Neurology, Glostrup University Hospital, Denmark Abstract Background: The spectrum of disorders of the brain is large, covering hundreds of disorders that are listed in either the mental or neurological disorder chapters of the established international diagnostic classification systems. These disorders have a high prevalence as well as short- and long-term impairments and disabilities. Therefore they are an emotional, financial and social burden to the patients, their families and their social network. In a 2005 landmark study, we estimated for the first time the annual cost of 12 major groups of disorders of the brain in Europe and gave a conservative estimate of 386 billion for the year This estimate was limited in scope and conservative due to the lack of sufficiently comprehensive epidemiological and/or economic data on several important diagnostic groups. We are now in a position to substantially improve and revise the 2004 estimates. In the present report we cover 19 major groups of disorders, 7 more than previously, of an increased range of age groups and more cost items. We therefore present much improved cost estimates. Our revised estimates also now include the new EU member states, and hence a population of 514 million people. Aims: To estimate the number of persons with defined disorders of the brain in Europe in 2010, the total cost per person related to each disease in terms of direct and indirect costs, and an estimate of the total cost per disorder and country. Methods: The best available estimates of the prevalence and cost per person for 19 groups of disorders of the brain (covering well over 100 specific disorders) were identified via a systematic review of the published literature. Together with the twelve disorders included in 2004, the following range of mental and neurologic groups of disorders is covered: addictive disorders, affective disorders, anxiety disorders, brain tumor, childhood and adolescent disorders (developmental disorders), dementia, eating disorders, epilepsy, mental retardation, migraine, multiple sclerosis, neuromuscular disorders, Parkinson's disease, personality disorders, psychotic disorders, sleep disorders, somatoform disorders, stroke, and traumatic brain injury. Epidemiologic panels were charged to complete the literature review for each disorder in order to estimate the 12-month prevalence, and health economic panels were charged to estimate best cost-estimates. A cost model was developed to combine the epidemiologic and economic data and estimate the total cost of each disorder in each of 30 European countries (EU27+Iceland, Norway and Switzerland). The cost model was populated with national statistics from Eurostat to adjust all costs to 2010 values, converting all local currencies to Euro, imputing costs for countries where no data were available, and aggregating country estimates to purchasing power parity adjusted estimates for the total cost of disorders of the brain in Europe Results: The total cost of disorders of the brain was estimated at 798 billion in Direct costs constitute the majority of costs (37% direct healthcare costs and 23% direct non-medical costs) whereas the remaining 40% were indirect costs associated with
3 patients' production losses. On average, the estimated cost per person with a disorder of the brain in Europe ranged between 285 for headache and 30,000 for neuromuscular disorders. The European per capita cost of disorders of the brain was 1550 on average but varied by country. The cost (in billion PPP 2010) of the disorders of the brain included in this study was as follows: addiction: 65.7; anxiety disorders: 74.4; brain tumor: 5.2; child/adolescent disorders: 21.3; dementia: 105.2; eating disorders: 0.8; epilepsy: 13.8; headache: 43.5; mental retardation: 43.3; mood disorders: 113.4; multiple sclerosis: 14.6; neuromuscular disorders: 7.7; Parkinson's disease: 13.9; personality disorders: 27.3; psychotic disorders: 93.9; sleep disorders: 35.4; somatoform disorder: 21.2; stroke: 64.1; traumatic brain injury: It should be noted that the revised estimate of those disorders included in the previous 2004 report constituted 477 billion, by and large confirming our previous study results after considering the inflation and population increase since Further, our results were consistent with administrative data on the health care expenditure in Europe, and comparable to previous studies on the cost of specific disorders in Europe. Our estimates were lower than comparable estimates from the US. Discussion: This study was based on the best currently available data in Europe and our model enabled extrapolation to countries where no data could be found. Still, the scarcity of data is an important source of uncertainty in our estimates and may imply over- or underestimations in some disorders and countries. Even though this review included many disorders, diagnoses, age groups and cost items that were omitted in 2004, there are still remaining disorders that could not be included due to limitations in the available data. We therefore consider our estimate of the total cost of the disorders of the brain in Europe to be conservative. In terms of the health economic burden outlined in this report, disorders of the brain likely constitute the number one economic challenge for European health care, now and in the future. Data presented in this report should be considered by all stakeholder groups, including policy makers, industry and patient advocacy groups, to reconsider the current science, research and public health agenda and define a coordinated plan of action of various levels to address the associated challenges. Recommendations: Political action is required in light of the present high cost of disorders of the brain. Funding of brain research must be increased; care for patients with brain disorders as well as teaching at medical schools and other health related educations must be quantitatively and qualitatively improved, including psychological treatments. The current move of the pharmaceutical industry away from brain related indications must be halted and reversed. Continued research into the cost of the many disorders not included in the present study is warranted. It is essential that not only the EU but also the national governments forcefully support these initiatives. 1. Introduction 1.1. EBC study on cost of disorders of the brain in 2005 In 2005, the European Brain Council published the results of a comprehensive study estimating the cost of disorders of the brain in Europe in 2004 (Andlin-Sobocki et al., 2005; Wittchen and Jacobi, 2005), below called the EBC2005 study. The label disorders of the brain or in short brain disorders was chosen to acknowledge the communalities of mental and neurological disorders in terms of their substrate, the brain, as well as the increasingly broader evidence that both disciplines, despite different traditions, share many common methods and approaches. It should also be mentioned that various other terms that at least partly overlap exist, such as neuropsychiatric disorders, or MNS (mental, neurological and substance use disorders).
4 In the EBC2005 study, the total cost in Europe, including the EU member states, Iceland, Norway and Switzerland, was estimated at 386 billion in 2004, distributed over 12 diagnostic groups of important disorders of the brain affecting 127 million adult Europeans. The study was labeled a benchmark study because it was the first ever to attempt to combine the available epidemiologic and economic evidence of disorders of the brain in an effort to estimate their total cost within a common methodological framework. Moreover, it was instrumental in demonstrating the large societal cost associated with disorders of the brain and the importance of decisions on future strategies to alleviate their burden. The EBC2005 report had an enormous impact on various levels. Numerous highly listed disorder-specific and country-specific reports further exploring the economic consequences of disorders of the brain were important spin-offs of this first report. The 2005 report was presented to the European Commission and to European parliamentarians and has undoubtedly played a role in increasing the focus and shaping the political agenda on brain research and brain diseases at a European and national level. As a consequence, the number of studies exploring different aspects of the cost of disorders of the brain has steadily increased over time. In 2005, about 400 studies including the key words cost and brain were published (THOMSON REUTERS (ISI) Over the next four years, this figure almost doubled, partly spurred by new initiatives coming out of the EBC2005 study (Andlin-Sobocki et al., 2005) (Fig. 1) Need for revision Our 2005 report could not cover many important disorders and cost items, mainly due to lack of data. During the past five years, the evidence base has grown and there are now possibilities for including previously omitted diagnoses and cost items. The larger evidence base also enables better precision in some of the estimates of the previously reviewed disorders of the brain. Further, Bulgaria and Romania are now part of the European Union and therefore are included in the present study. Since 2005, important steps have been taken to strengthen the research focusing on the disorders of the brain in Europe, most importantly the specific mention of mental health and brain research in the seventh framework program of research (FP7). However, there were also some more recent negative developments, such as the withdrawal of a number of major pharmaceutical companies from key areas of neuroscience research (Nutt and Goodwin, 2011) and the move of industrial research away from Europe. While new initiatives, such as the Innovative Medicines Initiative by the EU, may give new opportunities, it is increasingly important that relevant information on the cost of disorders of the brain becomes available to decision makers. The present update and extension of the EBC2005 study is an attempt to fill this gap. It will hopefully serve to inform policy makers about the need for continuous focus on disorders of the brain in the forthcoming eighth framework program of research (FP8) Description of the study team The study was commissioned by the European Brain Council (EBC). It was designed and managed by a steering committee including professors Jes Olesen, Hans-Ulrich Wittchen and Bengt Jönsson in collaboration with lead health economists Anders Gustavsson and Mikael Svensson.
5 The review of epidemiological data was conducted by panels of European experts (one panel for each disorder). The panel members for each disorder are listed in Table 1. A health economic expert panel was formed with the aim to validate the study design and assist in the interpretation of data. The panel was chaired by Prof Bengt Jönsson and included the following members: Dr. Gisela Kobelt, Dr. Linus Jönsson, Prof. Massimo Moscarelli and Prof. Martin Knapp. The coordination of the study, review of the economic data, analysis of data and drafting of reports was conducted by the company OptumInsight, led by Anders Gustavsson. The employees at OptumInsight contributing to this study included Korinna Karampampa, Mattias Ekman, Amir Musayev, Brenda Gannon and Christina Ljungcrantz Study objective The objective of this study was to estimate: 1. the number of persons with defined disorders of the brain in Europe in the total cost per person related to each disease by specifying direct and indirect costs 3. to estimate the total cost per disorder and country. More generally, the aim was to provide a revised, improved, up-to-date estimate of the cost of disorders of the brain in all of Europe, incorporating relevant cost items, diagnoses and age groups that were not included in the EBC2005 study due to limitations in the available data. 2. Methods 2.1. Study scope Disorders of the brain The methods and design of this study have already been presented largely in a separate publication mainly focusing on epidemiological data (Wittchen et al., 2011). The list of all diagnostic groups (ICD-10 codes) included in the study is presented in Table Geographical scope All 27members of the European Union (EU27) and Iceland, Norway and Switzerland are included in this study. These 30 countries are two more than in the EBC2005 study (Andlin- Sobocki et al., 2005) in which Bulgaria and Romania were not included (they joined the EU on January 1st 2007). These countries overall comprise a total of 514 million people (Table 3) Methodological approach The aim of a cost of illness study is to assess the cost of a defined disease. There are several approaches to this; the chosen approach depends on the specific purpose of the study and the data available Societal perspective This study has a societal perspective which implies that we have considered the costs of all resources used or lost due to the disease, irrespective of who the payer is. This perspective is the most relevant for decision makers whose main interest is the welfare of the society as a
6 whole. It is also the relevant perspective for judging if all costs are included but it is important to include each cost item only once in order to avoid double counting. Other perspectives, such as that of a health care provider, may only consider the costs of a certain hospital in order to optimize the health care delivery of that hospital within a given budget. Costs are presented in three main categories: a) direct health care costs (i.e. all goods and services related to the prevention, diagnosis and treatment of a disorder; e.g. physician visits, hospitalizations and pharmaceuticals), b) direct non-medical costs (i.e. other goods and services related to the disorder; e.g. social services, special accommodation and informal care), and c) indirect costs (i.e. lost production due to work absence or early retirement). Informal care is sometimes considered to be an indirect cost but we have chosen to include it under direct non-medical costs because it replaces formal services that would have fallen into this category. We have excluded a number of cost items from our estimates due to the lack of data or lack of consistent methods on how to value and report these costs. These include indirect costs due to premature mortality, intangible costs (i.e. the monetary value of suffering from a disorder), and costs of crime caused by e.g. addiction. We have also excluded costs related to research because they are not considered to be caused by the disorder per se, but rather as an investment aimed at reducing the costs in the future. Moreover, to a large extent, research costs will likely be reflected in the prices of potential treatment interventions coming out of this research Prevalence-based approach The total cost of a disorder can be calculated by combining epidemiologic (number of patients) and economic data (cost per patient), and there are two main approaches for this. The prevalence-based approach multiplies the total number of persons affected by a disorder in a given year (this means 12-month period) with their mean cost in the same year. The alternative, incidence-based approach, multiplies the total number of new onset persons with a disease in a given year with the life-time cost of these new persons. If all underlying conditions (e.g. incidence rate, mortality, population size, treatment practices and prices) would be stable over time, the prevalence-based and incidence- based approaches would give the same result. In practice, the two methods are based on different data and assumptions and thus might give different results and interpretations (Hodgson and Meiners, 1982). We chose the prevalence-based approach for several reasons. First, it fits the specific study objective to estimate the cost attributed to the disease in a given year (2010) rather than estimating the life-time cost of patients first diagnosed in this year. Second, for most disorders of the brain included in this study, annual prevalence data is available whereas incidence studies are rare, due to the inherent methodological complexities and higher costs involved in doing such studies. Third, it enables the comparison with the EBC2005 study results as the prevalence-based approach was used in that study as well (Andlin-Sobocki et al., 2005). Fourth, most available economic data provide estimates of the costs of patients over a short period of time rather than life-time costs. Moreover, most brain disorders have an insidious onset followed by worsening and often chronic symptoms, and for such conditions the most reliable epidemiologic data constitute prevalence estimates derived from community-based samples. However, there are exceptions (e.g. stroke and traumatic brain injury) which differ from the other disorders in that their onset is sudden and followed by an intensive period of care followed by rehabilitation and potentially cure. For such disorders, incidence rates are mainly available and the cost of patients during a period following disease onset. In the EBC2005 study only the cost of the first year following incident cases of stroke and traumatic
7 brain injury was reported (Andlin- Sobocki et al., 2005). In this study, we have also included estimates on the cost of patients suffering from the long term consequences of these two diseases, as an approximation of the costs for patients with a previous onset of disease Bottom up cost-of-illness In the so called bottom up cost-of-illness studies, cost data are collected by identifying persons with a certain disease and assessing their individual cost (e.g. by interview, questionnaire or review of their medical records). The mean cost per person is then multiplied by the number of persons to get an estimate of the total cost. The alternative top down method uses national or regional statistics on the total costs of a group of disorders/in a country/etc. to tease out the cost of a certain disease. Bottom up studies benefit from often being more complete in terms of what resources are available, andmore accurate in terms of the selection of persons because the information on diagnoses are usually sparse in the available national statistics. The disadvantage of bottom up studies is a higher risk of double-counting costs as a certain person may suffer from several disorders, and it is generally difficult to determine which one that is actually causing the costs. This problemis handled in most cost-of-illness studies by trying to separate and only count the specific costs due to the disorder, rather than the total cost of a patient with the disorder. This can be done by asking the person to report only the resources used due to the disorder of interest, and by including only the treatments that are specific for the disorder. Another approach is to compare the total cost for patients with the disorder with a matched control group without the disorder, and consider the difference in cost to be caused by the disorder of interest (Hodgson and Meiners, 1982). We aimed to identify patient level data on annual direct and indirect costs for each disorder; however, in the case that no other data was available, we made use of estimates from top down studies. Such estimates, often based on main diagnoses for hospitalization or other events, were also used for the validation of the bottom up estimates Selection of patient samples Many cost studies are based on patient convenience samples recruited from a clinic, health care center or for a specific study with defined inclusion and exclusion criteria. Such samples may not be representative of the persons with that disorder in the general population. For instance, patients seen at a specialist treatment center might be considered to be typically more severe than patients in the general patient population or in primary care. By contrast, epidemiologic studies are typically designed to be representative to the general population or fractions thereof by recruiting persons according to random sampling plans based on registers of the total population in a specific region or the whole country (so-called community surveys). Such differences should be considered when the cost per patient and the prevalence data are multiplied to give an estimate of the total cost of the disorder. Proper considerations of such differences can be partially accounted for by separating the treated and untreated patient populations and use different cost estimates for the two, or use separate cost per patient and prevalence estimates for patients at different ages or severity of disease. Such methods were used in this study to avoid inflated estimates and to improve transparency and validity, but the specific disaggregation was determined separately for each disorder depending on its characteristics and the available data. Another problem inherent in our approach is that prevalence data from community study rarely covers the whole age range. Frequently prevalence data from the same study are only available for children and adolescents or only adults and/or the elderly. Rarely is the full spectrum of all ages covered within one single study design, mostly due to the different assessment needs. Thus it remains sometimes questionable to what age range the respective
8 epidemiological and cost data apply. In case of doubt, one should choose a conservative approach only applying cost data to those prevalence data, for which the valid age range has been established Prevalence data search The epidemiologic data in this report was retrieved from published literature, obtained from a disorder specific literature review performed by the epidemiologic panels. The review sought to identify the 12-month prevalence data by disorder and country. For many disorders, country specific data was either not available or did not provide sufficient detail. In these cases we extrapolated the available evidence for countries with data to countries without data. In order to validate this procedure, country-specific surveys were additionally performed, reported elsewhere (Wittchen et al., 2011). Where applicable, the prevalence data was stratified by age, gender and disease severity. See disorder specific information below for details Cost data search A search for relevant cost literature was carried out in the electronic bibliographic database PubMed (MEDLINE). From this search we expect to have identified all relevant published original research articles from all relevant peer-reviewed journals. The search strings were combinations of search terms for each specific disorder, search terms related to cost studies, and a list of relevant countries (see appendix for detailed search strings). The title and abstracts of all hits with an English abstract were reviewed in order to exclude that articles that did not provide relevant information. The articles that could potentially include useful information were reviewed as full texts. The search was conducted between January and June The inclusion criteria were as follows: The article included data on costs or resource use. The data was based on a sample of patients with the relevant diagnosis. The article included data from any of 30 European countries (EU27, Iceland, Norway and Switzerland). The article was written in English, French, German, Italian or Spanish. The article was published on January 1st 2004 or later. The study had sound and robust methodology for patient selection, data collection, instrumentation, statistical analysis and reporting of results. Articles reporting the cost of patients in clinical trials were excluded, because these are generally not considered to be representative of the patient population in clinical practice. Review articles including data on cost-of-illness studies were included and their reference lists were searched for relevant original research articles. Cost-effectiveness studies were searched for relevant input data but were excluded if they were only based on data from clinical trials or assumptions. The reference lists of the identified studies were reviewed for further inclusion of relevant original research articles. Finally, the studies identified in the previous EBC study (Andlin-Sobocki et al., 2005) were included. Country specific data for each disorder was used as input in the European cost of illness (COI) model. When there were several studies for one disorder and country, the un-weighted mean of several estimates was calculated. In some cases where one study was preferred to others, a rationale was provided for only considering the preferred study in the model calculations Description of the European COI model The total cost of each disorder for all European countries was estimated by multiplying the cost and prevalence estimates identified in the literature review. However, in many countries there were not sufficient data available. Moreover, the available cost estimates were from various years and were reported in various currencies. We therefore developed a European COI model to enable estimation of
9 the total cost of all brain disorders in 2010, in each country and with a comparable currency. The following sections describe this model Adjusting cost estimates to 2010 values Because cost studies were conducted at varying points in time, their cost estimates were also reported for different years. The cost of a certain disorder in 2010 may be assumed to be equal to the estimated cost in a previous year, adjusted for the inflation. All cost estimates were therefore multiplied by the inflation rate in the relevant country. We selected the Consumer Price Index (CPI) for a standard basket of goods [prc_hicp_aind] irrespective of what resources were included in the cost estimate (Eurostat 2010http://appsso.eurostat. ec.europa.eu/nui/show.do?dataset=prc_hicp_aind&lang=en). There are alternative indices available (e.g. CPI for health care goods) but the general CPI index was preferred because it is the most established of the available indices and should therefore be most coherent across different countries. Further, the difference between the general and the health care goods indices was small (the two suggested indices differed less than 1.2% over the last 5 years in EU27) Conversion of national currencies to Euro In order to compare and aggregate costs across countries, costs need to be converted into a common currency. Nominal exchange rates can be used to convert all currencies into nominal Euro, and the aggregate of all countries will then indicate the sum of the costs of all goods and services in Europe (valued at their local prices). However, because price levels vary within Europe, the comparison of nominal costs across countries does not accurately reflect their real value from a European perspective. For instance, it may be that two countries have the same resource utilization, but because of different price levels they end up with different costs. Instead, conversion to a common currency using real exchange rates results in comparable costs valued at a European price level (real Euro). The limitation of such estimates is that they do not reflect the actual spending in each individual country. The estimates presented in this report were converted to real Euro, using nominal exchange rates from the European central bank (ECB) (European Central Bank adjusted for comparative price levels (CPL) for 2009 from Eurostat [prc_ppp_ind] (Eurostat ind&lang=en). CPL is defined as the ratios of purchasing power parities to exchange rates. The selected CPLs were based on the total consumption in each country (GDP), i.e. not limited to price differences in health care goods. The data reported from Eurostat are equal to the corresponding indices from OECD (OECD statistics Extrapolation across countries to fill data gaps Extrapolation from one country where data is available to another where no data is available gives an indication of the burden of a disorder in the latter country, and enables estimation of the overall burden of all disorders in Europe. The European COI model performed such extrapolation for both the prevalence and cost of each disorder. The median prevalence ratio, calculated from all countries with available estimates, was assumed for countries without any country specific data. The median was preferred to its alternative (i.e. the arithmetic mean) because it is less sensitive to influential outliers (e.g. relatively high estimates in single countries or studies which would otherwise have unreasonable impact on the average). The median was considered also for cost extrapolation, but adjusted for income, health care expenditure, and wage level differences across countries. That is, the European median was multiplied by an index of the relative income, expenditure or wage level in each individual
10 country, depending on the cost type. The national health care expenditure was considered for direct health care costs, the gross domestic product (GDP) for direct nonmedical costs, and the wage level for indirect costs. These indices were available from Eurostat but the most recent were from 2008 and they were missing for some countries. The health care expenditure data from Eurostat [hlth_sha1h] (Eurostat had to be complemented by data from OECD (total expenditure on health, % of gross domestic product) (OECD statistics = HEALTH_STAT) combined with data on GDP from Eurostat [nama_gdp_c] (Eurostat For countries where no data for 2008 were available, an older estimate was inflated by a comparative price index for health care expenditure [prc_hicp_aind] (Eurostat GDP data were available from Eurostat for 2009 for most countries, but we used 2008 figures as they were complete [nama_gdp_c] (Eurostat Data on wage levels were available by combining several Eurostat sources [earn_gr_nace, earn_gr_nace2; earn_gr-isco; tps000174]; (Eurostat de=tps00174) (Eurostat = earn_ gr_nace&lang=en; Eurostat Eurostat and for countries where no data for 2008 were available an older estimate was inflated by a Eurostat labour cost index [lc_lci_r1_a] (Eurostat Aggregation of data The prevalence ratios were multiplied by the number of people in each respective country. Data for 2010 were available on the population size by 1 year age spans for each country from Eurostat [demo_pjan] (Eurostat 2010http://appsso.eurostat.ec.europa.eu/nui/show.do?dataset=demo_pjan&lang=en), which enabled calculating the number of persons with each disorder in relevant age groups. The number of persons with each disorder was then multiplied by the country-specific estimates of the cost per patient. For some disorders, the direct costs were multiplied by a treatment rate to adjust for disorders where the available cost estimates only referred to a subset of the total population with the disorder (see disorder specific information for details). Further, indirect costs were only applied to the working population (i.e. age between 18 and 65), unless the indirect cost estimates were actually presented as an average of the total population of all ages. For some disorders, the identified cost studies presented the mean indirect cost of the whole population, including also the zero estimates of patients not working because of other causes than the disorder (e.g. being underage or retired). This was the case for brain tumor, traumatic brain injury, alcohol addiction and neuromuscular disorders. For epilepsy, the cost studies presented estimates for a mix of age ranges for different countries; some for all ages, others for 18+ or We selected the age range 0 65 as a compromise because considering all ages (or 18 65) would overestimate (or underestimate) the indirect cost.
11 2.4. Methods for validation The results of this study were validated by comparison with the EBC2005 study (Andlin- Sobocki et al., 2005). Some of the differences are explained by the inclusion of certain disorders and costs in this revision that were omitted in the EBC2005 study. Other differences can be explained by new prevalence or cost estimates, or by new assumptions that have been considered appropriate this time. Details on all these aspects are provided in the Results section. The estimates of the European costmodel were also compared with external data from administrative databases, other European reviews of certain disorders and studies from the United States. An unstructured review of such sources and studies was conducted in PubMed, complemented by studies that were known to the study team. 3. Results 3.1. Previously (review 2005) reviewed disorders of the brain Number of persons The total number of persons with any of the 12 previously reviewed group of disorders of the brain was estimated at 179 million (Table 4). In the EBC2005 study this estimate was lower (127 million) (Andlin-Sobocki et al., 2005). About 10.4% of this difference is explained by the increase in the underlying population, i.e. the population increase in each country from 2004 to 2010 and the addition of Bulgaria and Romania which were not included in the EBC2005 study. The remaining difference is mostly explained by coverage of a broader age range, like including children or the elderly, allowed for by new data since 2004, enabling more precise estimates for some disorders. New studies have also suggested the need for mostly minor changes in prevalence rates for some disorders. The overall higher number of addiction resulted from a higher estimate of the prevalence of alcohol dependence in eastern EU states leading to a subtle increase from 2.4 to 3.4%. This increase was partially offset by the exclusion of cannabis dependence (estimated prevalence of 0.4%). An estimate of the cost of cannabis dependence was included in the previous EBC study (Andlin-Sobocki and Rehm, 2005), but based on questionable data, and reliable evidence on the cost of this disorder in Europe is still lacking. Persons with cannabis dependence are therefore not included in the cost estimates presented here. The higher prevalence of brain tumors was explained by the inclusion of benign tumors, contributing with an increase in the overall prevalence by 60%. The latest review of the literature on the prevalence of migraine showed a mean of 15%, compared to 13.6% that was considered for the EBC2005 study (Berg and Stovner, 2005). In multiple sclerosis, a change in the diagnostic criteria has resulted in earlier detection of the disease and consequently a higher prevalence. For the EBC2005 study (Andlin-Sobocki and Wittchen, 2005b), only persons between the age of 18 and 65 were considered for anxiety disorders. In this report we felt confident to widen the age span covered. However, this required a number of adjustments with regard to the prevalence estimates, which had an impact on the estimated number of persons affected. The overall 12-month prevalence estimates were adjusted for dementia and Parkinson's disease. We extended the lower age range for dementia to age 60, compared to 65 that was used in the 2005 report, which led to an increase in the number of persons included. For Parkinson's disease, we considered the prevalence estimates in two age groups (40-69 years - prevalence of 0.1% on average, and persons above 70 years old - prevalence 1.5%), compared to the EBC2005 study (Lindgren et al., 2005) where only the prevalence of the disorder in
12 persons above 65 years of age was taken into account. This however, did not result in a significant change in the estimated number of persons with the disease, likely because the prevalence rates adjusted for age resulted in a lower prevalence overall. Age group adjustments were also made for major depression, anxiety disorders (see below for GAD), psychotic disorders and traumatic brain injury, whenever there was evidence of significantly different prevalence rates by age group, thatwould be associated with overall inadequate estimations of the number of persons affected. For alcohol addiction, all persons above 15 years of age were considered with prevalence estimates adjusted for age and geographical region. For opioid dependence, the age range was considered with an estimated prevalence rate between 0.4 and 0.1%, decreasing with age. For generalized anxiety disorder (GAD), two age groups were considered; with a prevalence of 1.7% and 66+ with a prevalence of 3.4% Cost per person On average, the overall cost per person with any of the 12 previously reviewed disorders of the brain decreased from 3040 in 2004 to 2670 in 2010 (Table 4). The decrease in the overall cost per person was seen despite an underlying inflation of 14.5% (average for EU27, weighted by the total consumption in each country). The primary explanation was that the last six years have produced many new studies and in countries where there were no prior evidence. In many cases these studies have shown lower costs than what our estimates showed in the EBC2005 study (Andlin-Sobocki et al., 2005), but in others the new studies points to higher costs. A decrease in the inflation adjusted estimates of the cost per person was seen in seven disorders: addiction, brain tumor, epilepsy, migraine, mood disorders, psychotic disorders and traumatic brain injury. In alcohol addiction, four new studies all show lower costs than the two studies used in the previous EBC study (Andlin-Sobocki and Rehm, 2005). In opioid dependence, three new studies show similar costs in the UK but lower estimates for France and Spain which results in a lower European average than in the one estimated from the EBC2005 study (Andlin-Sobocki et al., 2005). In brain tumor, the decrease was due to the exclusion of indirect costs due to mortality (which were included in the EBC2005 study) accounting for 73% of the indirect costs. The direct cost actually increased due to new estimates available for high grade gliomas which are relatively more costly than other tumors. This increase also mirrors increased costs for new treatments which have become available in the recent years. In epilepsy, the recent evidence shows more variation in the costs across European countries, with low cost estimates in Italy and France which results in a lower average overall. For migraines, the decrease in the cost per person was mainly explained by the exclusion of the indirect cost associated with presenteeism (i.e. productivity losses due to reduced efficiency of persons who are not sufficiently ill to be absent from work). This cost is an important part of the economic burden of migraines, and an estimate was included in the EBC2005 study (Berg and Stovner, 2005) but the method for estimating this cost is not considered sufficiently established to be included in this revision. In mood disorders, the cost per person of major depression decreased due to lower indirect cost estimates from studies in Spain and the Netherlands, whereas estimates for bipolar depression remained unchanged. Also, the mean cost per person with a mood disorder decreased as a result of the inclusion of a wider age range for major depression causing an increase in the proportion of these persons with lower costs relative to those with bipolar disorder. In psychotic disorders, a new prospective study has shown lower costs per person than previously reported (Andlin-Sobocki and Rossler, 2005). For traumatic brain injury, the estimate presented in the EBC2005 study was based on a single estimate for patients admitted to hospital irrespective of severity (Berg et al., 2005). The revised estimate is based on separate estimates for each severity (mild,
13 moderate and severe traumatic brain injury). This resulted in a slightly lower cost per person on average, probably because the more severe cases were overrepresented in previous estimates. The inflation adjusted estimates of cost per person increased for dementia. Recent cost studies have shown higher informal care costs in southern Europe (France and Spain) and also higher costs associated with special accommodation and community services in northern Europe (Sweden and the UK). The cost per person remained on the same level (absolute difference less than 6%) for the remaining four disorders: anxiety disorders, multiple sclerosis, Parkinson's disease and stroke Total costs The total cost of the 12 previously reviewed disorders of the brain increased from 386 billion in the EBC2005 study to 477 billion in 2010 (Table 4). This 23% increase should be compared with an expected 25% increase if simply inflating the cost estimated from 2004 to 2010 values and population size. Total costs, adjusted for the population increase and inflation, were higher for four disorders (anxiety disorders, dementia, multiple sclerosis and traumatic brain injury), lower for six disorders (addiction, brain tumor, epilepsy, migraine, mood disorders and psychotic disorders) and remained the same (difference smaller than 4%) for Parkinson's disease and Stroke. The changes could be attributed to the differences in the number of persons and costs per person compared to the estimates in the EBC2005 study, as described above Extension to estimates of previously reviewed disorders The estimates described above excluded some important cost items and diagnoses, which were also not included in our previous study. Table 5 shows extensions to the 12 previously reviewed disorders of the brain, including diagnoses and costs that were omitted in the EBC2005 study (Andlin-Sobocki et al., 2005) due to lack of data. With regard to anxiety disorders, we now included Post Traumatic Stress Disorder (PTSD) which resulted in an additional 7.7 million persons and 8.4 billion Euro in costs. New data from the Eurolight study (Linde et al., 2011) enabled addition of non-migrainous headaches (tension type headache, medication overuse headache, and other headaches) to the cost of migraine. Tension type headache is a very common disorder, albeit not very costly, affecting a quarter of the European population. The non-migrainous headaches therefore add 103 million persons and 25 billion in total costs. Further, the numbers of persons suffering from the long term consequences of a previous stroke or traumatic brain injury were estimated at 7 and 2.5 million, and their costs were estimated at 37 and 23 billion, respectively. Finally the indirect costs of psychotic disorders and traumatic brain injury were not included in the EBC2005 study (Andlin-Sobocki et al., 2005), but were now estimated at 70 billion. Altogether, the 12 previously studied disorders now affect 300 million persons (Table 6) and their total cost is 640 billion per year in Europe (Table 8). Tables 6 8 present the country specific estimates of number of persons, cost per person and total costs for the 12 previously reviewed disorders including extensions New disorders of the brain Description of included disorders In addition to the 12 previously studied disorders, seven additional disorder groups were included in the present 2010 analysis as listed in Table 9. The methodological approach for these disorders was identical to that of the previously reviewed disorders, with one difference being that no restriction was set regarding the year of publication (i.e. also publications before 2004 were included in the literature search).
14 For most of the additional disorder groups, it was only possible to include a subset of all conditions as listed in ICD-10. For inclusion, relevant and reliable prevalence and cost data is necessary; generally, it was the lack of cost data that was the reason for excluding conditions. Table 9 summarizes the included conditions in each disorder group. Child and adolescent disorders include autism spectrum disorders (ASD), attention deficit hyperactivity disorder (ADHD), and conduct disorder (CD). Eating disorders includes Anorexia Nervosa (AN) and Bulimia Nervosa (BN). Mental retardation is also sometimes denoted intellectual disability. For personality disorders (PD) two conditions from the PD cluster B were included: borderline PD and antisocial PD. For sleep disorders (SD), it was possible to include narcolepsy, hypersomnia, insomnia and sleep apnea. Neuromuscular disorders cover a wide range of different conditions, but lack of relevant cost data made it impossible to include a vast range of significant conditions. In the end we grouped the included conditions as follows: (1) muscular dystrophies and other genetic myopathies (Duchenne, Becker, Facioscapulohumeral, Limb Girdle, Emery Dreifuss, Oculopharyngeal MD, congenital MDs, congenital myopathies, distal and myofibrillar myopathies and myotonic dystrophies), (2) acquired neuropathies (chronic inflammatory demyelinating polyradiculoneuroapthy, multifocal motor neuropathy, paraproteinemic polyneuropathies, Guillain Barré) and amyotrophic lateral sclerosis (ALS), (Nutt and Goodwin, 2011) autoimmune disorders of muscle and of the neuromuscular junction (only possible to include Myasthenia Gravis). Hence, important conditions such as hereditary neuropathies (e.g. Charcot Marie Tooth disease), spinal muscular atrophies, inflammatory myopathies (dermatomyositis, polymyositis, and inclusion body myositis, glycogen storage diseases, mitochondrial cytopathies) and several other conditions are lacking in the cost analysis. For somatoform disorder, the majority of studies included pain disorder. Studies differed regarding the strategy and applied criteria for Undifferentiated Somatoform Disorder (i.e. conditions of clinical relevance that do not fulfill the rather strict criteria for somatization disorder or the criteria for any specific other somatoform disorder).other diagnoses that fall into the category of somatoform disorders were not included due to lack of reliable prevalence and cost data (body dysmorphic disorder, hypochondria, dissociative disorder NOS, conversion disorder) Number of persons The total number of persons with any of the seven additional disorders of the brain was estimated at 81 million (Table 10), which adds 45% to the number of persons with any of the 12 previously reviewed disorders. It was estimated that there are approximately 45 million persons with sleep disorders, 20 million persons with somatoform disorder, and 6 million with child and adolescents disorders, whereas personality and Intellectual Developmental Disorder were both estimated to affect slightly more than 4 million persons. Eating disorders was estimated to affect 1.5 million persons, and the number of persons with neuromuscular disorders was estimated at 0.26 million. However, as mentioned in the previous section, there were a vast range of neuromuscular conditions not included in this estimation Cost per person The average cost per case for each disorder group is shown in Table 11. The European crude average varies between 559 for eating disorders up to 30,052 for neuromuscular disorders. The cost per person for all seven disorders is based on direct and indirect costs with the exception of mental retardation that only contains direct costs and it is therefore not directly comparable to the other disorder groups. The highest estimated cost per person is seen for neuromuscular disorders (NMDs) at nearly 30,000 per person and year (European average). The high cost is to a large extent explained
15 by direct health care costs, considering that many NMDs are treatable but with (currently) expensive treatment options. Even though the estimate for mental retardation does not contain indirect costs, it has the second highest cost per person. If indirect costs would have been included, cost per person would be substantially higher considering that we know that for persons with mental retardation, employment is very low (Martinez-Leal et al., 2011). For child and adolescent disorders, where the cost per case is 3600 based on a higher cost for autism spectrum disorders and slightly lower for attention deficit hyperactivity disorder and conduct disorder, a large share of costs is direct non-medical costs. This is primarily due to increased costs for education and social services for children and adolescents with autism spectrum disorders. But there are also significant informal care costs due to the fact that parents and caretakers experience reduced productivity and employment in order to care for the children and adolescents. For the disorder groups with the lowest cost per person (sleep disorders and eating disorders), the largest share of costs are direct costs for eating disorders and indirect costs for sleep disorders. The former is partly explained by the fact that prevalence of eating disorders is higher among adolescents, where lost productivity due to non-employment is less relevant. However, impact on schooling may affect productivity and income later in life Total costs Table 12 summarizes the total cost estimation for the seven new disorder groups; in power purchase adjusted billion Euros. The total cost for the seven new disorder of the brain was estimated at 157 billion. The highest cost is seen for mental retardation at around 43 billion, despite the omission of indirect costs. Sleep disorders are estimated at a cost around 35 billion (excluding the indirect cost of insomnia). The explanation for the relatively high cost of sleep disorders is found in the high number of persons, especially for insomnia, whereas cost per person is not as high (with the exception of narcolepsy). Total cost for personality disorders is approx. 27 billion in Europe in 2010 whereas cost for child and adolescent disorders is approx. 21 billion. For the latter it should be noted that this only includes children and adolescents, and hence costs for disorders such as autism spectrum, for example, among adults are not included in the cost estimate. Total cost for neuromuscular disorders is approximately 8 billion, but as noted above, this only includes a subset of the vast range of neuromuscular conditions. Most neuromuscular disorders are very rare, but as was seen in the previous section, the cost per person is very high. Finally, the total cost of eating disorders is the lowest among the seven new disorders of the brain at approx. 800 million, explained both by a, in comparison, relatively smaller number of persons and relatively lower cost per person. The total cost of somatoform disorders is estimated at 21 billion. This is a very conservative estimate for this disorder which constitutes a group of persons that are difficult to manage consuming an exceedingly high degree of health care resources (Salawu et al., 2009) without an established medical need for such services and resources. Finally, as seen in Table 12, total cost estimates vary significantly across European countries, naturally explained by the significant variance in number of persons due to the different population sizes. Further, costs are higher in countries with higher income, which generally have higher health care expenditure and with higher wages also follow higher indirect cost for each day of absence. The highest cost for all seven disorders together is found in Germany ( 31 billion), followed by the UK ( 24 billion) and France ( 21 billion).
16 3.3. An overview of the cost of disorders of the brain Cost per person The cost per person with a brain disorder is highly variable (Fig. 2). A person with a neuromuscular disorder is estimated to cost 30,000 for any given year. At the other end, a person with headache only incurs 285 per year on average Aggregated costs Simply aggregating the number of persons and costs of all disorders of the brain is hazardous, because there is a risk of double counting. Many persons might have multiple disorders and are included potentially in the prevalence estimates for specific disorders more than once. It is difficult to attribute the resource use and indirect costs to a specific disorder if the person suffers from many disorders. This may lead to the same cost being counted for and included in different disorders. To the extent possible, we have corrected for double counting in the cost estimates by considering the excess cost for each disorder (i.e. the additional cost that a person with the disorder causes, irrespective of whether they have any other disorders or not). Thereby, we have not attempted to correct for double counting in the number of persons with the disorder, but instead in what additional cost they incur. Still, the available evidence is limited and we have not considered all overlap between the 19 disorders and the individual diagnoses within each of these disorders that are included in this study. With this caveat in mind, we report the total number of persons and costs for all disorders of the brain in Table 13. The total number of persons is estimated at 380 million. Again, this does not mean that there are so many persons with a disorder of the brain, since many of them have two or more. The aggregated cost brings 798 billion for the whole of Europe in The most costly disorders are mood disorders which incur both high direct healthcare costs but even higher indirect costs because persons are not able to work, and dementia because of very high direct non-medical costs (Fig. 3). Mental disorders in a stricter sense are mood disorders, psychotic disorders, anxiety disorders, addictive disorders, mental retardation, personality disorders, child and adolescent disorders, somatoform disorders and eating disorders. Together the estimated cost for these mental disorders is 461 billion. Leaving aside the fact that sleep disorders and dementia are also listed in the ICD-10 under mental disorders, as well as stroke under cardiovascular conditions, neurological disorders can be defined as dementia, stroke, headache, sleep disorders, traumatic brain injury, multiple sclerosis, epilepsy, Parkinson's disease, brain tumor and neuromuscular disorders. Together the estimated cost for neurological disorders is 336 billion. Out of all disorders of the brain, mental disorders account for 58% and neurological disorders for 42%. However, the separation of brain disorders into those categories is to some extent arbitrary and several of the categories are managed by both specialties Country specific estimates The total cost for all disorders of the brain in individual countries ranged between 437 million in Malta and 153 billion in Germany (Table 14). Dividing these figures by the population size in each country provides the per capita cost shown in Fig. 4. The mean cost per capita in Europe was estimated at The country specific estimates should be interpreted with caution as they are a result of model estimations from the European cost model. The available data are highly limited or absent in many countries. In absence of local data, the estimates are entirely based on extrapolations from the evidence for other countries, adjusting for differences in income, wage levels and health care expenses. Regardless, methodological limitations leading to discrepancies when comparing across countries cannot be avoided. For example in the UK, the wage level is considerably higher compared to other European
17 countries (about 70% higher compared to the un-weighted mean in Europe, whereas the health care expenditure and GDP are only about 11 12% higher). This may explain the relatively high proportion of indirect costs in the UK compared to other countries. In addition, there may still be differences in care patterns across countries that we did not take into consideration in the model Distribution of costs. Overall, the majority of the estimated costs of disorders of the brain were direct costs (60%) while indirect costs constituted the remaining 40% (Fig. 5). Indirect costs constitute a higher percentage of total costs in mental disorders, compared to neurological disorders. Further, there was a large variation across the disorders (Fig. 6). Persons with eating disorders had the highest proportion of direct healthcare costs (72%), whereas they only constituted 12% of the total in child/adolescent or personality disorders. The direct nonmedical cost constituted the highest proportion in child/adolescent disorders (88%) and dementia (84%). Indirect costs made up the bulk of the costs in personality disorders (78%) and headache (79%) Share of pharmaceutical expenditures due to brain disorders According to the ATC (anatomic therapeutic classification) system, drugs are categorized by the target organ and mode of action, and statistics on pharmaceutical sales are typically provided based on this system. Through the ATC codes it is possible to identify drug classes used to treat disorders of the brain; however assumptions need to be made in some cases. As an example, in Sweden the total pharmaceutical expenditures in 2010 was SEK 35.6 billion (in pharmacy sales prices, AUP) (Pharmacy Sales Prices (AUP) /L%c3%a4kemedelsutvecklingen% %201.0.pdf). Table 15 lists the expenditures on ATC groups that may be (partially) related to brain disorders. In a conservative scenario presented in Table 15, we only include costs for drug classes that are certain to be related to brain disorders. For a more realistic scenario (Table 16), we need to make assumptions regarding the use of cytotoxic drugs, anti-infectives and analgesics due to brain disorders. In Sweden in 2009, 2% of all incident cases of cancers were tumors of the central nervous system. Although the use and cost of chemotherapy will vary between tumor types, we assume 2% of the costs of chemotherapy may be attributed to cancers of the central nervous system. The share of costs for anti-infective drugs used to treat infections of the central nervous system is difficult to estimate. In 2009, there were 101,583 hospital admissions in Sweden where the primary diagnosis was an infection at any site. Out of these, 1985 (2%) were identified as CNS infections. Though antibiotic use is not directly related with hospital admissions, we assume that 2% of the costs for anti-infectives are used to treat CNS infections. The use of analgesics due to primary brain disorders is even harder to estimate we assume up to 10% of this cost may be associated with brain disorders. In conclusion, we estimate that about 16% of total pharmaceutical expenditures are due to brain disorders (SEK billion in 2010). At the European level, this would correspond to about 30 billion, as total pharmaceutical expenditures are in excess of 180 billion (OECD, Health at a glance: Europe 2010) (OECD statistics
18 There are a number of limitations to this analysis. We have completely excluded cardiovascular drugs (ATC class C, total cost SEK 3.1 billion). These drugs are in part used to treat cerebrovascular disorders; however the proportion is difficult to estimate Validation of results Total healthcare expenditure The total healthcare expenditure in Europe in 2008 was 1222 billion (OECD statistics which by an inflation rate of 3.1% should have increased to 1260 billion in Our estimate of the total direct healthcare cost of disorders of the brain in 2010 constitutes 24% of this healthcare expenditure. The previous EBC study estimated that the total cost of the disorders of the brain constituted 15% of the healthcare expenditure at that time (Andlin-Sobocki et al., 2005). A review of the literature on the direct healthcare cost of epilepsy suggested that they constitute between 0.12 and 1.12% of the total healthcare expenditure (Kotsopoulos et al., 2001). In Europe this would imply a range between 1.5 and 14 billion [hlth_sha1h] (Eurostat Our estimate of 6.5 billion places itself neatly in the middle of this range. Similarly, Evers et al. (2004) suggested in their review on the direct healthcare cost of stroke that they constitute 3% of the total healthcare expenditure, equal to 38 billion for Europe which is comparable to our estimate of 42 billion Comparison to other European reviews Wimo et al. (2010) published another ambitious review on the overall cost of dementia in Europe. They estimated the total cost of dementia in EU27 at 160 billion in This is about 60% higher than our estimate which is explained by both higher prevalence and cost estimates in their analysis. They estimated the number of persons with dementia in EU27 at 7.2 million compared to 6.3 million in our study. Their estimate was based on similar data to ours but instead of considering country specific estimates they calculated mean estimates by age and gender for Europe as a whole. They also estimated that the cost per person is 22,194 compared to 16,584 in our study. The higher estimate is largely due to higher informal care costs constituting 55% of their total cost compared to 8 to 64% in our review depending on country. Informal care costs are known to be higher in Southern Europe compared to Northern or Western Europe (Gustavsson et al., 2010), and this was accurately reflected in Wimo et al. However, because comparatively little data are available for Southern Europe, the median approach employed in this study resulted in comparatively lower estimates. This is a limitation of the chosen approach but necessary to keep a consistent methodology across all disorders of this study. When comparing the results of our study with a prospective, naturalistic observational study conducted in 12 European countries (ICTUS study), aiming to estimate and compare the costs of formal and informal care of patients with Alzheimer's disease (Gustavsson et al., 2010), the cost per person estimated from our study is higher ( 16,584 compared with 8000). This can be explained by the ICTUS study including a milder patient population; when looking at the more severe subgroup in the ICTUS study, the average cost per person was estimated at around 13,000 20,000 EUR depending on region, which is comparable with the cost per person estimated by our study. Kobelt G. and F. Kasteng conducted a similar review in 2009 on the cost of multiple sclerosis in Europe (Kobelt and Kasteng, treatments%20- %20October% pdf). They estimated the total cost in Europe (EU27+3) at 14.9 billion which is just slightly higher than our estimate of 14.6 billion. Their estimate was based on
19 470,000 persons above the age of 19 years resulting in an average cost of about 31,000 per person. This may be compared with our estimates; 440,000 persons from 18 years and above each with a mean cost of about 33,000. As in the comparison of the estimates for dementia, there were methodological differences between the 2009 review and ours but the results were in this case similar Comparison to US evidence A search was conducted in PubMed identifying published reviews on cost of illness studies conducted in the United States. The reported estimates were converted into PPP-adjusted Euro in 2010 values and presented per capita (Table 17). The US estimates were compared side by side to our results per capita for Germany, which was selected as a comparable country to the US. The majority of the US estimates are higher than our estimates for Germany, and there are a number of explanations for this depending on the disorder. The US cost studies show comparable costs per person with ADHD to the Dutch study that our estimates were based on. However, we assumed that only 25% of persons with ADHD get treatment and therefore incur these costs while no such adjustment was done in the US. Therefore, our estimate for Germany is lower than the presented range for the US. For bipolar disorder, the indirect costs are similar in the US and Germany, but the direct costs seem higher in the US. The higher estimate for opioid dependence is explained by higher indirect costs in the US, which is in part explained by inclusion of indirect costs of premature mortality. The available estimate for schizophrenia in the US was comparable to our estimate of all psychotic disorders. The cost per person was therefore about twice as high as the German estimate. This was partly explained by the inclusion of costs of criminality, research, premature mortality, and presenteeism in the US estimate, together constituting about 10% of the total cost, but the largest difference was seen in much higher direct healthcare costs in the US. The available US estimates for anxiety disorders and sleep disorders were similar to the German results, although no estimates of the indirect costs were found for sleep disorders. The costs of migraine and mood disorders were lower in the US compared to Germany. The methods used for the US estimate for migraine was not available from the referenced publication and we can therefore not explain the discrepancy from our study. The two US studies on mood disorders are from the early nineties and they suggest that their estimates represent a lower limit of the true costs at the time. The proportions of direct and indirect costs to total costs are similar in the US and Europe. In both Germany and the US, a larger proportion of direct costs are seen in anxiety disorders whereas indirect costs constitute the majority of costs in mood disorders. Overall, the comparison to US estimates show that health care costs are higher in the US than in Europe. If anything, this indicates that the results of our study should rather represent an underestimation of the true cost than an overestimation. The comparison also supports the notion that health care costs are generally higher in the US compared to Europe Comparison with European estimates of other major groups of disorders The cost of disorders of the brain is higher than all other comparable disease areas. The European Heart Network reported that the cost of cardiovascular disease was 192 billion in the EU in 2008 (European Heart Network The direct health care cost of cancer was estimated at 54 billion in 2005, while the indirect cost was suggested to be twice as high (Wilking and Jönsson, 2005). Another study suggested 6.3% of the total health care expenditure in Europe to be attributable to cancer on average (Wilking N et al des% 20Jan%2027.pdf), which would result in medical costs of 79 billion in The total
20 cost of cancer in Europe may therefore lie in the range of billion. The direct health care cost of type II diabetes ranges between 1.6 and 6.6% in Europe (Jonsson, 2002), which equals 20 to 83 billion in The European cost of rheumatoid arthritis was estimated at 25 billion in 2008 (Kobelt G et al., pdf), and the cost of chronic obstructive pulmonary disease at 39 billion in 2006 (Halpin, 2006). 4. Disorder specific sections 4.1. Addictive disorders Substance-use disorders in general refer to hundreds of specific diagnostic classes stratified by the type of substance (ranging from opiates to caffeine to alcohol and nicotine) as well as the specific clinical diagnostic condition (ranging from intoxication, over delirium and withdrawl syndrome to abuse and dependence). For our survey only few classes of substances could be considered, namely alcohol, opioid drugs and cannabis as well as only two types of diagnoses, namely abuse and dependence. The epidemiologic and cost-of-illness studies focusing on the problem of substance abuse and dependence that have been conducted in Europe have been using different definitions to describe the problem of substance abuse or dependence in the population, which renders the comparison of their results difficult. Therefore, for the purpose of this study, the consumption of substances that is linked with harmful use and dependence was considered a relevant definition for the estimation of the burden of the disorder in Europe Epidemiologic data review For alcohol dependence, prevalence estimates for three different regions in Europe (eastern, central and western) were calculated based on data available in the literature (de et al., 2006, 2011; Florescu et al., 2009; Hansen et al., 2011; Latvala et al., 2009; Rehm et al., 2005; The Health and Social Care Information Centre %20v7.pdf; Uhl et al., 2009). For countries with no surveys, we based our estimates on the WHO calculations (WHO Europe data/assets/pdf_file/0004/128065/e94533.pdf). Country specific mean prevalence estimates for all ages above 15 years were calculated based on the population size of each age group in each country. The weighted mean for Europe was 3.4% but country specific estimates were used in the European cost model (ranging between 3.2 and 4.1). In opioid and cannabis dependence, information was used from ongoing data collection done by the European Monitoring Centre for Drugs and Drug Addiction (EMCDDA). EU member states annually report to the EMCDDA epidemiological data from national surveys in the adult population, based on a model questionnaire. For this analysis the data from most recent national surveys were used (European Monitoring Centre for Drugs and Drug Addiction (EMCDDA) Age dependent prevalence rates for cannabis and opioid dependence were considered as displayed in Table 18 because of the differences in prevalence by age group Cost data review The search in the literature performed identified four new studies for alcohol (Balakrishnan et al., 2009; Jarl et al., 2008; Konnopka and Konig, 2007; Saar, 2009) in addition to the eight studies identified in the previous EBC study (Andlin-Sobocki and Rehm, 2005). The new
21 studies that were identified used a similar methodology to estimate the economic burden of high alcohol consumption/abuse. Using alcohol-attributable fractions the cost per patient per year was calculated based on the total cost reported in the papers, divided with the number of patients with the disorder (calculated based on the prevalence estimates and the reference population). In order to avoid aggregating results from studies that used different methodologies and definitions of the disorder, only the cost estimates from the four new studies that used a similar methodology were included in the calculation of the burden of alcohol dependence in Europe (Table 19). Only one new cost-of-illness study (Godfrey et al., 2004) measuring the economic burden of dependence to opioids in the UK was found through the literature search. Out of the four other studies that were identified in the previous EBC study (Coyle et al., 1997; Fenoglio et al., 2003; Garcia-Altes et al., 2002; Healey et al., 1998) only two were considered relevant for inclusion since they reported results for France and Spain (Fenoglio et al., 2003; Garcia-Altes et al., 2002) The other two studies were conducted in the UK, thus the latest study by Godfrey et al.(2004) that also reported the cost per patient for the UK was chosen as the most relevant to be used. The studies for France and Spain used a top down methodology and estimated the economic burden of opioid addiction; therefore the cost per patient was calculated by dividing the total cost reported in the papers with the number of patients with opioid addiction in Europe (based on the prevalence estimates). No European studies on cannabis abuse/dependence were identified in the review. In the EBC2005 study, cannabis dependence was grouped together with opioids (the subgroup was referring to dependence to illicit drugs); however, the study by Healey et al. (1998) that measured the economic burden of illicit drugs in the UK did not include in the study population individuals with cannabis dependence/abuse. Therefore, specific cost estimates for cannabis abuse/dependence were not taken into account when calculating the burden of substance use disorders in Europe in Discussion The latest epidemiologic evidence for alcohol dependence, shows an increase in the number of patients with the condition, whereas the prevalence for opioid and cannabis dependence remains unchanged. The estimates of cost per person are lower in this review than the ones presented in the EBC2005 study (Andlin-Sobocki et al., 2005). In alcohol dependence, this is partly explained by lower estimates in countries where there was previously no data (Sweden and Estonia) although one might dispute whether this is simply a methodological artifact. Another explanation that is evident from our methodological approach is that as we divided the total cost estimates that were reported in the available studies by the number of persons to get the cost per person, since the number of persons has increased while there is no evidence of a proportional increase in total costs, the cost per person consequently gets lower. In opioid dependence the decrease is explained by new data from France and Spain which shows lower costs per person. It should be also highlighted that our estimates for addiction are conservative due to limiting the cost modeling to dependence to substances (Wittchen et al., 2008) Anxiety disorders The EBC2005 study considered 6 anxiety disorders, namely agoraphobia, generalized anxiety disorder (GAD), obsessive compulsive disorder (OCD), panic disorder, social phobia and specific phobias (Andlin-Sobocki et al., 2005). In this review we were able to also consider the evidence of the burden and costs of post-traumatic stress disorder (PTSD) (Wittchen et al., 2009b).
22 Epidemiologic data review In 2005, country specific estimates were considered for all anxiety disorders where available (Andlin-Sobocki and Wittchen, 2005b). In this revision, we assume that differences across studies from various European countries are primarily explained by methodological factors such as design issues whereas the true differences across countries are small. Therefore, we have considered the median European best estimates of the prevalence rates for all countries. This resulted in small changes in the prevalence estimates of individual diagnoses. Further, the best estimate for agoraphobia was set to 2% compared to 1.3% in the EBC2005 study. Age dependent prevalence rates were considered for GAD and PTSD (Table 20). A wider age range was considered for all anxiety disorders (Beesdo et al., 2010) in comparison to the EBC2005 study in which only adults between 18 and 65 were included (Andlin-Sobocki et al., 2005). However, our cost estimates were not assumed to be applicable to the full age range for many diagnoses as indicated in Table Cost data review Six new relevant cost studies were identified in the literature review (Acarturk et al., 2009; Batelaan et al., 2007; Patel et al., 2002; Priebe et al., 2009, 2010; Smit et al., 2006), adding to the three studies considered in the EBC2005 study (Salvador-Carulla et al., 1995; Souetre et al., 1994; Zambori et al., 2002). At that time, data from a community based survey in Germany [GHS MHS, (Jacobi et al., 2002)] was selected for estimation of the cost of anxiety disorders. These data was considered more reliable than those presented in any of the three published studies. Five of the newly identified studies report costs on individual diagnoses: two on social phobia (Acarturk et al., 2009; Patel et al., 2002), two on PTSD (Priebe et al., 2009, 2010), and one on panic disorder (Batelaan et al., 2007). The sixth study (Smit et al., 2006) reports costs for all anxiety disorders considered in this study except OCD and PTSD. Three studies (Acarturk et al., 2009; Batelaan et al., 2007; Smit et al., 2006) were based on a Dutch population-based cohort (NEMESIS) including a questionnaire administered to patients to assess their resource utilization. They all present relatively high costs which may at least in part be explained by a broader inclusion of cost items, but they do not provide sufficient information to make their estimates fully comparable to e.g. the GHS MHS data (Jacobi et al., 2002). The three studies use varying methodology to estimate the cost caused by each respective disorder. Patel et al. (2002) reports costs for social phobia in the UK, based on data from 63 patients, who were identified through a community survey. The two articles by Priebe et al. (2009, 2010) present bottom up estimates of the cost of Yugoslavian war refugees, diagnosed with PTSD and currently residing in the UK, Germany or Croatia. Priebe et al.(2010) reported costs for Croatia and other former Yugoslav republics, and these data were therefore selected for Slovenia. In exempt from the new data on PTSD, the GHS MHS study (Jacobi et al., 2002) was preferred to all other identified studies on anxiety disorders. The main rationale was that there is considerable overlap between individual anxiety disorders (Wittchen et al., 2009a), and the German data allowed for calculation of the excess cost of each individual diagnosis. This was done by calculating the difference in resource use between patients with and without each individual anxiety disorder in the community-based cohort (Table 21). The PTSD study indicated a 10% overlap with other anxiety disorders. The estimates for PTSD were therefore deducted by 10% in the European cost model to adjust for this overlap.
23 Discussion The same cost data was selected as in the EBC2005 study (Andlin-Sobocki et al., 2005). However, recalculations of excess costs were performed to avoid double counting due to overlapping anxiety disorders, which resulted in somewhat higher estimates in most groups Brain tumors Primary brain tumors represent 2% of all cancers (Ferlay et al., 2010) and are a diverse group of tumors with marked differences in etiology, treatment and prognosis (Bondy et al., 2008; DeAngelis, 2001; Wrensch et al., 2002). In children, central nervous system (CNS) tumors represent 15 25% of all tumors (Packer et al., 2008; Stiller and Bunch, 1992). While the treatment of meningioma has not consistently changed in recent years, the state of the art therapy in high grade glioma is currently surgery followed by radiotherapy with concomitant and adjuvant temozolomide (Stupp et al., 2005). These treatment changes have led to an increase of quality of life and average life expectancy accompanied by higher costs (Louis et al., 2007) Epidemiologic data review The review included the ICD10 diagnoses C70, C71, C72 (malignant brain tumors), D32, D33 (benign brain tumors), and D42, D43 (brain tumors of unknown origin). The search terms included epidemiology (incidence, prevalence, mortality, survival), study design (registry, population-based, review), and disease specific terms (brain/intracranial/ cerebral tumor/cancer/neoplasm and specific tumor types). The most complete reference from a European perspective was the article by Ferlay et al., which used data from cancer registries and statistical models to estimate incidence and mortality data for 25 cancers in 40 European countries in 2008 (Ferlay et al., 2010). Prevalence figures were estimated from the NORDCAN database by looking at the ratio between the 5-year prevalence and the incidence in the Nordic data, which was 2.86 for men and 3.54 for women (Engholm et al., 2010). As the costs for cancer cases are often incurred over several years, we looked at the 5-year prevalence rather than the 1-year prevalence. Before the prevalence figures were calculated, the incidence figures from Ferlay et al. (2010) were adjusted to take benign tumors into account (ICD-10 codes D32 33). The incidence ratios between all central nervous system tumors (CNS) and the malignant tumors in the Nordic data were 1.66 for men and 2.71 for women. The difference between men and women reflects the different incidence, prevalence, and mortality ratios for malignant and benign tumors, with malignant glioma occurring slightly more frequently in men and benign meningioma more frequently in women (Louis et al., 2007) (Table 22) Cost data review A search for relevant cost literature was carried out using electronic database PubMed (MEDLINE). The search strings were combinations of disease-specific search terms (brain tumor, glioma, meningioma, astrocytoma, schwannoma etc.) and search terms related to cost studies (costs, resources). The most complete study was by Blomqvist et al., as it included all relevant diagnoses and both direct and indirect costs (Blomqvist et al., 2000). Due to treatment changes in recent years, primarily the introduction of the temozolomide regimen in malignant glioma, the costs in Blomqvist et al.(2000) do not accurately represent the current standard therapy for high grade glioma. The study by Wasserfallen et al. (2005) considered the temozolomide regimen for patients with malignant glioma. The study by Latif et al. (1998) was excluded because it was published before the introduction of the temozolomide regimen in malignant glioma and does not represent the current treatment cost. The study on the cost of intracranial pathology by Wellis et al.(2003) was excluded because some of the
24 diagnoses were outside of the scope of the EBC review. Separate costs for the different subgroups were not reported. Seventy-three percent of the indirect costs in Blomqvist et al. (2000) were associated with premature mortality and were excluded from Table Discussion The Ferlay publication included the ICD-10 diagnoses C70 72 (malignant CNS tumors) (Ferlay et al., 2010). The NORDCAN data were used in order to extend the estimate to include benign CNS tumors (D32, D33) (Engholm et al., 2010). Compared with the data in Europe in 1995 (Bray et al., 2002) used in the EBC2005 study (Andlin-Sobocki et al., 2005), the average incidence of primary brain tumors has increased by about 5%. However, this might be an effect of better diagnostic imaging methods and more comprehensive reporting rather than a true increase in the incidence of brain tumors in the population. Both direct and indirect costs have increased and will increase even more in the next few years by the introduction of new chemotherapy options as standard methods in the treatment of malignant brain tumors. Costs for premature mortality (73% of the indirect costs in Blomqvist et al.) were included in the EBC2005 study, but not in this update Dementia Recent developments in dementia research have included revised diagnostic criteria, the use of biomarkers in diagnosis, disease course prediction and treatment evaluation; and the search for new potent drug treatments. All these efforts may eventually lead to inventions that can change the state of the art in dementia care and consequently also the burden of dementia. However, although there have been new studies, the patterns of dementia care in Europe today are similar to those 5 years ago. Therefore, dramatic changes in the number of patients or the cost of dementia in recent years are not expected Epidemiologic data review Population based studies, with a cross sectional design, reporting the prevalence of dementia were identified by a structured search in PubMed (MEDLINE). Seventeen relevant studies were identified reporting prevalence estimates by age, gender and severity, although incomplete for many studies (Abela et al., 2007; Andersen et al., 1997; Bdzan et al., 2007; Börjesson-Hanson et al., 2004; Brayne, 2006; De Ronchi et al., 2005; Gascon-Bayarri et al., 2007; Gostynski et al., 2002; Helmer et al., 2006; Kurz et al., 2001; Ott et al., 1995; Rahkonen et al., 2003; Riedel-Heller et al., 2001; Tognoni et al., 2005; Tsolaki et al., 1999). In 2005, only persons above 65 years of age were considered (Jönsson and Berr, 2005), while in this revision we included everyone from 60 years of age. The overall prevalence in each country was calculated by multiplying the prevalence estimates in Table 24 by the population size of each of these age groups in each country, and dividing the sum of these products by the total population above 60 years of age. The European mean (weighted by the sample population size of each study) was used for countries where no data were available. The prevalence estimates reported for those between 85 and 90 years of age were assumed for everyone above 85 years because of limitations in the available data on population sizes in the elderly Cost data review The cost data literature review resulted in 13 relevant cost studies (Boada et al., 1999; Coduras et al., 2009; Gustavsson et al., 2011; Jönsson et al., 1999, 2006; Kronborg et al., 1999; Lopez-Bastida et al., 2006; Mesterton et al., 2010; O'Shea and O'Reilly, 2000; Rigaud et al., 2003; Schulenberg et al., 1998; Scuvee-Moreau et al., 2002; Wolstenholme et al., 2002) in addition to the 6 studies identified and selected for the EBC2005 study (Jönsson and Berr, 2005). Most were bottom up studies with a one-off interview with caregivers of patients with
25 Alzheimer's disease, but the mix also included registry studies, prospective cohorts and a broader study sample of demented elderly. Some of the identified studies were excluded due to the following limitations. Three studies presented outlying and outdated estimates (Cavallo and Fattore, 1997; Souetre et al., 1995). Another four only provided total costs or costs by severity with insufficient information on what resources or patient samples they referred to (Atance Martinez et al., 2004; Francois et al., 2004; Livingston et al., 2004; Trabucchi, 1999). Finally, one study was excluded because it was based on a small Swedish sample of patients with dementia with Levy bodies, with relatively high costs and therefore not representative to the general dementia population (Boström et al., 2007). The remaining 15 studies provided country specific estimates for the European cost model (Table 25). Unweighted means were calculated for countries with data from several studies. Three studies were not reporting any data on informal care but contributed with other direct health care and non-medical costs (Jönsson et al., 1999; Kronborg et al., 1999; Wolstenholme et al., 2002) Discussion The cost of informal care is uncertain and varies largely across studies, which to a great extent is due to the lack of established methods to assess and value this resource. Another source of uncertainty is the selection of study persons. The degree of severity and the proportion of persons residing in special accommodation vary across studies and is probably a reflection of the sampling of persons rather than the true distribution of the target population in most studies. Population based samples may provide a solution, but very large samples would be needed to get stable results. The cost per person with dementia is higher overall in 2010 than previously reported in our 2005 study (Andlin-Sobocki et al., 2005). All 10 new included studies report higher mean costs than the 5 studies included in 2005 (Jönsson and Berr, 2005). Whether this reflects an increase in the actual cost of dementia is doubtful because of the uncertainties related to the cost of informal care, and the sample selection. Recent estimates include more studies conducted in southern Europe (Spain and France) where informal care is more common, whereas in northern Europe (Sweden and the UK), the recent studies have included a larger proportion of patients in residential care settings. This has led to an increase in the direct nonmedical cost estimates which explains most of the change in the cost per person overall Epilepsy The worldwide annual incidence of epilepsy ranges from 16 to 51 per 100,000 (Banerjee et al., 2009). The age-specific prevalence is slightly different in children and adolescents (4.5 5 per 1000), adults (6 per 1000), and in the elderly (7 per 1000). The age-specific incidence tends to vary significantly according to age. It is high in children and adolescents (70 per 100,000), stabilizes in adults (30 per 100,000), and increases in the elderly (100 per 100,000) (Forsgren et al., 2005b). The prevalence of the disease is slightly higher in males than in females, although the absolute difference is usually small and most studies show shifting rates between the sexes in different age groups (Bielen et al., 2007; Brodtkorb and Sjaastad, 2008) Epidemiologic data review The search terms used in the electronic database PubMed included epidemiology (incidence, prevalence, mortality), study design (registry, population-based, review) and disease specific terms (epilepsy, seizure, status epilepticus) in combination with a list of European countries. Only studies published in 2004 or later were included in the search, as a previous review covered publications up to the spring of 2004 (Forsgren et al., 2005a). After review, 16 recent
26 studies (Adelow et al., 2009; Benavente et al., 2009; Bielen et al., 2007; Brodtkorb and Sjaastad, 2008; Christensen et al., 2007; Dura-Trave et al., 2008; Gallitto et al., 2005; Gao et al., 2008; Kotsopoulos et al., 2005; Larsson and Eeg- Olofsson, 2006; Linehan et al., 2010; Löfgren et al., 2009; Olafsson et al., 2005; Picot et al., 2008; Stranjalis et al., 2009; Svendsen et al., 2007) were included in addition to those identified in the EBC2005 study (Table 24). Prevalence rates were available from 11 recent studies not included in the previous review (Forsgren et al., 2005a), and incidence rates from eight new studies (three of them also showing prevalence rates). A list of all identified prevalence studies is included in Table 26, sorted by age group and year of publication. The average prevalence is about the same in the studies published up to 2004 (4.9 per 1000) and the studies published after 2004 (5.1 per 1000). The median prevalence in studies including all ages was 5.3 per 1000, while the median prevalence in studies including children and adolescents was 4.0 per 1000 and in studies including adults and elderly 6.5 per Cost data review A search for relevant cost literature was carried out using the PubMed database. The search strings were combinations of disease-specific search terms (epilepsy, seizure, status epilepticus etc.) and search terms related to cost studies. The search included articles published between January 1995 and December Studies on the cost of illness of epilepsy in Europe were available from France, Germany, Italy, the Netherlands, Spain, Sweden, Switzerland and the UK (Beghi et al., 2004; Berto et al., 2000; Cockerell et al., 1994; De Zélicourt et al., 2000; Gessner et al., 1993; Guerrini et al., 2001; Hamer et al., 2006; Jacoby et al., 1998; Kotsopoulos et al., 2003; Sancho et al., 2008; Swingler et al., 1994; Tetto et al., 2002; van Hout et al., 1997) (Table 25). A limitation in the data is that it is often difficult to distinguish whether the epilepsy-specific costs have been separated from costs for co-morbidities. The costs may therefore represent the average cost of patients with epilepsy rather than the epilepsy-specific costs. Status epilepticus is an importance source of direct costs; however, no cost-of-illness studies in which this seizure category was assessed separately seem to be available in Europe. A further evidence gap is that not all studies of adult patients include indirect costs due to productivity losses. In general, the costs depend primarily on seizure frequency and responsiveness to drug treatment. Newly diagnosed patients also tend to have higher costs, and clinic-based samples can be expected have higher costs than population-based samples (Table 27) Discussion A number of new studies on the epidemiology and cost of epilepsy have been published in recent years. These studies largely confirm the findings from the EBC2005 study (Andlin- Sobocki et al., 2005) Headache Headaches are among the most common health disorders worldwide. Although most sufferers experience mild symptoms, some attacks are highly disabling and come at large societal costs. The EBC2005 report on the cost of headache disorders only included migraine, because the costs of tension-type headache, medication overuse headache and other headaches were virtually unknown in Europe at the time (Berg and Stovner, 2005). Since then, Eurolight, a comprehensive study estimating the prevalence and economic burden of all headache disorders in Europe, has been undertaken (Andrée et al., 2011; Linde et al., 2011). The Eurolight project, initiated by CRP-Santé Luxembourg is a recent, multinational population-based observational study, assessing the prevalence and impact of all headache
27 disorders in Europe. More than 8000 questionnaires from eight countries (Lithuania, Germany, The Netherlands, Luxembourg, Italy, Austria, France and Spain) were collected (Andrée et al., 2011; Linde et al., 2011) Epidemiologic data review Prevalence estimates of headache in available European epidemiological studies have been reviewed recently (Stovner and Andree, 2010). The one-year prevalence of migraine (estimated at 15%) was considered to be well established from the evidence identified. For non-migrainous headaches the published evidence on prevalence is more scarce and the available studies have varying designs. However, the Eurolight project offers oneyear prevalence rates of tension-type headache (TTH), medication overuse headache (MOH), and other headaches (i.e. neither tension-type headache, migraine or medication overuse headache), collected with a common robust methodology in a large sample from eight European countries. Single diagnoses were assigned hierarchically (i.e. subjects indicating multiple headaches were assigned only one; primarily MOH followed by TTH and migraine). This is necessary in economic studies to avoid double counting, but it is contrary to clinical diagnosis where all types of headache in an individual should be diagnosed. The great majority of persons diagnosed with MOH have migraine as the underlying condition. The prevalence estimates were further reduced to adjust for overestimation due to a potential interest bias of responders, suggested after additional analysis of non-respondents in four of the Eurolight countries. The prevalence estimates are shown in Table Cost data review The literature review resulted in two new relevant studies since EBC2005 (Linde et al., 2011; Pradalier et al., 2004). Pradalier et al. (2004) reported direct costs and work absenteeism for migraine and other episodic headaches in France based on interviews from a population based sample of 1486 subjects. Linde et al. (2011) reported in the Eurolight study direct and indirect costs for 6551 subjects in their multinational sample. The Eurolight data were selected for the cost model because it would enhance the comparability across countries as data for all eight countries (whose populations constitute 55% of the EU27 population) were collected within the same study. Further, Pradalier did not present any estimate of indirect costs but only the number of absent days (Pradalier et al., 2004), and the direct costs were comparable to those in the Eurolight study (Linde et al., 2011) (e.g. 128 per person with migraine in Pradalier compared to 86 in Eurolight). The Eurolight study included high costs due to presenteeism (i.e. reduced productivity while at work). This productivity loss is undoubtedly an important indirect cost to society, but it is difficult to measure and generally not reported in studies on costs of disorders of the brain. For consistency across the disorders, a conservative approach was therefore selected for this review and it was decided not to include presenteeism in the main results. Due to the small sample sizes of patients with MOH and other headaches, we only considered the mean for all countries as inputs in the model. In the model, Spain and France were selected as base countries for MOH and other headaches respectively because they had two of the largest numbers of subjects in the Eurolight study (Linde et al., 2011) and their individual estimates were similar to the selected means. The final estimates for the cost model are shown in Table Discussion The Eurolight report enables estimation of the prevalence and costs associated with nonmigrainous headaches, which were not included in The indirect costs dominate total costs and are especially high in MOH, which also has the highest direct healthcare costs. The costs per subject with migraine in the eight countries range between 100 and 800 Euro (mean
28 of 445) which is lower than the estimates considered in 2004 ( 590 on average) but higher if excluding presenteeism from the 2004 estimate (valued at 294 in 2004). This may be due to the hierarchical approach used in Eurolight under which comparatively expensive subjects with both MOH and migraine were assigned to the MOH group, whereas they were likely included in the estimates from previous studies on subjects with migraine (Linde et al., 2011; Pradalier et al., 2004). Data on cost from the Eurolight study are yet to be published. Although the present study has graciously been allowed to use Eurolight data for input into our model, the data presented here and the data to be published from Eurolight will differ. In addition to the per subject costs in the eight included countries, Eurolight estimated the total costs in these countries, and extrapolated to the 27 European Union member states (Linde et al., 2011). Our per subject cost estimates differ from theirs because we opted for a more conservative approach in which we excluded presenteeism. Further, their methods for extrapolating costs to other European countries which were not included in the data collection differed from ours. They extrapolated the total costs in the eight countries to EU27 assuming that the costs in the included countries were the same as in those not included (Linde et al., 2011). In contrast, we extrapolated the median per subject cost in the included countries to EU27+3, adjusting for differences in health care expenditure and income levels. Further, Eurolight presented costs in nominal values (Linde et al., 2011) whereas our estimates are presented in PPP adjusted real Euro. There is no right or wrong in the selection of these two approaches. Extrapolation of data from one country to another will always need to rely on a set of assumptions. The approach used in the Eurolight study is simple and straight forward and thereby easy for the reader to follow, whereas the more complex approach selected for this review has the advantage of taking known differences between countries into account. Moreover, nominal estimates presented in the Eurolight study is more relevant for individual countries as they will be directly comparable to other local expenses, whereas estimates in real Euro is more relevant for comparison of resource use across countries as they remove the effect of price differences. Despite the methodological differences discussed above, the results are rather similar and there is no real discrepancy between the two studies. Excluding presenteeism, our per subject cost estimate of migraine is 9% lower than the mean cost per subject presented by Eurolight (Linde et al., 2011). This discrepancy is small compared to a more than fivefold difference between the per subject costs of migraine in France and Germany. The discrepancies are larger for the more rare diagnoses (our estimates are 24% higher in MOH and 59% lower in other headache), but these differences are also small in comparison to the differences across countries. In conclusion, the main uncertainty in the presented estimates is due to the large variation across countries as reported in the Eurolight study (Linde et al., 2011) Mood disorders From the wider spectrum of mood disorders (also labeled affective disorders), we included two particularly important diagnoses with large societal costs; namely major depression and bipolar disorder Epidemiologic data review The epidemiologic evidence has not changed since 2004, with the exception of the prevalence estimates ofmajor depression in the elderly which is now assumed to remain on the same levels as in adults (Wittchen and Uhmann, 2010). In 2005, country specific estimates were used for both major depression and bipolar disorder (Andlin-Sobocki and Wittchen, 2005a). In this revision, we assume that differences across studies from various European countries are primarily explained by varying study designs whereas the true differences across countries are small. Therefore, we have considered the median European best estimates of the
29 prevalence rates for all countries. That is, 6.9% for major depression (age 18+) and 0.9% for bipolar disorder (age 18 65). We acknowledge, though, that the prevalence estimate for bipolar disorder is extremely conservative, most likely to reflect bipolar 1 disorders (with full mania) only (Beesdo et al., 2009) Cost data review For major depression, nine new relevant studies were identified (Cuijpers et al., 2007; Friemel et al., 2005; Grabe et al., 2009; Hamre et al., 2008; McCracken et al., 2006; McCrone et al., 2005; Salvador-Carulla et al., 2011; Sicras-Mainar et al., 2010; Smit et al., 2006) adding to the three studies selected in the EBC2005 study (Chisholm et al., 2003; Salize et al., 2004; Thomas and Morris, 2003). These 12 studies provided estimates for the Netherlands (Cuijpers et al., 2007; Smit et al., 2006), Germany (Friemel et al., 2005; Grabe et al., 2009; Hamre et al., 2008; Salize et al., 2004), the UK (McCracken et al., 2006; McCrone et al., 2005; Thomas and Morris, 2003) and Spain (Chisholm et al., 2003; Salvador-Carulla et al., 2011; Sicras- Mainar et al., 2010). Where possible, the best available study was selected for each country. The two Dutch publications reported data from the same study, a population based cohort study (NEMESIS). Smit et al. (2006) was preferred because they presented costs for major depression while Cuijpers et al. (2007) compared severity subgroups. Four studies reported costs of depression in Germany, two of which presented their results in German (Friemel et al., 2005; Salize et al., 2004). The study by Salize et al. was selected in the previous EBC review. It is a bottom up COI study assessing the direct costs of depression in a sample of 270 patients with depressive disorder, who were recruited by primary care physicians, family doctors and psychiatrists (Salize et al., 2004). Friemel et al. (2005) reported direct health care costs for 131 persons with major or minor depression out of a community-based sample of 3555 non-institutionalized adults (ESEMED). In the third study, Hamre et al. (2008) reported both direct and indirect costs of unipolar depression patients based on 3 year follow up data from the Anthroposophic Medicine Outcomes Study (AMOS). In the fourth study, Grabe et al. (2009) reported direct health care costs for 1314 persons with depression out of a population-based cohort of 3300 persons from the Study of Health in Pomerania (SHIP). Grabe et al. was selected for Germany because it was based on a comparatively large population-based sample. Three studies reported costs in the UK (McCracken et al., 2006; McCrone et al., 2005; Thomas and Morris, 2003). Two studies were identified in this review (McCracken et al., 2006; McCrone et al., 2005) and a third study was included from the previous EBC review (Thomas and Morris, 2003). McCrone et al. (2005) interviewed adults that had major depression in their childhood, and should therefore not be representative to all adults with depression. McCracken et al. (2006) reported costs of depression in five EU countries (UK, Ireland, Spain, Norway, Finland) based on the ODIN study (Outcomes of Depression International Network). Thomas and Morris is a top down COI study that reported direct and indirect costs of depression based on data from multiple patient registries in the UK (Thomas and Morris, 2003). Thomas and Morris was selected for the UK. Three studies presented costs for Spain (Chisholm et al., 2003; Salvador-Carulla et al., 2011; Sicras-Mainar et al., 2010). Two studies were identified in this review (Salvador- Carulla et al., 2011; Sicras-Mainar et al., 2010) and one study was included from the previous EBC review (Chisholm et al., 2003). Salvador-Carulla et al. (2011) is a top down study and estimated the costs of depression in Catalonia, based on a literature review of available estimates, secondary databases and expert opinions. Sicras-Mainar et al. (2010) is a bottom up COI study (published in Spanish) which was based on the data from two hospitals in Spain, in Badalona and Pujol. It reported direct health care and indirect costs of depression for a total of 4572 patients (54.6% were in remission), who were followed for 18 months. Chisholm et al. (2003) is a bottom up COI study based on data from Longitudinal Investigation of Depression Outcomes (LIDO). It
30 reported direct and indirect costs of depression in five countries (Israel, Spain, Brazil, Australia and Russia). In Spain, 472 patients with four different types of depressive disorder (comorbid and discrete clinical and subclinical depression) were recruited from primary care settings. Given the sample populations in the other studies, the costs for comorbid clinical depression (98 patients) were considered most relevant. Sicras-Mainar et al. was selected for Spain because it is based on primary data on a relatively large sample of patients. Table 30 shows the cost data used for major depression in the European cost model. For bipolar disorder, three new relevant studies were identified (Gonzalez-Pinto et al., 2010; Osby et al., 2009; Tafalla et al., 2010) adding to the four studies included in the EBC2005 study (Das and Guest, 2002; De Zélicourt et al., 2003; Hakkaart-van et al., 2004; Olie and Levy, 2002). Five of these studies (De Zélicourt et al., 2003; Gonzalez- Pinto et al., 2010; Olie and Levy, 2002; Osby et al., 2009; Tafalla et al., 2010) reported direct healthcare costs of patients admitted to hospital or visiting outpatient clinics due to a manic episode. The remaining two studies (Das and Guest, 2002; Hakkaart-van et al., 2004) focused on the broader group of persons with bipolar disorder rather than only persons with manic episodes, and included both direct and indirect costs. Das Gupta and Guest was a top down study based on multiple British registries. Hakkaart-van Roijen et al. reported costs on 40 patients with bipolar disorder from a population based cohort (NEMESIS) in the Netherlands. The estimates presented by Das and Guest (2002) were considered for the European cost model, because of the broader group of persons with bipolar disorder, the inclusion of indirect costs and the limited sample size of the Dutch study. The indirect costs of mortality was excluded resulting in direct healthcare costs of 487, direct non-medical costs of 468 and indirect costs of 6663 (all in 1999 GBP) Discussion The direct health care costs of persons with major depression vary across studies and countries, and is probably explained both by differences in regional care patterns and study design. Not least the severity of persons has a large impact on the cost estimates, and top down registries may to a larger extent include the less severe and costly persons than bottomup studies. For instance, the British top down study reports much lower estimates than the German populationbased bottom up study. The pattern was similar in the EBC2005 study (Andlin-Sobocki et al., 2005), but lower estimates on the indirect costs in Spain and the Netherlands result in lower total costs overall. For bipolar disorder, no evidence of changes in costs has emerged since Multiple sclerosis Multiple sclerosis (MS) is the most common disease of the central nervous system causing permanent disability in young adults. The diagnosis of MS is made based on clinical history, neurological examination, diagnostic tests, and after the exclusion of other diseases that could account for the clinical, laboratory and radiological findings. MS typically presents with a clinically isolated syndrome (CIS), defined by a distinct first neurological event with observed demyelination involving the optic nerve, cerebrum, cerebellum, brainstem, or spinal cord Epidemiologic data review The distribution of MS prevalence in Europe before 2004 was reviewed in the EBC2005 study (Andlin-Sobocki et al., 2005). An increase in the prevalence estimates was observed since 2004, given the use of new diagnostic criteria which allow for detecting the disease earlier. Despite the wealth of epidemiological studies on MS conducted over the past decades, the picture of MS distribution by geography, gender and age is still affected by methodological
31 concerns: (a) the variability of the surveyed populations (size, age structure, ethnic origin, etc.), (b) the capability to detect benign and/or early cases, (c) the degree of case ascertainment differing by geographical and calendar time setting, access to medical care, number of neurologists, availability of new diagnostic procedures, public awareness about MS, etc.; and (d) the impact of the different diagnostic criteria used across the studies. The reported point prevalence estimates for each country ranged from 56 per 100,000 in Lithuania to 232 in Ireland (Table 31). Some studies also reported prevalence estimates by age, gender and severity but they were not considered for the European cost model. Costs were only considered for those aged 18 years and above Cost data review Regarding the review of the literature to obtain relevant cost information, fourteen recent studies met the predefined inclusion criteria and were selected for inclusion (Berg et al., 2006; Casado et al., 2006; Kobelt et al., 2006a,b,c; Kobelt, 2006; Kobelt et al., 2006d,e,f,g, 2009; McCrone et al., 2008; Orlewska et al., 2005; Russo et al., 2004) (Table 32). Ten of the fourteen studies were part of a multinational observational study in Europe, conducted by Kobelt and colleagues and therefore were all included in the calculations (Berg et al., 2006; Kobelt et al., 2006a,b,c; Kobelt, 2006; Kobelt et al., 2006d,e,f,g, 2009) (Table 30). Cost-of illness studies including MS patients from countries already covered by the European study by Kobelt and colleagues were excluded in order to avoid calculations based on studies with differences in methodology (Casado et al., 2006; McCrone et al., 2008; Russo et al., 2004). The study conducted by that presented the costs of MS patients in Poland was also included in the calculation of the cost of MS in Europe (Orlewska et al., 2005). Cost-of-illness studies conducted before 2004 and included the EBC2005 study, were not considered relevant for inclusion since the new treatment options that are available since 2004 resulted in an increase in the cost per patient. In order to estimate the cost of Multiple Sclerosis for the entire population, costs for non-adult patients were set to zero given the lack of relevant data. This is a limitation which however is not likely to have an important impact on the results since there are very few non-adult MS cases and therefore the underestimation of the total economic burden should not be significant Discussion The new prevalence data available for European countries suggest an increase of the disease frequency since the EBC2005 study (Andlin-Sobocki et al., 2005). This increase is likely to be attributed to the new diagnostic criteria which allow detecting the disease earlier. With regard to the economic evidence retrieved from the literature, an increase in the cost per patient with MS is observed, which is likely due to the new and more costly treatment options that are available during the last ten years. The differences in the methodologies of the costof-illness studies that were conducted before and after 2004 as well as the differences in the disease severity of the study populations render the comparison between the studies difficult and limit the possible interpretation of the changes in the economic burden of the disease since Parkinson's disease Parkinson's disease is a chronic progressive neurodegenerative disorder characterized by tremor, bradykinesia, rigidity and postural instability. In parallel to the gradual loss of function, patients perceive a reduction in their quality of life and their need for care incurs high costs to their families and society as a whole. The number of persons and subsequently the burden of Parkinson's disease is expected to increase over time due to the aging European
32 population. In the EBC2005 study, only persons above 65 years of age were considered whereas in this revision the costs of two age groups were estimated; one younger group (aged 40 69) with low prevalence but higher costs due to work absence, and one older (70+) in which the prevalence is higher but with no indirect costs because they are already retired Epidemiologic data review Separate prevalence estimates were identified for persons between 40 and 69 years of age, and those of 70 years of age and above (Table 33). Estimates were only available for four countries but were assumed to be representative to the whole of Europe Cost data review The review of the cost literature revealed eighteen studies that were considered relevant for inclusion. Four of these studies reported country-specific cost estimates for Germany, Austria, Italy and Czech Republic, out of a registry set up by the European network for Parkinson's disease (EuroPa) (European Network for Parkinson's Disease www. europarkinson.net). Persons were recruited from the EuroPa registry including outpatients at specialist clinics and their direct and indirect costs were assessed through a questionnaire at baseline and follow-up visits after 3 months (Reese et al., 2010; von Campenhausen et al., 2009; Winter et al., 2010a,b). There were seven other studies conducted in these four countries but the EuroPa estimates were preferred because they used a common robust methodology (Barth et al., 2005; Dengler et al., 2006; Dodel et al., 1997, 1998; Ehret et al., 2009; Keller et al., 2003; Spottke et al., 2005). Among the studies that there were identified from the review of the literature, four studies reported relevant cost estimates for Finland, France, Sweden and the UK (Hagell et al., 2002; Keränen et al., 2003; LePen et al., 1999; McCrone et al., 2007). McCrone et al. (2007) estimated the costs of patients with Parkinson's disease in the UK that were recruited from a community based cohort and hospital clinics. The other three studies were also selected for the EBC2005 study and constitute the most up to date evidence on costs in their respective countries (Hagell et al., 2002; Keränen et al., 2003; LePen et al., 1999). The remaining three studies did not report any cost estimates relevant for our study. Two of them explored the effects of dyskinesias on direct health care costs (Maurel et al., 2001; Pechevis et al., 2005) and Cubo et al. (2005) studied the burden of Parkinson's disease in Spain in terms of years of life lost (YLL) and years lived with disability (YLD). The estimates considered for the European cost model are listed in Table 34. The direct costs per person are assumed to be the same for both age groups, but indirect costs are only considered for persons up to 65 years of age Discussion This review of the prevalence and costs of Parkinson's disease in Europe enabled the inclusion of younger persons below the age of 65 which were not included in the EBC2005 study. However, because the prevalence in those below 70 years of age is relatively low, this is not expected to result in a large increase in the total number of persons. The updated costs per person are similar to those reported in the EBC2005 study albeit with some variation across countries; however, the new study included new evidence for a large number of countries. There is still limited data on costs separating between the young and the elderly persons with Parkinson's disease. The direct health care costs were therefore assumed to be the same across age groups, but it should be noted that most of the evidence is based on younger persons.
33 4.10. Psychotic disorders Psychotic disorders are characterized by episodic or enduring dysfunctions of perceptual cognitive and emotional processes. Common symptoms include hallucinations and paranoid or bizarre delusions, associated with typical severe impairments and disabilities with regard to social and occupational functioning. Schizophrenia (ICD10 F20) is the most severe type of disorder in this group, while others include schizoaffective disorder (ICD10 F25.9) and schizophreniform disorder (ICD10 F20.81). All psychotic disorders were included in the literature review, but we only considered estimates on the cost of persons with schizophrenia for the European cost model. The rationale was that the majority of the available cost studies have focused on persons with schizophrenia only and because only small differences in costs between different diagnoses are expected Epidemiologic data review The best estimate for the European prevalence of psychotic disorders was 1.2% (Dominguez et al., 2011), of which more than half are persons with schizophrenia (prevalence of 0.635%). The considered age group was everyone from 18 years of age and above Cost data review Twelve new relevant cost studies since 2004 were identified in the literature review. As stated in the Introduction, the majority of the studies were based on persons with schizophrenia, whereas three studies also included persons with other psychotic disorders. Two studies presented estimates from a prospective observational cohort (Garattini et al., 2004; Knapp et al., 2004; Mangalore and Knapp, 2007) and the third study was based on data from a clinical trial sample with strict inclusion criteria (Salize et al., 2009) None of these studies was considered for the European cost model. Heider at al. randomly sampled 1208 persons with schizophrenia between 18 and 64 years of age from patient lists in secondary care clinics (Heider et al., 2009). Persons were followed up to two years with assessments of their resource utilization every six months. Among the nine studies on persons with schizophrenia, this was preferred because it presented costs for three countries (France, Germany and the UK) that were estimated using a common methodology. This study was also preferred to the study selected in the EBC2005 study (Knapp et al., 2004), because it was based on a larger cohort of prospectively followed persons with schizophrenia. Knapp et al. recruited 404 persons with schizophrenia between 18 and 65 years of age that had been in contact with mental health services during the past 3 months. They then asked the persons about their resource utilization during the past 3 months. Out of the remaining eight studies, four explored the costs of schizophrenia but did not provide any usable estimates. One of these presented pooled data from several countries but no data enabling country-specific estimates, (Hong et al., 2009) another German study explored the effects of clinical and social characteristics on costs, and the other two studies in Germany and Switzerland estimated the costs of family caregivers of persons with schizophrenia (Lauber et al., 2005; Wilms et al., 2004). Another three studies were not considered for the European cost model because they used a top down approach (Behan et al., 2008; Oliva-Moreno et al., 2006), or were based on a sample selected specifically for treatment with risperidone (Lindström et al., 2007). The study by Olivares, and colleagues also aimed at evaluating treatment with risperidone, but they also reported baseline costs of a seemingly unselected sample of persons with schizophrenia prior to the start of treatment (Olivares et al., 2008). Estimates of direct health care costs for the European cost model were selected from Olivares et al. and Heider et al. (Table 35).
34 Neither of the two selected studies included data on indirect costs. Instead, employment data were collected from the European Schizophrenia cohort (Bebbington et al., 2005). They estimated the proportion of persons with schizophrenia that were employed at 12.9, 30.3 and 11.5% in France, Germany and the UK respectively. The indirect costs were assumed to be the remaining (unemployed) proportions multiplied by the net annual income in each country, estimated at 24,449, 25,381, and 26,220 respectively (OECD statistics 2011 stats.oecd.org) Discussion The latest economic evidence for schizophrenia suggests lower direct healthcare costs per person compared to the estimates reported in the EBC2005 study. The estimates at that time were all based on the study conducted by Knapp et al.(2002) who used a different methodology which may have resulted in higher figures. For instance, they measured the costs of persons that had been in contact with the health services during the same period in which they assessed the costs. This may have led to an overestimation because those that had not been in contact with health care, and therefore probably had lower costs, were omitted from the analysis. This updated review also enabled the inclusion of indirect costs which were not included in the EBC2005 study. The total costs per person are therefore higher in this revision. Still, the indirect costs were estimated based on limited data and do not include costs of potential short term sickleave which may have resulted in even higher estimates Stroke Stroke is defined by the World Health Organization as a focal (or at times global) neurological impairment of sudden onset, and lasting more than 24 h (or leading to death) and of presumed vascular origin. Stroke may be defined as ICD 10 code I61 (intercerebral hemorrhage), 63 (cerebral infarction) 64 (hemorrhage or infarction) and 67 (other type). Transient ischemic attack (G45) is a diagnosis often excluded from the stroke, but it is a related diagnosis. Similar to the EBC2005 study, we do not include this in our analysis. In the EBC2005 study, only the costs of incident cases of stroke were considered (i.e. persons having a stroke in 2004). In this revision we are estimating both the costs of the incident cases (i.e. persons having a stroke in 2010) and the prevalent cases (i.e. persons having a stroke in any year prior to 2010) Epidemiologic data review A Medline search for stroke prevalence and incidence studies from Europe since 2004 was conducted. In comparing studies to the systematic review by Truelsen et al.(2006), this search yielded fairly identical results for the few countries with newer data. A standardized approach was taken by Truelsen et al. This has detailed prevalence and incidence data from almost all involved European countries, and decision was made to again use this excellent data resource Cost data review The literature review identified 5 studies which were considered for inclusion in the calculations. A further study was provided via personal communication (Smith et al., 2010) as the authors have only recently submitted this to a peer reviewed journal. The estimates are taken from their corresponding national report. These estimates together, provided cost estimates for Germany, Ireland, Italy, Switzerland, The Netherlands and the UK, which are presented in Table 36. All of the studies concentrated on the first 12 months of costs of incident cases of stroke except for Gerzeli et al. (2005) that looked at first 6 months only, so we doubled this to get the
35 12 months of costs for the model. The Dutch study reported direct costs for different age and gender groups, and an average was therefore calculated by considering the mean cost of men and women in those aged between 75 and 84 years of age (Struijs et al., 2006). Further to the 12 month data, the German and Dutch studies had a longer follow-up up to 5 years after the stroke (Kolominsky-Rabas et al., 2006; Struijs et al., 2006). These two studies showed that the costs in the second year were about 25% of the costs in the first year after the stroke. Therefore, we assumed that the costs of prevalent cases would be 25% of the costs of the incident cases in each of the countries Discussion The costs per person with a stroke within the past year (incident cases) was similar in this revision compared to the estimates reported from the EBC2005 study (Andlin-Sobocki et al., 2005). Further, the same incidence data was used in both studies, resulting in the estimate of the number of persons increasing by the same rate as the size of the European overall population. A new contribution in this study, which dramatically increased the total estimated costs of stroke, is that we now included the costs of prevalent cases. These have much lower annual costs than the incident cases, but because they are larger in numbers they constitute a large proportion of the total costs Traumatic brain injury (TBI) The EBC2005 study (Andlin-Sobocki et al., 2005) reported estimates on the acute costs of traumatic brain injury (TBI). The rehabilitation and long term consequences were not considered and little is known about their costs. Therefore, an economic model was developed to estimate the mean annual costs of persons suffering from a prior TBI Epidemiologic data review The literature review identified two new studies (Cassidy et al., 2004; Rickels et al., 2010) confirming the incidence data suggested in the review by Tagliaferri et al.(2006). The overall incidence ranges between 100 and 300 per 100,000 inhabitants depending on study (Cassidy et al., 2004). Tagliaferri suggests 235 persons distributed over mild (186), moderate (28) and severe (21) TBI, per 100,000. There is limited data available on the number of persons suffering from a previous traumatic brain injury Cost data review Six new studies were identified in the literature review, all presenting partial costs of TBI patients (Meerding et al., 2006; Morris et al., 2008; Norlund et al., 2006; Polinder et al., 2005; Rickels et al., 2010; Rossi et al., 2006). Two studies estimated the direct health care costs of all types of injuries and reported brief data on skull and brain injury at 3100 in the Netherlands (Meerding et al., 2006) and 2822 in 10 European countries (Polinder et al., 2005). Another three studies estimated the hospitalization costs of mild TBI at 914 in Sweden (Norlund et al., 2006), isolated head TBI at 3149 in Italy (Rossi et al., 2006) and TBI at 15,462 in England and Wales (Morris et al., 2008). The sixth study was a population based study presenting data on resource use associated with headinjury in Germany (Rickels et al., 2010). The economic model was designed to estimate the number and costs of persons in acute trauma care, in rehabilitation or suffering from the long term consequences of a previous TBI. We assumed a time horizon of 20 years divided into three phases: acute (first 6 months following the injury), rehabilitation (the following 18 months) and finally a long term phase. We used different input data for each phase and severity of the TBI (mild, moderate and
36 severe), including incidence rates, mortality rates, hospitalization costs, and the proportions and costs of patients getting rehabilitation, not being able to work, and having to live in care homes (Table 37). The number of prevalent cases in each phase and their mean costs was then calculated by following the path of a hypothetical cohort of incident cases over twenty years. The costs of all incident cases in 2010 and prevalent cases (assumed to suffer from TBI occurring between 1991 and 2009) were calculated for each severity (Table 38) Discussion The TBI cost model provided estimates of number of persons and their annual costs per person, stratified by severity. These data have not previously been available. The mean direct health care costs (hospitalization) of the incident cases in the model ( 4356) were comparable to the corresponding estimates in the EBC2005 study ( 4143 on average), but the long term costs are as seen much higher Child and adolescent disorders From the much wider spectrum of disorders with a typical onset in childhood and adolescence we were able to include: Autism Spectrum Disorders (ASD), Attention Deficit Hyperactivity Disorder (ADHD) and Conduct Disorder (CD) Epidemiologic data review As seen in Section 3.2 it was estimated that there are approx. 6 million individuals with child and adolescent disorders in Europe in 2010 (based on the European population aged 2 17 years). The number of persons affected by child and adolescent disorders is for ASD based on a recent review study of 43 studies on pervasive developmental disorders, which indicated a prevalence of ASD at 0.64% (Fombonne, 2009). The boy girl ratio was, based on the review, assumed to be 4:1. The number of persons with ADHD and CD is based on a prevalence rate that was estimated, weighted for sample size, using epidemiological studies as selected based on searches in Pubmed/Medline (Baumgaertel et al., 1995; Döpfner et al., 2008; Esser et al., 1990; Ford et al., 2003; Gomez-Beneyto et al., 1994; Kroes et al., 2001; Landgren et al., 1996; Puura et al., 1998; Steinhausen et al., 1998; Taylor and Sandberg, 1991; Verhulst et al., 1997). The prevalence rates were estimated at 5% for ADHD and 3% for CD, respectively, for ages 6 to 17 and 5 to 17. Based on the reviewed studies, the boy girl ratio for ADHD and CD is estimated to be 3:1. Further it was estimated that the prevalence rate decreases in adolescence for ADHD whereas increasing in adolescence for CD Cost data review Regarding cost studies, literature searches identified 1732 article hits of which eleven papers were in the end included for final evaluation. Cost per person is highest for ASD, based on a UK and a Swedish study that survived exclusion criteria (Järbrink, 2007; Knapp et al., 2009). In the UK study, which includes ASD persons both with and without mental retardation, the selected cost estimate refers to persons without mental retardation. For ADHD a Dutch study survived exclusion criteria (Hakkaart-van et al., 2007) and for CD a UK study (Romeo et al., 2006). For all conditions, costs include direct and indirect costs. Table 39 reports the data extracted and used from the selected studies for the economic model. It should be noted (albeit not reported in the table) that further adjustments were made to account for less than 100% treatments rates (25% treatment assumed for ADHD and CD, which affects the direct costs).
37 Discussion To note regarding child and adolescent disorders is that there is only a limited amount of economic studies on the cost per person in a European setting. Hence significant modeling/extrapolation as detailed in the Methods section has been necessary to carry out. Significant uncertainties include, among others, potential differences in treatment rate across European countries. Further, it is difficult (with precision) to estimate the excess cost to school services and other societal sectors apart from the medical sector that is affected regarding resource use as a result of persons with child and adolescent disorders Mental retardation Mental retardation, also sometimes referred to as Intellectual Disability, refers to the ICD-10 categories of F70 F79. It has been suggested, in revisions of ICD-codes, that the term Intellectual Developmental Disorder will replace Mental Retardation. However, since this is yet not official we will use the term Mental Retardation in this paper. Mental retardationmay be described as a meta-syndrome analogous to dementia, characterized by pervasive developmental cognitive impairment (Salvador-Carulla and Bertelli, 2008).Mental retardation is associated with significant health problems worldwide such as multiple disabilities and other medical conditions. A substantial proportion of mental retardation is due to preventable causes. The disease may be mild, moderate, severe or profound. The large share of individuals affected by this disorder has mild mental retardation (85%), whereas moderate (10%) and severe (4%) are profound (2%) and are less common (King et al., 2009) Epidemiologic data review As seen in Section 3.2, it was estimated that there are about 4.2 million persons with the disease in Europe in ages 0 to 65. This is estimated using a prevalence rate estimate of 1%, based on a recent meta-analysis (Maulik et al., 2011) indicating a prevalence rate of 0.92% in developed countries. The prevalence rate at 1%, slightly higher than the estimate for developed countries in Maulik et al.(2011), is motivated by the finding of higher prevalence rate among middleincome countries, which include a few of the European countries (Durkin, 2002). Environmental factors such as alcoholism, lead exposure, iron deficiency,malnutrition, perinatal problems and many other non-genetic conditions play a major role in the excess of people with mental retardation in less economically developed countries (Bertelli et al., 2009). Studies indicate a female male ratio varying between 0.7 and 0.9 among adults and between 0.4 and 1 among children and adolescents (Maulik et al., 2011). In this report we assume a female male ration in the midpoint of that interval at Cost data review Regarding cost studies, literature searches identified 817 hits of which ten papers were included for final evaluation. Most papers were based on very specific disease samples in the UK, indicating a great need for additional COI studies on mental retardation. One study surviving basic exclusion criteria is a Dutch study using a top down approach with a healthcare perspective (Polder et al., 2002). Below the data from the study that was used as inputs in the economic model, are presented (Table 40) Discussion The annual cost per subject with mental retardation used in the economic model is a conservative estimate of the economic cost of the disease since it does not include most of direct non-medical costs due to the disease, such as the extra resources needed in educational and social service sectors. Neither does it include indirect costs in terms of lost productivity. Considering that it is known that employment is very low among individuals with MR,
38 including indirect costs would have implied a significantly higher cost per person (Martinez- Leal et al., 2011) Eating disorders It was estimated that about 1.5 million persons in Europe are affected by Eating Disorders, which here includes Anorexia Nervosa and Bulimia Nervosa (category F50.0 and F50.2 in ICD-10, respectively). Other conditions, such as Binge Eating Disorder, are not included in this report and would have, obviously, implied a larger number of persons affected Epidemiologic data review The number of persons estimated with Eating Disorders is based on a prevalence rate of 0.54% for Anorexia Nervosa and 0.86% for Bulimia Nervosa in the age range 14 to 17 years. For the adult population, years, a lower prevalence rate at 0.21% for Anorexia Nervosa and 0.14% for Bulimia Nervosa was assumed (Jacobi et al., 2004) Cost data review Regarding cost studies on Eating Disorders, the literature searches identified 237 hits, of which only four papers were considered for inclusion. Of these four papers, only one paper actually contained enough data in order to be useful (and passing exclusion criteria) (Krauth et al., 2002). The study contains cost per person data for Anorexia Nervosa and Bulimia Nervosa and is based on a German sample with a bottom up methodology. Cost estimates are based on benefit data from health and pension insurance schemes. In the report we exclude costs due to premature mortality from the study, and therefore the data on cost per person used here is lower compared to what is reported in the included study (Krauth et al., 2002). Below is the data that was used as inputs in the economic model. Excluding prematurely mortality costs, cost per person for Anorexia Nervosa is 1984 and 117 for Bulimia Nervosa. It should also be noted that an assumption of a treatment rate below 100% is included in the cost modeling; with a treatment rate of 50% for Anorexia Nervosa and 25% for Bulimia Nervosa (direct costs were reduced accordingly) (Table 41) Discussion There are several reasons to believe that these are lower limits of the true cost per person with Anorexia and Bulimia Nervosa. Several resource items are missing from the study, including most outpatient resource use and informal care costs; e.g. lost productivity among parents or caretakers resulting from the disorder among adolescent persons Personality disorders Personality Disorders (PD) included in this study only take into consideration the cluster B disorders (Borderline Personality Disorder and Antisocial Personality Disorder) as no solid estimates could be obtained for other personality disorders. These refer to categories F60.31 and F60.2 in ICD-10, respectively. Based on the age range between 18 and 65 years it was estimated that 4.4 million persons in Europe are affected by these two personality disorders Epidemiologic data review The number of persons affected by personality disorders is based on a prevalence rate of 0.7% for Borderline Personality Disorder and 0.6% for Antisocial Personality Disorder in the age range 18 to 65 (Coid et al., 2006). There is also a significant age profile for personality disorders, with higher prevalence in young adulthood as compared to later in life; with an age
39 ratio of among 10:1 for Antisocial Personality Disorder and 8:1 for Borderline Personality Disorder in the age range in relation to the age-range Cost data review Regarding studies on the cost per person of personality disorders, literature searches identified 941 hits. In the end eleven papers were considered for inclusion in the project. After full evaluations a cost per person for Antisocial PD is based on a Dutch study including both direct and indirect costs (Soeteman et al., 2008). Cost per case for Borderline PD is also based on a Dutch study including both types of costs (van Asselt et al., 2007). Both studies are based on a bottom up approach. Below is the data from the study that was used as inputs in the economic model. It should also be noted that an assumption of a treatment rate below 100% is included in the cost modeling; with a treatment rate of 30% for Borderline PD and 10% for Antisocial PD (direct costs were reduced accordingly) (Table 42) Discussion Cost per person is higher for Borderline PD with an estimated cost per treated person at 16,205 per year. The largest cost component is indirect costs, mainly caused by productivity losses due to disability and to some extent due to higher absence from work. The quite significant direct non-medical costs mainly contain informal care costs. For Antisocial PD a higher share of costs are due to direct health care costs. It should also be mentioned that the cost per person does not include e.g. crime costs that may be significant for persons with Antisocial Personality Disorder Sleep disorders It was estimated that there are approx. 45 million persons affected by sleep disorders in Europe in This was based on the inclusion of the following specific diseases in the category of sleep disorders: Sleep Apnea, Insomnia, Narcolepsy and Hypersomnia Epidemiologic data review Assumed prevalence rates are seen in Table 43. The highest prevalence rate is seen for Insomnia, followed by Sleep Apnea, Hypersomnia and Narcolepsy Cost data review Regarding cost data for sleep disorders 1067 hits were identified in the first round of searches, and in the end six papers were considered of which five are included in the model. Cost per person of insomnia is based on two French studies in order to gather both direct and indirect cost data (Godet-Cayré et al., 2006; Leger et al., 1999). Cost per case for Hypersomnia, Narcolepsy and Sleep Apnea is based on three different studies using Danish register data with a common methodology, retrospective bottom up studies, including both direct and indirect costs (Jennum et al., 2009; Jennum and Kjellberg, 2010, 2011) (Table 44) Discussion Narcolepsy is the condition among sleep disorders with the highest cost per person, mostly explained by high indirect costs due to lower employment (matched to control group) among individuals with narcolepsy as well as lower income if employed Neuromuscular disorders Neuromuscular disorders cover a wide range of different conditions with varying causes and consequences. In the project it was initially decided to divide Neuromuscular Disorders into five different categories, but a lack of economic cost data implied that we had to narrow the
40 number of included conditions. And as described in Section 3.2, included Neuromuscular Disorders in the study are categorized as: (1) Muscular Dystrophies (MD) and other genetic myopathies: Duchenne, Becker, Facioscapulohumeral (FSHD), Limb Girdle, Emery Dreifuss MD (EPMD), Oculopharyngeal MD (OPMD), Congenital MDs, Congenital myopathies, Distal and Myofibrillar Myopathies and Myotonic dystrophies, (2) Acquired Neuropathies: Chronic Inflammatory Demyelinating Polyradiculoneuroapthy (CIDP), Multifocal Motor Neuropathy (MMN), Paraproteinemic Polyneuropathies (PDN), Guillain Barré Syndrome (GBS) and Amyotrophic Lateral Sclerosis (ALS), (3) Autoimmune Disorders of muscle and of the neuromuscular junction: only possible to include Myasthenia Gravis Epidemiologic data review Most neuromuscular disorders are rare and it was estimated that the number of persons with any one of the conditions listed above is about 0.25 million in Europe. This is based on prevalence rates as described in Table 45. Note that the number of persons estimated to be affected with Neuromuscular Disorders lacks a number of important conditions such as Hereditary Neuropathies (e.g. Charcot Marie Tooth disease), Spinal Muscular Atrophies, Inflammatory Myopathies (Dermatomyositis, Polymyositis, and Inclusion Body Myositis, Glycogen Storage Diseases, Mitochondrial Cytopathies) and several other conditions. Including these conditions would obviously have increased the number of persons estimated to be affected with Neuromuscular Disorders Cost data review Regarding cost studies, literature searches of NMD gave 829 hits, and in the end 4 papers were considered for inclusion in the model. For NMD an exception regarding exclusion criteria for countries was made; an Australian study is used in order to estimate cost per case for muscular dystrophies (AccessEconomics, 2007). Other included studies are based on samples in Germany, France and the UK (Espèrou et al., 2000; Mahdi-Rogers et al., 2008a,b, 2009; Schepelmann et al., 2010). Shown in Table 46 is the data from the studies that were used as cost inputs for the model Discussion The cost per persons with Neuromuscular Disorders is relatively high. It should also be mentioned that some of the excluded conditions (due to lack of relevant economic studies) are thought to be very costly, such as acid maltase deficiency (the cost of enzyme replacement therapy is extremely high), and would have implied a significantly higher economic burden due to Neuromuscular Disorders Somatoform disorders Somatoform disorders describe a heterogenous group of mental disorders ranging from hypochondriasis over pain to somatization disorder. The descriptive hallmark of these disorders is the patients' cognitive distortion regarding physical symptoms and their illness behavior. Such patients perceive obviously normal physical sensations of their body functions as being proof of having illness and consequently persistently seek medical advice and treatment because of perceived physical symptoms for which treating physicians could not find a reasonable explanation. Depending on the type and form of patients' symptoms,
41 different sets of diagnostic criteria have been established. The economic burden of somatoform disorder is typically considered to be extremely high, because by diagnostic definition theses disorders have to be associated with high, medically not justified doctor visits and numerous and sometimes even invasive medical investigations, consultations and testing of various treatments. Distress and suffering of such patients are typically high, and patients also commonly unable to work resulting in extensive sick leave and early retirement Epidemiologic data review A review of European studies suggested a median European prevalence of 6.6%. For our study, to avoid overlap with headache dealt with separately, we estimated the proportion of subjects with somatoform disorders exclusively due to headache and excluded such patients, resulting in an adjusted prevalence of 4.9% (Wittchen et al., 2011). The available evidence suggests that this prevalence is applicable to persons from 18 years and above, but only those between 18 and 65 were considered for the cost calculations Cost data review The most recent study that estimated the costs of persons with non-psychotic disorders was recruited from a Dutch population based cohort (NEMESIS) (Cuijpers et al., 2010). However, estimates were only presented by subgroups based on the individual scores on a neuroticism scale, and no reliable estimate of the cost of a person with somatoform disorder could therefore be derived from this study. Reid et al. (2002) studied a selected sample of what the authors call frequent attendees in secondary care without using specific criteria for somatoform, disorders. examined consecutive patients registered for inpatient treatment at a behavioral medicine clinic in Germany, reporting direct health care costs and sick-leave days and also considered various subgroups (Hiller and Fichter, 2004). The lack of diagnostically and clinically meaningful sound cost data that could be translated in a reasonable way to our reference population of patients, thus prohibits use of these study data. In order to at least have a conservative proxy for this important groups of patients we decided to use the German community based study (GHS MHS, (Jacobi et al., 2002)) which also assessed the resource use of persons with somatoform disorder. The excess costs of each person were estimated by multiplying the difference between those meeting the diagnostic criteria for one somatoform disorders included versus those not meeting these diagnostic criteria, taking into account unit costs of each resource. Resources included visits to primary care and specialists, inpatient stays and indirect costs due to absence from work (potential indirect costs of those outside the workforce were not considered). Direct healthcare costs were estimated at 720 per person and indirect costs at 899 (both in 2004 values). These estimates were used in the European cost model Discussion It should be noted that the presented estimate for somatoform disorder is conservative, due to the exclusion of headache. The prevalence in the GHS MHS (Jacobi et al., 2002) study was 11% which indicates that they included a broader range of persons. 5. Discussion 5.1. Main findings This study provides the currently best possible estimates of the cost of disorders of the brain in Europe in the year 2010, based on the latest available evidence. In comparison to our previous 2005 estimate based on a more restricted set of diagnoses as well as a smaller
42 European reference population, we showed that the estimate presented in the EBC2005 study remains quite stable if correcting for inflation and the increase in the population. The 2004 estimate of 386 billion translates into 488 billion given the current 2010 price levels and population size, which is comparable to our revised estimate for the same disorders of 477 billion in Our 2010 revised estimates for exactly the same twelve diagnostic groups covered in the 2005 report also confirmed our previous interpretation and conclusion that our estimates would be even higher if all costs of these disorders were considered. In the present study, important elements were added that were lacking in the EBC2005 study due to a lack of data. These elements included new sub-diagnoses such as non-migrainous headaches and post traumatic stress disorder, the long-term costs of persons having a stroke or traumatic brain injury in previous years, and the indirect cost of psychotic disorders and traumatic brain injury. Incorporating these dimensions added another 164 billion to the cost of the originally included 12 disorders. In the present study we also estimate the cost of an additional seven important groups of disorders of the brain. They were not considered at all in the EBC2005 report due to lack of data. The total cost of these disorders amounted to an additional 157 billion. In total we come to the conclusion in our current report that the cost of disorders of the brain amounts overall to a staggering 798 billion in Europe in 2010 or more than the double of our previous estimate. Lots of somewhat less prevalent disorders are, however, still missing in the present report due to lack of data. The true estimate of the cost of disorders of the brain is therefore probably considerably higher. More research, particularly of cost items, is needed on all disorders of the brain Possibilities for over- and underestimations The biggest risk of overestimation of cost in our study is the possibility of double counting discussed throughout in our report. The best way to avoid this risk would have been to do field studies in all European countries of representative samples from the general population, covering the full spectrum of disorders of the brain in one study. We have previously made plans for such a study but found that even with a number of simplifications and compromises, such a study of 19 groups of disorders of the brain in 30 countries would cost in excess of 100 million and would thus be unrealistic. We believe as discussed below that we have been able to largely eliminate double counting in the present study. While overestimation is a theoretical possibility, there are many underestimations that are certain. First, many cost items are still not included in our study including indirect cost of insomnia, mild traumatic brain injury, mental retardation and child and adolescent disorders. Second, for some disorders only a limited age group has been evaluated, for example the estimated huge cost of adults with autism was not included due to limited data and all pain related somatoform disorders were also not included. Third, many neuromuscular disorders, rare genetic disorders, dystonia and several other neurological diseases have not been included at all. The same is true of a multitude of less common psychiatric disorders, in fact many more than have been included albeit more rare disorders. The consequences of tobacco addiction and crime due to addiction to opiates are very costly, but they are not included.
43 Additionally, appetite regulation is a neurobiological phenomenon but obesity has not been included under eating disorders. Fourth, the cost of crime in alcohol dependence was estimated at around 1500 (PPP 2010) per person in Estonia and Sweden (Jarl et al., 2008; Saar, 2009). Extrapolated to the whole of Europe this amounts to 24 billion in total costs. Estimates for opioid dependence showed larger variation; 1200 in Spain, 9140 in France and 61,321 in the UK, which amounts to 14 billion in total costs if extrapolated to Europe. Fifth, the evidence of premature mortality is available for some disorders but not for others. In brain tumor, the cost of premature mortality constitutes about 5.3 billion. Estimates were also available for substance use disorders but were not included in the main results. The available data from Estonia, Germany, Sweden, France and Spain suggest costs in the range of 4200 to 5200 for alcohol dependence and about 1300 for opioid dependence. This amounts to 58 billion in total costs for Europe for alcohol dependence and 1.5 billion for opioid dependence. The cost of premature mortality could be studied using a comparatively simple but consistent method across all disorders, by analysis of registry data on mortality. Such data are available in Sweden and Denmark, including the cause of death by ICD-10 codes. An important advantage of such analysis would be that double counting could easily be avoided by only considering one diagnosis per person, i.e. the main diagnosis according to the registry data. Sixth, the cost of cannabis dependence could not be included in this review because of lack of European data. However, evidence from the US suggests that the treatment cost alone can be substantial, estimated at between $837 and $3334 per patient (1999 USD). Assuming the same cost in Europe and that half of all 1.4 million persons with cannabis dependence in Europe would get this treatment would result in figures in the range of 0.5 to 2.5 billion (PPP 2010). In conclusion there is no doubt that the estimates presented in this report of the cost of disorders of the brain in Europe in 2010 are very conservative. They probably represent an underestimation although they are more realistic and complete than the data we published in Strengths and limitations of the methodological approach The estimates presented in this report are based on model extrapolations of previously published data on the prevalence and cost per person of each disorder. There are several advantages of this approach. First, it enables consideration of all of the available evidence even if different methods are used for different studies and only partial information is presented in each single study. Thereby, the combined knowledge and experience from the entire research community contributes to make the estimates as accurate as possible. Second, wherever data are not available, estimates can still be produced by imputations from the available evidence, for example from another country or group of similar persons. Not only does this enable estimates in countries and subgroups where no primary data are available, but it also enables aggregated estimates for all disorders of the brain in the whole of Europe. Third, adjustment for inflation, exchange rates and purchasing power parities allows for combining studies reporting estimates for different years, currencies and countries which further increases the evidence base supporting the final estimates. An alternative approach may be to collect primary data with a common protocol for all disorders of the brain and in all
44 countries of Europe. This would be a very interesting study, albeit extremely ambitious and costly if seriously undertaken. In order to arrive at comparable estimates for each disorder, a consistent methodology was specified for all disorders of the brain. Small differences were allowed (e.g. in the selection of input data from the identified studies and assumptions for the modeling) as specified in the disorder specific sections, to accommodate differences in the data availability and the care patterns for different disorders. At the same time being an important condition for relevant estimates in the context of this study, the common methodology employed for all disorders may explain differences in our estimates to other studies focusing on each disorder separately. It may very well be the case that a different methodological approach would be more appropriate for a study focusing on a single brain disorder. As estimates were not available for many countries, we imputed the prevalence and cost for these from countries with available data. The methods selected for imputation aimed to be specific enough to give accurate imputations taking known differences across countries into account, while also being straightforward enough to avoid debatable assumptions that may be contested depending on the perspective of the reader. For this reason we decided to consider the median estimates of both prevalence and costs and only make adjustments for the different price and income levels of in each country. Thereby we opted not to consider different regions of Europe which are complex to define and seemingly impossible to defend within the context of the European Union. Further, the median was preferred to the mean because it avoids the influence of outliers that might have skewed the results Input data The accuracy of model estimations is always dependent on the input data. The main inputs into our model were the estimated number of persons affected by the disorders, the costs per person, and country specific indices and demographics. Country specific indices and demographics are readily available from Eurostat and should be considered valid for all European countries without further commenting. By contrast, the prevalence and cost data are uncertain and may be discussed further. The prevalence estimates should be considered as being relatively robust overall. Most estimates are based on well designed population based surveys reporting estimates that have been scrutinized and confirmed in several studies and countries. However, evidence for all countries was not available for any of the disorders, which implies that assumptions have to be made about the prevalence in one country based on data from others. We assumed the European median prevalence for each disorder in all countries where no data were available. This is a valid approach as long as there are no important differences in prevalence across countries or regions in Europe. This is likely not the case for alcohol addiction which was also the rationale for making an exception for this diagnosis by considering regional prevalence estimates. Estimates of the cost per person may be considered less robust across studies and countries in comparison to the prevalence estimates. Most cost studies are based on clinical samples of persons and their cost may not be representative to the overall patient population. We adjusted for this whenever considered appropriate by multiplying the cost estimates by a factor reflecting the proportion of persons that could be assumed to incur the estimated cost. Moreover, it is difficult to get an accurate representation of the severity of persons in a clinical sample. It may for instance be easier to recruit less severe persons which are able to
45 respond to questionnaires themselves than the more severe persons who may need a caregiver to assist them. One way of addressing this issue is by estimating the cost by categories of severity and combine with similarly defined prevalence estimates by severity. This approach was considered for the present study but the available data are still too scarce in most disorders, though with some exceptions including dementia and multiple sclerosis. There is a lot of variation in the designs of the identified cost studies. Most are bottom up which was preferred in this review because of the reasons given in the Methods section. However, in some disorders (e.g. substance use disorders) we had to rely on top down studies in absence of other data. In such studies, the relevant estimate is the total cost reported for a country which means that the cost per person is given by dividing the reported cost by our estimate of the number of persons, rather than the number of persons potentially reported in the cost study. Otherwise, the total cost may get to something else in the end. Another common discrepancy of the cost studies is related to which costs were actually included in their estimates. We extracted separate estimates for direct healthcare, direct non-medical and indirect costs. Whenever possible we adjusted the estimates for types of costs that given our definitions should not be included in each of the three categories. For instance, informal care is commonly considered an indirect cost whereas in our study we consider it a direct nonmedical cost. Still, in many studies the data may not be detailed enough for either categorizing into the three types or in some cases even determine exactly what types of costs were included at all. The estimates may therefore vary because different resources are included in different studies Co-morbidities As commented in the Results section on aggregated costs, there is considerable overlap between the disorders of the brain. This problem is even larger in this revision compared to what was reported in the EBC2005 study, simply because we have now considered seven more groups of disorders. The magnitude of this problem should be considered lower for disorders that are very costly but affect small numbers (e.g. MS and brain tumor), while the consequences of double counting may be larger for disorders that affect larger numbers. The aggregated number of persons should not be interpreted as the actual number of Europeans with a brain disorder, because some have several disorders adding to the aggregated figures. Similarly, there is risk of double counting in costs if the cost of the same person with two disorders is counted twice. To the extent possible, we included only the excess cost of each particular disorder but because of variation in the design of the cost studies and limitation in the available data,we have probably not corrected for all overlap across disorders Policy implications for research, patient care, education and drug development Research with a European focus For many years, epidemiological studies done in one or a few places in the United States have been taken to represent the whole of the United States of America. Cost studies have been generalized in a similar way. These studies have sometimes taken into account different demographics and socioeconomic characteristics of the different states but most often not. In Europe there has not been a tradition to generalize results obtained in individual national states to all of Europe. To a large extent, the necessary methodology for imputing values for all of Europe has not been in place. Our first study of the Cost of Disorders of the Brain in Europe published in 2005 was in this respect pioneering. Just to estimate the cost of a single disorder in all of Europe including values for every single country had not been done before.
46 Nevertheless, this was achieved for 12 major brain disorders for which data were available at the time. Considerable methodological development was thus part of our first study. More than a hundred experts in epidemiology collaborated with a large group of health economists in order to jointly develop the best possible estimates of prevalence and cost of disorders of the brain. Despite all difficulties this collaboration worked extremely well and the first cost study was produced in only two years. Due to its pioneering nature and the relative lack of data, the first cost study was of course far from perfect. To overcome the difficulties, it proved extremely important to have a close collaboration between epidemiologists and health economists. In the present study we have used exactly the same methodology, again employing almost a hundred epidemiologists throughout Europe and many expert health economists. Again the work has been done in less than two years and we can now present much improved estimates, as discussed elsewhere in the present report Policy implications for European research Data from the WHO have suggested that brain disorders account for 35% of the burden of all diseases in Europe (Olesen and Leonardi, 2003). Subsequently a more detailed study has shown that neurological disorders account for approximately 12% of the burden of all diseases in Europe (Neurological disorders, public health challenges, WHO, 2006). These figures are quite plausible against the background of our present results, demonstrating that disorders of the brain account for 25% of the direct healthcare costs in Europe and that indirect costs add considerably to this figure. The huge cost of disorders of the brain indicates of course that brain research should receive a considerable proportion of healthcare research funding, particularly in light of severe deficiencies in available effective treatments and poor service provision as described earlier (Wittchen et al. 2011). In a previous paper entitled Resource allocation to brain research in Europe (Sobocki et al., 2006) we argued that brain research is not funded sufficiently in relation to the huge cost burden associated with disorders of the brain. Now, with the much improved and consolidated cost estimate one might argue even more forcefully toward increased research spending, in order to cope with immense problem constituted by disorders of the brain. It was calculated that the return on investment in brain research far exceeded the return from any other branches of research when looking at the total societal prospective. That statement is also reinforced by the present much higher expenses. Undoubtedly, there have been significant improvements in the funding of brain research at the European Commission level. Unfortunately, this improvement started from a very low level of 85 million spent in the fifth framework program (FP5). In FP6 this figure improved to 260 million and during the first three calls of FP7, 381 million has been spent (European Commission, 2009; Framework Programme brain-research-eu-funding _en.pdf). Still, these figures constitute only 0.05% of the estimated cost of brain disorders in Europe in However, in the FP Health Programme, a total of 684 million will be allocated, none of which will be specifically allocated to disorders of the brain. It therefore remains to be seen if the percentage allocation of funds to brain research is going to change at all in FP7 despite the specific mention of brain research in the program text. Europe 2020 has a Flagship initiative the Innovative Union to drive this agenda forward. Our data strongly support a focus on brain research in this program and throughout the EU. Presently, plans are under discussion for FP8. With the new cost data at hand, it is clear that brain research must maintain its current visibility and in fact should receive even more attention than currently. Likewise, our data suggest that national research programs throughout Europe should give considerably increased attention to brain research.
47 Policy implications for European health care In the health care policy of the European Commission, brain disorders have already received some attention. It has primarily been manifest in the European Pact for Mental health, a very important initiative. Unfortunately, the European Commission has adopted WHO terminology in which mental health partly includes neurological disorders. Further, it should be highlighted that the term mental health has little to do with mental disorders, because it encompasses a much wider non-clinical perspective addressing well-being and social security issues. What is clearly required now is a coordinated policy covering all disorders of the brain, mental and neurological disorders alike, because together they constitute by far the biggest health problem in the European Union. Furthermore, we have to emphasize that the burden of disorders of the brain will likely increase further, simply due to the continuing trend of increasing life expectancy in Europe. Because of the aging European population, degenerative disorders are particularly destined to become more common, such as dementia, Parkinson's disease and stroke, but anxiety and mood disorders are also very prevalent at high age. An increased life expectancy also means for almost all disorders more years spent with the disorder and the associated disability. Thus, disorders of the brain are the core challenge of the future and we must start to address this issue as early and forcefully as possible. While increased basic research into the causes of disorders of the brain and their improved treatment is of paramount importance, increased focus on the prevention of disorders of the brain is a particularly important high priority goal, ultimately bound to improved etiological knowledge about diseases. Options to address the problem are evident, ranging from increased resources for treatment to developing best practice models in the organization of health care systems for the different brain disorders. A positive example is the organization of acute stroke care in specialized units. In several European countries this has been done at zero extra cost to the health care system because of shorter admissions. The gains have been to reduce long term disability, nursing home placements and death. Centralization of dementia care in specialized units where a neurologists, psychiatrists and geriatricians collaborate is also increasingly recognized to be effective and health care programs for the major psychiatric disorders likewise. It is however, a huge task to gradually get best practice implemented in all European countries Policy implication for European health educations In most European countries the curricula at medical schools and other health care educational institutions reflect clinical concepts about disorders of the brain that are clearly outdated and not in agreement with our current state of knowledge. In the past, most disorders of the brain were ill-defined, with few scientifically sound and empirically based treatments available. Today, the situation is radically different. No field of medicine and the health sciences has experienced greater advances than psychiatry, neurology and the allied disciplines of clinical psychology and psychotherapy. Previously untreatable patients with diagnoses that bound them to long-term or even lifelong institutionalization in the past, can now live with no or minimal disability in the community and participate fully in society. Drug and psychological treatments have during the past two decades become available that enabled the closing of over half of all costly psychiatric hospital beds, and mental disorders are now managed through outpatient strategies. Treatments are also available for all the major neurological disorders, allowing to improve functioning, delay progression or even fully rehabilitate patients improving quality of life greatly. Our EBC size and burden (Wittchen et al. 2011) and the present EBC cost report 2011 highlight that disorders of the brain are the core health challenge of the future. Radical revisions to school curricula in medicine and other health professions are needed to properly
48 inform all health professions about the fact that over 1/3 of the total EU population is or has been affected by disorders of the brain, and many more will additionally suffer from such disorders in their future. Such messages, along with improved science-based curricula about the brain and its different types of disorders, must be communicated widely and translated to immediate action. In most medical schools the clinical part of the study lasts at least two years. Out of these 24 months it is unusual to spend more than two months or 8% of the time in neurological and psychiatric departments. Similarly, neurophysiology, neuroanatomy, neuropharmacology and neurochemistry constitute only a small fraction of the preclinical curriculum. It is, however, no longer unreasonable to demand that 1/3 of the curriculum at these institutions should focus on the brain and its disorders. This pertains to basic disciplines such as physiology, biochemistry and anatomy as well as to the clinical disciplines. The situation is probably worse, not better, in other health profession curricula. During the Year of the Brain 1997 in Denmark, we discovered that the theoretical part of the education of nurses contained next to nothing about brain anatomy and physiology. Clinical education within neurology and psychiatry was optional. In order to improve the situation and bring it in accordance with the huge cost of brain disorders, European wide studies of brain related curricula of all kinds of health care educations should be performed Policy implications for the European pharmaceutical industry Brain disorders are usually chronic, and the most burdensome brain disorders are caused by disturbances in brain chemistry, not brain anatomy. This means that the disorders, in theory, should be completely reversible if sufficiently specific and effective drugs or respectively specific behavioral treatments were available. At the time of the first cost study, the socalled central nervous system (CNS) indications, another word for brain disorder indications, was still a favored topic in the pharmaceutical industry. This has changed for the worse, despite the growing societal and cost burden of disorders of the brain demonstrated here. There are two important and potentially disastrous reasons for this. One is that the pharmaceutical industry in general is moving out of Europe, primarily to the United States but also to China, India and other places. The other reason is that industry in general has been disappointed by its investments in medicines for brain disorders. Both these unfortunate developments also have political reasons and can be potentially remediated by political means. The industry ismoving out of Europe for administrative and economic reasons such as the lack of a single European patent, time consuming and expensive recognition procedures in the different countries and time consuming and expensive reimbursement negotiations in each single country in Europe. In comparison, the United States has only one recognition, that of the FDA. More serious is the movement away from research in brain disorders. To a large extent this is also politically determined because of stricter regulations for drugs with an effect on the central nervous system. Political action could for example include simplification of procedures, reducing bureaucracy or perhaps prolonging patents for drugs for brain diseases. As more companies move away from research into brain disorders this will also reduce funding through the Innovative Medicines Initiative (IMI), a public private partnership between the European Commission and the European Federation of Pharmaceutical Industries and Associations (EFPIA) as brain disorders are less likely to be chosen. The increasing burden and the associated increasing cost of disorders of the brain is a ticking bomb under the European economy and the EU society as a whole. There are possibilities to improve prevention, but a real change in the outlook is only likely to come from the development of new, more specific and effective drugs and non-drug treatments as well as improved treatment resources. For example, currently the expense for drugs acting on brain disorders is only 16% of the total drug consumption in Europe and thus far below the 35% of
49 cost incurred by these disorders. Furthermore, the cost of drugs for brain disorders constitutes only a very small fraction of the total cost of these disorders. 6. Conclusion and recommendation for political action In the 27 EU countries plus Norway, Iceland and Switzerland with a population of 514 million people, we have estimated that cost of disorders of the brain is 798 billion per year. This cost burden corresponds to 25% of the direct health care expenses and the non-medical direct cost as well as the indirect costs, such as lost work time, are higher than for most other diseases due to the persisting nature of many brain diseases. In total, probably one third of all health related expenses are caused by brain disorders. This huge cost burden corresponds well to WHO estimates that the burden in non-economic terms of brain disorders is approximately 1/3 of the burden of all diseases in high income countries. On the basis of these figures which are as high as or higher than for heart diseases, cancer and diabetes combined, we have the following recommendations for political action. 1. The European Commission and national governments should make disorders of the brain a high priority topic, and should maintain and further strengthen existing program initiatives in this field. 2. The current focus on mental health of the European Commission should be expanded to include all brain disorders. 3. Core emphasis should be laid on research into the causes and developmental pathways of disorders of the brain and their relationship in order to develop improved drug and psychological treatments as well as to allow for empirically based prevention. 4. The European Commission should consider the state of curricula and training in all health professions regarding coverage of disorders of the brain. Current curricula and training appear to be inappropriate and outdated, neglecting in some places entirely the size and burden of disorders of the brain. 5. The European Commission should take all necessary steps to encourage industry and investors to engage in brain research in order to relieve the core health challenge of the future. 6. The momentum and expertise from the present effort on the size, burden and cost or disorders of the brain should be maintained by funding and supporting all initiatives aiming to provide further improved knowledge of the prevalence and cost of brain disorders in Europe. 7. National policies in each state of Europe should adopt and respectively modify these agenda points according to the specific situation in their country in order to promote the health of their citizens and to contain the immense and expanding cost of disorders of the brain.
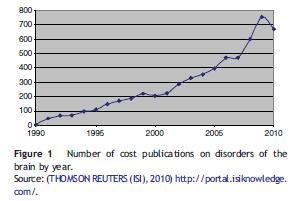
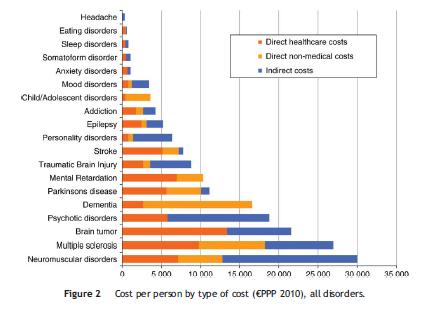

50


51


52

53

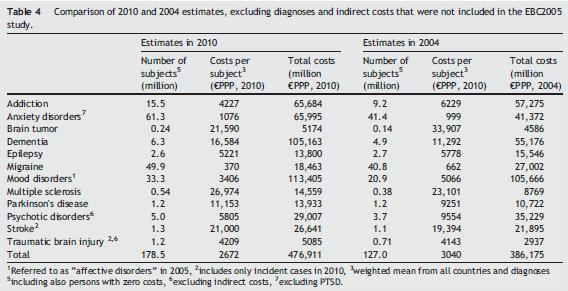
54


55


56

57


58


59


60


61


62


63

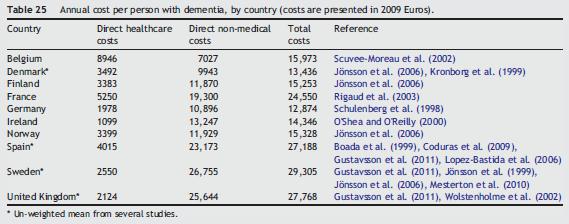
64


65


66


67


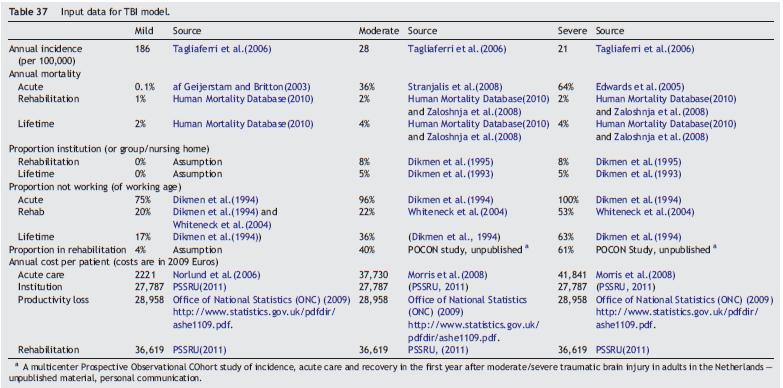
68


69


70

71 Role of the funding source Unrestricted funding. Contributors See below under acknowledgments. Conflict of interest None of the authors have conflicts of interest associated with the work reported in this paper. Acknowledgments We gratefully acknowledge the unrestricted financial support from the European College of Neuropsychopharmacology, the European Federation of Neurological Societies and from H. Lundbeck A/S. We acknowledge the enormous and unpaid efforts of the epidemiological and economic experts who have worked voluntarily on this study: Stefanie Drabsch (University of Florence, Italy), Manfred Döpfner (University of Cologne, Germany), Simon Forstmeier (University of Zürich, Switzerland), Andrea Gabilondo (Generalitat de Catalunya, Barcelona, Spain), Andrew Gloster (Technische Universität Dresden, Germany), David Hilton-Jones (University of Oxford, United Kinfdom). Michael Höfler (Technische Universität Dresden, Germany), Corinna Jacobi (Technische Universität Dresden, Germany), Danica Klempova (EMCDDA, Lisbon, Portugal), Rafael Martinez Leal (University of Granada, Spain), Gunther Meinlschmidt (University of Basel, Switzerland), Jayadeep Patra (Centre for Addiction and Mental Health, Toronto, Canada), Rafael Martínez-Leal, Jose García-Ibáñez, and Francisco Aguilera (Fundació Villablanca Reus), Peter van den Bergh (The Université catholique de Louvain, Belgium), Julian Vicente (EMCDDA, Lisbon, Portugal), Frank Verhulst (Erasmus Medical Center Sophia Children's Hospital, Rotterdam, Netherlands).
Cost of Disorders of the Brain in Europe Gustavsson et al. Cost of disorders of the brain in Europe Eur. Neuropsych. (2011) 21,
 21,") Cost of Disorders of the Brain in Europe 2010 Gustavsson et al. Cost of disorders of the brain in Europe 2010. Eur. Neuropsych. (2011) 21, 718-779 Steering Committee Prof Jes Olesen 1 Prof Bengt Jönsson
Cost of Disorders of the Brain in Europe 2010 Gustavsson et al. Cost of disorders of the brain in Europe 2010. Eur. Neuropsych. (2011) 21, 718-779 Steering Committee Prof Jes Olesen 1 Prof Bengt Jönsson
European Brain Council: Structure and activities. Jes Olesen President European Brain Council (EBC)
") European Brain Council: Structure and activities Jes Olesen President European Brain Council (EBC) European Brain Council (EBC) membership EFNS European Federation of Neurological Societies FENS Federation
European Brain Council: Structure and activities Jes Olesen President European Brain Council (EBC) European Brain Council (EBC) membership EFNS European Federation of Neurological Societies FENS Federation
Cost of Brain Disorders in Italy A Review
 Maura Pugliatti, 1,2 Paola Cossu, 1 Patrik Sobocki 3 and Ettore Beghi 4 1. Department of Neuroscience, University of Sassari; 2. Department of Public Health and Primary Health Care, University of Bergen;
The health economic landscape of cancer in Europe
 1 Approval number The health economic landscape of cancer in Europe Bengt Jönsson, Professor Emeritus of Health Economics Stockholm School of Economics 2 Disclaimer This presentation was developed by Professor
Joint Programming in Neurodegenerative Disease Research (JPND)
") Joint Programming in Neurodegenerative Disease Research (JPND) Building Alliances and Collaborations Prof. Philippe Amouyel, MD, PhD JPND Chair France Disclosure CEO of Fondation Plan Alzheimer Conference
Joint Programming in Neurodegenerative Disease Research (JPND) Building Alliances and Collaborations Prof. Philippe Amouyel, MD, PhD JPND Chair France Disclosure CEO of Fondation Plan Alzheimer Conference
Key Highlights continued
 Financing the Response to AIDS in Low- and Middle- Income Countries: International Assistance from the G8, European Commission and Other Donor Governments in 2009 Authors: Jennifer Kates (Kaiser Family
Authors: Jennifer Kates (Kaiser Family Foundation), José-Antonio Izazola (UNAIDS), Eric Lief (CSIS).
, José-Antonio Izazola (UNAIDS), Eric Lief (CSIS).") Financing the response to AIDS in low- and middleincome countries: International assistance from the G8, European Commission and other donor Governments, 2006 Authors: Jennifer Kates (Kaiser Family Foundation),
Financing the response to AIDS in low- and middleincome countries: International assistance from the G8, European Commission and other donor Governments, 2006 Authors: Jennifer Kates (Kaiser Family Foundation),
The European Brain Council
 The European Brain Council Dr C. Ian Ragan, Executive Director Dr Mary G. Baker MBE, Vice President Committee on Industry, Research and Energy Public Hearing on Mental Health Research: Scientific Progress
Authors: Jennifer Kates (Kaiser Family Foundation), Eric Lief (The Stimson Center), Carlos Avila (UNAIDS).
, Eric Lief (The Stimson Center), Carlos Avila (UNAIDS).") Financing the response to AIDS in low- and middleincome countries: International assistance from the G8, European Commission and other donor Governments in 2008 Authors: Jennifer Kates (Kaiser Family Foundation),
Financing the response to AIDS in low- and middleincome countries: International assistance from the G8, European Commission and other donor Governments in 2008 Authors: Jennifer Kates (Kaiser Family Foundation),
Hana Ross, PhD American Cancer Society and the International Tobacco Evidence Network (ITEN)
") The Costs of Smoking Hana Ross, PhD American Cancer Society and the International Tobacco Evidence Network (ITEN) Why Do We Study the Cost of Smoking? To assess the economic impact of smoking behavior
The Costs of Smoking Hana Ross, PhD American Cancer Society and the International Tobacco Evidence Network (ITEN) Why Do We Study the Cost of Smoking? To assess the economic impact of smoking behavior
The social costs of anxiety disorders
 The social costs of anxiety disorders Experience and Evidence in Psychiatry: Symposium on Somatics and Anxiety Disorders,, Madrid, 19th April 2006 Frank Jacobi & Hans-Ulrich Wittchen Technische Universität
Socio-economic Consequences of Pain-Intensive Diseases in Denmark
 Summary of publication from the Danish Institute for Health Services Research: Socio-economic Consequences of Pain-Intensive Diseases in Denmark Jan Christensen Lone Bilde Anders Gustavsson The Danish
Case study examining the impact of German reunification on life expectancy
 Supplementary Materials 2 Case study examining the impact of German reunification on life expectancy Table A1 summarises our case study. This is a simplified analysis for illustration only and does not
BRAIN MISSION Understand - fix - enhance
 THE EUROPEAN BRAIN COUNCIL PRESENTS BRAIN MISSION Understand - fix - enhance THE space race OF the 21st century A major societal challenge The brain is the most complex human organ. It provides and controls
MENTAL HEALTH DISORDERS: THE ECONOMIC CASE FOR ACTION Mark Pearson Head of Department, OECD Health Division
 MENTAL HEALTH DISORDERS: THE ECONOMIC CASE FOR ACTION Mark Pearson Head of Department, OECD Health Division The costs of poor mental health Estimates of Direct and Indirect Costs of Mental Illness 1 All
Financing the Response to AIDS in Low- and Middle- Income Countries: International Assistance from Donor Governments in 2010
 Financing the Response to AIDS in Low- and Middle- Income Countries: International Assistance from Donor Governments in 2010 Authors: Jennifer Kates (Kaiser Family Foundation), Adam Wexler (Kaiser Family
The Economic Burden of Hypercholesterolaemia
 The Economic Burden of Hypercholesterolaemia November 2018 TABLE OF CONTENTS Acronyms 3 Executive Summary 4 Introduction 5 Approach 5 Structure of the report 5 Economic burden of hypercholesterolaemia
Definitions of substandard and falsified medical products
 EXECUTIVE SUMMARY EXECUTIVE SUMMARY Introduction In 2015, the World Health Organization (WHO) Member State mechanism commissioned a study on the public health and socioeconomic impact of substandard and
Remote Assessment of Disease and Relapse Central Nervous System-RADAR-CNS
 VOLUME 5 NO 4, 2017 Remote Assessment of Disease and Relapse Central Nervous System-RADAR-CNS J.M. Garzón-Rey and J. Aguilo Department of Microelectronics and Electronic Systems, Universidad Autónoma de
Financing the Response to AIDS in Low- and Middle- Income Countries: International Assistance from Donor Governments in 2011
 Financing the Response to AIDS in Low- and Middle- Income Countries: International Assistance from Donor Governments in 2011 Authors: Jennifer Kates (Kaiser Family Foundation), Adam Wexler (Kaiser Family
SUBJECTIVE WELL-BEING TRENDS 2015 THE HAPPINESS RESEARCH INSTITUTE
 SUBJECTIVE WELL-BEING TRENDS 2015 TREND 1 HAPPINESS AS A POLITICAL GOAL Improving the quality of our lives should be the ultimate target of public policies. Angel Gurría, Secretary-General, OECD TREND
VARIATIONS IN PRICES AND REIMBURSEMENT OF MEDICINES IN THE EUROPEAN UNION
 VARIATIONS IN PRICES AND REIMBURSEMENT OF MEDICINES IN THE EUROPEAN UNION A snapshot of data on amoxicillin, budesonide, losartan and salbutamol in eight European Union Member States Report INTRODUCTION
EXECUTIVE SUMMARY 9. Executive Summary
 EXECUTIVE SUMMARY 9 Executive Summary Education affects people s lives in ways that go far beyond what can be measured by labour market earnings and economic growth. Important as they are, these social
Robin Feldman, MBA & Joy Esterlitz, MS NINDS CDE Team The Emmes Corporation Rockville, MD USA. Thursday, September 14, 2017
 The National Institute of Neurological Disorders and Stroke (NINDS) and American Academy of Cerebral Palsy and Developmental Medicine (AACPDM) Cerebral Palsy Common Data Elements (CDE) Recommendations
Note on the harmonisation of SILC and EHIS questions on health
 EUROPEAN COMMISSION EUROSTAT Directorate F: Social statistics and Information Society Unit F-5: Health and food safety statistics 23/01/2008 Note on the harmonisation of SILC and EHIS questions on health
Rutgers University Course Syllabus Abnormal Psychology 01: 830: 340H7 Summer 3 rd Session 2014
 Rutgers University Course Syllabus Abnormal Psychology 01: 830: 340H7 Summer 3 rd Session 2014 Date & Time: Monday and Wednesday 6:00PM- 9:40PM Location: LSB rm B115 Livingston Campus Instructor: Stevie
Study population The study population comprised adult patients fulfilling the following inclusion criteria:
 Cost-utility analysis of intravenous immunoglobulin and prednisolone for chronic inflammatory demyelinating polyradiculoneuropathy McCrone P, Chisholm D, Knapp M, Hughes R, Comi G, Dalakas M C, Illa I,
Health and. Consumers
 www.openprogram.eu EU action on obesity Obesity Prevention through European Network Closing event Amsterdam 25 November 2016 Attila Balogh Health determinants and inequalities European Commission Directorate-General
UK bowel cancer care outcomes: A comparison with Europe
 UK bowel cancer care outcomes: A comparison with Europe What is bowel cancer? Bowel cancer, which is also known as colorectal or colon cancer, is a cancer that affects either the colon or the rectum. The
Differences In Disease Prevalence As A Source Of The U.S.-European Health Care Spending Gap
 Differences In Disease Prevalence As A Source Of The U.S.-European Health Care Spending Gap Americans are diagnosed with and treated for several chronic illnesses more often than their European counterparts
The burden caused by alcohol
 The burden caused by alcohol Presentation at REDUCING THE HARM CAUSED BY ALCOHOL: A COORDINATED EUROPEAN RESPONSE Tuesday, November 13 Jürgen Rehm Centre for Addiction and Mental Health, Toronto, Canada
ICCAM platform. Introduction. David Nutt November 2011
 ICCAM platform Introduction David Nutt November 2011 The ICCAM Platform New Drugs to Treat Addiction: Can a Knowledge of Brain Mechanisms Help? An MRC addiction cluster Imperial College London: David Nutt
Burden and cost of alcohol, tobacco and illegal drugs globally and in Europe
 Burden and cost of alcohol, tobacco and illegal drugs globally and in Europe Jürgen Rehm 1-4 Kevin D. Shield 1,2,3 1) Centre for Addiction and Mental Health, Toronto, Canada 2) University of Toronto, Canada
Underage drinking in Europe
 Underage drinking in Europe There are two major studies on underage drinking which are published every 4 years: HBSC (Health Behaviour in School-aged Children) and ESPAD (The European School survey Project
Type 1 Diabetes Australian Research Impact Analysis
 Type 1 Diabetes Australian Research Impact Analysis Executive Overview Summary Type 1 diabetes research in Australia Australia is making a significant contribution to the quantity and quality of the global
The prevalence, economic cost and research funding of dementia compared with other major diseases. Executive summary
 DEMENTIA 2010 The prevalence, economic cost and research funding of dementia compared with other major diseases Executive summary A report produced by the Health Economics Research Centre, University of
1. Family aggregation and long-term outcome of psychopathology in children and adolescents in the Danish Three Generation Study (3GS)
") Aalborg CAP research programme 2016 1. Family aggregation and long-term outcome of psychopathology in children and adolescents in the Danish Three Generation Study (3GS) Objectives: Study of the aggregation
Aalborg CAP research programme 2016 1. Family aggregation and long-term outcome of psychopathology in children and adolescents in the Danish Three Generation Study (3GS) Objectives: Study of the aggregation
TOBACCO CONTROL ECONOMICS TOBACCO FREE INITIATIVE PREVENTION OF NONCOMMUNICABLE DISEASES
 Page 1 1. Smoking prevalence The rate of smoking tends to increase with development reflecting higher prevalence of cigarette use among women as incomes increase. The rate of smoking is relatively high
Manuel Cardoso RARHA Executive Coordinator Public Health MD Senior Advisor Deputy General-Director of SICAD - Portugal
 Manuel Cardoso RARHA Executive Coordinator Public Health MD Senior Advisor Deputy General-Director of SICAD - Portugal Public Health Public health is the science and art of preventing disease, prolonging
EFSA s Concise European food consumption database. Davide Arcella Data Collection and Exposure Unit
 EFSA s Concise European food consumption database Davide Arcella Data Collection and Exposure Unit 1 The EFSA raison d être Risk assessment authority created in 2002 as part of a comprehensive program
Rheumatoid Arthritis Disease Burden and Access to Treatment
 Berlin, April 2012 Rheumatoid Arthritis Disease Burden and Access to Treatment Gisela Kobelt, PhD Visiting Professor, Lund University (Sweden) President, European Health Economics (France) Disclaimers
Counting down to zero
 12%... 10%... 8%... Counting down to zero Towards a future with underfunded health research? We, as representatives of the undersigned organisations, welcome the current European Commission s proposal
BENCH TO BEDSIDE: CLINICIAN PERSPECTIVE ON NEED FOR PARENTERAL PSYCHOTROPIC MEDICATIONS
 BENCH TO BEDSIDE: CLINICIAN PERSPECTIVE ON NEED FOR PARENTERAL PSYCHOTROPIC MEDICATIONS *Siddharth Sarkar Department of Psychiatry, Sree Balaji Medical College and Hospital, Chromepet, Chennai, India -
Donor Government Funding for HIV in Low- and Middle-Income Countries in 2016
 REPORT Donor Government Funding for HIV in Low- and Middle-Income Countries in 2016 July 2017 Prepared by: Jen Kates & Adam Wexler Kaiser Family Foundation and Eric Lief Consultant and UNAIDS Donor government
Setting The setting was primary care. The economic study was carried out in Brazil, France, Germany and Italy.
 The cost-effectiveness of influenza vaccination for people aged 50 to 64 years: an international model Aballea S, Chancellor J, Martin M, Wutzler P, Carrat F, Gasparini R, Toniolo-Neto J, Drummond M, Weinstein
Food Safety Performance Monitor Methodology
 Food Safety Performance Monitor Methodology Introduction We collected data for the following four indicators: (i) outbreaks of food-borne disease, (ii) certifications of good practices within the food
Elena R Lebedeva 1, Jes Olesen 2, Vera V Osipova 3, Larisa I Volkova 1, Guzyal R Tabeeva 3 and Timothy J Steiner 4*
 Lebedeva et al. The Journal of Headache and Pain 2013, 14:101 METHODOLOGY Open Access The Yekaterinburg headache initiative: an interventional project, within the Global Campaign against Headache, to reduce
Drug Money: the illicit proceeds of opiates trafficked on the Balkan route. Executive summary
 Drug Money: the illicit proceeds of opiates trafficked on the Balkan route Executive summary 2015 Executive summary The cultivation, production and trafficking of illicit opiates accounted for almost
Identifying best practice in actions on tobacco smoking to reduce health inequalities
 Identifying best practice in actions on tobacco smoking to reduce health inequalities An Matrix Knowledge Report to the Consumers, Health and Food Executive Agency, funded by the Health Programme of the
European status report on alcohol and health Leadership, awareness and commitment
 European status report on alcohol and health 2014 Leadership, awareness and commitment Leadership, awareness and commitment Background Strong leadership from national and local governments is essential
DSM Comparison Chart DSM-5 (Revisions in bold)
") 317.0-318.2 DSM Comparison Chart DSM-IV-TR DSM-5 (Revisions in bold) Multi-axial system s Usually First Diagnosed in Infancy, Childhood and Adolescence Single line diagnosis with specifiers Neurodevelopmental
317.0-318.2 DSM Comparison Chart DSM-IV-TR DSM-5 (Revisions in bold) Multi-axial system s Usually First Diagnosed in Infancy, Childhood and Adolescence Single line diagnosis with specifiers Neurodevelopmental
Joint Programming Initiative on Neurodegenerative Diseases. Prof. Philippe Amouyel Chair, JPND Management Board
 Joint Programming Initiative on Neurodegenerative Diseases Prof. Philippe Amouyel Chair, JPND Management Board Cases / 100 Alzheimer s disease in Europe 40 Number of cases Societal costs ( ) 2010 6,000,000
Brain research supported by the European Union
 Brain research supported by the European Union Lara Passante, PhD Health Directorate Directorate-General for Research & European Commission FENS Featured Regional Meeting 11-14 Septembre 2013 Prague Neuroscience:
The cost of cancer treatment
 The cost of cancer treatment Lieven Annemans Ghent University Lieven.annemans@ugent.be January 2016 What s the problem? those prices are too high the budgets will explode these drugs offer survival benefit
Donor Government Funding for HIV in Low- and Middle-Income Countries in 2017
 July 2018 Donor Government Funding for HIV in Low- and Middle-Income Countries in 2017 Jen Kates & Adam Wexler Kaiser Family Foundation and Eric Lief Georgetown University, Center for Global Health Science
Moving towards 2020 priorities for Public Health for the years Health and Consumers
 Moving towards 2020 priorities for Public Health for the years 2013-20 Health in the MFF 2014-2020 Commission proposal for the Health for Growth Programme 2014-2020 http://ec.europa.eu/health/programme/policy/index_en.htm
Extract from Cancer survival in Europe by country and age: results of EUROCARE-5 a population-based study
 EUROCARE-5 on-line database Data and methods Extract from Cancer survival in Europe 1999 2007 by country and age: results of EUROCARE-5 a population-based study De Angelis R, Sant M, Coleman MP, Francisci
Measles and rubella monitoring January 2015
 Measles and rubella monitoring January 215 Reporting on January December 214 surveillance data and epidemic intelligence data to the end of January 215 Main developments Measles During the 12-month period
Rating Mental Impairment with AMA Guides 6 th edition:
 Rating Mental Impairment with AMA Guides 6 th edition: Practical Considerations and Strategies CSME/CAPDA C-CAT Course, March 24, 2018 William H. Gnam, PhD, MD, FRCPC (william.gnam@gmail.com) Consultant
Project Meeting Prague
 Project Meeting Prague IO1 Assessment 9.11.217 CHRISTINA PADBERG ON BEHALF OF FRANKFURT UAS Current Status Assessment matrix was fully evaluated Experts have been interviewed, Interviews were fully evaluated
EHFG 2016 Sustainable and equitable cancer care: tomorrow s reality or science-fiction?
 1 Approval number EHFG 2016 Sustainable and equitable cancer care: tomorrow s reality or science-fiction? 28 th September 2016 The Oncologist s perspective What can and should be changed in order to optimise
Renewing priority for dementia: Where do we stand?
 Policy brief Renewing priority for dementia: Where do we stand? Renewing priority for dementia: Where do we stand? Contents Overview 03 Putting dementia higher on the agenda 04 Diagnosing and identifying
CNAPA Meeting Luxembourg September 2016
 CNAPA Meeting Luxembourg September 2016 Manuel Cardoso RARHA Executive Coordinator Public Health MD Senior Advisor Deputy General-Director of SICAD - Portugal RARHA Events Policy Dialogue and Final Conference
Perspectives from regions: successes and challenges in promoting seasonal influenza vaccine usage in the EU
 Perspectives from regions: successes and challenges in promoting seasonal influenza vaccine usage in the EU N. Safrany European Commission Pr. A. Nicoll ECDC 2 nd WHO GAP mtg 12-14 July 2011 Background
OECD S HEALTH AT A GLANCE 2015 WHAT INSIGHTS FOR THE UK? Mark Pearson, Deputy Director Directorate for Employment, Labour and Social Affairs
 OECD S HEALTH AT A GLANCE 2015 WHAT INSIGHTS FOR THE UK? Mark Pearson, Deputy Director Directorate for Employment, Labour and Social Affairs Health at a Glance 2015 How does the UK perform? A leader in
NBER WORKING PAPER SERIES ALCOHOL CONSUMPTION AND TAX DIFFERENTIALS BETWEEN BEER, WINE AND SPIRITS. Working Paper No. 3200
 NBER WORKING PAPER SERIES ALCOHOL CONSUMPTION AND TAX DIFFERENTIALS BETWEEN BEER, WINE AND SPIRITS Henry Saffer Working Paper No. 3200 NATIONAL BUREAU OF ECONOMIC RESEARCH 1050 Massachusetts Avenue Cambridge,
BACKGROUND + GENERAL COMMENTS
 Response on behalf of Sobi (Swedish Orphan Biovitrum AB) to the European Commission s Public Consultation on a Commission Notice on the Application of Articles 3, 5 and 7 of Regulation (EC) No. 141/2000
Combination therapy compared to monotherapy for moderate to severe Alzheimer's Disease. Summary
 Combination therapy compared to monotherapy for moderate to severe Alzheimer's Disease Summary Mai 17 th 2017 Background Alzheimer s disease is a serious neurocognitive disorder which is characterized
Changes to the Organization and Diagnostic Coverage of the SCID-5-RV
 Changes to the Organization and Diagnostic Coverage of the SCID-5-RV Core vs. Enhanced SCID configuration A number of new disorders have been added to the SCID-5-RV. To try to reduce the length and complexity
Real Life, Real PD Survey
 Real Life, Real PD Survey Final Pan-European Survey Results Survey Objectives The survey was carried out to provide insights into the realities of living with PD and to highlight some of the symptoms of
Cancer Control Joint Action, Improving Outcomes for Cancer Patients and the European Cancer Patient s Bill of Rights
 Cancer Control Joint Action, Improving Outcomes for Cancer Patients and the European Cancer Patient s Bill of Rights Second CANCON Stakeholder Forum 12 May 2015 Belgian Ministry of Health, Brussels EQUITY
Does Europe have a drinking problem? The Amphora project perspective
 Does Europe have a drinking problem? The Amphora project perspective Antoni Gual, MD, PhD. Firenze, December 6 th 2013 Alcohol Measures for Public Health Research Alliance 2009 2012 Who are the AMPHORA
Feedback from the Member States questionnaire
 Annex 6 Feedback from the Member States questionnaire Reinhilde A.R. Schoonjans Special meeting of the EFSA Advisory Forum on GMO risk assessment in Europe 13 November 2007, Brussels Topics 1. Highlights
Lumbosacral plexus lesion Lumbosacral plexus disorders G54.1 Neuralgic amyotrophy Neuralgic amyotrophy G
 ICD-9-CM and ICD-10-CM NEUROMUSCULAR DIAGNOSIS CODES Focal Neuropathy ICD-9-CM ICD-10-CM Mononeuropathy G56.00 Carpal tunnel syndrome 354.00 Other median nerve lesion 354.10 Lesion of ulnar nerve 354.20
European Collaboration on Dementia. Luxembourg, 13 December 2006
 European Collaboration on Dementia Luxembourg, 13 December 2006 2005 Call for projects Special attention has also to be given to information and definition of indicators on neurodegenerative, neurodevelopment,
Financing the Response to HIV/AIDS in Low and Middle Income Countries: Funding for HIV/AIDS from the G7 and the European Commission
 Financing the Response to HIV/AIDS in Low and Middle Income Countries: Funding for HIV/AIDS from the G7 and the European Commission Presented at: Post G8 Briefing: Future Financing To Address The Global
THE VALUE OF TREATMENT FOR BRAIN DISORDERS A NEW VISION IN PROGRESS...
 V T THE VALUE OF TREATMENT FOR BRAIN DISORDERS A NEW VISION IN PROGRESS... BRIEF DESCRIPTION The European Brain Council (EBC) is carrying out a new research project for 2015-2017 on The value of treatment
Index. Phys Med Rehabil Clin N Am 14 (2003) Note: Page numbers of article titles are in boldface type.
 Note: Page numbers of article titles are in boldface type.") Phys Med Rehabil Clin N Am 14 (2003) 445 453 Index Note: Page numbers of article titles are in boldface type. A Acid maltase deficiencies, electrodiagnosis of, 420, 422 Acquired peripheral neuropathy,
Phys Med Rehabil Clin N Am 14 (2003) 445 453 Index Note: Page numbers of article titles are in boldface type. A Acid maltase deficiencies, electrodiagnosis of, 420, 422 Acquired peripheral neuropathy,
RATING MENTAL WHOLE PERSON IMPAIRMENT UNDER THE NEW SABS: New Methods, New Challenges. CSME/CAPDA Conference, April 1, 2017
 RATING MENTAL WHOLE PERSON IMPAIRMENT UNDER THE NEW SABS: New Methods, New Challenges CSME/CAPDA Conference, April 1, 2017 William H. Gnam, PhD, MD, FRCPC (william.gnam@gmail.com) Consultant Psychiatrist
Tobacco Health Cost in Egypt
 1.Introduction 1.1 Overview Interest in the health cost of smoking originates from the desire to identify the economic burden inflicted by smoking on a society. This burden consists of medical costs plus
Yersiniosis SURVEILLANCE REPORT. Annual Epidemiological Report for Key facts. Methods. Epidemiology
 SURVEILLANCE REPORT Annual Epidemiological Report for 2015 Yersiniosis Key facts In 2015, 26 countries reported 7 279 confirmed yersiniosis cases in the EU/EEA. The overall notification rate was 2.0 cases
State of provision of Hearing Aids in Europe
 Creating a barrier-free Europe for all hard of hearing citizens State of provision of Hearing Aids in Europe 2018 Report 1 Executive Summary Dear Reader, We are pleased to share the report examining affordability
European Status report on Alcohol and Health
 European Status report on Alcohol and Health Dr Lars Moller Regional Advisor a.i. WHO Regional Office for Europe Main killers in the WHO European Region Source: Preventing chronic diseases. A vital investment.
Brigitte Khoury, Ph.D. Director, Arab Regional Center for Research, Training and Policy Making in Mental Health Dept. of Psychiatry, American
 Brigitte Khoury, Ph.D. Director, Arab Regional Center for Research, Training and Policy Making in Mental Health Dept. of Psychiatry, American University of Beirut UNESCO s 2010 Science Report on Scientific
Overview of European Consumption Databases
 FEDERAL INSTITUTE FOR RISK ASSESSMENT Overview of European Consumption Databases Katrin Büsch Workshop Food Consumption Data and Dietary Exposure in the European Union, 15-16 May 2008, Berlin Introduction
Identifying Europe s information needs for effective drug policy Lisbon, EMCCDA
 Cannabis Market in Europe: A Growing Domestic Market (First Results) Jean-Michel Costes, Christian Ben Lakhdar OFDT 3 avenue du Stade de France 93218 Saint-Denis La Plaine cedex Tel : 01 41 62 77 16 Fax
A methodology for an EU cross-country comparison?
 A methodology for an EU cross-country comparison? Public expenditure for drug treatment in hospitals dr. & prof. dr. Freya Vander Laenen Freya.Vanderlaenen@UGent.be Background 2 COMPARATIVE DRUG POLICY
Current levels and recent trends in health inequalities in the EU: Updates from the EU Report
 Current levels and recent trends in health inequalities in the EU: Updates from the EU Report Anne Scott London Health Observatory Expert Working Group on Social Determinants and Health Inequalities Luxembourg,
Economic burden of non-malignant blood disorders across Europe: a population-based cost study
 Articles Economic burden of non-malignant blood disorders across Europe: a population-based cost study Ramon Luengo-Fernandez, Richeal Burns, Jose Leal Summary Background Blood disorders comprise a wide
Primary and secondary prevention of sudden cardiac death in emerging economies
 Primary and secondary prevention of sudden cardiac death in emerging economies Béla Merkely MD, PhD, DSc, FESC Heart Center Semmelweis University Budapest Common risk factors for sudden cardiac death Increasing
The Neurofeedback Approach to Attention Deficit Hyperactivity Disorder
 The Neurofeedback Approach to Attention Deficit Hyperactivity Disorder Steve Kapusta, Owner - BrainTraining of Hampton Roads, Inc. e - Originally from Pittsburgh, PA; resident of VA Beach for 4 years -
Are Behavioural Disorders a separate nosological category of disorders?
 249 Review Article Are Behavioural Disorders a separate nosological category of disorders? Shrirang Bakhle 1 1 Consulting Physician, Mumbai. E-mail ss.bakhle@gmail.com ABSTRACT The term Behavioural Disorders
NO PUBLIC HEALTH STRATEGY IN ASD IN EUROPE CALL FOR TENDERS. Antoni Monserrat Directorate of Public Health
 NO PUBLIC HEALTH STRATEGY IN ASD IN EUROPE CALL FOR TENDERS Antoni Monserrat Directorate of Public Health 1.Prevalence / Health and economic burden 2. Early detection, diagnosis early intervention and
Cancer Control Joint Action Policy Conference Cancer Survivorship: a policy dialogue. Survivorship and the French example
 Cancer Control Joint Action Policy Conference Cancer Survivorship: a policy dialogue Survivorship and the French example Committee of the Regions - Brussels - 13/05/2015 STRUCTURE OF THE PRESENTATION I.
EPAG UPDATE. Lenja Wiehe. European Patient Advocacy Groups Manager, EURORDIS
 EPAG UPDATE Lenja Wiehe European Patient Advocacy Groups Manager, EURORDIS Patient Centre & Empowerment European Reference Networks (ERNs) created on founding principles of patient-centred care, patient
منتخب بهترین مجلات در حوزه روانپزشکی تهیه و تنظیم:مهشید تسلیمی کارشناس ارزشیابی مرکز تحقیقات روان تنی
 1 American Journal of Psychiatry American Psychiatric publishing, United States 15357228 ISI 14.721 & Monthly Inc. 2 Alzheimer's and Dementia Elsevier Inc. United States 15525279 ISI 17.472 & 3 Neuropsychopharmacology
Extrapolation and potential impact of IPHS deployment in Europe
 SIMPHS2 Validation Workshop Brussels, 31 Jan 2012 1 SIMPHS2 Validation Workshop Extrapolation and potential impact of IPHS deployment in Europe JRC IPTS IS Unit Ioannis Maghiros, Fabienne Abadie, Maria
Webinar: How Do We Measure Mental Illness & Addictions at a Population Level?
 Webinar: How Do We Measure Mental Illness & Addictions at a Population Level? Jürgen Rehm Centre for Addiction and Mental Health, Toronto, Canada Dalla Lana School of Public Health and Department of Psychiatry,
The Official Journal of the Kettil Bruun Society for Social and Epidemiological Research on Alcohol
 IJADR International Journal of Alcohol and Drug Research The Official Journal of the Kettil Bruun Society for Social and Epidemiological Research on Alcohol doi: 10.7895/ijadr.v1i1.44 IJADR, 2012, 1(1),
Module 6: Substance Use
 Module 6: Substance Use Part 1: Overview of Substance Abuse I am Martha Romney and I am presenting on substance abuse. This module focuses on the healthy people 2020 objective to reduce substance abuse