William Michael Hardesty. Dissertation. Submitted to the Faculty of the. Graduate School of Vanderbilt University. in fulfillment of the requirements
|
|
|
- Gerard Lloyd
- 6 years ago
- Views:
Transcription
1 PROTEOMIC ANALYSIS AND CLASSIFICATION OF METASTATIC MELANOMA BY MALDI IMAGING MASS SPECTROMETRY by William Michael Hardesty Dissertation Submitted to the Faculty of the Graduate School of Vanderbilt University in fulfillment of the requirements for the degree of DOCTOR OF PHILOSOPHY in Chemistry December, 2010 Nashville, TN Approved: Richard M. Caprioli Mark C. Kelley Michael P. Stone Brian O. Bachmann i
2 This work is dedicated to my Mother, whose struggle and loss to cancer taught me perseverance, hope, and ultimately provided the financial means for my education and ability to aid in ongoing cancer research. ii
3 ACKNOWLEDGEMENTS First and foremost, I would like to thank Dr. Richard M. Caprioli, my research advisor who gave me an opportunity and challenged me throughout my time here. Thanks also to the members of my Ph.D. committee, Mark Kelley, Michael Stone, and Brian Bachmann, for their guidance and direction. In particular, Mark Kelley who supplied the melanoma samples and patient follow-up as well as specific direction in researching this disease. The cooperative atmosphere of the Mass Spectrometry Research Center (MSRC) has been a tremendous environment to conduct research. Of the members, I would like to specifically thank Kristin Burnum who provided perspective through most of my experiments. I am grateful to Deming Mi who is largely responsible for making the statistical analysis possible. Lisa Manier was vital in my protein identification. Reid Groseclose and Hans Aerni deserve thanks for both their friendship and candid evaluation and advice throughout these years. MSRC would not survive without Maureen Casey, and we all thank her for her work. Whitney Ridenour, Joey Latham, Domenico Taverna, Kirsten Herring, Shannon Cornett, Pierre Chaurand, Erin Seeley, Kristina Shwamborn, Sheerin Shahidi, Edwardo Dias, Kerri Grove, Malin Anderson, and Rita Casadonte deserve thanks for their help and support of this work. Last and most important, my wife Devan and two children Ethan and Elena, who always believed in me and always kept my priorities in check. iii
4 TABLE OF CONTENTS Page DEDICATION... ii ACKNOWLEDGMENTS... iii TABLE OF CONTENTS... iv LIST OF TABLES... vii LIST OF FIGURES... viii LIST OF ABBREVIATIONS... x Chapter I. INTRODUCTION... 1 A. Melanoma... 2 i. Diagnosis and Staging... 6 ii. Molecular Pathway... 9 iii. Treatment B. Modern Proteomics C. MALDI Imaging MS of Biological i. MALDI TOF Fundamentals ii. Recent MALDI IMS Developments D. Thesis Objectives iv
5 II. MALDI IMS OF MELANOMA: SAMPLE PREPARATION, CELLULAR TARGETGING, AND PROTEIN IDENTIFICATION A. Histolog-Directed MALDI IMS of Fresh Frozen Tissue i. Fresh Frozen Tissue Preparation ii. Accurate Cellular Targeting iii. Protein Data Collection and Processing B. Enzymatically Altered Protein Acquisition of FFPE Tissue i. FFPE Tissue Preparation ii. On-Tissue Digestion C. Protein Identification i. LC Separation and Digestion of Intact Proteins ii. Top-down Intact Proteins by MALDI TOF/TOF iii. Identification of Peptides from FFPE TMA s III. INTACT PROTEIN CHARACTERIZATION OF STAGE III MELANOMA LYMPH NODE METASTASES BY MALDI IMS A. Introduction B. Distinguishing and Classifying Control LN and Stage III Melanoma by Protein Signatures i. Protein Expression Differences between Control LN and Melanoma Tumor ii. Molecular Classifiers of Control LN and Tumor C. Correlating Protein Changes to Patient Survival and Recurrence. 70 i. Training and Test Set ii. Univariate Analysis of Pooled Cohort D. Discussion IV. PROTEOMIC CLASSIFICATION OF FFPE MELANOMA BY in-situ ENZYMATIC DIGESTION AND WITH MITF EXPRESSION v
6 A. Introduction i. Cohort and Data Processing Methods B. Distinguishing Melanoma Subtypes i. Primary Tumor vs. Normal Skin ii. Primary Tumor vs. Lymph Node Metastases iii. Primary Tumor, Acral, and Mucosal Results C. Tissue Grouping by Function i. Grouped by Collagen Alpha-2(I) ii. Grouped by Histone H2A D. Integration of MITF IF and MALDI IMS i. MITF Staining Protocol E. Discussion V. CONCLUSIONS AND FUTURE PERSPECTIVES A. Towards Improved Patient Care B. Future Outlook: Advancement in IMS i. Increasing Analytes by Mutlimodal Imaging REFERENCES vi
7 LIST OF TABLES Table 1. AJCC Staging Criteria for melanoma Identification of Intact Proteins from Stage III Melanoma Identification of Intact Proteins by a Single Peptide Previous TMA Peptide Identifications Confirmed by FT-ICR Peptides Identified from Melanoma FFPE TMA Proteins Increased in Melanoma vs. Control Lymph Nodes Classification Models of Melanoma vs. Control Lymph Nodes Stage III Melanoma Training and Test Set Markers Pooled Cohort Survival and Recurrence Markers Mutation Rates in Melanoma Subtypes TMA Demographics and Melanoma Subtypes Peptides Increased in Control Skin vs. Primary Melanoma Peptides Increased in Lymph Node Metastases vs. Primary Melanoma Peptide Intensity Percentages per Melanoma Subtype Histone and Collagen Peptides MITF Scoring by Melanoma Subtype MITF Expression Correlation with Histone and Collagen Peptides vii
8 LIST OF FIGURES Figure 1. Progression of Melanoma Prominent Protein Pathways in Melanoma MALDI Imaging Mass Spectrometry Histology-Directed MALDI IMS Ionization by MALDI Histology-Directed IMS of Stage III Melanoma Incubation of On-tissue Digestion Single Section IMS and Histology of TMA Top-down MALDI MS/MS of m/z Protein Spectra from Stage III Melanoma and Control Lymph Nodes MALDI IMS of a Stage III Melanoma PCA and MDS Separation of Melanoma and Control Lymph Nodes Test Set Evaluation of Survival/Recurrence Protein Markers Favorable and Unfavorable Melanoma Grouping Peptide Classification of Normal Skin vs. Primary Melanoma PCA and Collagen Peptide Separation of Skin and Primary Melanoma Gel-view of Collagen Peptides in Skin and Primary Melanoma Peptide Classification of Primary vs. Lymph Node Metastases PCA and Histone Peptide Separation of Primary and Lymph Node Metastases Gel-view of Histone Peptides in Lymph Node Metastases viii
9 21. Gel-view of Collagen Peptides in Lymph Node Metastases Independent Classification by Collagen Peptides PCA Separation by Collagen Peptides Independent Classification by Histone Peptides PCA Separation by Histone Peptides Positive MITF immunofluorescence Mutlimodal IMS: Application to Primary Melanoma ix
10 TECHNOLOGICAL ABBREVIATIONS IMS, Imaging Mass Spectrometry MS, Mass Spectrometry MALDI, Matrix-assisted Laser Desorption/Ionization ESI, Electrospray Ionization TOF, Time-of-Flight MS/MS, Tandem-MS m/z, mass-to-charge Da, Dalton TIC, total ion current LC, liquid chromatographic SA, Sinapinic Acid DHB, 2,5-dihydroxybenzoic acid SAM, significance analysis of microarrays FDR, false discovery rate IHC, immunohistochemistry x
11 CHAPTER I INTRODUCTION The war on cancer is approaching its 40 year anniversary, and yet cancer remains the 2 nd leading cause of death in the US. Our understanding of the disease has increased tremendously over these years. Insights into viral driven cancers, hereditary and environmentally acquired genomic mutations, oncogenic protein pathways, and recently the mapping of the human genome 1 have improved our understanding of cancer biology, treatments, and prognosis. Breakthrough cures, such as Gleevec for chronic myeloid leukemia (CML) patients, however, remain rare occurrences. 2 The sharp contrast between the tremendous steps forward in cellular biology and the limitations of current treatment regimes underscores the enormous challenge we face. Cancer as a disease is truly complex, as the same type of cancer can arrive by a completely different set of mutations, and a single cancer may be composed of a heterogeneous population of cells, each containing different acquired mutations and resistance to treatment. As we uncover more specifics on the causes and the players involved in the hallmarks of cancer, such as the mechanisms of evading the immune system, metastasis, recruitment of blood supply, and autocrine growth, we can continue - 1 -
12 to develop more effective targeted therapies and optimize treatment regimes for the individual patient. 3 For many cancers clinicians have limited and crude tools available to accurately distinguish tumor subtypes, including melanoma where staging and stratification predominantly rely on tumor size, presence of ulceration, and depth of invasion. Patients presenting with advanced melanoma have a grim outcome and the majority of late stage patients will ultimately die from the disease. A need exists to develop molecular markers to categorize the heterogeneity of melanoma tumors for diagnosis, prognosis, and potential treatment efficacy to improve the resources clinicians have for patient evaluation and treatment. The purpose of this work is to describe metastatic melanoma using modern mass spectrometry technology in order to understand and characterize proteins involved in the disease for diagnosis, prognosis, and molecular classification. A sufficient understanding of melanoma, its causes and progression, as well as the mechanisms of mass spectrometry (MS) in the scope of proteomics is crucial. The following is presented as an orientation in these areas. Melanoma Melanoma is the deadliest form of skin cancer, contributing to over 80% of skin cancer mortalities. The disease arises when melanocytes, the melanin (pigment) - 2 -
13 producing cells found in the skin, begin to grow uncontrollably. Despite an overwhelming amount of research and increased public awareness, melanoma accounted for an estimated 62,000 new cases and 8,400 deaths in 2008 in the U.S. alone. 4 Beginning as neural crest cells, melanoblasts migrate to the skin during development and differentiate into melanocytes, where they exist singly distributed along the basal layer between the dermis and epidermis. Here, keratinocyte cells from the epidermis and fibroblasts from the dermis surround and regulate the isolated melanocytes, and upon exposure to UV damage, induce the melanocytes to produce and distribute melanin to surrounding cells. 5 The predominant mechanism for this is through keratinocytes producing α-melanocyte-stimulating hormone (α-msh) that binds to melanocortin 1 receptor (MC1R) on the melanocytes, triggering micropthalmiaassociated transcription factor (MITF) stimulating melanosome (melanin containing packages ) production and transportation to keratinocytes by dendritic processes. 6 Under normal conditions, the melanocytes grow very slowly and are very resistant to apoptosis, as the cells are responsible for mounting the defense after UV damage. This resilience no doubt contributes to advanced melanoma s high resistance to adjuvant therapy. The risk factors for melanoma include the presence of benign nevi (i.e. moles), family history of melanoma, fair skin, and a history of severe sunburns. 7 Ultraviolet (UV) light is directly harmful to cells, by way of producing oxidative species that damage DNA and by direct DNA damage (cyclobutane pyrimidine dimmers and 6,4-photoproducts). Interestingly, it is periods of intense intermittent UV exposure to under-protected skin - 3 -
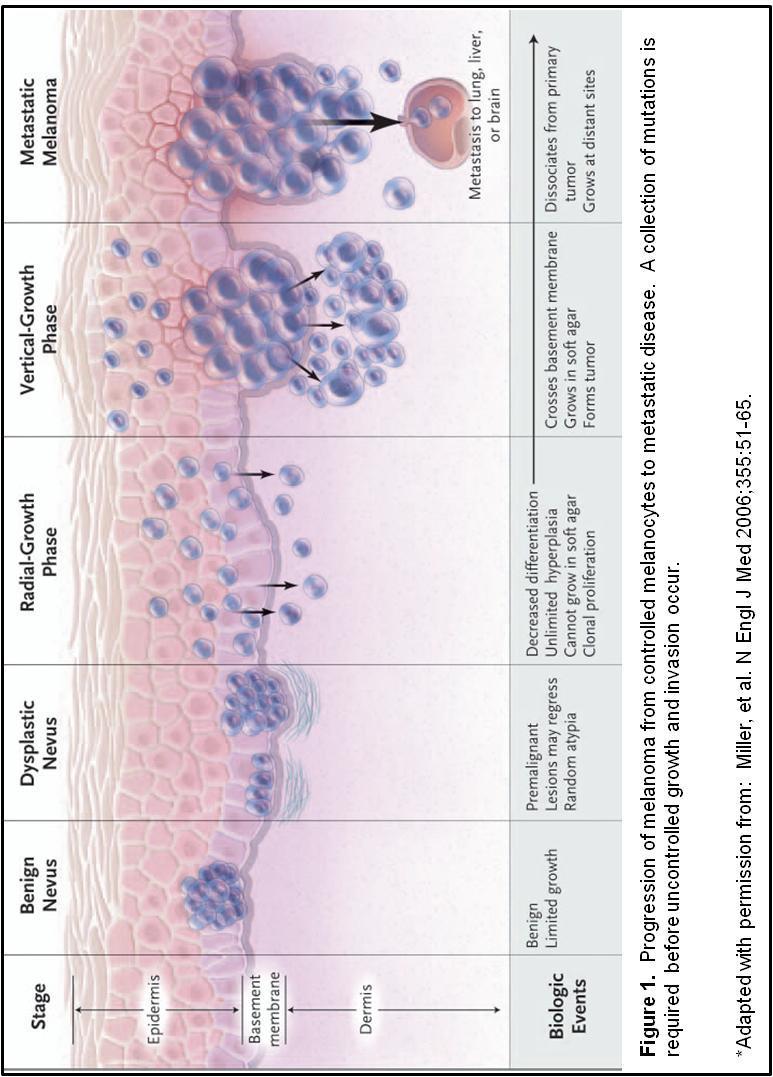
14 (so-called recreational sun ) that induces the most DNA damage. Chronic exposure to UV creates a lasting melanin response and is associated with a lower risk for melanoma. 8, 9 Melanoma, like any cancer, requires a certain number of mutations to occur before the full onset of uncontrolled melanocyte growth. Inherited susceptibility, such as a genetic defect in CDKN2A or the limited melanin production in light-skinned and redheaded populations reduce the skins defense against UV damage. Environmental factors, mainly UV damage, likely contribute to the remaining mutations. One simplified model for the progression from normal, controlled melanocytes to melanoma is through a set of steps, starting with benign nevus, progressing to dysplastic nevi, to early stage cancer as radial-growth phase (RGP), and progressing to invasive vertical growth phase (VGP) before finally metastasizing to a distant location, Figure 1. In reality, most benign nevi and dysplastic nevi will never develop into melanoma, but instead show a set of acquired mutations that indicate a higher susceptibility for melanoma. Furthermore, vertical growth phase melanoma may appear in the absence of previous benign nevi. In effect, several mutations along key molecular pathways are required for melanoma
15 - 5 -
16 Diagnosis and Staging Melanoma is divided into several clinical subtypes: nodular, acral lentiginous (ALM), lentigo maligna, and superficial spreading melanoma (SSM). 10 Nodular melanoma forms raised nodules with limited flat portion and is associated with high risk due to rapid proliferation and significant dermal invasion. ALM is the most common form found in non-caucasian populations and is found in the palms, soles of the feet, and nail beds, but is not associated with UV exposure. Lentigo maligna occurs most often on the face and neck of elderly populations and appears as large liver spots. SSM is by far the most common and is associated with severe sunburns and appears most commonly on recreational sun exposure sites. Primary melanoma is diagnosed visually based on the size, shape, and color of the growth. This is known as the ABCD s of melanoma: A) Asymmetry: the lesion has an irregular, non-circular shape B) Border: the edge of the lesion is irregular, blurred or ragged C) Color: the lesion is composed of various, non-uniform shades of black or brown D) Diameter: greater than 6 mm or rapidly changing in size Advanced metastatic disease may additionally require immunohistochemistry (IHC) staining to accurately diagnose, typically with a combination of S100 and MART1/HMB As metastatic disease progresses, melanoma cells often dedifferentiate and cease producing melanin, consequently IHC validation is required to confidently identify the tumor as melanoma
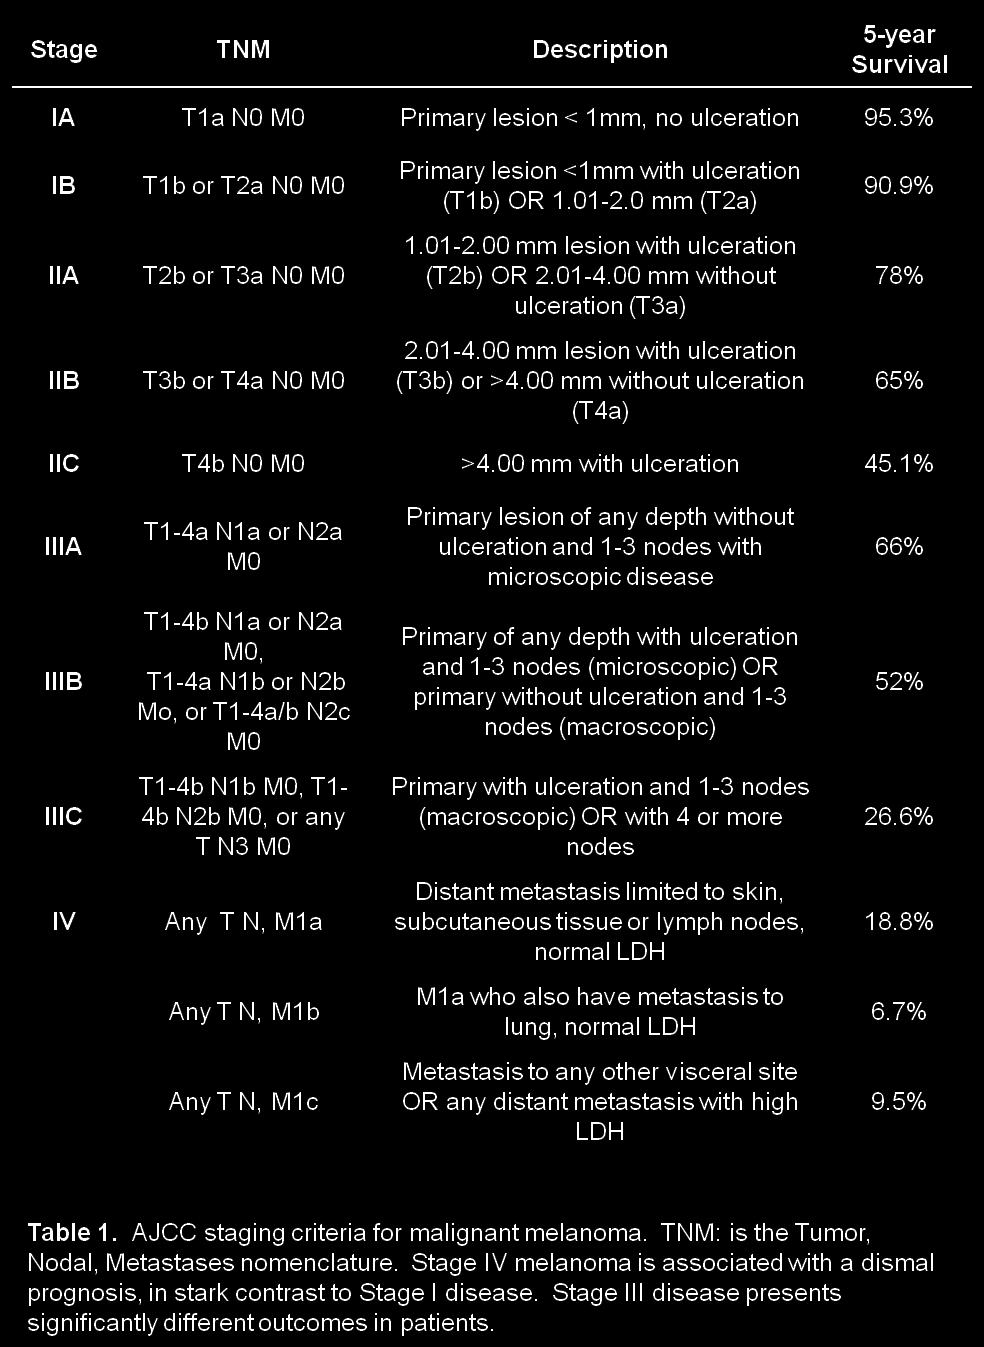
17 Staging of melanoma was established by the 2002 American Joint Committee on Cancer (AJCC) Melanoma Staging Committee. 12 Stage I and II disease describe local primary tumor, stage III classifies regional metastasis (usually to the regional lymph nodes), and stage IV disease encompasses distant metastasis. All 4 stages use the TNM (T:tumor, N:nodal, M:metastasis) classification. Table 1 shows the important criteria for each of these stages and the associated 5 year survival. 13 Clinical and pathological prognostic factors for survival of patients include tumor thickness, ulceration and mitotic rate of the primary tumor, and the number and size of involved lymph nodes
18 - 8 -
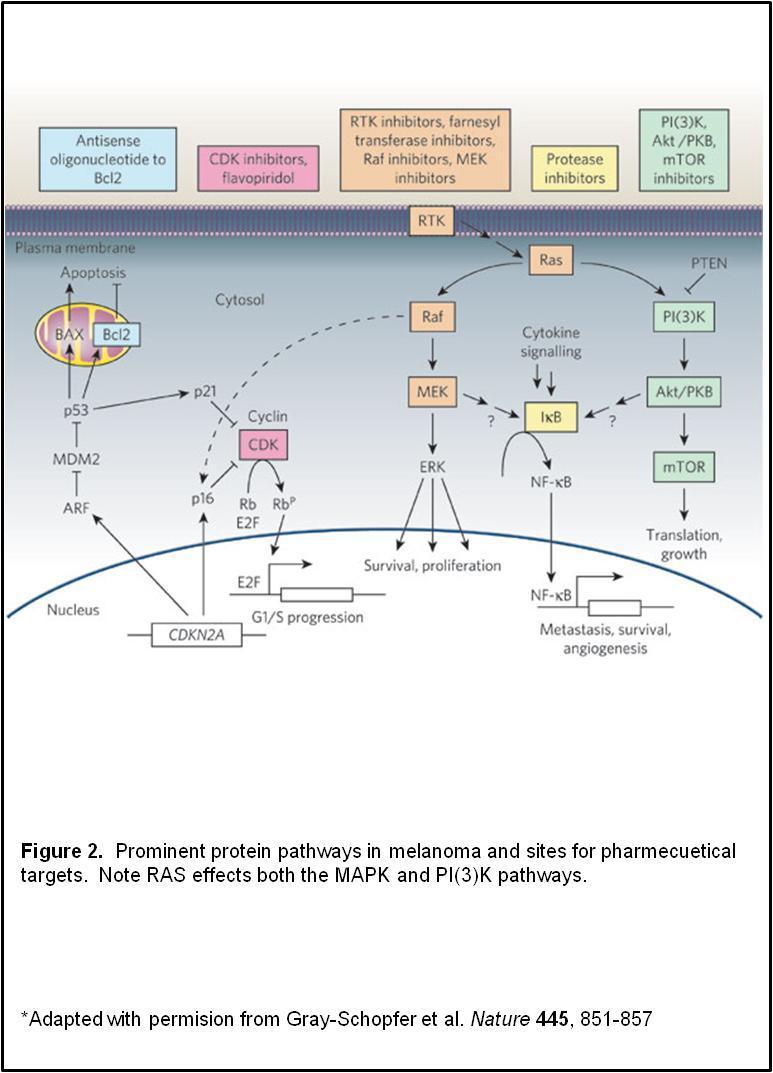
19 Diagnosis of stage III disease is accomplished through the use of an elective lymph node dissection (ELND) or sentinel lymph node (SNL) biopsy. The SNL technique injects a blue dye (1% isosulfan blue) and a radioisotope (technetium Tc 99m sulfur colloid) around the primary tumor to find the first draining lymph node. This blue node is excised and sent to pathology for analysis. A positive lymph node (confirmed with S100 and MART1/HMB45) will elicit a complete lymph node dissection. A positive lymph node is found in approximately 20% of patients possessing primary tumors > 1mm with drainage to more than 1 lymph node in 15% to 27% of patients. 14 Patients with stage III disease or who are symptomatic should undergo advanced imaging with MRI, PET, and/or CT scans to determine stage IV disease. Molecular Pathways of Melanoma Tumorigenesis of melanoma arises as proteins (oncogenes) along key regulatory pathways become altered in function. These molecular pathways are complex signaling highways that control cellular functions, such as cell growth, differentiation, senescence, cellular and DNA repair, cell adhesion and migration, and cell-cell communication, Figure 5. Many of these networks contain check-points in the form of proteins whose function determines whether a cellular process begins or halts. These alterations include pathway regulators that are hyperactivated or over/under expressed. Several of the pathways and common alterations pertaining to melanoma are described. The mitogen-activated protein (MAP) kinase cascade controls cell proliferation and differentiation based on detection of external growth factors, Figure 2. External - 9 -
20 growth factors, such as epidermal growth factor (EGF) or platelet-derived growth factors (PDGF), bind to their respective cell surface receptors (i.e. EGF-R and PDGF-R) phosphorylating the intracellular portion of the receptor, activating a binding site for growth factor receptor-bound protein 2 (Grb2)-SOS complex. Once bound to the receptor, SOS is activated and promotes GDP removal from Ras, allowing Ras to bind GTP and activate Raf which in turn activates the MEK1/2 complex. MEK1/2 can then activate the ERK1/2 (a.k.a. MAPK) complex leading to activation of c-myc which activates cell proliferation
21 - 11 -
22 In melanoma, BRAF mutation is the most frequently observed; present in up to 80% of all melanomas. The most common mutation, in 80% of mutated BRAF cases, is a single V E substitution at residue 600 that dramatically increases its activity, effectively turning on the MAPK pathway. 15, 16 BRAF mutation is present in most benign nevi, indicating it alone is insufficient for complete melanoma transformation. In the MAPK pathway, mutation in NRas is also observed in ~10% of cases, is tied to UV exposure, and is notably mutually exclusive to the b-raf mutation, due to the overlap of oncogenic function of both along the MAPK pathway. The overwhelming presence of BRAF mutation prompted focus for inhibitors in patient treatment. Numerous other pathways have been implicated in melanoma. The PI3K-Akt pathway is involved in cellular survival specifically by inhibition of apoptosis, gain of function mutations are observed in melanoma. Several motility proteins that tether and foster cell-cell communication have been seen in melanoma, including B-catenin, VCAM, and ICAM. Beyond BRAF and NRAS mutated activation of MAPK, melanoma cells can increase both the production of growth factors and the number of growth factor receptors. Finally, in gaining the ability to metastasize, melanoma cells excrete an increased level of MMP that degrade the surrounding ECM. 17 Treatment Complete surgical excision of all gross disease remains the best option for patients. Patients with primary disease are routinely cured by resection alone, though follow-up and investigation of future symptoms is highly recommended. However,
23 surgical resection alone is insufficient in patients diagnosed with stage III disease, as half of them will eventually die from the disease. Melanoma remains notoriously resistant to adjuvant and systemic therapy, being widely viewed as both chemoresistant and radioresistant. While novel therapeutics show signs of relapse-free survival, the benefit to overall survival has yet to be definitively shown. Currently, only interferon alfa 2b (IFN-α2b) has been approved by the Food and Drug Administration (FDA) for the treatment of high risk melanoma patients. Unfortunately, the treatment is associated with significant side effects and analysis of clinical trials E1684, E1690, E1694, and E2696 showed a benefit to relapse-freesurvival, but no benefit to overall survival. 18 For stage IV melanoma, the FDA has approved only dacarbazine and interleukin-2 (IL-2), neither resulting in a clinically meaningful improvement in overall survival. Dacarbazine, along with the orally administered form temozolomide, have shown response rates from 13-22% without a 19, 20 benefit to overall survival. IL-2 is a recombinant hormone that stimulates the immune system by activation of cytotoxic T cells. IL-2 has shown a long term durable response in a small set of patients (5%), but the treatment is associated with significant toxic effects, in which some cases required intensive care support. 21 Currently, there is no known system for selecting patients who show this long term response. Novel treatments for melanoma are being developed that target specific antigens, receptors, or transduction pathways. These include BRAF, Raf kinase, Bcl-2, 14, 22, 23 Kit, NF-κB, and the angiogenesis inhibitor for VEGF. Therapy combinations are being investigated and provide indications that a multimodal approach will improve efficacy and allow more individualized treatment strategies. However, these
24 approaches remain largely unsuccessful in providing survival benefits to patients. Clearly there is a need for research into additional therapeutic targets. Modern Proteomics Understanding the complex nature of numerous interacting proteins in cancer and other diseases is due in large part to the development of proteomics and proteomic technologies. Proteomics is the focused study of proteins, in particular their structure, function, and quantity on a global scale. The global expression of proteins within a cell determines nearly every behavior, function, and interaction within and in conjunction with other cells. In contrast to a static genome, the proteome is expressed differently from cell to cell and from time to time. In addition to this fluctuation, proteins range in size from a few kda to several MDa and can differ by 6 orders of magnitude in concentration. A protein may further undergo any number of post-translational modifications (PTMs) or form complexes with other proteins which may dramatically alter its function. Clearly proteomics remains one of the most important and analytically challenging feats of our time. Experimental procedures for large-scale global proteome analyses typically examine the difference in expression of hundreds of proteins between two or more biological states. The objective is to understand protein alterations resulting either directly or indirectly from a biologic process. Proteomic differences are expected to be present, for example, between benign and invasive disease, brains from Alzheimer s
25 patients, as well as between native tissue and those exposed to pharmaceuticals or toxins. Proteins that differ between biological states can then be studied to understand the nature of a disease or the effect of a drug. In many cases, these differentially expressed proteins may become potential biomarker candidates and eventual therapeutic targets. Proteomics is fundamentally reliant on the power of mass spectrometry (MS) for rapid and specific protein analysis. Mass spectrometry involves three basic components: ionization, mass separation, and detection. The gas-phase analyte, M, must be charged, typically via: (1) M + H + [M+H] + or M + xh + [M+nH] n+ Electric and/or magnetic fields manipulate and separate ions by their mass-to-charge (m/z) ratio. Once separated, the ions are detected, typically by collision into an electron multiplier device. The result is a display of the measured intensity vs. the m/z value for all ions detected. Two ionization methods have revolutionized proteomics by allowing the direct soft ionization of large protein molecules and appropriately shared the Nobel Prize in chemistry in Electrospray ionization (ESI) and matrix-assisted laser desorption/ionization (MALDI) instruments are now the core of proteomics workflows. 24 Current Proteomic Technologies Large scale approaches to characterize the proteome generally fall under two categories, gel-based separation of intact proteins (pseudo top-down) and
26 multidimensional liquid chromatography (LC) of digested proteins (bottom-up). Both of these technologies require the sample to be homogenized into a solution form, effectively removing any spatial information. Gel electrophoresis, which separates proteins by their molecular weight (MW) in 1-dimension or by their isoelectric point (pi) and MW in 2-dimensions, produces an easily visible map of the proteins in the sample. Protein maps are compared between biological states to find specific protein 25, 26 differences between groups. Multiple samples can be labeled with fluorescent tags and analyzed simultaneously on a single gel using 2D difference in-gel electrophoresis (2D-DIGE). 27 Proteins contained in the spots are digested, extracted, and analyzed by LC-tandem MS or confirmed by immunoblotting. The clear advantage afforded is the ability to visualize a map of numerous intact proteins, and to then positively identify them. Multiplex and scaling complications keep 2D gel technology low-throughput and analysis of each protein spot, even when automated, can be both laborious and time consuming. In the other approach, liquid chromatography is extensively used to reduce the complexity of complex biological samples prior to MS analysis. In the shotgunproteomics approach (also termed multidimensional protein identification technology MudPIT), 28 all of the extracted proteins are enzymatically digested together to form a more complex peptide mixture. The peptides are then separated in two dimensions, typically using strong cation/anion exchange (SCX/SAX) followed by reverse-phase (RP) LC. The eluent from the second separation goes directly into the mass spectrometer for peptide identification. While it may seem that initial digestion of the intact proteins further convolutes an already complex mixture, the speed at which this
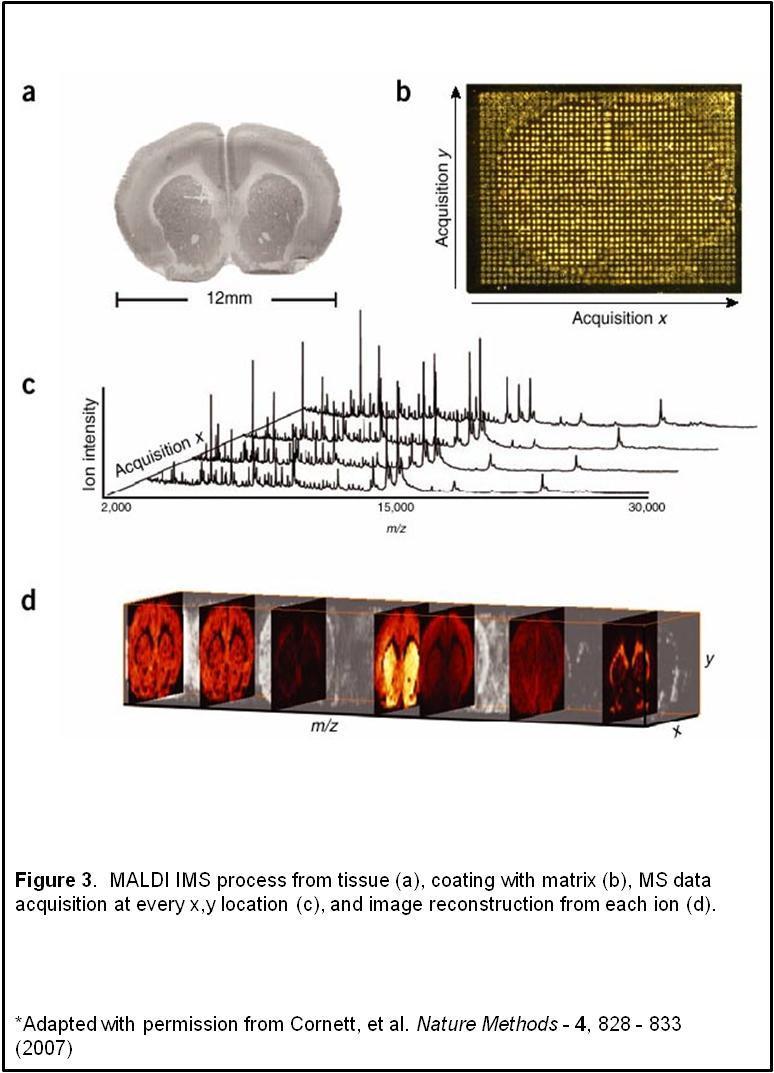
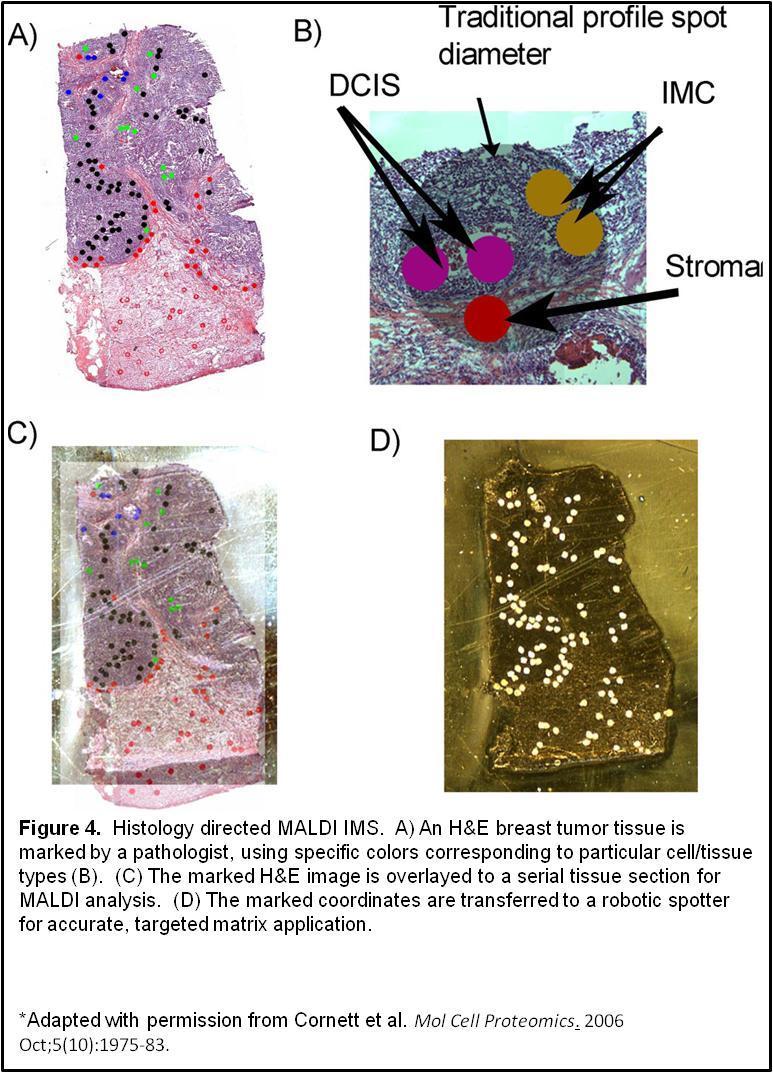
27 analysis can be done is much faster than for the 2D DIGE approach. Also, peptides are more easily separated and identified than intact proteins. This platform has been driven in large part by tremendous advances ion trap technology 29 and in the construction of genomic-based protein databases 30 and advanced algorithms to search and identify peptides and their precursor protein. 31 Comparison of biological states can be accomplished by relative quantitation of peptides between separate analyses using 32, 33 spectral counting or by direct comparison of isotopically labeled peptides, such as ICAT 34 or itraq 35, from a single run. Despite the overwhelming strengths and its widespread use, bottom-up proteomics suffers from describing intact biologically active proteins, resulting in limited concrete evidence for intact protein character and function. MALDI Imaging MS of Biological Tissues Matrix-assisted laser desorption/ionization (MALDI) imaging mass spectrometry (IMS) of intact proteins records and combines proteomic data with location information 36, 37 directly from thin sections of biological samples. The spatial integrity of the proteins within the biopsy section is maintained, allowing specific cellular regions to be analyzed. For the analysis, matrix is applied uniformly or in a discrete grid array across the tissue, Figure 3. A laser irradiates the matrix and ionizes the proteins, generating 2 dimensional data containing both the proteins detected and the tissue location. The sampling positions become pixels that are compiled to generate a picture or image for each molecule detected. Any given mass-to-charge (m/z) signal in the spectrum can be
28 displayed with its relative intensity over the entire array, giving a density map of that compound in the array area. Hundreds of such pictures or images can be generated from a single acquisition experiment
29 - 19 -
30 MALDI IMS for proteomics has the benefit of 1) measuring intact proteins with high mass accuracy (typically better than 1 part in10,000), 2) measurement of intact proteins in their native, biologic state including PTM s, 3) in-situ analysis directly from tissue with location and cellular specific information and, 4) high sensitivity of intact proteins below 20 kda (an area often overlooked in other proteomic analyses). MALDI IMS has been employed to generate ion density maps (images) of numerous detected analytes, including pharmecueticals 38-41, lipids 42, enzymatically cleaved proteins 43, and intact proteins This technology has also been used to identify biomarkers and classifiers for clinical diagnosis and potential treatment of cancer, 48 including lung cancer 49, gliomas 50, and breast cancer 51. The technology has recently been adapted to accurately target small cellular regions within tissue biopsies, termed histology-directed IMS where a pathologist examines a histological stained tissue section to guide and confidently target the cellular regions of interest in an adjacent serial section of the biopsy, Figure In this way, the proteins from tumor foci or regions of adjacent normal tissue can be analyzed from each section, and necrotic, autolysis, connective tissue, and blood vessels can be avoided, so as not to unduly complicate the analysis
31 - 21 -
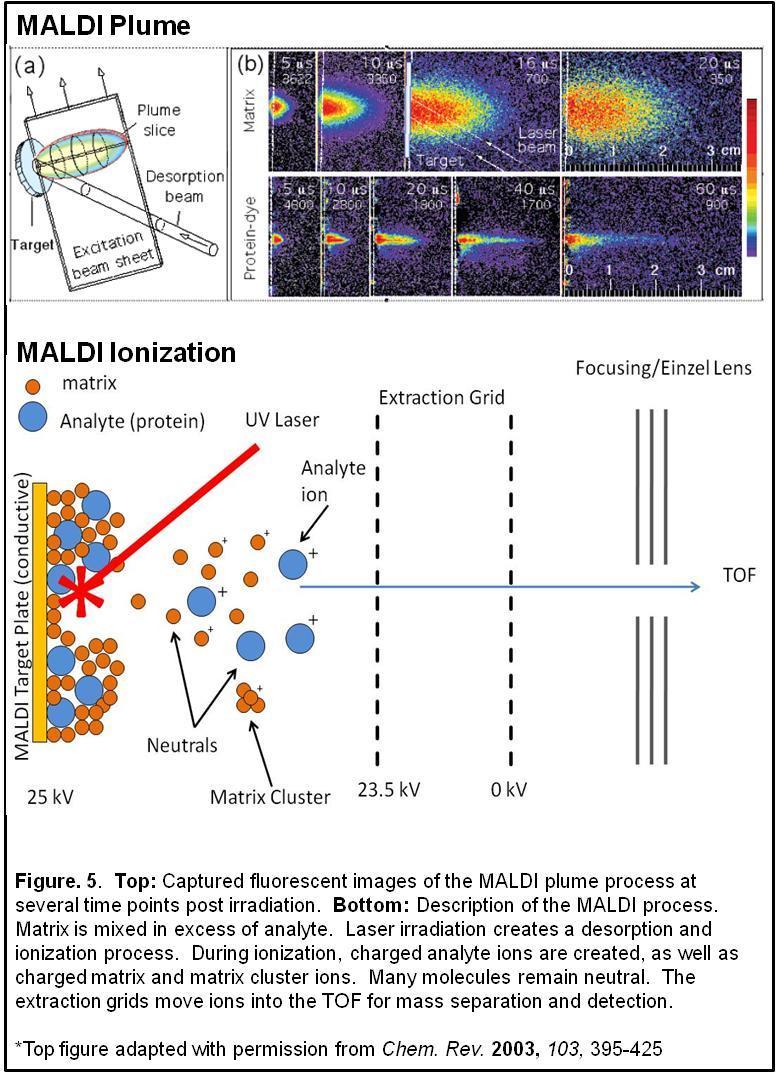
32 MALDI TOF Fundamentals Advances in interface technology have allowed MALDI and ESI sources to be coupled to virtually any mass analyzers, including quadrupole, ion trap, time-of-flight (TOF), Fourier transform ion cyclotron resonance (FT-ICR), and more recently orbitrap instruments. MALDI TOF composes the core of our MS workflow and is described here in some detail. Detailed descriptions of other MS configurations can be found here.* Matrix-assisted laser desorption/ionization (MALDI) was developed from the work 53, 54 of Karas, Hillenkemp, and Tanaka during the late 1980 s. The technology uses a light absorbing molecule, or matrix, to desorb and ionize analytes, with relatively little fragmentation. An analyte is co-mixed with a solution of dissolved matrix, applied to a conductive target plate, and as the solution dries, the matrix forms a crystal lattice that incorporates the analyte. When the crystals are irradiated with a UV laser, the photons are absorbed by the crystals and the energy transformed into kinetic energy E k. This energy conversion creates a matrix plume that converts the analyte into the gas phase and ionizes them, Figure Suitable matrix molecules are often small, acidic aromatic compounds, such as the common 3,5-dimethyoxy-4-hydroxycinnamic acid (sinapinic acid, SA), α-cyano-4-hydroxycinnamic acid (CHCA), and 2,5-dihydroxybenzoic acid (DHB)
33 - 23 -
34 The explosion from the MALDI process produces ions with a mix of kinetic energy, E k. A small time delay (~200 ns) from the laser irradiation is applied, termed delayed extraction. When the extraction grid is activated and an electric field accelerates the ions, those farther from the source will receive a slightly lower push. The exact time delay is adjusted to spatially focus the ions on the detector. Ions are typically accelerated kv into the TOF, Figure 3, which consists of a hollow field-free tube usually less than a meter in length. The ion separation is a function of the basic principles of a charged particle in an electric field: (1) where E p is the potential energy, q is the charge on the particle, and U is the strength of the electric field or voltage applied. With no hinderance on the ions, the poteintial energy is converted to kinetic, E p = E k, and is given by (2) E k = where m is the mass and v is the ion velocity, and by substitution becomes (2) = The ion velocity is the ratio of the length of the flight tube d and the flight time of the ion t, giving (3)
35 And by substitution with equation (3), (4) = Solving for t, we obtain (5) With d and U constant, a constant k simplifies equation (6) to (6) Thus, the flight time is inversely proportional to the mass and more specifically, to m/z (where q becomes z). Larger ions will have a longer flight time, and thus reach the detector after smaller ions. Modern MALDI instruments are incredibly fast, routinely acquiring 1000 or more spectra per second. Unlike ESI, MALDI produces almost exclusively singly charged ions, making spectral interpretation straightforward. Recent MALDI IMS Developments Several technological advances in recent years have dramatically improved the workflow, robustness, and image quality of MALDI IMS in matrix deposition, data acquisition, and image processing and analysis. Previously reported robotic deposition by a prototype acoustic spotter 56 was limited to ~200 µm lateral spot resolution. Current
36 versions continuously move the target with constant droplet ejection, providing lateral resolution of 150 µm while reducing spotting time. Controlled mechanical spray deposition controls the humidity, measures matrix drying, and generates smaller droplets by advanced vibrational vaporization spray. 57 Further, matrix deposition by sublimation 58 coats an entire tissue with uniform sub micron crystals in less than 10 minutes, with images under 30 µm lateral resolution. Although sublimation is currently limited to endogenous lipid analysis, recrystallization of the coating is proving successful for higher mass analytes. Optimal protein analysis via MALDI has been limited to N 2 lasers and as a consequence, Hz spectral acquisitions and 20 million shot lifetimes. Modulation of Nd:YAG lasers give comparable or superior protein spectra at laser speeds of 1 khz and lifetimes of more than a billion laser shots. 59 Prototype instruments incorporating 5 khz lasers are currently being investigated. In conjunction, image processing software integrates spectral processing, image processing, image visualization, and statistical analyses of image regions [ClinProt Ref]. These advances combine to significantly improve the ease, quality, speed, and analysis of MALDI IMS. MALDI TOF IMS and the histology-directed MALDI IMS adaptation are here used as the proteomic technology to investigate the biology of metastatic melanoma
37 Thesis Objectives The purpose of this research is to achieve the following objectives: Objective 1: Determine specific proteins that distinguish cancer free lymph nodes from melanoma infiltrating lymph node. From the proteins, develop robust molecular classifiers that distinguish the two tissue types. Objetive 2: Determine proteins that correlate with survival and disease recurrence in patients with stage III melanoma to distinguish aggressive from less aggressive disease. From the significant proteins, develop predictive molecular classifiers and determine effectiveness. Objective 3: Apply enzymatic digestion to formalin-fixed melanoma tissue microarrays for diagnostic and classification markers of disease. Integrate MALDI IMS of FFPE tissue with histology using MITF. Adaptation of current on tissue MALDI IMS technology to melanoma tumors, both fresh frozen and formalin-fixed, was required to meet these objectives. For adequate biological analysis of the significant proteins, the m/z values were identified with their PTMs observed in their particular biological state. Pairing significant protein changes
38 with classification and diagnostic states brings insight into the biologic nature of aggressive melanoma. With these results, clinicians are presented with information to aid diagnosis and prognosis for patients suffering from melanoma
39 CHAPTER II MALDI IMS OF MELANOMA: SAMPLE PREPARATION, CELLULAR TARGETING, AND PROTEIN IDENTIFICATION MALDI IMS of biological tissues generates both spatial and molecular information from a single experiment. When arraying an entire tissue, one can group data collected from different regions to obtain an average proteomics signature for the cell types that it represents. Questions such as What proteins accurately characterize and model behavior for this disease? or What proteins are over expressed when transitioning from benign to aggressive disease? require an accurate representation of the proteins from each disease state. When examining a sizeable cohort of tissue samples for biomarker discover, high lateral resolution MALDI IMS can generate an overabundance of information and slow analysis process. For instance, a small melanoma tumor of 4 mm diameter would contain over 500 data points if imaged at 150 µm. The same representative proteomic signature can be obtained by strategically analyzing data points. This strategy, termed histology-directed MALDI IMS, integrates pathological analysis and the spatial capability of MALDI IMS to target a small number of specific, representative cellular regions. 52 Conversely, tissue microarrays (TMA) combine representative tissue regions of numerous samples into a high density array where a single MALDI imaging experiment can sample 80 or more unique specimens. In TMA s, several benefits of histology
40 directed profiling are largely diminished and a traditional uniform imaging array is often optimal. Here, we describe the protocol for MALDI IMS by histology directed analysis and of tissue microarrays for high throughput protein data collection for our use in melanoma classification and biomarker discovery. Histology Directed MALDI IMS Protein Acquisition of Fresh Frozen Tissue Histology directed MALDI profiling, originally described by Cornett et al, 52 was used to collect intact protein information from a cohort of fresh frozen melanoma tumors and control lymph nodes. Here we have slightly modified the workflow and the following sections elaborate on the necessary details for tissue preparation, sample storage, cellular targeting by pathology, image co-registration, derivation of matrix printing coordinates, and accurate matrix printing for automated MALDI data acquisition. Each of these considerations is essential in deriving rich, accurate protein profiles from specific cellular regions of interest. The design here is specific to a workflow for proteomic analysis of a sizable cohort of fresh frozen tissue specimens. All conditions are optimized for targeting accuracy and protein detection sensitivity. The purpose and strength of the technology used here is to improve throughput and ensure that proteins are obtained from the proper cellular regions
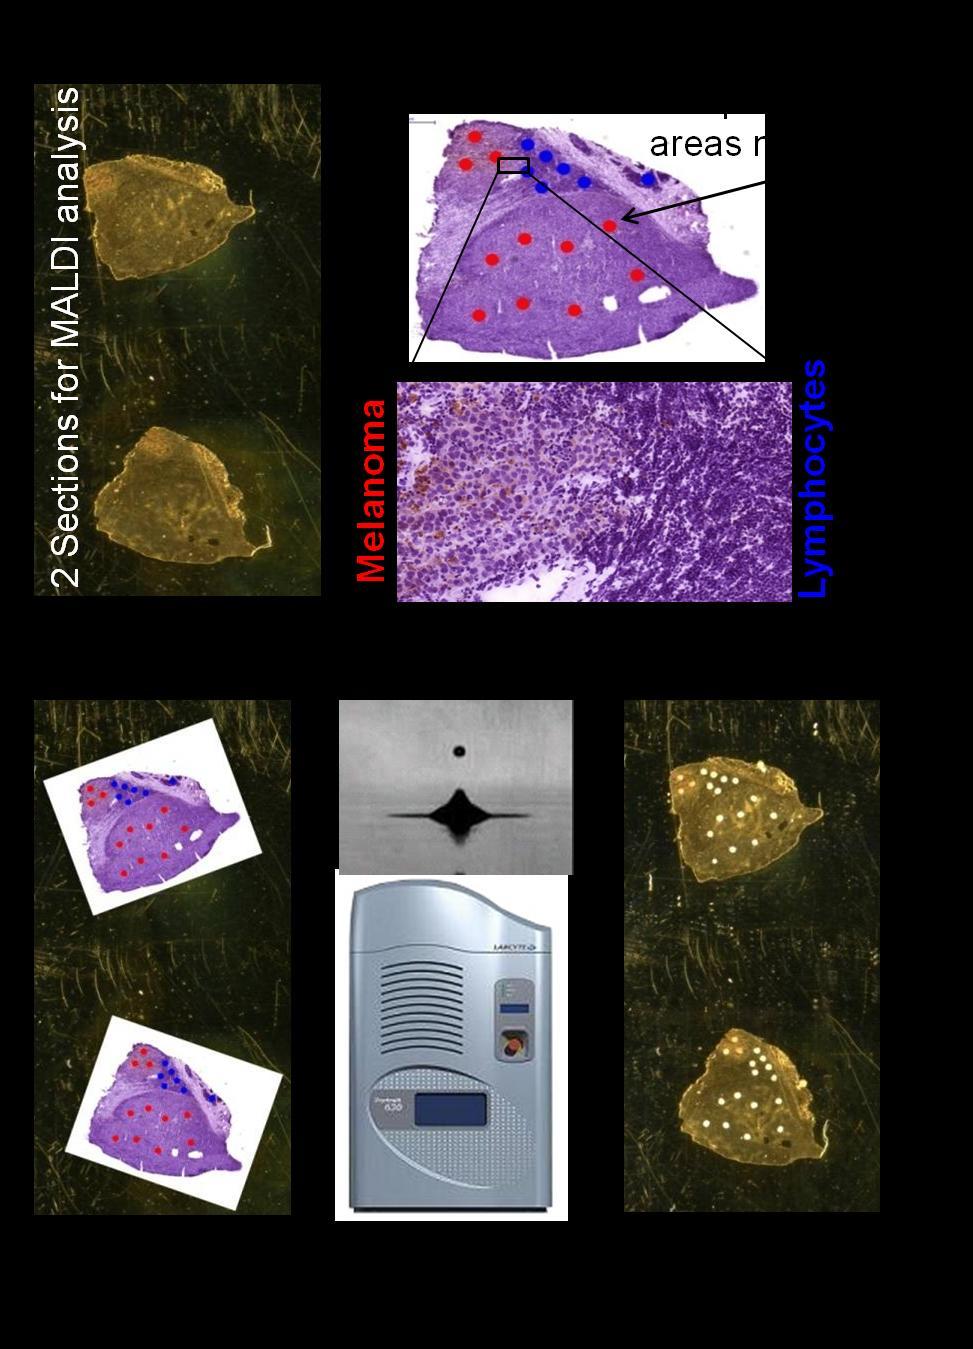
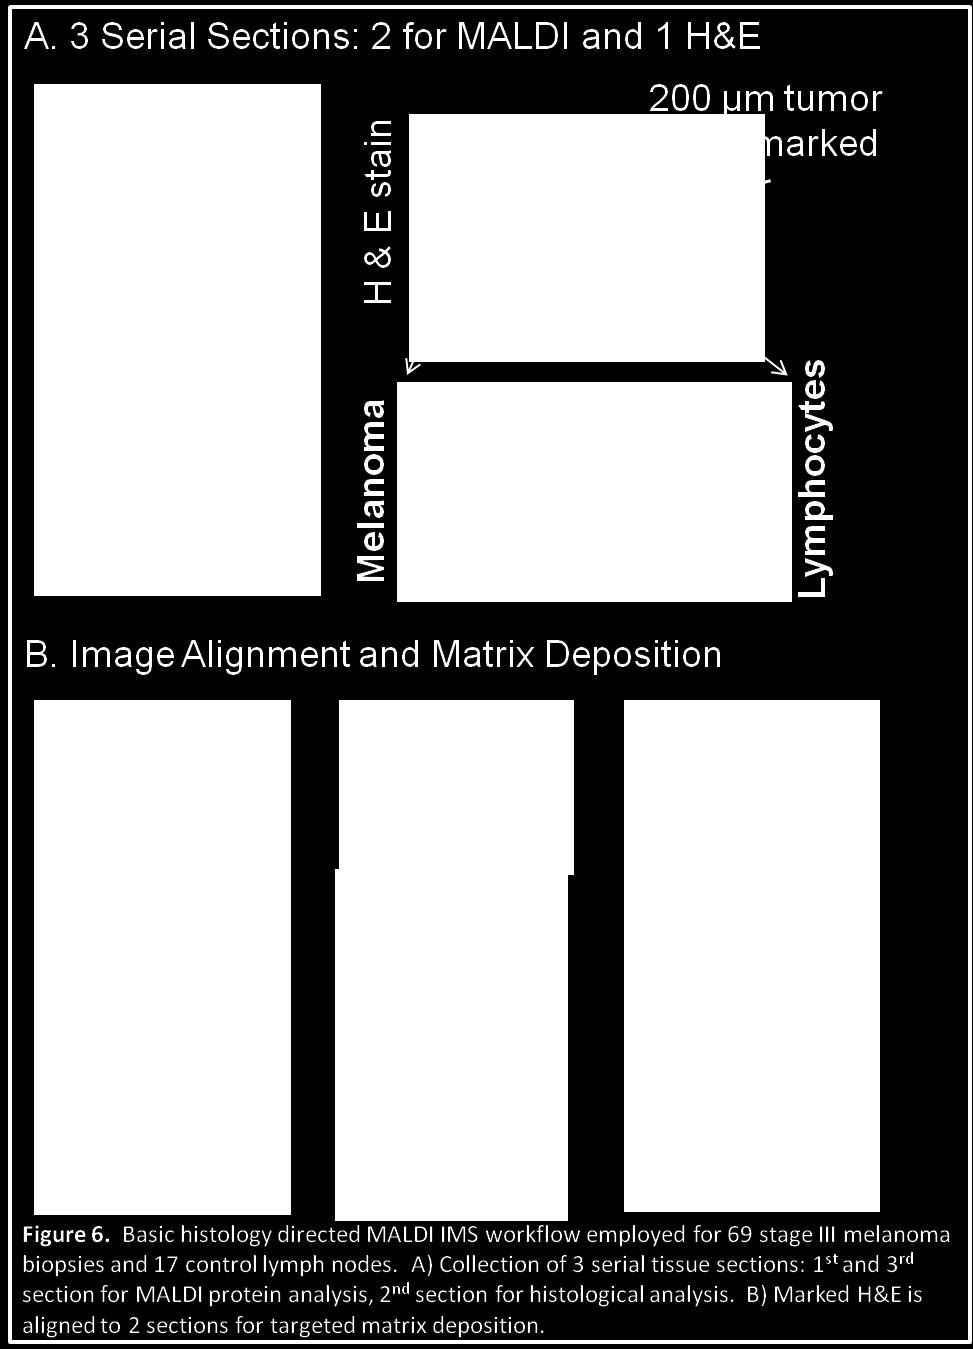
41 Fresh Frozen Tissue Preparation Lymph node metastases were collected from 82 melanoma patients at the time of regional lymph node dissection. 17 control, cancer-free lymph nodes were obtained from patients undergoing partial colectomy for benign disease. All samples were frozen in liquid nitrogen and stored at -80 C until analysis. For each tissue specimen, three 12 µm serial sections were cut on a cryomicrotome. The first and last tissue sections were thaw-mounted onto a gold coated target plate for MALDI analysis. The center tissue section was thaw-mounted onto a glass microscope slide, stained with hematoxylin and eosin (H & E), and photomicrographed at with an optical microscope scanner (Mirax, 3D Histech, Hungry). The total sample set spanned 15 MALDI plates containing over 200 tissue sections. The MALDI plates were immersed in 70% and 90% ethanol (EtOH) for 20 sec each to remove abundant lipids, salts, and dehydrate the tissue. 60 Each target plate was allowed to air-dry and marked with 4 fiducials. Then a 2400 dpi image was acquired of the whole plate on a optical scanner. Each plate was then stored at -80 C under nitrogen until matrix application. A pathologist, Dr. Robert Low, examined each H & E photomicrograph and selected melanoma foci regions of 200 µm in diameter, corresponding to the size of a matrix spot. Each marked H & E image was aligned to its two serial sections on the MALDI target plate image and the pixel coordinate center of each marked spot and 4 fiducials was saved in a.cnt file
42 - 32 -
43 Accurate Cellular Targeting The MALDI target plate was loaded into a Portrait 630 acoustic robotic spotter (Labcyte, Sunnyvale, CA) and the pixel coordinate file uploaded into the Portrait software. Using the four fiducials, the pixel coordinates were translated into matrix printing locations. For each imported printing coordinate, ~180 pl droplets of 20 mg/ml sinapinic acid (SA) in 60/40/0.2 v/v/v acetonitrile/water/trifluoroacetic acid (ACN/H 2 O/TFA) were printed in 6 successive iterations of 10 drops, and allowed to dry between each iteration. The resultant dried matrix spots were approximately 200 µm in diameter. The number of droplets and iterations were translated from optimization experiments performed on a piezo-driven inkjet spotter, the ChIP-1000 (Shimadzu) to maximize both signal intensity and number of peaks. In general, improved protein signal is obtained by using more drops per iteration with fewer iterations, as opposed to fewer drops per iteration with more iterations. This allows additional time for the solvent to extract analyte from the tissue, at the cost of a slightly wider resultant dried matrix spot. To determine the propagated error in the histology directed workflow, an error analysis was performed. Significant translational errors can be introduced when collecting tissue sections and thaw mounting them onto the MALDI plate and glass slide. If the tissue sections are not completely flat, the tissue edges will curl or regions in the center may fold together during thaw mounting. This may result in alignment error between tissue sections on the MALDI plate and to the H&E section. Extreme care is taken to minimize this effect via careful tissue handling as well as adjustments during the alignment process
44 The greatest source of error in the entire process of selecting and spotting matrix occurs during the image overlay of the H&E section with the image of the scanned MALDI plate. The MALDI plate containing the two serial sections to be overlaid is scanned at 2400 dpi (1 pixel = µm) on a flat-bed scanner. Image overlay is accomplished by rigid scaling the H&E image (which contains the selected regions of interest) onto the section on the MALDI plate image. Because the outline of the tissue may fold or tear (both on the glass slide and MALDI target), interior tissue features along with the tissue outline are used for alignment where possible. This alignment error is difficult to measure as each sample is unique, but measurements of internal features show an overall error of 3 pixels or µm or less. After all tissue sections are aligned, the pixel coordinates of all pathologist marked regions of interest and fiducial points are saved as a.cnt file. The final step in the process involves importing the pixel coordinates into the matrix spotter and then printing matrix to these coordinates. The Portrait 630 spotter has an internal scanner that scans the MALDI plate at a maximum of 1200 dpi (20 µm /pixel). The pixel coordinates of the 3 fiducial points on this 1200 dpi image are cursor selected. The software then scales the imported pixel coordinates from the 2400 dpi image to the selected fiducial points. The coordinates of the regions of interest are then scaled based on the fiducial scaling. A single pixel error in selecting the fiducials from the 1200 dpi image results in a potential spot importing error of 21 µm. The final positional error source is from the printing accuracy of the spotter itself. The printing accuracy is calibrated by printing a test array of matrix and aligning the print coordinate
45 with the center of the actual printed spot, which again, is limited to the 1200 dpi pixel size of 21 µm. To calculate the total propagated error from these steps, e 4 = (e 1 2 +e 2 2 +e 3 2 ) 1/2 = ( ) 1/2 = 44 µm. Thus, when the pathologist selects 200 µm regions of interest, he was instructed to allow a 50 µm buffer around the region that contained the same cells of interest. Protein Data Collection and Processing The coordinates of the positions of each dried matrix spot were transferred to an Autoflex II TOF (Bruker Daltonics, Billerica, MA) equipped with a Smart Beam laser. 59 MALDI spectra were auto-acquired from each matrix spot in linear mode using the autoexecute software in Flexcontrol (Bruker Daltonics). The relevant instrument settings were: ion source 1 (20 kv), ion source 2 (18.65 kv), lens (6.85 kv), real time smooth (High), detection (m/z ). A total of 500 spectra were summed for each spot using the Random Walk raster pattern, with no evaluation criteria. These settings were optimized for maximum MS resolution and sensitivity between 5-15 kda, where the majority of protein peaks were detected. The spectral variability in MALDI analyses can arise from several different sources. Variability in matrix crystallization and laser fluency can affect the overall intensity of the final spectra. 59 Robotic matrix deposition used here dramatically reduces matrix crystal variability 56, especially compared to manual matrix deposition,
46 and as a further control, only one matrix solution was made and aliquoted for each MALDI target plate. Laser fluence and number of laser shots were held constant throughout all data acquisition. The laser fluence value chosen was a compromise between detector saturation of the most abundant signals and detection of low abundant signals. Shot-to-shot spectral variability due to crystal variations, detector saturation, laser-beam profile, random noise, and chemical noise is minimized and signal-to-noise is improved by summing a total of 500 laser shots at each matrix spot. Dark-current from the detector (i.e. the signal produced without analyte present) is removed by only accumulating signals above the measured dark current value. Overall intensity variations, mass shifts, and the high background noise in the baseline of the low mass range are adjusted for by spectral processing using total-ion current (TIC) normalization, internal calibration, and baseline subtraction using ProTSMarker (Biodesix, Steamboat Springs, CO) and ClinProTools (Bruker), see chapter 3. After accounting for the systematic and random error from both sample preparation and data acquisition, we can confidently assign spectral changes as a result of differences within the tissue region probed. Spectral changes observed in peak intensities or the presence/absence of peaks are a direct consequence of the analytes in that region
47 Enzymatically Altered Protein Acquisition of FFPE Tissue Formalin fixed paraffin embedded (FFPE) tissue microarrays (TMA) have been used to archive various tissue samples. Formalin preserves the tissue by extensive chemical cross-linking between proteins and effectively halts postmortem enzymatic 61, 62 proteolysis. Fixation preserves the tissue architecture and morphology, allowing fixed tissues to be stored for decades usually in paraffin. During fixation, formaldehyde causes the formation of unstable hydroxymethyl groups, which react with other amino acid groups forming methylene bridges, predominantly with arginine, tyrosine, and lysine. A reversal of the chemical cross linking, termed antigen retrieval, is accomplished by heating in a buffer solution. 62 High density arrays of numerous tissues can be constructed by arranging cores of various tumors into a paraffin block. These tissue microarrays (TMAs) can contain several hundred unique tissues in a single block, making them ideal for high throughput analysis of large cohorts. Intact protein analysis of formalin fixed tissues remains largely unviable for MALDI MS due to insufficient control of and limited understanding of the antigen retrieval process. 62 This is due to the high level of mass specificity obtainable with current MS instrumentation, where proteins are often measured with 1 Da mass accuracy and the various fixation reactions and side reactions coupled with incomplete reversal make protein correlation and identification by intact mass all but impossible. Recently, MALDI IMS has been adapted to investigate peptide profiles of FFPE TMA s by enzymatic digestion prior to MALDI analysis. 63 Here we detail the protocol used to acquire peptide profiles from formalin fixed melanoma TMA s and full size fixed
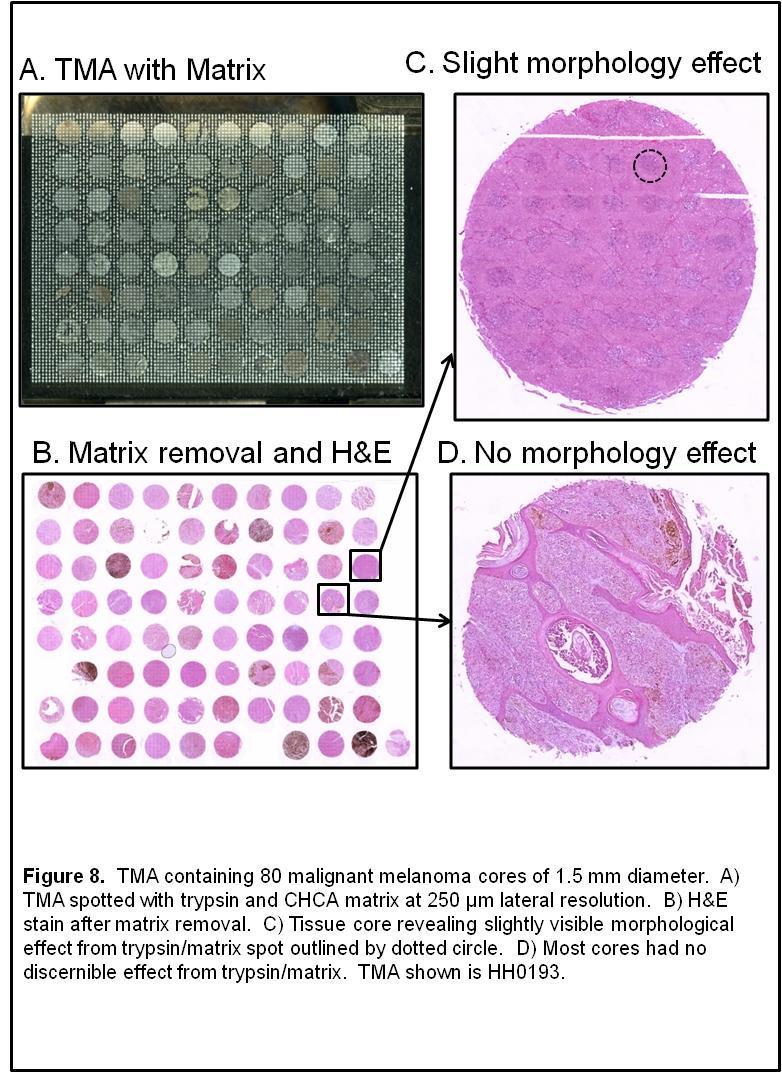
48 tumors. While a histology-directed approach is viable, the TMA is already in a high density array, and thus more effectively sampled by simply placing a trypsin array across the cores. FFPE Tissue Preparation Two 80 core FFPE TMA s were acquired from Folio Biosciences containing primary and metastatic melanoma and normal skin (ARY-HH0086 and ARY-HH0193). Each core was 1.5 mm in diameter and fixed in 10% buffered PBS neutral formalin for 24 hours, dehydrated with gradient ethanol, cleared with xylene, and embedded in paraffin. All samples were mounted onto ITO-coated conductive glass microscope slides. Tissues were first deparaffinized by a series of xylene and ethanol washes as follows. The tissue was twice immersed in 100% xylene for 3 minutes, followed by successively lower ethanol washes of 100%, 95%, 70% for 1 min each. Finally, the tissue was twice hydrated in pure H 2 O for 3 minutes. Antigen retrieval was accomplished by pressure heating the slides in a 10 mm Tris buffer solution for 20 min at 95 C. The slides were cooled to room temperature and a series of four dilutions to 100% H 2 O was used
49 On Tissue Digestion Proteins were digested into peptide fragments using the basic procedure outlined by Groseclose et al. 63 Trypsin Gold-Porcine (Promega, Madison, WI) was diluted to 1 µg/µl in 50 mm acetic acid, divided into 100 µl aliquots, and stored at -20 C until use. Trypsin aliquots were activated by addition of 500 µl of 100 mm ammonium bicarbonate (AMBIC) and 60 µl acentonitrile (ACN), bringing the trypsin concentration to 150 ng/µl. The matrix solution was immediately put into the Portrait 630 and spot deposited across the TMA/tissue. The trypsin solution was deposited in 1 drop iterations at 250 µm lateral spacing over 40 repeats. For the TMA, the tryspin array was roughly 110 x 80, allowing more than 15 minutes between repeats. Smaller arrays will require at least 3-4 minutes between repeats to allow adequate drying times. It should be noted that, unlike traditional in-solution tryptic digestions, on-tissue digestion does not reduce and alkylate, meaning the cysteine disulfide bonds will remain intact. After 40 iterations, the TMA was placed into a humidity chamber at 37 C overnight. This incubation period significantly improves the digestion of skin and melanoma samples. After incubation, the TMA was re-inserted into the Portrait 630 and the reagent changed to 10 mg/ml CHCA matrix in 50/50/0.5 v/v/v H 2 0/ACN/TFA. The matrix solution was printed across the same array using 1 drop iterations of 50 passes, where the matrix was placed exactly onto the digested spots. Overnight incubation of the trypsin prior to matrix application was compared to no incubation using serial sections of TMA HH0193, Figure 7. In general, the peptide
50 spectra of overnight incubation showed 30-50% more peptides compared to no incubation. This gives ample time for the trypsin to further digest proteins in the TMA
51 - 41 -
52 Peptide Data Collection and Processing Three corners of the printed matrix array were used to calibrate the positions of each dried matrix spot in an Ultraflex II reflectron TOF (Bruker Daltonics, Billerica, MA) equipped with a Smart Beam laser. MALDI spectra were auto-acquired from each matrix spot in reflectron mode using the auto-execute software in Flexcontrol and FlexImaging (Bruker Daltonics). The relevant instrument settings were: ion source 1 (25 kv), ion source 2 (23 kv), lens (6.85 kv), reflectron 1 (29 kv), reflectron 2 (24 kv),real time smooth (off), detection (m/z ). A total of 1000 spectra were summed for each spot using the Random Walk raster pattern, with no evaluation criteria. The laser fluence was optimized for S/N and held constant through all acquisitions. Similar adjustments for dark current, matrix crystal variations, and intensity variations were implemented as in the intact protein analysis. TIC normalization, alignment, and peak detection were done using FlexAnalysis and ClinProTools software packages (Bruker Daltonics, Bellira, MA). Matrix was removed from the TMA and whole tissue sections using two 95% ethanol washes. The TMA was then stained using H&E. Although slight tissue morphology disruptions were observed from the MALDI IMS procedure, the majority of the tissue remained intact and was sufficient for histological analysis. Spectra collected from tumor regions were grouped and separated from non tumor regions for biomarker analysis
53 - 43 -
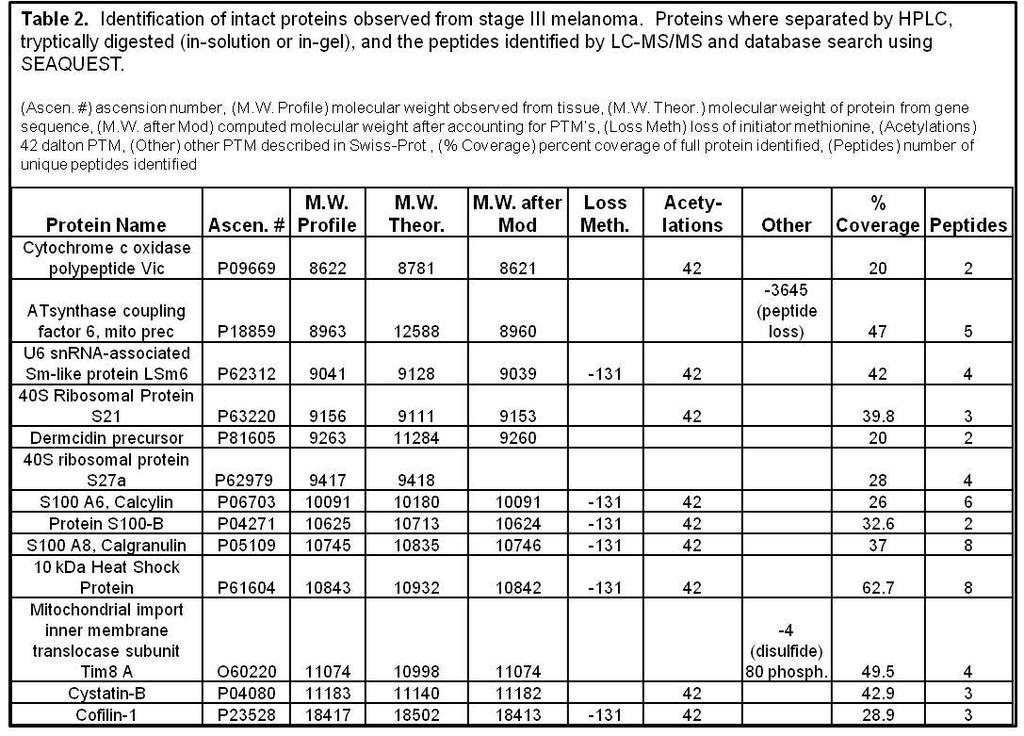
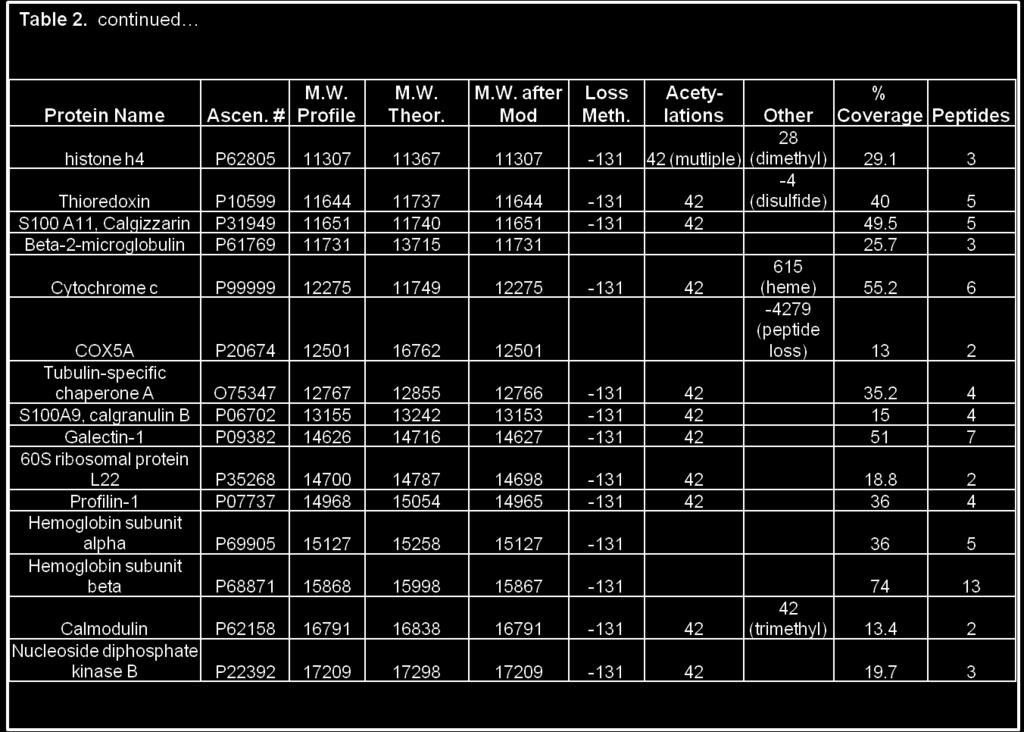
54 Protein Identification LC Separation and Digestion of Intact Proteins MALDI MS produces mass specific data of the intact protein species; however, the m/z alone is often not sufficient to positively identify the protein, as the biologically active protein may have undergone post-translational modifications. Robust protein identification is routinely achieved through protein separation/isolation, proteolytic digestion, sequencing of peptides by LC MS/MS, and matching the peptides to genomebased protein databases. The MALDI peaks confidently identified using this strategy are shown in Supplemental Table 2, with the unique peptides found and % coverage, and the PTM s that result in the final biologically observed mass. The results show that this workflow was suitable for many of the proteins above ~9 kda. Proteins of MW < 6 kda are difficult to identify from a complex mixture on a 1-D gel or identify by directly digesting the mixture due to the low number of observable peptides generated. Proteins were identified using an adaptation of the procedure previously 44, 64 outlined. A sample of tissue (~50 mg) was mechanically homogenized in 1 ml of TPER (Pierce) solution on ice and the soluble protein concentration determined using a Bradford analysis and diluted to 200 mg/ml in 98/2/0.1 H 2 O/ACN/formic acid (FA). The mixture was separated on a Vydac C8 RP HPLC column, using a 96 minute gradient flowing at 0.5 ml/min. Fractions were collected every minute on a 96-well plate and dried. The 96-well fractions were reconstituted in 5 µl of 60/40/0.2 v/v/v ACN/H 2 O/TFA and 1 µl from each well was spotted onto a MALDI target plate. SA matrix (20 mg/ml
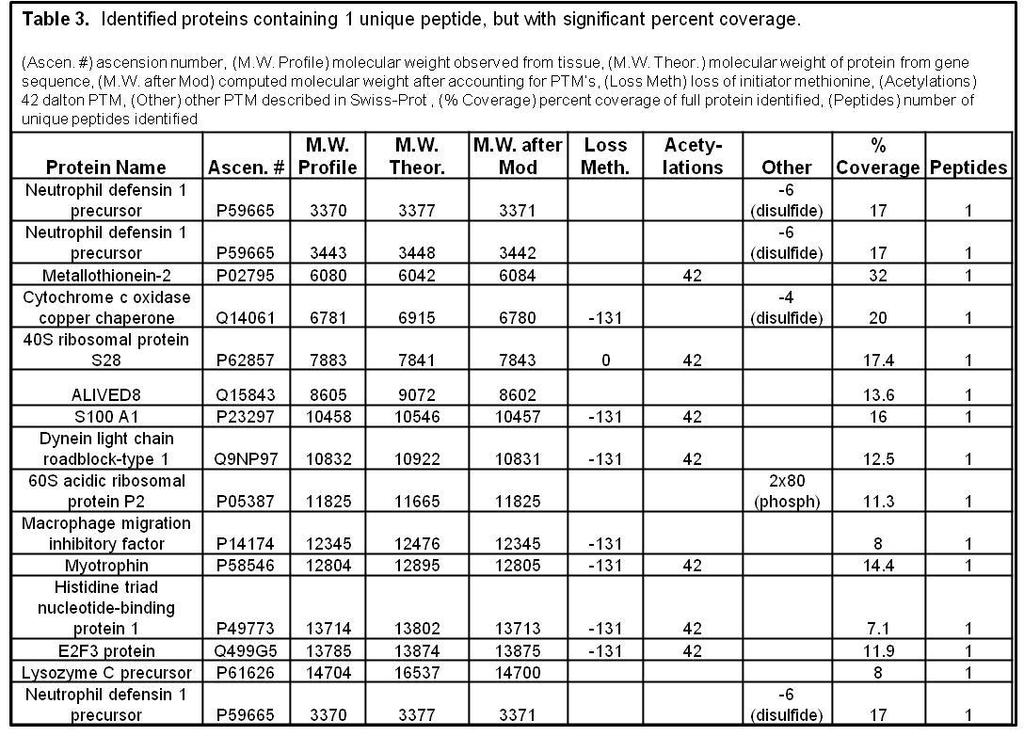
55 60/40/0.2 v/v/v ACN/H 2 O/TFA) was mixed on the MALDI target plate and allowed to dry and then analyzed on an Autoflex II linear TOF in an autoxecute mode. The fractions that contained protein peaks of interest (i.e. with m/z values matching those observed from tissue) were further purified on a tricine gel (Pierce, Rockford, IL), the bands excised, in-gel digested with trypsin (Promega, Madison, WI), and the peptides analyzed by nano-hplc MS/MS using a C18 capillary column attached to an HCT ion trap (Bruker Daltonics, Billerica, MA). Results were searched using the ipi-human database on SEQUEST and proteins containing at least 2 unique peptides or more than 15% sequence coverage were considered positive. Modifications, including removal of initiator methionine, N-terminal and interior acetylations, disulfide bridges, and signal peptide removal, were accounted for to derive the final biological mass observed on tissue. Proteins identified with two or more unique peptides are shown in Table 3. Several proteins were identified by a single peptide comprising a significant portion of the protein and are provided here as highly probable ID s and a basis in future identifications, Table
56 - 46 -
57 - 47 -
58 - 48 -
59 Top-down Intact Proteins by MALDI TOF/TOF Several low-molecular weight proteins were identified without LC separation 65, 66 using a MALDI TOF/TOF top-down approach. To improve sensitivity, a small section of tissue was homogenized in 60/40/0.2 v/v/v ACN/H 2 O/TFA and immediately spotted onto a MALDI target plate. DHB matrix (40 mg/ml in 50/50/0.2 MeOH/H 2 O/TFA) was mixed with the solution on plate and allowed to air dry. SA and α- cyano matrix were tested, but were not as effective in isolating and fragmenting intact parent ions (data not shown). Linear MS spectra from the tissue homogenate were compared to the spectra obtained by direct tissue MALDI analysis to ensure homology. Proteins of interest were isolated and fragmented directly from the complex protein mixture using an Ultraflex II TOF/TOF (Bruker Daltonics) in LIFT mode. Resultant MS/MS spectra were searched using MASCOT from the BioTools software (Bruker Daltonics) with variable modifications of N-terminal acetylations and identifications with extensive homology considered significant. An example of the top-down MALDI fragmentation and identification from a complex mixture is shown in Figure 6, where m/z 4748 was isolated, fragmented, and identified as a cleaved form of thymosin β-4 that lacks the 2 C-terminal amino acids. The close proximity signal m/z 4737 was likewise isolated, fragmented, and identified as a thymosin β-10 with the 2 c-terminal amino acids absent. Full forms of TYB4 (m/z 4964) and TYB10 (m/z 4936) were also isolated, fragmented, and identified. In the
60 case of the ions representing proteins with 2 C-terminal amino acids removed, the protein database did not display this modification
 MALDI spectra of tissue homogenate, with in-source LIFT cell isolation of m/z 4748.")

61 Figure 9. Top-down identification of m/z 4748 (mono-isotopic m/z of 4745) by MALDI TOF-TOF. A) MALDI spectra of tissue homogenate, with in-source LIFT cell isolation of m/z B) MALDI MS/MS spectra of m/z The protein was identified as thymosin β-4 with the 2 c-terminus amino acids missing. The final MW is given by: 5053 M (131) ES (277) + Acetylation (42) = 4748 Da)
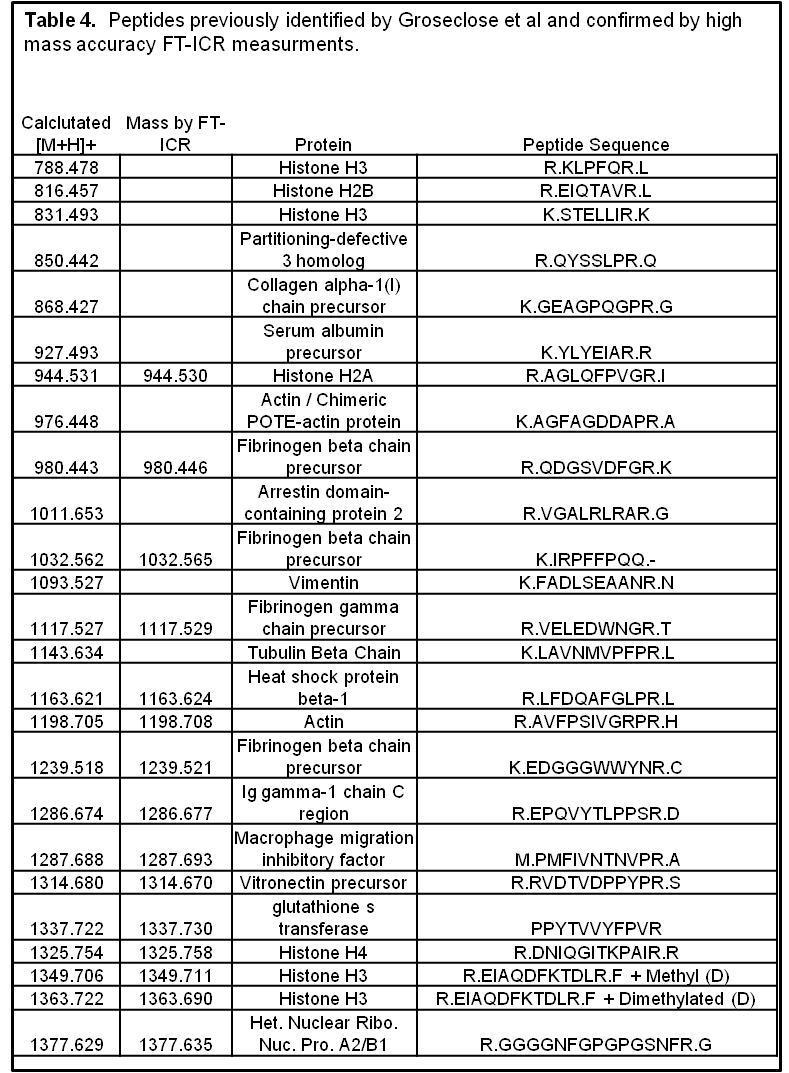
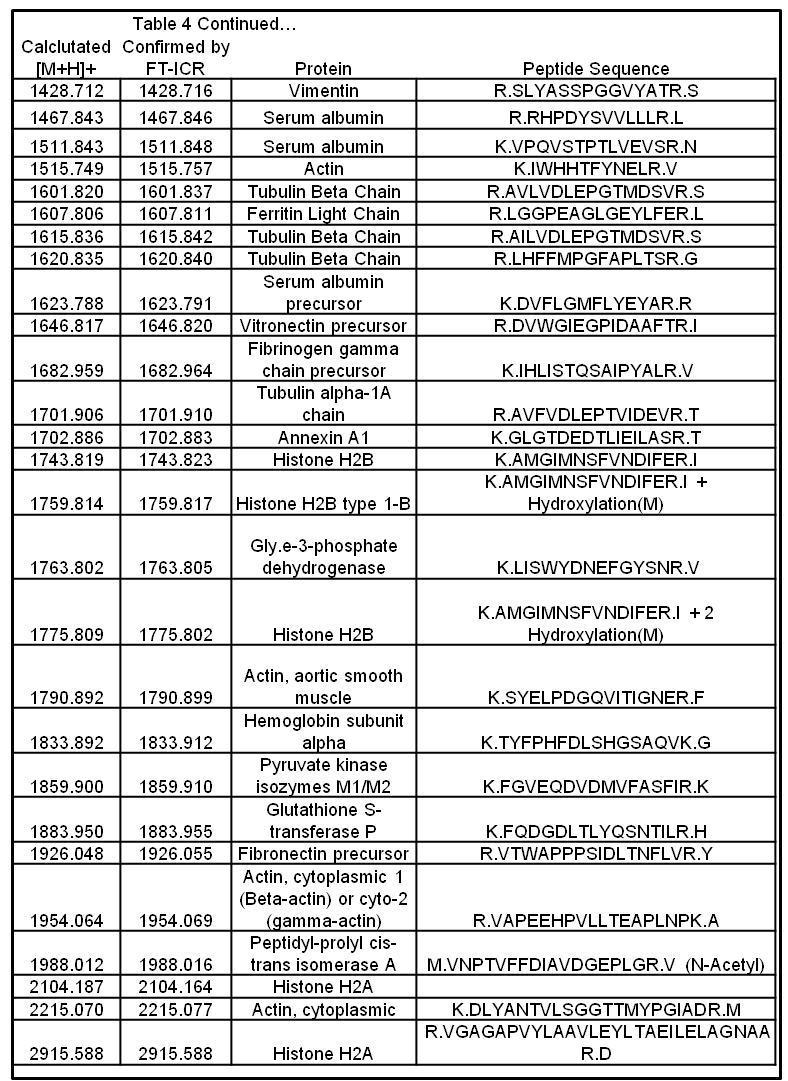
62 Identification of Peptides from FFPE TMA s Several peptides from human FFPE TMA s were previously identified by Groseclose, and here, were confirmed by accurate mass MALDI FT-ICR MS (Apex, Bruker Daltonics, Table 4. Additional peptides from the on-tissue digestions were identified in a similar manner to the top-down tandem MALDI using both alpha-cyano and DHB matrix spots, Table 5. Isolation and fragmentation of ions was performed directly from the TMA, in contrast to a spotted homogenate. In searching MASCOT, collagen peptides contain numerous hydroxylated proline groups and the variable modification was included
63 - 53 -
64 - 54 -
65 - 55 -
66 CHAPTER III INTACT PROTEIN CHARACTERIZATION OF STAGE III MELANOMA LYMPH NODE METASTASES BY MALDI IMS Patients with melanoma metastatic to the regional lymph nodes exhibit a range in tumor progression, survival, and treatment. Current approaches to stratify patients with this stage of disease are predominantly clinical and histological methods. Molecular classification thus far has focused almost exclusively on genetic mutations. In this study, proteomic data from 69 melanoma lymph node metastases and 17 disease free lymph nodes acquired by histology-directed MALDI IMS were used to classify tumor from control lymph node and to molecularly sub-classify patients with stage III disease. From these data, 12 survival associated protein signals and 3 recurrence-associated signals in the acquired mass spectra were combined to generate a multiplex molecular signature to group patients into either poor or favorable groups for recurrence and survival. Introduction Despite continued research and increased public awareness, melanoma accounted for an estimated 62,000 new cancer cases and 8,400 deaths in 2008 in the U.S. 4 Melanoma arises from melanocytes, the melanin (pigment) producing cells found in the
67 skin. Melanocytes occupy the basal layer between the dermis and epidermis, and are normally singly distributed with each melanocyte surrounded by multiple keratinocytes. Melanocyte growth and production of melanin upon exposure to ultraviolet light (UVL) is tightly regulated by these surrounding keratinocytes via highly structured dendritic 5, 67 processes. Tumorigenesis of the melanocytes requires independence from keratinocyte regulation and the suppression of pro-apoptotic and anti-proliferative pathways. 68 Staging of melanoma was established by the 2002 American Joint Committee on Cancer (AJCC) Melanoma Staging Committee and is determined by the depth of the primary tumor, ulceration, and presence or absence of regional lymph node (Stage III) or distant metastasis (Stage IV). 12, 13 Early stage melanoma is easily diagnosed and highly curable, but late stages are resistant to therapy with survival rates often below 15%. 14 The first line of treatment for all stages of melanoma is surgical resection, when feasible. In advanced cases, systemic treatment with α-interferon or dacarbazide, or high-dose interleukin-2 are used, although response rates are low, toxicity is high, and 14, 69, 70 long-term survival benefits are limited. The significant variability in survival of patients with stage III melanoma (24-70% 5- year survival) points to an insufficient understanding of the heterogeneity of the disease. Clinical and pathological prognostic factors for survival of patients with stage III disease include tumor thickness, ulceration and mitotic rate of the primary tumor, and the number and size of involved lymph nodes. These factors, however, offer limited biologic or mechanistic understanding of the disease. So far, molecular classification of melanoma has largely focused on identifying genomic mutations. 71 Several mutations
68 among key cell signaling pathways have been shown in metastatic melanoma, including BRAF 15 22, 72 and NRAS of the MAPK pathway, CDKN2A, and APAF-1. However, proteomic based molecular classification, which provides information about relative protein abundances and post-translational modifications (PTM s), is largely missing. Here, histology-directed MALDI IMS has been used to identify proteins found in 69 lymph nodes involved by metastatic melanoma and 17 control lymph nodes free of tumor. From the proteomic signatures obtained directly from the tissue, a molecular classification of tumor and control lymph tissue was generated that could differentiate normal and malignant tissue. In addition, lymph node metastases from 62 patients with stage III melanoma were analyzed to identify proteins associated with survival and recurrence. The protein signatures that correlate with these outcomes were confidently identified. Beyond diagnostic and prognostic value in assessing melanoma progression, these protein signatures may provide valuable insights in the choice of optimal treatment strategies for individual patients. Distinguishing and Classifying Control LN and Stage III Melanoma by Protein Signatures In determining proteomic differences between cancer free lymph nodes and tumor regions infiltrating lymph nodes, two goals were outlined:
69 Goal 1: Determine protein expression differences between stage III tumor infiltrating lymph nodes and control lymph node Goal 2: Develop molecular classifiers to accurately distinguish tumor from control Each goal incorporated related, but unique software and statistics approaches for peak detection and processing. It is important to note that the same raw data was used for both analyses. Protein Expression Differences between Control LN and Tumor For this workflow, raw data was converted and processed for incorporation into a significance analysis of microarray (SAM) package. Raw data was first exported from the Bruker data format to two column.txt files using in-house software. The summed spectra from each matrix spot were pre-processed individually using ProTSMarker (Biodesix, Steamboat Springs, CO). The program performs baseline subtraction, spectral smoothing, peak alignment, peak detection, and total-ion current (TIC) normalization using user input values across the entire m/z range to improve the local estimation and is an updated version of the software previously described. 73 Each spectrum was first pre-processed using input data from 31 peaks ranging from m/z that were present in >95% of spectra. The FWHM of each peak was measured, and a multiplied by 4 and 10, per the manufacturer s recommendation, for baseline and smoothing for input into ProTSMarker. The software then uses those values for smoothing, baseline subtraction, peak detection, and spectral alignment specific to those mass ranges
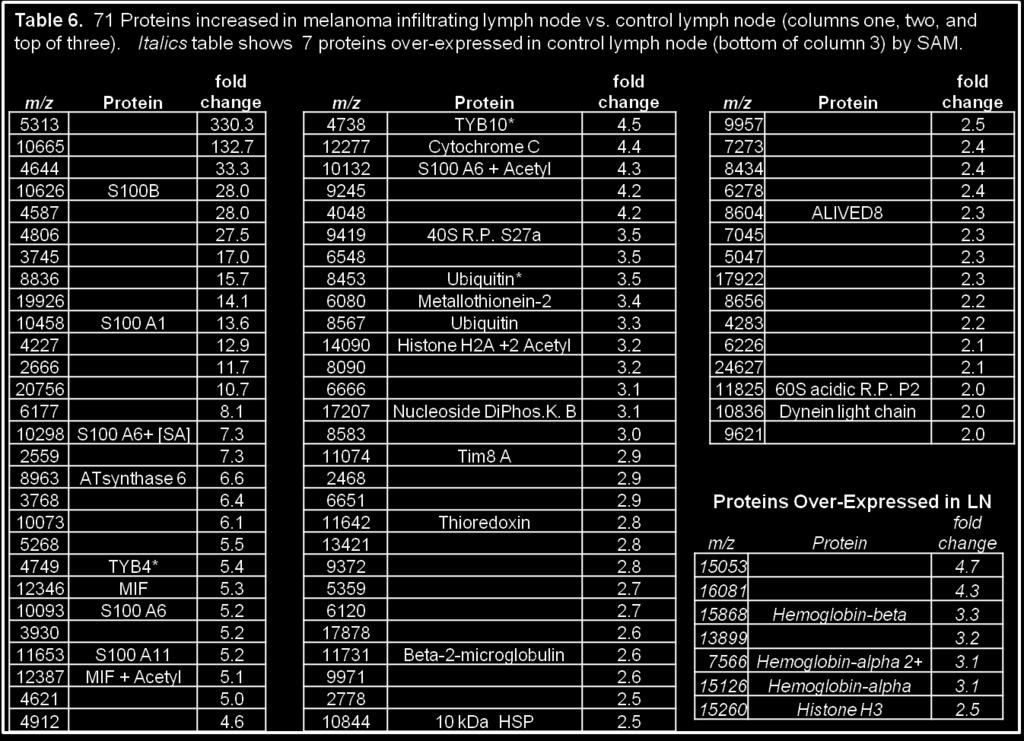
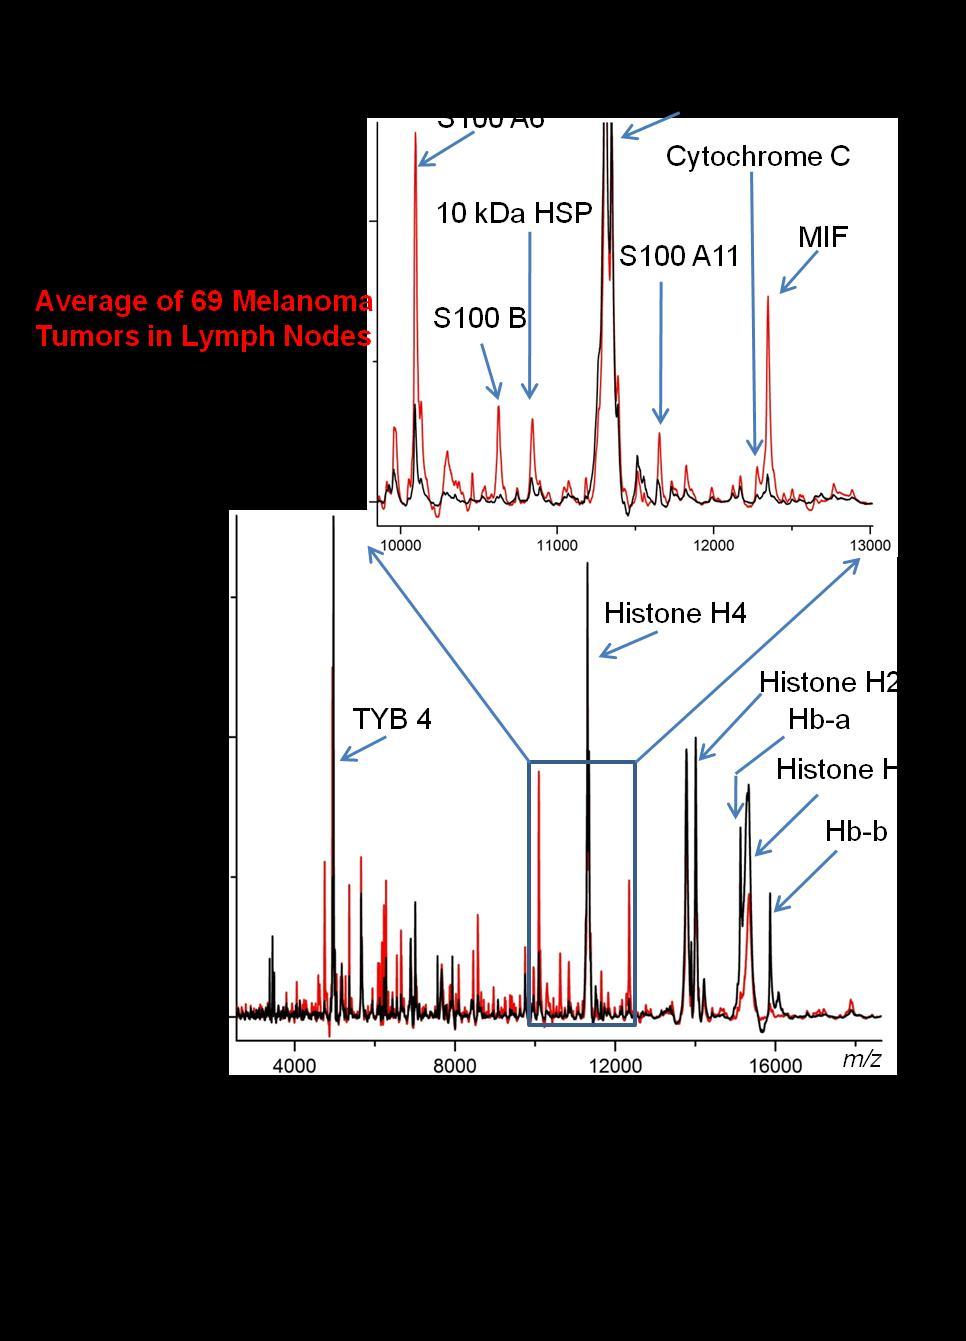
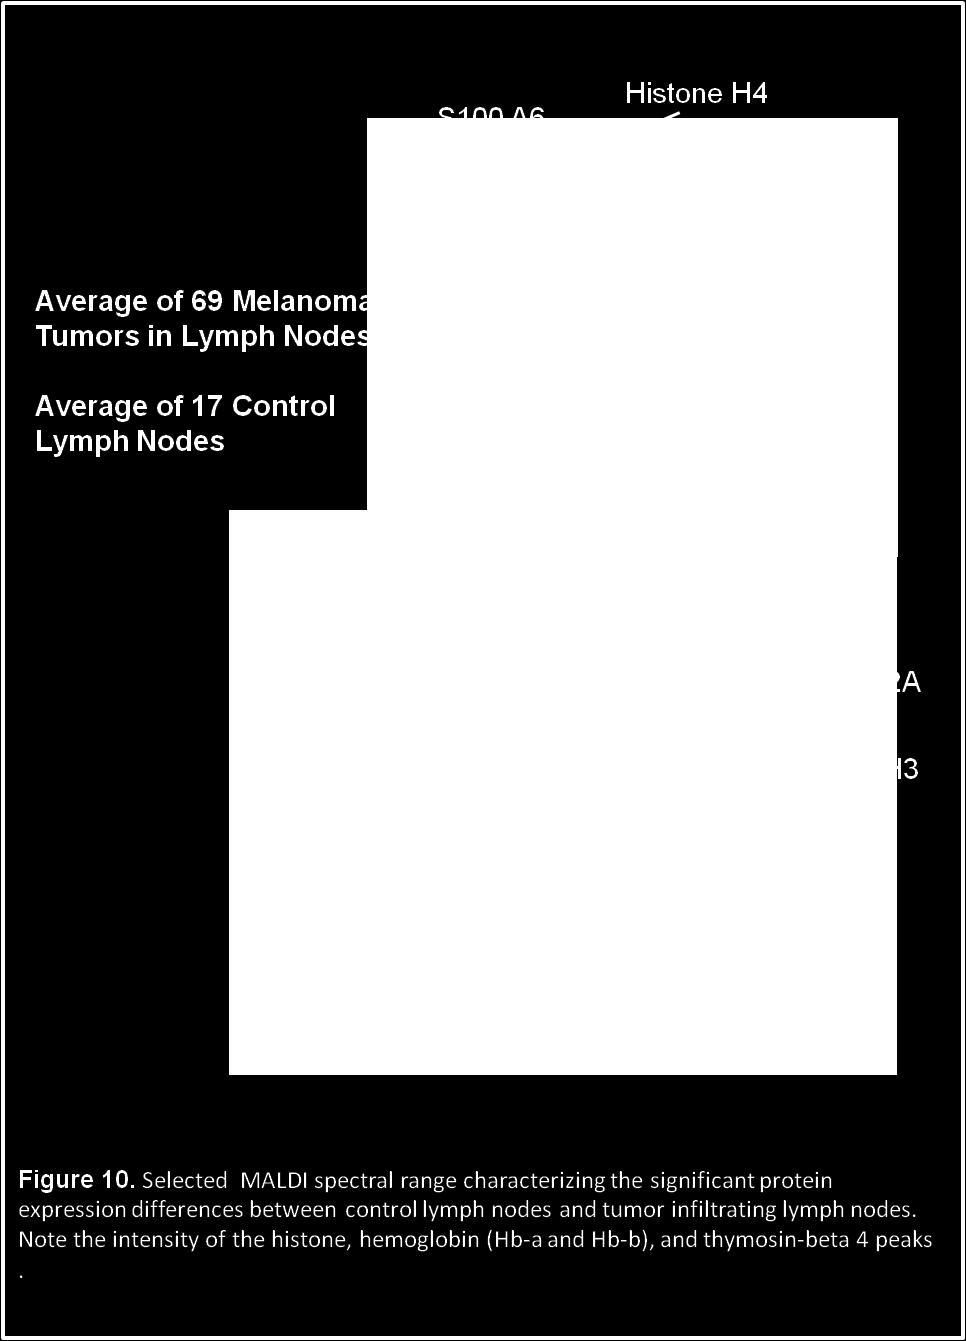
70 Outlying spectra of low signal-to-noise, spectra with less than 30% of peaks present, or spectra dominated by hemoglobin (m/z 15,127 and 15,865) were removed. The remaining processed spectra were averaged within each patient to generate a single representative spectrum composed of >15 discrete matrix spots (melanoma specific regions) from each patient. Post processing of the averaged spectra used centroid peak detection and area under the curve (AUC) measurements to generate a feature table containing all patients, each protein, and the AUC of each for the entire cohort. Data was collected for analytes up to 70 kda, with observable high molecular weight peaks corresponding to 42, 53, and 66 kda (tentatively assigned as actin, vimentin, and albumin). However, generally above m/z the number and intensity of peaks observed was not sufficient to reliably judge a significant change in expression, and thus features above this m/z were excluded. The averaged spectra were used in the SAM and survival statistical analysis. The peak detection algorithm of ProTSMarker detected a total of 155 protein features in the m/z range The feature table was evaluated using a 2 class SAM test. Protein peaks that differed by more than 2-fold area under the curve (AUC) with a false-discovery rate (FDR) of (p=0.001) were considered significant. The SAM results showed 71 protein peaks that exhibited at least a 2-fold intensity difference between control LN and melanoma lymph node metastases. A spectral view of the results is shown in Figure 10 and a complete list of all significant proteins in Table
71 - 61 -
72 Both tissue types consistently display intense peaks at m/z (histone H4), m/z (histone H2A), and broad peaks at m/z (histone H2B) and m/z (histone H3) (Figure 2). The four histone species form the chromatin complex that organizes DNA in a highly ordered, compact form. Modifications to the histone species, specifically acetylations and methylations, are a highly regulated process that controls 74, 75 the accessibility of chromosomal regions and to the transcription machinary. Multiply acetylated forms of histone H4 (m/z 11307, 11349, and 11391) and H2A (m/z 14007, 14049, and 14091) are easily distinguishable, but the H2B and H3 histones are observed as broad, unresolved peaks, no doubt due to multiple isoforms and methylations. The histone H3 peak displayed significantly higher intensity in the control LN and the triply acetylated histone H2A at m/z was significantly different between the groups with a 2.4-fold increase in the tumor spectra
73 - 63 -
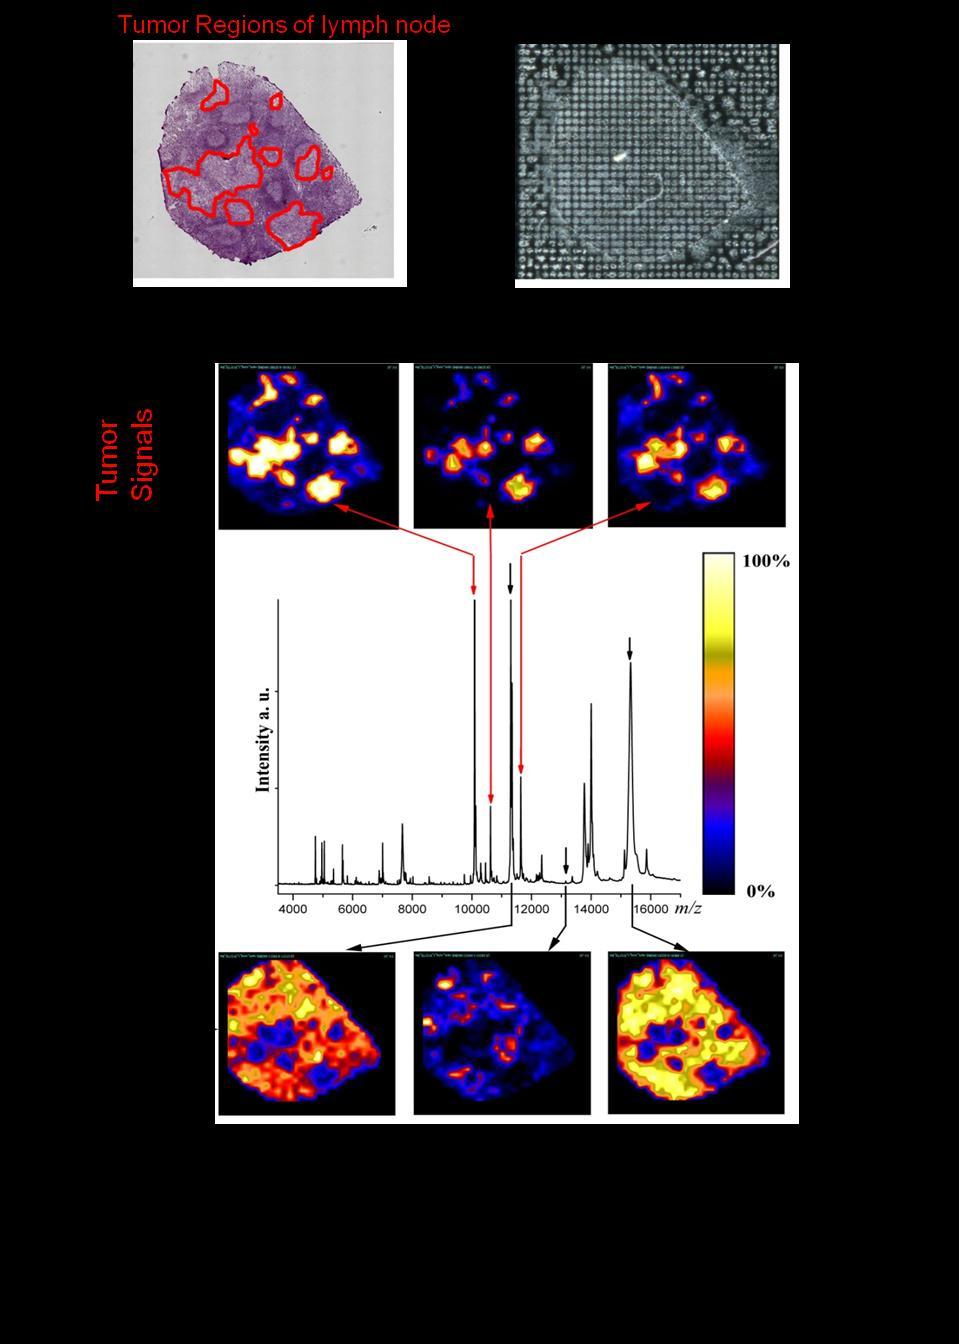
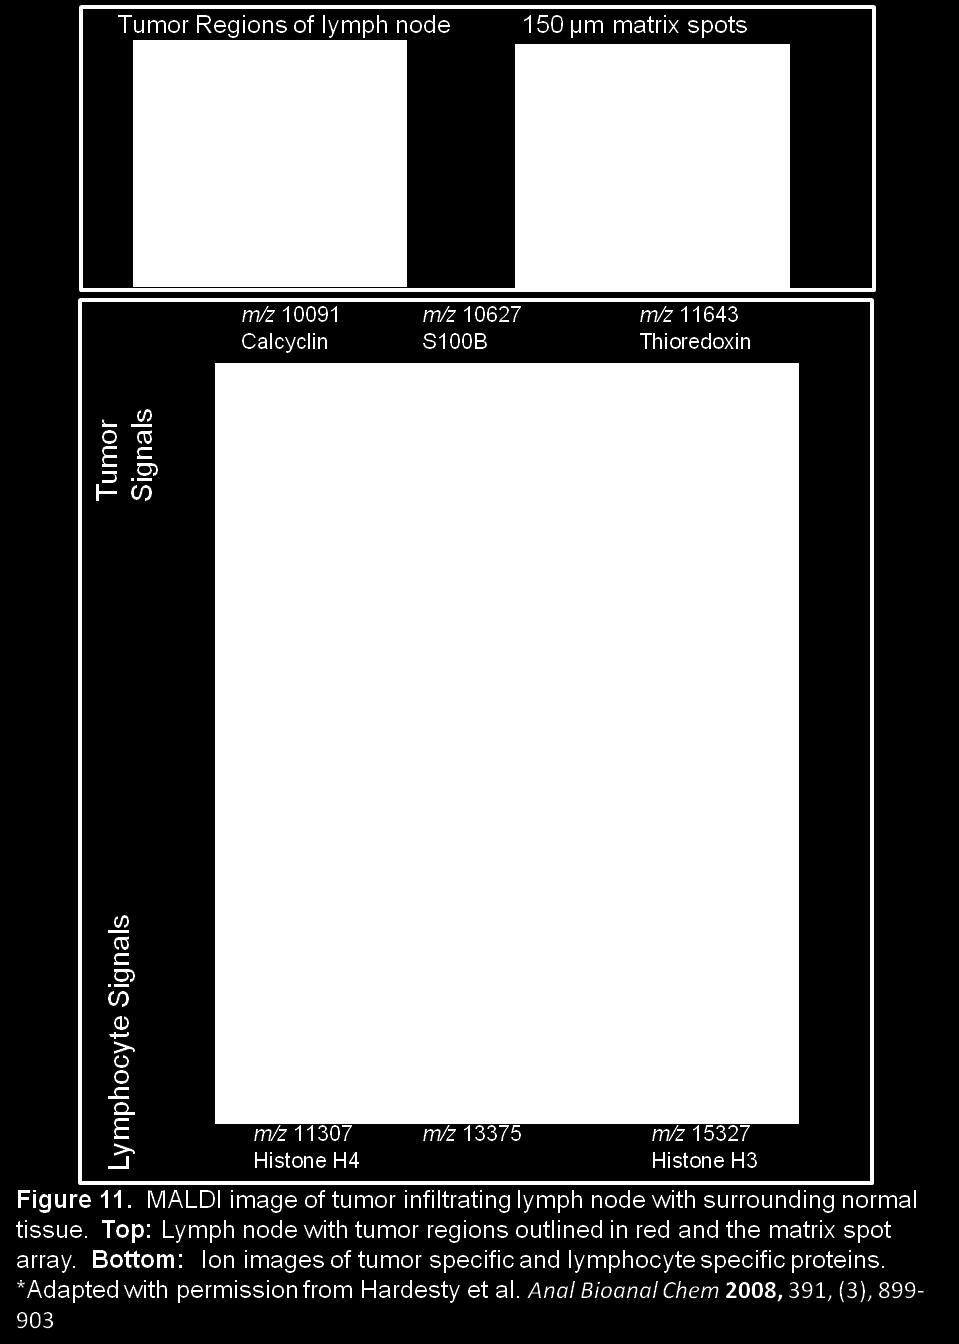
74 Proteins peaks observed at higher intensity in the tumor regions included several S100 calcium binding proteins (S100 A6, S100 A11, S100 B), macrophage migration inhibitory factor (MIF) involved in immune response and inhibition of p53 mediated apoptosis 76, heat shock protein 10 kda 1 (HSP10) that is involved in regulating protein folding with HSP60 and in increasesing the anti-apoptotic Bcl-xl and Bcl-2 proteins 77, and the antioxidant thioredoxin 78. Measurements of high levels of MIF and HSP10 suggest activation of cell survival pathways. Few melanoma tumor biopsies contained significant portions of surrounding lymph node tissue. These were imaged by traditional MALDI IMS and displayed the majority of significant protein differences between the tissue types, Figure 12. Although only 2 histone species were significant by 2-fold intensity from the SAM analysis, all 4 histone peaks consistently displayed higher intensity in control lymph node and tumor adjacent lymph node compared to melanoma foci regions
75 - 65 -
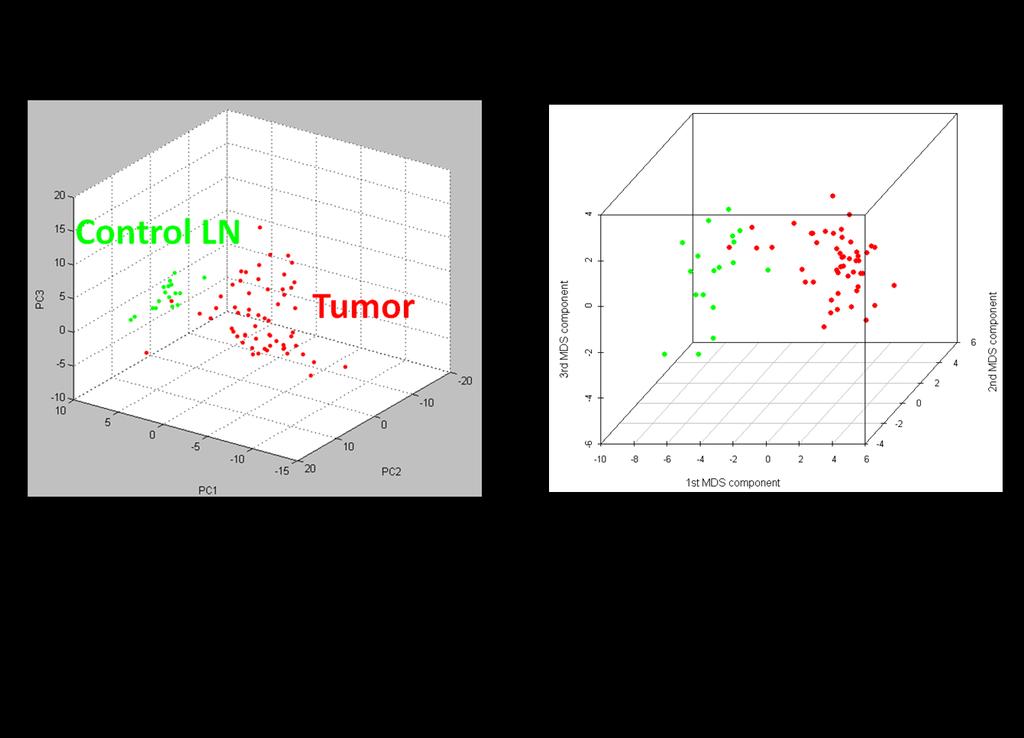
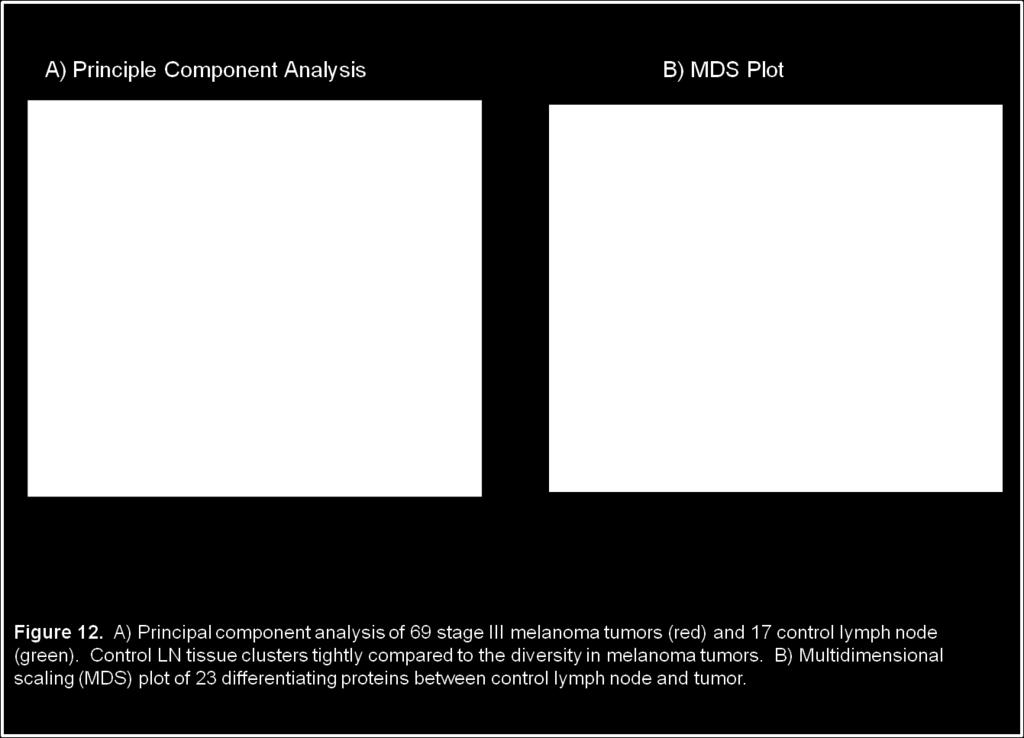
76 Molecular Classifiers of Control LN and Tumor Beyond describing individual protein variations between the groups, the protein signatures were used to generate classification models to accurately distinguish each tissue type (Figure 3). The ClinProTools software (Bruker) package was utilized for spectral smoothing, baseline subtraction, peak detection, alignment, and TIC normalization. Unlike ProTsMarker, ClinProTools uses general processing parameters that apply to the entire mass range. This significantly increases usability and ease of use at the cost of high customizability. Again, outlying spectra of low signal-to-noise, spectra with less than 30% of peaks present, or spectra dominated by hemoglobin (m/z 15,127 and 15,865) were removed. From the ClinProTools software, Principal Component Analysis (PCA) and 4 classification models were used to differentiate the two groups. The PCA simplifies multidimensional data by combining similar or redundant information into fewer variables (usually 3). 79 In this case, each protein or m/z is an independent variable generating a data set of m-dimensions. The PCA will plot the dataset in m-dimensional space and generate orthogonal vectors that maximize the data spread or variance. Here, the top 3 vectors or principal components are used to plot the dataset in 3D space, graphically displaying the spread in groups, Figure 12 A. The variation across the tumor samples compared to the compact distribution of the lymph nodes is visually represented. This result was compared to a multidimensional scaling (MDS) plot of the top 23 discriminatory peaks from the SAM analysis, Figure 13 B. In this procedure, the dimensionality is reduced from 23 to 3, where the distance in 3D space is proportioinal to the distance in 23D space
77 - 67 -
78 Molecular classification between the control lymph node and lymph node infiltrated tumor were generated using 4 models in the ClinProTools software: Genetic Algorithm (GA), Support Vector Machine (SVM), Supervised Neural Network (SNN), and Quick Classifier (QC). Each model selects and weights a combination of protein peaks that provide high distinguishing ability between the two groups and are briefly described. The genetic algorithm derives from evolutionary survival in which the best peak clusters are combined into a new feature and the poor clusters are discarded. This process is iteratively repeated until the optimal peak combination is found. 80 The SVM algorithm generates a plane that optimally separates two data sets. Peaks are ranked by their ability to separate into either side of the plane and the top peaks selected [V. Vapnik, "Statistical Learning Theory", Wiley and Sons, New York, 1998]. The SNN algorithm maximizes the distance of multiple local peak clusters specific to each group, as opposed to 2 clusters in SVM. Clusters that provide greater separation are prioritized over those with low separation [B. Hammer, M. Strickert and T. Villmann "Supervised Neural Gas with General Similarity Measure", Neural Processing Letters 21 (1), (2005)]. Finally, the QC algorithm generates an average spectrum for each group with weighted p-values for each peak. Based on the peak weights, spectra are categorized into either group along with a likeliness value. The result of each model is shown in Table 10. Each of the classification models showed a high recognition capability, the lowest still recognizing and correctly classifying nearly 90% of the patients. In all cases, 100% of control LN samples were correctly identified and the wrong recognition was from the tumor samples. This missed classification can be visualized in the PCA where some of the tumors appear close to
79 the LN region. The robustness of each model was additionally evaluated by crossvalidation (20% leave out, 10 iterations), with results very near the original recognition. Table 7. Recognition capability of 4 classification models to distinguish melanoma and control lymph node. Cross-validation comprised 10 iterations of 20% leave out
80 Correlating protein changes to patient survival and recurrence Proteomic data from the histology directed MALDI IMS workflow was additionally used to determine markers of tumor aggression. Patient survival and time to recurrence information were used as markers of tumor aggression. Towards this end, two goals were outlined: Goal 1: Determine individual proteins that correlate with patient survival and disease recurrence and investigate their biologic role. Goal 2: Develop models from the protein data to accurately group patients by their clinical outcome. Training and Test Set The feature table used in the SAM procedure containing AUC of each protein across the cohort was used in the survival and recurrence analysis. Of the original 69 lymph node metastases, 7 patients were treated for palliative reasons and excluded. Melanoma biopsies were acquired in two batches, the first comprising the training set and the second the test set, Table 8. Individual proteins associated with survival and time-to-recurrence in stage III melanoma lymph node metastases were first determined in the training set by using a univariate Cox-proportional hazard (CPH) model 81, with an individual p-value of less than 0.05 considered significantly associated
81 The Cox proportional hazard model is a sub-set of survival plots that deal with identifying hazardous features that are related to the likelihood of dying. In this model, the hazard function is a result of multiplicative covariants (i.e. features) and is given by H[(t), (X 1, X 2,..., X m )] = h 0 (t)*exp(b 1 *X b m *X m ) where the hazard value h at time (t) is a function of the covariants (X 1 X m ) and h 0 (t) is the baseline hazard. The value of this model is that the baseline hazard h 0 (t) need not be known or defined fully. In applying this model to proteomic data, each protein feature can be examined as an independent covariant. By dividing two hazard functions with only one variable increasing we obtain a hazards ratio for that particular covariant. For example, if we compare the hazard ration of λ 1 at X 1 and λ 2 at X 1 +1of b 1 where: λ 1 = h 0 (t)*exp(b 1 *X 1 + b 2 *X b m *X m ) λ 2 = h 0 (t)*exp(b 1 *(X 1 +1) + b 2 *X b m *X m ) then the hazard ratio λ 1 /λ 2 = exp (b 1 ), when all the other values are fixed. Each protein signal can be examined as a covariant along with other standard covariants (age, sex, gender, treatment, etc). This gives us a ranking of protein intensities of increasing association to the hazard function, i.e. survival time. The analysis was performed using the freeware R program (Version 2.10), and the source code along with a description of each line is provided for reference. Of the 155 proteins detected in the training set, 7 were significantly associated with patient survival and 2 with recurrence (p < 0.05, Table 8).The significant proteins were weighted by their univariate predictive ability and combined into a single compound predictor (CP), for both survival and recurrence, with m/z (p = 0.056) included to allow at least 3 proteins for a recurrence compound predictor
82 Table 8. Patient stage III melanoma biopsies were received and analyzed as 2 different cohorts for training and test sets (A). Protein data from each patient biopsy was collected by histology directed MALDI IMS. A CPH model evaluated each protein individually in the training set to determine proteins associated with survival (B) and recurrence (C). Poor effect denotes a worse patient prognosis as the protein intensity increases, and likewise, favorable denotes a better prognosis as the protein intensity increases. *Indicates protein form observed has a c-terminal truncation
83 Patients in the training set were ranked by their CP score and a division by CP scores of poor (Med. Survival/Recurrence < 12 months) and favorable (Med. Survival/Recurrence > 12 months) was made (p = ), Figure 4A top. Proteins with a poor effect increased intensity with worse patient prognosis, and conversely, those with a favorable effect increased with better patient prognosis. The set of proteins and their weighted predictive CP score was used to group the Test set into both a poor and favorable group using the same CP score range. For survival, a division from the ranked CP scores of poor (median survival 12 months) and favorable (median survival > 12 months) was made The set of proteins and their weighted predictive CP score was used to group the Test set into both a poor and favorable group using the same CP score range (p = 0.06), Figure 13A bottom, with the poor group having a median survival of roughly 12 months, in line with the prediction

84 Figure 13. Training and test patient groups were used to generate and validate survival and recurrence compound predictor (CP) protein signatures. The CP was generated from the sum of the significant proteins in the training set, weighted by the proteins predictive ability, for both survival and recurrence. A) top: The patients in the training set were ranked and divided by their CP score into 2 groups: poor (Med. Survival 12 months) and favorable (Med. Survival > 12 months). A) bottom: CP range for poor and favorable survival was evaluated in the test set, showing comparable median 12 month survival in the poor group. B) top: Recurrence CP scores divided the training set into favorable (Med. Rec. > 12 months) and into two poor groups: poor (Med. Rec. = 8 months) and poorer (Med. Rec. = 5 months). B) bottom: Recurrence CP score evaluated in the test set, which successfully showed comparable poor (Med. Rec. = 9 months) and poorer (Med. Rec. = 4 months) groups, in line with the predicted score. *The favorable group in the recurrence test set was omitted for clarity, see text
85 The same general procedure was applied to the training and test set using patient recurrence time. However, in addition to the favorable group (median recurrence > 12 months), the recurrence CP scores divided the training set into 2 poor groups: poor (median recurrence ~ 8 months) and poorer (median recurrence ~ 5 months), p = Figure 13B top. The recurrence CP values from the training set were evaluated in the test set, resulting in very comparable poor (median recurrence ~ 9 months) and poorer (median recurrence ~ 4 months) groups, p = Figure 1B bottom. The favorable group in the test set contained too few patients to draw a reliable conclusion from, and was omitted from the graph for clarity. Univariate Analysis of Pooled Cohort While limited in number, the ability of the predictive CP score to group patients in the test set according to their median survival and recurrence was an encouraging validation of the method and gave us confidence in combining the training and test sets into a single cohort to achieve greater statistical power, Table 9. Protein markers from the combined data set were obtained using the same univariate CPH model and p value cutoff as the training set. As an additional test, a bootstrap method was employed that randomly sampled the combined patient data with replacement, ranked each biomarker using the CPH model on the new sampled data, and repeated the procedure 1,000 times

86 . Table 9. The training and test set cohorts were pooled and reexamined using both a univariate CPH model and a resampling with replacement boostrap analysis. *Indicates protein form observed has a c-terminal truncation
87 In both the univariate CPH and the bootstrap of the pooled data, all of the original survival and recurrence protein markers from the training set were found, with the exception of m/z The pooled data analysis was able to identify 6 additional proteins associated with survival. These new markers were weighted and combined into a CP to rank each patient, and the set divided into upper 33% ( unfavorable, red diamond) and lower 33% ( favorable, blue triangle) groups for both survival and recurrence. Each patient from the dichotomized groups was plotted using the value of two significant proteins, m/z 4049 and 4737 for survival and m/z and for recurrence, Figure 14, A-B top. The result shows the spread of patients from two proteins, and the survival and recurrence trends for those groups (p = and p = respectively), Figure 5, A-B bottom
 were plotted with patients having a low compound predictor (favorable outcome, blue triangle) for both survival and")
.")
88 Figure 14. Graphical representation of proteins related to survival and recurrence. Patients with a high compound predictor (unfavorable outcome, red diamond) were plotted with patients having a low compound predictor (favorable outcome, blue triangle) for both survival and recurrence. A) Top: Plot of the weighted intensity of 2 proteins associated with poor survival, m/z 4049 and m/z 4737 (TYB-10, modified). A generally better prognosis is observed as both proteins decrease, as shown in the survival plot (bottom). B) Top: Plot of the weighted intensity of 2 proteins associated with favorable recurrence outcome, m/z (Calmodulin) and m/z (CyC), with better prognosis as the intensity of both proteins increase, displaying a longer time to recurrence (bottom)
89 Discussion Melanocytes are derived from the neural crest and the predominant cells present in lymph nodes (B and T lymphocytes) are derived from the bone marrow, so it is not surprising that the protein signatures from control lymph nodes and melanoma lymph node metastases exhibit drastically different characteristics. Of the 123 protein features observed, 57 displayed over a 2-fold intensity difference between the groups. Most of the differentially expressed proteins were observed at higher intensity in the tumor specimens, with a smaller number of proteins expressed at higher intensity in control lymph nodes. This is a common feature of the tumor cellular regions and may be from a culmination of rapidly dividing cells, increased cellular density in the tumor regions, and proteins that are specifically over-expressed in the tumor cells. The goal of establishing protein classifiers that distinguish melanoma-involved lymph nodes from control lymph nodes is to improve the targeting, diagnosis and stratification of patients with stage III disease. Several proteins observed in tumor regions are calcium binding proteins, specifically the S100 family of m/z (S100A6, Calcyclin), m/z (S100B), and m/z (S100A11, Calgizzarin) as well as calmodulin (m/z 16791). Beyond Ca 2+ homeostasis, the S100 proteins are involved in numerous intracellular processes, including regulation of protein phosphorylation, cytoskeleton dynamics, cell growth and differentiation, and inflammatory response. 82 Calcyclin interacts with numerous proteins, including S100B, and its expression is observed in many cancers. 83 The presence of these S100 proteins has been previously observed by MALDI IMS as
90 increased in aggressive human gliomas 50 and wound healing mouse tissue 84. From the survival analysis, we identified m/z (S100A6) as an unfavorable marker, a protein previously identified as a potential marker for aggressive melanoma by mrna analysis of human xenografts in mice. 85 The bootstrap analysis found calmodulin as a favorable prognostic marker for patient recurrence. Calmodulin is ubiquitously expressed in cells, where it binds to and regulates numerous proteins involved regulator pathways, including protein kinases and phosphatases as well as in cytokinesis. 86 The protein has been implicated as a prognostic marker in lung cancer 87 and shown important in cell adhesion of uveal melanoma cells, 88 but its specific association in prolonged recurrence is unknown. The IHC stain for S100 is routinely used as a histologic marker to confirm the diagnosis of melanoma, but the antibody is strongly associated with S100B and lessspecific to other various S100 proteins. 11 In analyzing the tissue via MALDI IMS, each of the detected S100 proteins can be monitored individually from a single experiment. This spatial and protein selectivity allows a combination of the observed S100 features to generate a multiplex signature to improve diagnostics by reducing the influence of less melanoma specific members of the S100 family. For example, although S100B, S100 A6, and S100 A11 display consistent, near 5-fold higher intensity in the melanoma regions, the intensity of S100 A8 (m/z 10745) is identical between groups and the putative S100 A1 peak (m/z 10458) is absent in control LN and 1/3 of the tumor samples but is clearly seen in the remaining 2/3 of tumors. Each of the S100 proteins is involved in a wide variety of cellular functions 82, and the ability to monitor these individually by MALDI IMS will be advantageous in understanding their biological roles
91 The recognition of cytochrome C (CyC, m/z 12275) as a protein that may correlate with the behavior of melanoma is intriguing. Cytochrome C expression was significantly more intense in melanoma versus control lymph nodes, possibly due to its role in energy production functions in the inner mitochondrial membrane as part of electrontransport chain. 89 However, increase in m/z correlated favorably to longer time to recurrence, consistent with a role in the intrinsic apoptotic pathway. When released into the cytosol, cytochrome C binds with APAF-1 and initiates the caspase cascade that ultimately leads to apoptosis. 90 The association between cytochrome C expression and increased time to recurrence suggests that melanomas with high expression may have an intact apoptotic pathway and thereby be more responsive to therapy or progress more slowly. Cytochrome C is a nuclear gene that does not gain its heme group until reaching the mitochondria. Interestingly, the holocytochrome c (containing the heme group, +615 Da) and not the apocytochrome c (lacking heme group) is required to initiate apoptosis. The form identified in the direct tissue analysis is m/z 12275, which contains the heme group (the apocytochrome c species presumably at m/z was not observed, possibly obscured by the S100 A11 peak m/z 11651). The increase in m/z initially suggested a potential functioning apoptotic pathway in patients with increased time to recurrence; however, with IHC staining for activated caspase-3, only a weak correlation was observed between tissue areas high in m/z and activated caspase-3(data not shown). An increased expression of other anti-apoptotic proteins, such as MIF and HSP10, may be suggestive of a more vigorous anti-apoptotic activity. One of the more unexpected results is the association of cleaved proteins in patients with low survival. Of the 12 proteins related to survival, 3 are modified forms
92 with two C-terminus peptides missing/removed. Each di-peptide set is unique and the cleaved forms were observed at non-uniform ratios to the intact protein. Ubiquitin (Ub, m/z 8565) appears with its cleaved form missing the C-terminus GG (Ub-GG, m/z 8451) and has been observed in several biological processes. 91 Both thymosin β-4 (TYB4, m/z 4964) and thymosin β-10 (TYB10, m/z 4936) were found to have similarly cleaved forms (TYB4-ES, m/z 4748) and (TYB10-IS, m/z 4737). The thymosin β proteins sequester actin monomers within the cell, inactivating polymerization until needed. 92 The full length thymosin β proteins have been routinely observed across species in MALDI tissue analysis 37, 46, 50, 93 and both thymosin β-4 and β-10 have been implicated 94, 95 in the metastatic progression of melanoma. The full length thymosin proteins are often over expressed in metastatic cells, where their over expression causes additional 96, 97 actin sequestration, a less rigid cytoskeleton, and allows more motility in the cell. To our knowledge, cleaved forms of TYB4 and TYB10 have not previously been associated with metastatic melanoma or other cancer. The modified forms of the thymosin proteins have been observed (TYB10 natively and TYB4 artificially) and in both cases, though the N-terminus is predominantly responsible for actin binding, the truncated C-terminal form causes a small, but significant loss in binding. 98, 99 While an increase in full length thymosin proteins corresponds to metastatic cell potential by means of increased actin sequestration, our analysis suggests that a slight reduction in actin binding amongst metastatic tumors correlates with a more aggressive tumor. This may give the cells increased rigidity thereby promoting their survival in the foreign lymph environment. Intact forms of thymosin β revealed no significant difference between
93 control and tumor groups or in relation to survival/recurrence, and interestingly, neither did the actin associated proteins cofilin-1 (m/z 18415) or profilin-1 (m/z 14968). Histone H4, H2B, and H3 were found to positively correlate with patient survival. Histone H4 is observed as two clearly resolved isoforms of m/z and Pesavento et al showed that these are comprised from the removal of the initiator methionine, an N-terminal acetylation, and a dimethyl modification on residue K20 for m/z and an additional acetylation on residue K16 for m/z The respective isoforms were shown to comprise 69% and 17% of the total H4 forms during the G0/S0 phase. As the cell cycle passed into G2/M phase for cell division, the relative values fell to 59% and 11%, respectively. In relation to our findings, the positive correlation of these two peaks with survival would clearly be in line with a less rapidly dividing tumor. Decreased intensity of the two H4 peaks indicates significant cell growth in the tumor and would thus correlate unfavorably with survival. Overlapping isoforms of various methylation and acetylation PTMs in histone H3 and H2B register as broad unresolved MALDI peaks, with respective widths of 150 Da and 75 Da, significantly wider than the 30 Da widths of nearby hemoglobin peaks. Improved mass resolution to deconvolute these multiple isoforms will be required for understanding the specific role in survival
94 CHAPTER IV PROTEOMIC CLASSIFICATION OF FFPE MELANOMA BY in-situ ENZYMATIC DIGESTION AND WITH MITF EXPRESSION Fresh frozen tumors remain ideal for extracting rich protein information in their native forms. Yet, long term preservation of excised tissue has for years incorporated the use of chemical fixatives that alter the native stats of proteins. The most widely used of these, formalin, cross-links proteins making traditional direct tissue MALDI IMS largely unviable. Proteomic analysis of formalin fixed tissues with MALDI IMS has recently been developed using localized enzymatic treatment allowing direct analysis of the proteolytic products. Here, this technology is adapted for investigation of formalin fixed melanoma tissues, both in tissue microarrays and whole tumor sections in an effort to generate proteomic data for classification models of melanoma sub-types. Additionally, the proteomic data was correlated with modern IHC technology to connect MALDI IMS with a key melanoma oncogene MITF
95 Introduction Formalin fixation remains the most common and robust method for long term storage and archival of biological tissue samples. The preservation of biopsies and whole organs via chemical fixation with formalin remains the status quo for most hospitals and clinical research facilities worldwide. This fixation eliminates protein auto degradation and thus tissue degradation by generating an array of chemical cross links between proteins while preserving the tissue architecture and morphology. 61 Whole or representative tissue volumes are often embedded into paraffin blocks following fixation, termed formalin fixed paraffin embedded (FFPE), to further protect the tissue and to aid in tissue sectioning. Preserved tissues can be sectioned decades later, and analyzed by histological analysis allowing clinicians and researchers the ability to carry out long term patient follow-up and investigate patient groups in a retrospective analysis. Although the tissue remains viable for analyzing morphological features, the extensive cross-linking of proteins (and RNA/DNA) severely inhibits molecular analysis of the tissues. This prevents traditional antibody based immunohistochemistry (IHC) and the majority of proteomic and genomic analyses by making the specific protein and gene binding sites inaccessible or possibly compromised. Approaches to reverse formalin fixation for these types of analyses have made headway using a variety of chemical approaches, generally termed antigen retrieval. 62 The most common procedure remains the use of heat and pressure in a buffer solution to hydrolyze the cross-linked bonds. Once partially reversed, the tissue can be analyzed by antibodies, gene analysis, and by LC MS/MS
96 In cancer investigations, high n values (i.e. numerous patient samples) are required to develop accurate conclusions and robust biomarkers. The large consortium of archived FFPE tissue samples provides an excellent source high volume studies. However, collecting individual tissue samples for each patient in a cohort and analyzing them one at a time is not only slow and time consuming, but increases the likelihood of introducing discrepancies from tissue to tissue. To address this issue, FFPE samples have been collected from numerous sources and combined into a high-density tissue microarray (TMA) In this approach, representative cylindrical cores of different tissue samples are collected with a micro punch of mm diameter. Each core is then arranged into a dense array by insertion into a paraffin block. Once sectioned and mounted on a traditional microscope slide, hundreds or more unique samples can be analyzed thereby significantly improving throughput. The use of MALDI IMS technology for such high density tissue arrays has great potential to understand the complexity and heterogeneity of melanoma tumors. Primary melanoma has several distinct subtypes clinically diagnosed based on the location, such as in acral lentiginous melanoma (AL), uveal, and mucosal. Cellular growth patterns are also used to classify primary melanoma as either superficial spreading or nodular. 10 These subsets of melanoma have been found to house a set of unique mutations (Table 10) that lead to their arrival, and have different response rates, though the exact reasons are debated. 105 Notable mutations include BRAF, NRAS, and KIT. The overwhelming argument for this diversity is in genetic mutations arriving from non-sun induced (AL and mucosal) compared to sun induced, specifically differentiating chronic sun exposure from non-chronic. While these findings clearly improve our
97 106, 107 understanding of the disease, the variability in mutations is readily apparent. Furthermore, several of the mutations, such as BRAF and NRAS, lie along the same molecular pathway in addition to being present in non-malignant moles
98 The clinical subtypes of melanoma display heterogeneous mutated pathways. Apart from distinguishing the origins of the various subtypes, identifying the biology of the tumor and its local environment is critical, particularly for improved patient care. TMA s in combination with MALDI IMS present a feasible platform to approach this problem by combining large patient numbers, investigative proteomics, and the integration of parallel technologies like immunofluorescence(if). The spatial information and selectivity of MALDI IMS and IF is particularly intriguing, as results of both can be directly overlayed for very specific comparisons of regionally distinct cellular groups. It is toward this end that we approach the analysis of melanoma TMAs with the following goals: Goal 1: Determine molecular features that distinguish the various subtypes of melanoma, including primary, acral lentiginous, mucosal, and lymph node metastasis. Goal 2: Determine molecular features indicative of the tumor biology, independent of the clinical subtype. Goal 3: Establish a connection of proteomic technology with advanced IHC analysis in a high throughput manner. To accomplish this goal, two tissue microarrays containing various melanoma subtypes and control skin were acquired. With the present diversity of melanoma, TMA s represent the most promising method of effectively combining proteomics, IHC, and histological diagnosis in a high throughput manner
99 Cohort and Data Processing Methods Two melanoma TMA s, HH0193 and HH0086, were purchased from Folio Biosciences containing 80 tissue cores of 1.5 mm diameter. The tissue cores were grouped into one of 5 classes, comprised of 4 melanoma subtypes and control skin as follows: 1) acral lentiginous (AL), 2) lymph node metastases (LN), 3) mucosal, and 4) primary tumors and 5) normal skin. The category of primary included non-acral and non-mucosal melanoma tumors infiltrating the skin and no distinction was made between superficial spreading, nodular, lentigino, or the degree of chronic sun exposure as the clinical information was not available from Folio Biosciences, though these subdivisions have shown some significance. 107 Additionally, it has been suggested that these classifications are non-specifc, difficult to reliably substantiate, and should be abandoned or reevaluated altogether. 108 ALM, mucosal, and primary categories were comprised of stage I/II tumors and LN as stage III. TMA HH0193 comprised 16 mucosal, 14 acral lentiginous, 19 primary skin, 23 lymph node metastases, 4 ocular, and 4 distant metastases melanoma tumors. TMA HH0086 contained 5 mucosal, 15 acral lentiginous, and 14 primary skin melanoma tumors and 8 normal skin tissues each in duplicate. The ocular and distant metastases were excluded due to limited sample numbers along with several cores which demonstrated aberrant cellular morphology. Of the duplicate cores, the one containing the largest area of tumor and/or least amount of tissue tearing, necrosis, or significant blood cell involvement was chosen. The normal

100 skin was, unsurprisingly, clearly distinct from the melanoma tumors, and based on the smaller sample numbers and analysis regions, were included with their duplicates. The remaining cohort comprised 23 acral lentiginous, 18 lymph node metastases, 18 mucosal, and 28 primary skin melanoma tumors and 13 normal skin tissues, Table 11. Table 11. Demographic of two TMA s containing melanoma subtypes and control skin tissue cores. Digested protein data collected from these samples, and detailed in chapter 2, was used in all of the classification analyses. Directly after MALDI IMS analysis, the matrix was removed and the TMA was stained with H&E. Image alignment of the H&E image with the IMS image was done using Fleximaging software (Bruker). Histological analysis of each core was performed, and the MS spectra from regions corresponding exclusively to melanoma locations were exported as csv files, processed and averaged into a single representative spectrum using ProTSMarker. All classification, spectral and gel visualization, and PCA plots were computed with these averaged spectra using the ClinProTools software (Bruker)
101 Distinguishing Melanoma Subtypes Previous analyses in distinguishing melanoma subtypes has focused primarily on 105, 109 genetic mutations. Interestingly, class divisions do not show consistent, distinguishable mutations, but rather populations that posses higher percentage of a particular mutation. Primary Tumor vs. Normal Skin A baseline performance of the MALDI IMS platform for distinguishing melanoma tumors was generated using the division between normal skin and primary skin tumors. These tissue types were clearly distinguishable by both histology and MS peptide profiles and provide a measure of the best performance. Tryptic peptide MS spectra from 28 primary tumors (red) and 13 normal skin cores (green) were directly compared, Figure 15. Significant variations were observed in most of the identified collagen alpha (I) and (II) peptides. Using 4 classification model, the two tissue classes were distinguished and classified with nearly 95% accuracy, Figure 15. PCA generation revealed significantly distinct regions and the two groups could be successfully differentiated based on two peptides, m/z (actin) and m/z (collagen), Figure 16. In the two peptide comparison, several of the normal skin samples grouped similarly to the primary tumors. Further investigation revealed that these were normal skin tissues adjacent to cancer, though no tumor was evident. Several of the collagen
102 peptides were significantly diminished in the 3 cancer adjacent normal skin compared to normal skin, Figure 17, specifically collagen alpha-1 (I) containing 0 hydroxyl proline residues and collagen alpha-1 (III). While 3 samples are far from sufficient in statistical power, the results encourage further investigation. The identification of collagen alpha-1 as a potential marker for infiltration and demarcation of tumor boundaries is promising. Collagen makes up the majority of the extracellular matrix (ECM), the fibrous network that provides rigidity and anchorage to cells. Collagen is found in over 20 distinct types, though type I, II, III, and IV make up the majority and are fibril forming. 110 Collagen is sythesised as a procollagen, a watersoluble protein in the endoplasmic reticulum and secreted from the cell where it undergoes enzymatic removal of N-propeptides and C-propetides. Once removed, the collagen chains assemble into fibrils composed of a triple helix of 3 collagen monomers offset by 234 ammino acids. Collagen monomers may join as identical chains, as in type III collagen composed of 3 alpha-1(iii) chains, or different, as in type I composed of 2 alpha-1(i) and 1 alpha-1(i). Key to the generation and rigidity of the triple helix is the repeating polypeptide sequence Gly-X-Y, where X and Y are any amino acid, but posses a high percentage of proline/ hydroxyproline. Beyond providing structural support, collagen fibrils provide binding sites for numerous compounds and are essential in cell growth and motility. 111 Additionally, the ECM must often be degraded to allow cell movement, typically via secreted matrix-metalloproteinases (MMP). 17 The collagen peptides displayed here are type I and III, save a single type IX, and characterize the extracellular environment
103 - 93 -
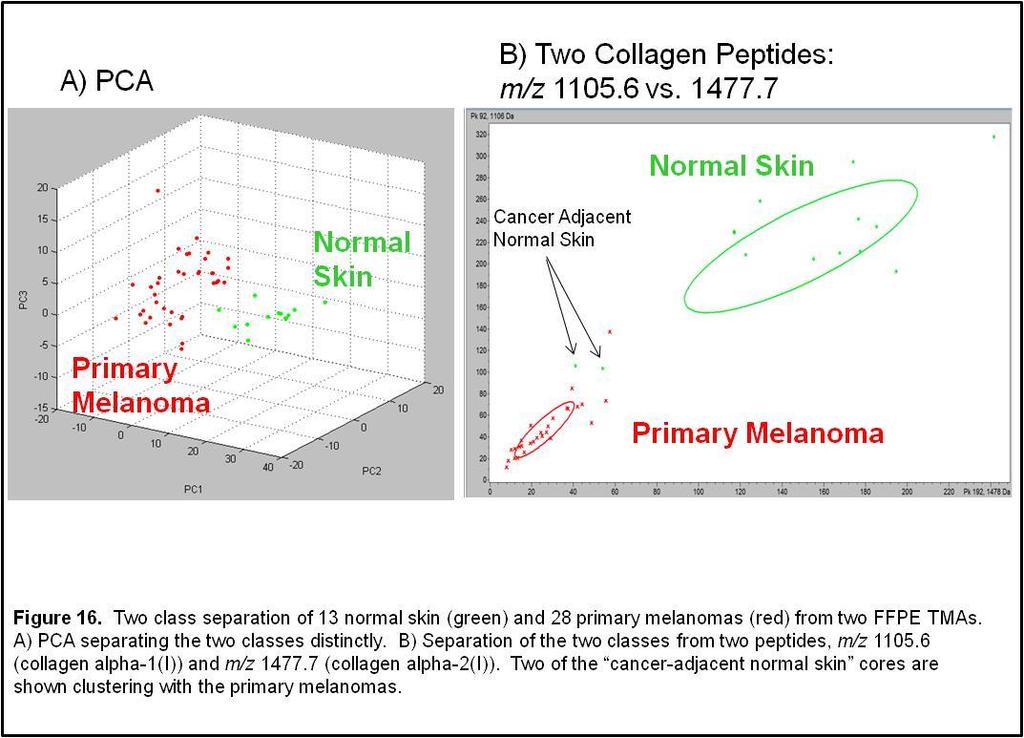
104 - 94 -
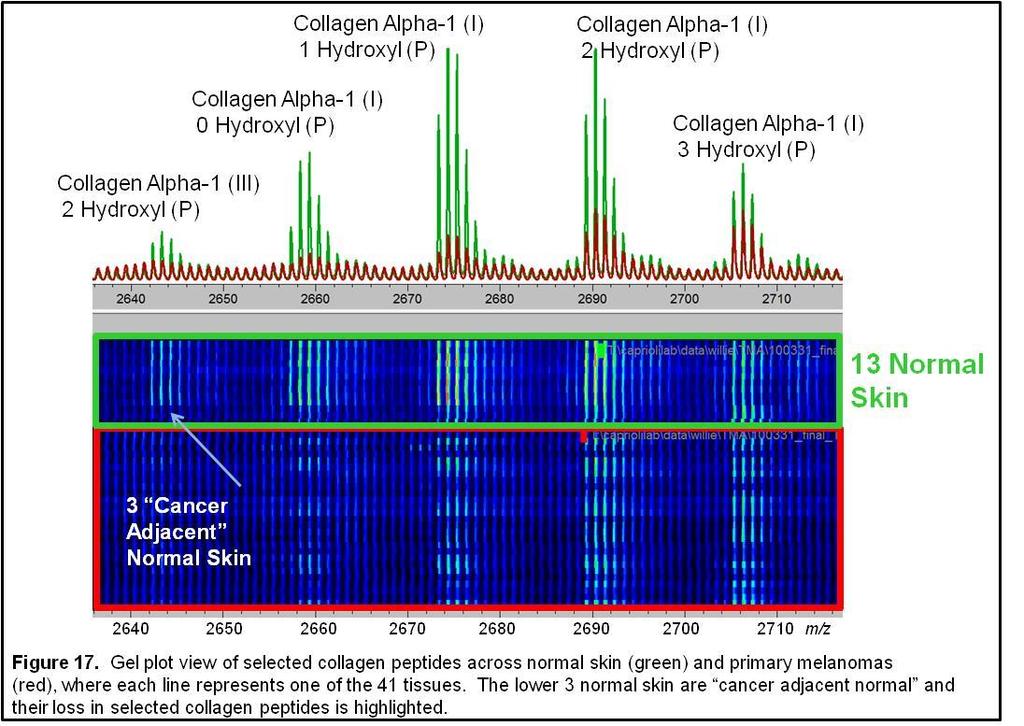
105 - 95 -
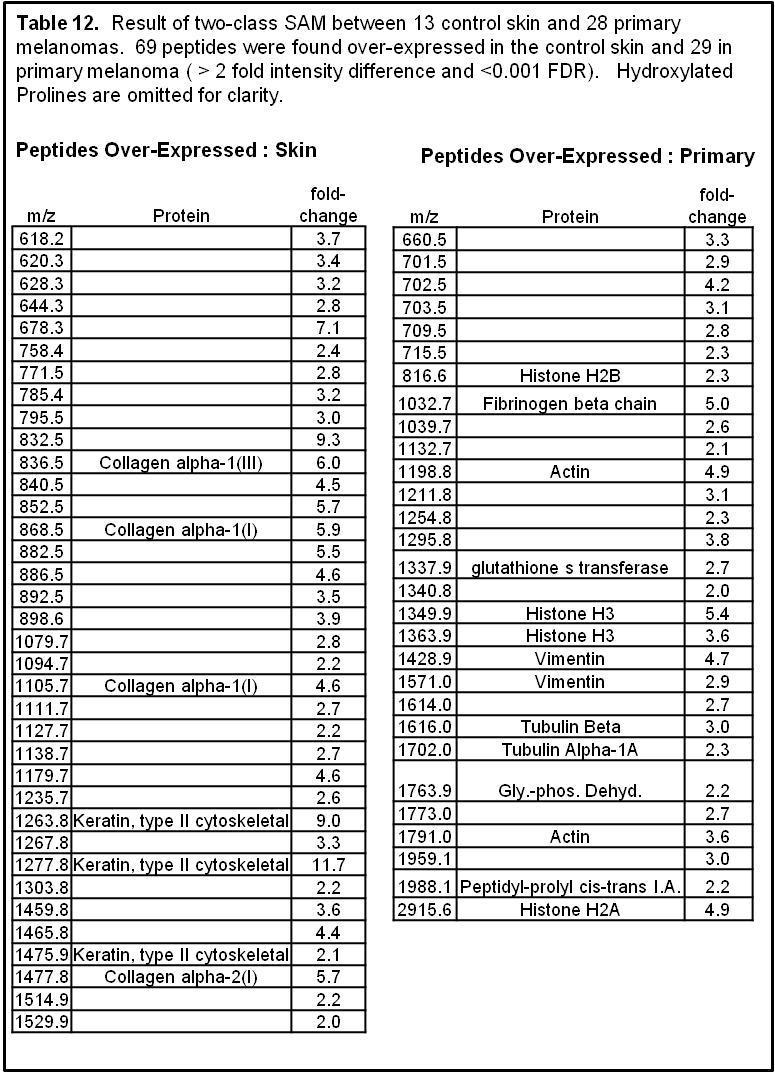
106 - 96 -
107 - 97 -
108 Primary Melanoma vs. Lymph Node Metastases As previously stated, early onset melanoma remains largely curable if treated early, while metastatic tumors, even to the regional lymph nodes, presents a life threatening disease. Towards understanding the alterations between local primary melanoma and metastatic disease, the peptide signature of 28 primary tumors was compared directly to 18 lymph node metastasis, Figure 18. The spectra were considerably more similar to each other than was observed in the normal skin and the accuracy of the classification model dropped to ~80%. Yet, PCA and two peptides (m/z and 815.5) did reveal a high level ofseparation between the 2 classes, Figure 19. The major peptide disparities between the groups were the multiple histones and collagen species, as shown in the results of a 2-class SAM (1.5 fold change and FDR<0.0001), Table 13. The results clearly show a drop in the presence of various collagen peaks as the melanoma metastasizes and an increase in the various histone peaks. The results were not uniform across the two classes, but rather showed a higher population of cores containing an increase or decrease of these peptides (Figure 20-11). Figure details gel plot views of all 46 tissues aligned to the average MS spectrum of the two classes. The average spectrum shows the two histone and three collagen peptide peaks shown are at a significantly different intensity for the two- class comparison. However, investigation of individual all cores reveals the classes contain a mix of tumors containing a range of intensities for these peaks. This phenomenon was observed throughout the remaining class comparisons and the MITF analysis
109 - 99 -
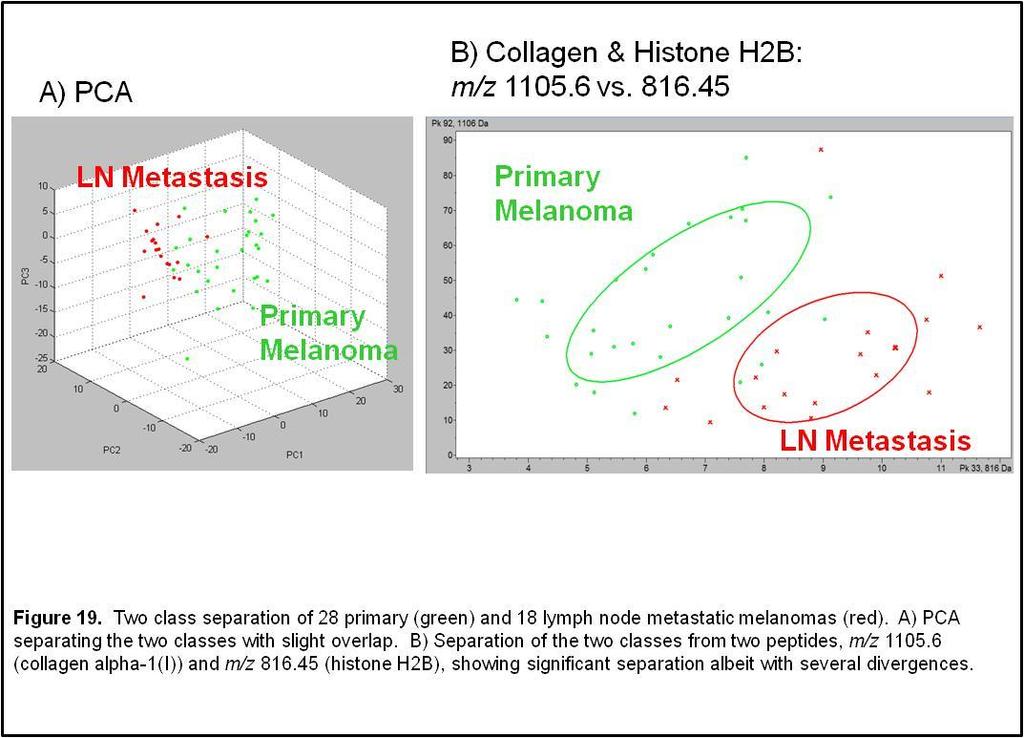
110
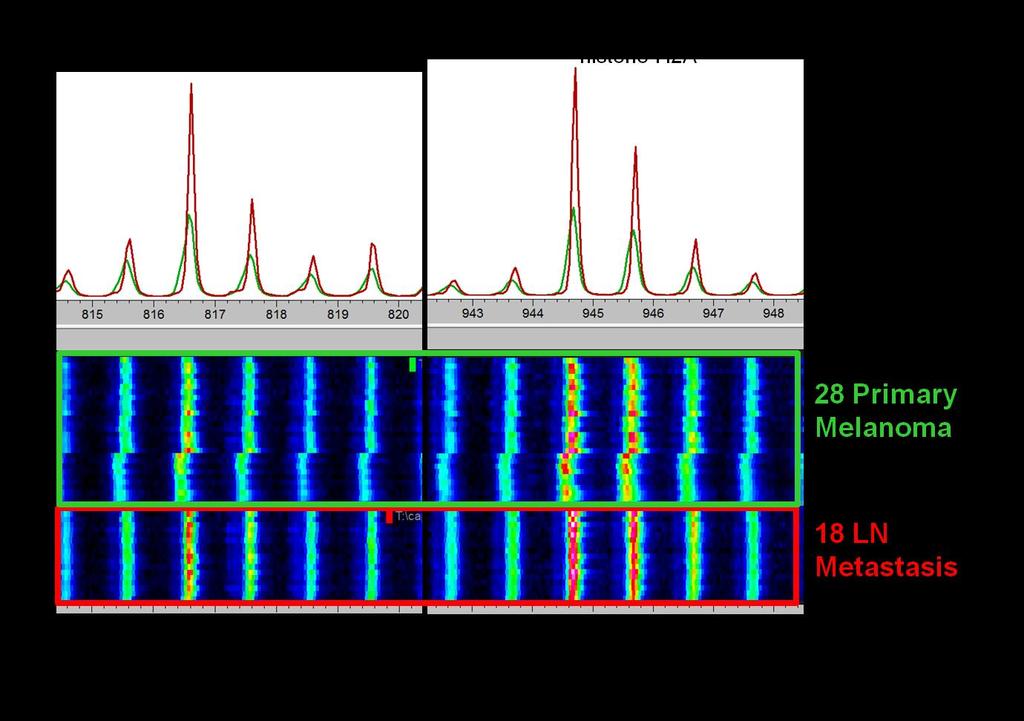
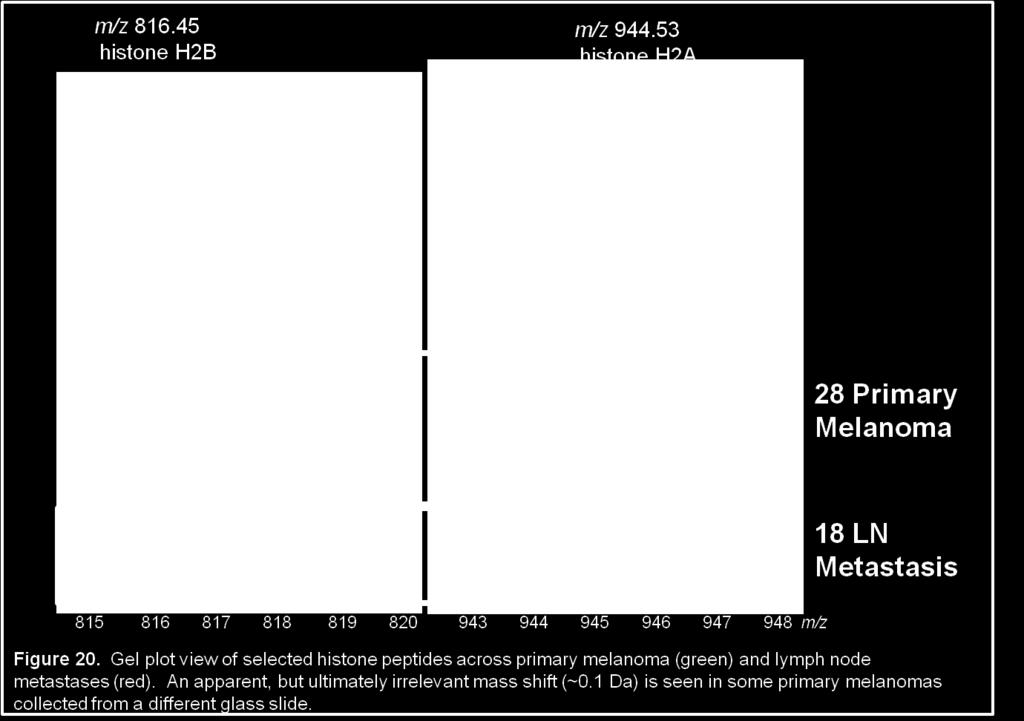
111
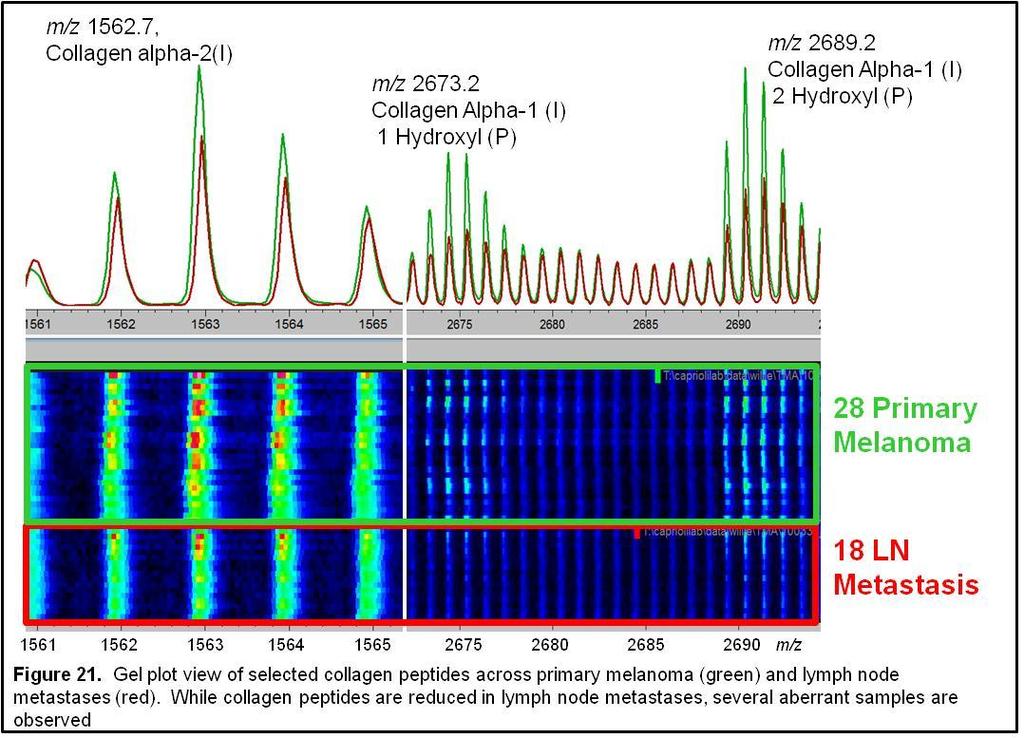
112
113
114 Primary vs. Acral vs. Mucosal Previous research has shown a slight variation of genetic mutations between AL, mucosal, chronic sun damaged and non chronic sun damaged tumors (grouped as primary in our analysis). 105 This has been attributed to the differences in how these melanoma subtypes acquire their mutations, whether from UV damage (primary) or non-uv related acquisition (AL and mucosal). In our analysis comparing peptide signatures from these three groups, significant heterogeneity within each group was observed. PCA and classification models were not able to distinguish these groups with any reasonable level of confidence. Model classifications were below 50% accuracy. While the origins and sites of genetic mutations may be distinct, the peptide signature indicates the active biology of the tumors and their local environment offer distinguishing characteristics. Tissue Grouping by Function Based on previous findings, significant heterogeneity within each melanoma subtype exists. While initially the multiple subtypes have a probability of originating from different genetic mutations, the proteins present are indicative of the cellular activity, regardless of the original trigger mechanism. Several peptide signals averaged within clinical subgroups were similar, but the clinical classes displayed a heterogeneous collection of tissues, several displaying a particular peptide as intense yet other tissues in the same clinical class showed low intensity levels of the same peak. The MALDI spectra suggested that each clinical class was composed of subsets
115 of melanoma cells. In addition, the spectra suggested more similarity of similar subsets across clinical classes than within. A list of the most prominent and intense peaks across the 4 melanoma classes was compiled and the percentage of high expression as seen across all samples and within each clinical subtype is shown in Table 14. Peptides considered highly expressed were double the intensity of a set of the lowest peaks, termed baseline expression. The chart displays the heterogeneity of cores, across clinical subtypes. For example, m/z (collagen alpha-2 (I)), displayed high expression in 58% of AL tumors, 24% of LN tumors, 50% of mucosal, and 38% of primary tumors but only low to moderate expression in the remaining cores. While a general similarity between AL and mucosal tumors are similar (58% and 50%, respectively) compared with primary (38%) and particularly to LN (24)% can be found, I hypothesize that cores displaying high expression are similar, independent of the clinical subtypes
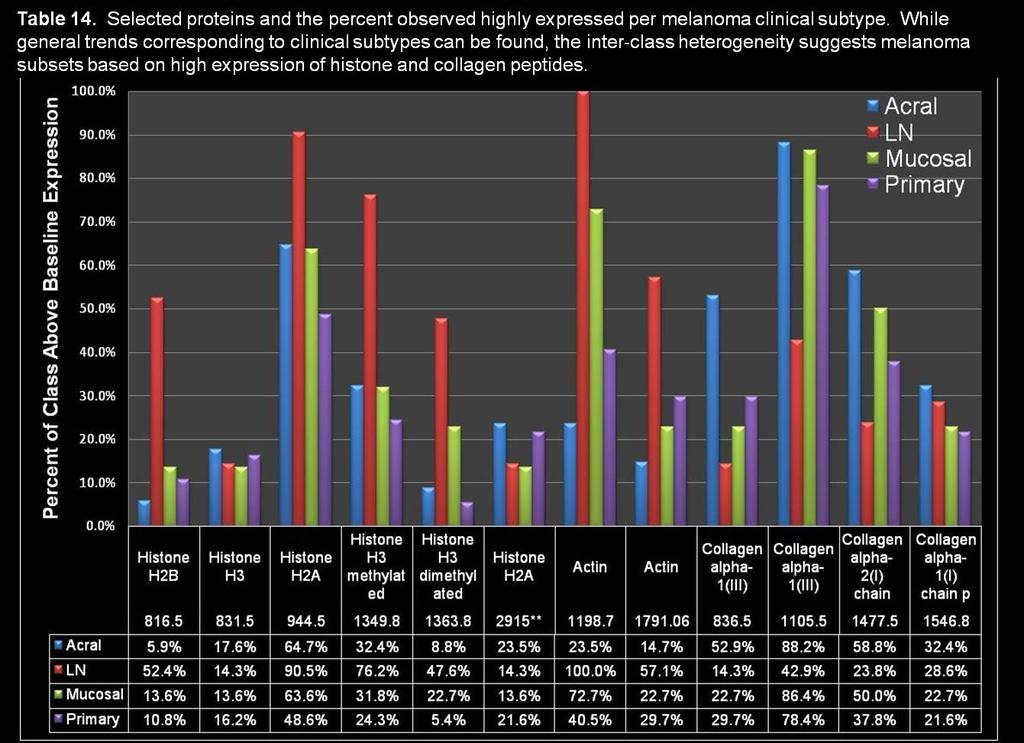
116
 and 1477.7 (collagen alpha-2 (I)).")
117 Two classes of peptides contributed the greatest diversity across the cohort: histone and collagen, Table 14. A single peptide of each group was chosen to sort and dichotomize the tissue cores: m/z (histone H2A) and (collagen alpha-2 (I)). When sorted this way, related histone and collagen peptides displayed a similar expression profile trend, Table 15. Table 15. Peptides that show similar intensity trends when sorted by either m/z (histone h2a) or m/z (collagen)
118 Grouped by Collagen alpha-2 (I) One class of peptides contributing to the heterogeneity of melanoma samples comprised the collagen tryptic peptides. One of the collagen peaks, m/z (collagen alpha-2(i)) was selected and the cohort sorted by the measured intensity of m/z and dichotomized into low m/z (or low collagen ) and high m/z (or high collagen ) groups. When separated by a single collagen peptide the remaining collagen peaks generally followed the same intensity distribution trend. The result was that the high m/z dichotomized group also housed melanoma cores containing high intensity of nearly all of the identified collagen peptides as well as a set of unidentified peptides, Table 15. The average MS plot of the two classes is shown in Figure 22 along with the model classification accuracy of near 80%, Figure 22. The PCA and two-peptide trend display a high degree of class separation, Figure
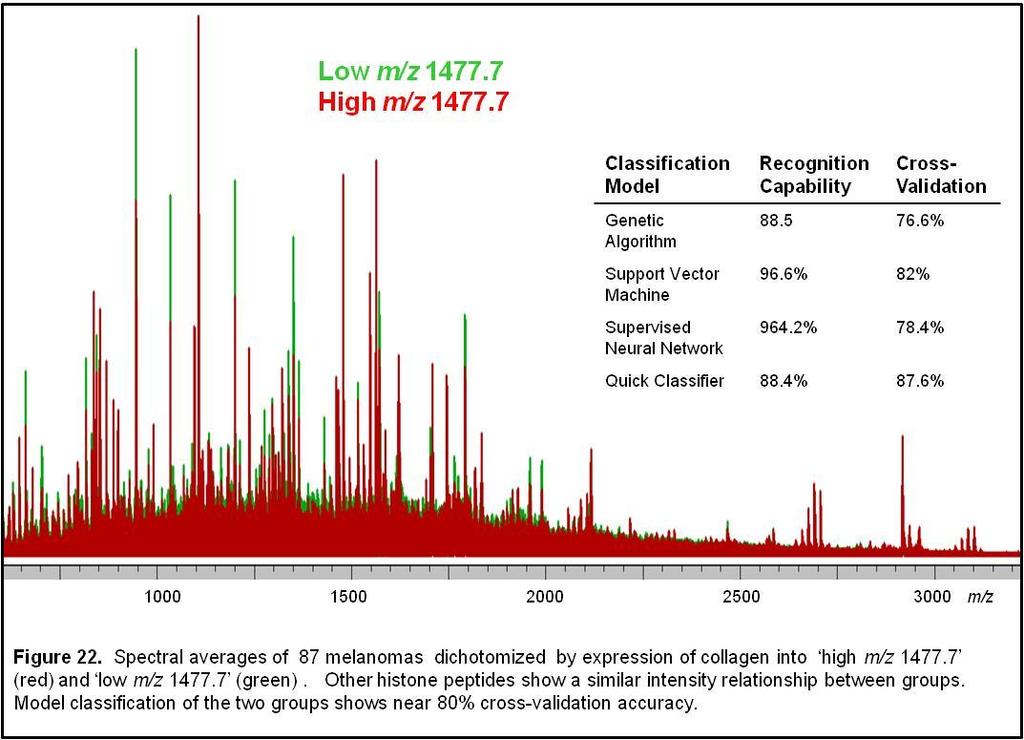
119
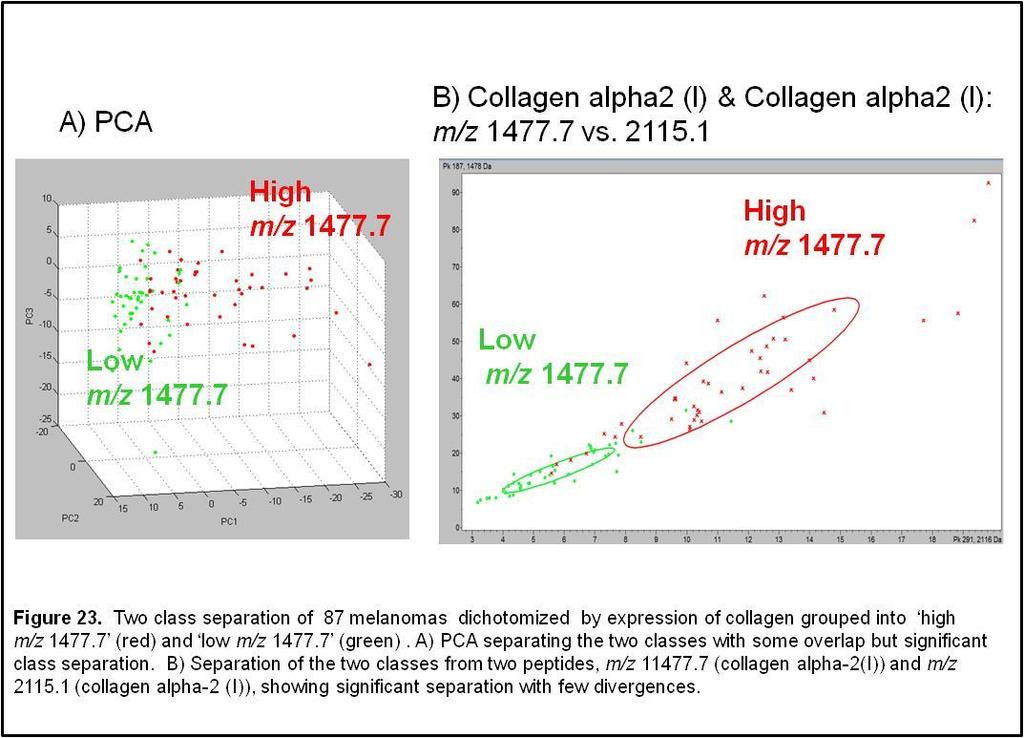
120
121 Grouped by Histone H2A The most intense of the histone peptide signals was chosen to sort data across all 4 melanoma classes, m/z histone H2A, in a similar manner. After sorting, the cohort was dichotomized into low m/z (or low histone ) and high m/z (or high histone ). The majority of other histone peptides as well as fibrinogen and actin displayed similar intensity trends, Table 15. MS spectral averages of each group and the results of 4 classification models are shown in Figure 24. Greater than 80% accuracy in distinguishing the two groups was observed, on the order of observations between primary and lymph node tumors and significantly improved from the accuracy in classifying acral-mucosal-primary. Both the PCA and two-peptide comparison show a high degree of separation, indicating that the histone peptides collectively represent a clinical class-independent subset of melanoma tumors, Figure 25. Of particular interest, no direct relationship between separations based on the histone or collagen peak was observed. Each separation and dichotomization produced a unique orientation of the melanoma samples. It is probable that the histone separation is indicative of internal cellular function and the collagen levels indicative of the tumor microenvironment (see discussion) and the unique separation of each is due to the orthogonal functions
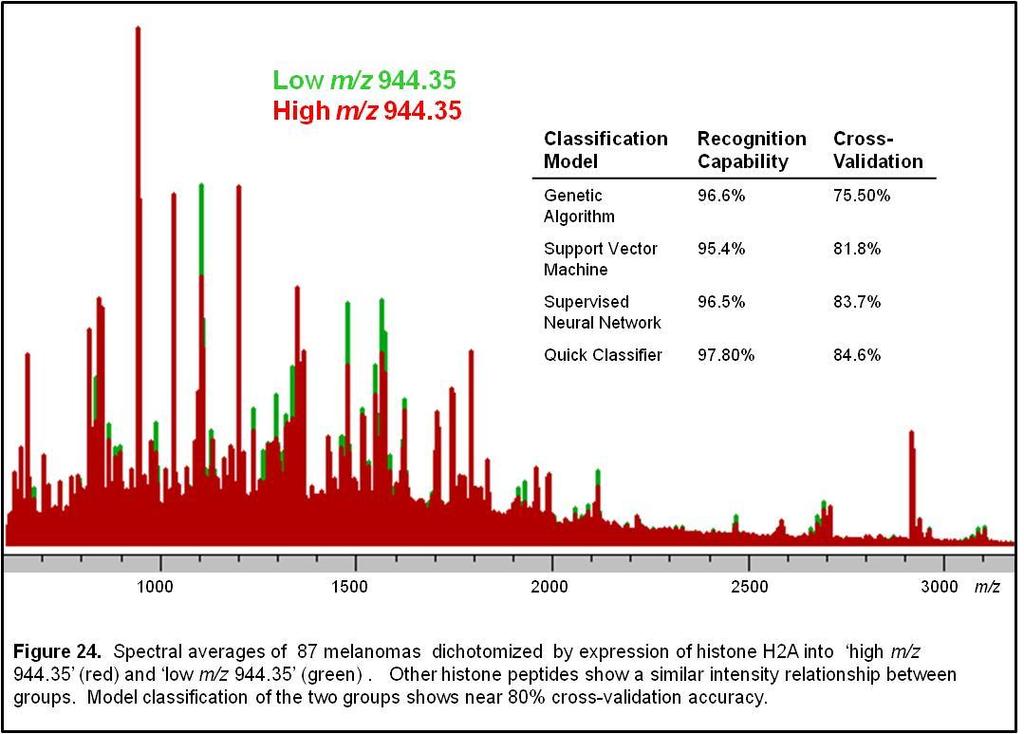
122
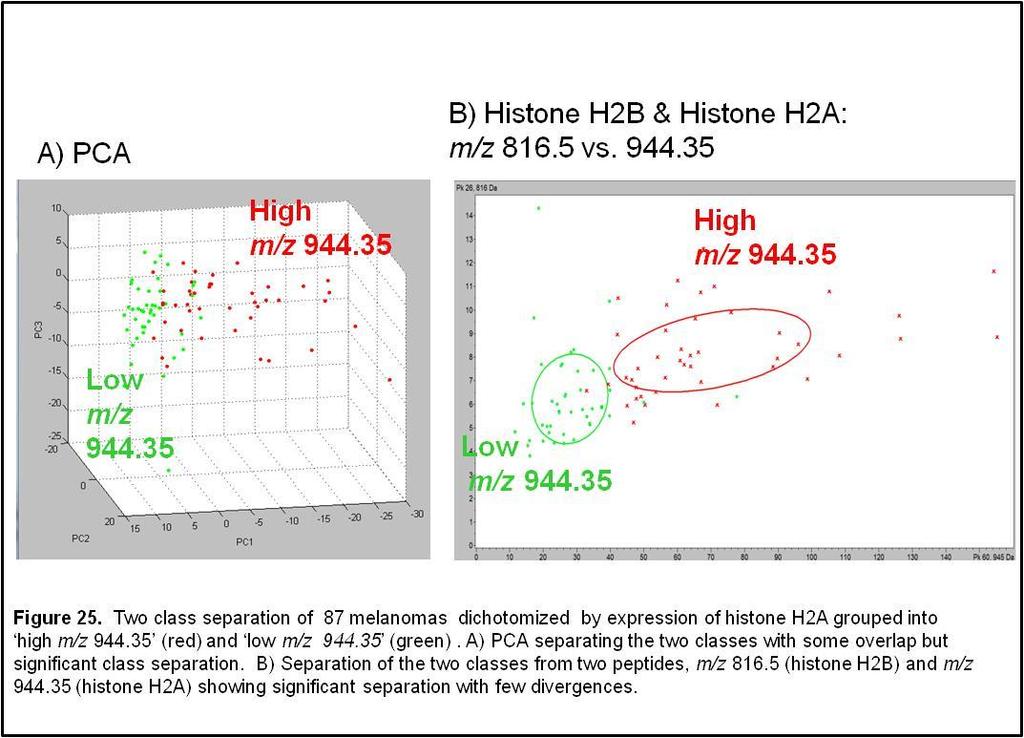
123
124 Integration of MITF IF and MALDI IMS Micropthalmia-associated transcription factor (MITF) acts as a master regulator of melanocyte development, function and survival by moderating numerous differentiation and cell-cycle progression genes. 6 MITF is a transcription factor that binds to DNA as a dimer and appears to be regulated by several pathways, including WNT, MAPK, and the camp/creb. Activation of MITF leads to cell cycle progression, inhibition of apoptosis, and cell differentiation. MITF has shown amplification in 10-20% of primary melanoma cases and is associated with a decrease in long term survival. 112 However, MITF expression among melanomas remains variable, with some advanced disease exhibiting down regulation and some exhibiting amplification. Towards understanding the role of MITF in melanoma, we compared MITF immunofluorescence with the MALDI IMS protein data. MiTF Staining Protocol A serial section of TMA HH0193 was stained for MiTF using the following procedure. The slide was first deparrafinized by twice immersing in xylenes for 5 minutes, followed by decreasing EtOH gradients of 100% EtOH for 3 minutes twice, once in 95% EtOH for 2 minutes, once in 70% EtOH for 2 minutes, once in 50% EtOH for 2 minutes, and once in ddh2o for 1 minute. Antigen retrieval of the formalin fixed slide was accomplished by immersion in 10 mm sodium citrate. The slide was microwaved at 30% power for 12 min until almost boiling and allowed to cool to room temperature. Finally the slide was washed 3 times in PBS for 2 minutes. The tissue
125 was permeabilized in PBS with 0.2% Triton-x100 for 10 minutes, washed 3 times in PBS for 2 min each, and then blocked by 5% normal donkey serum in PBS with 1% BSA for 1 hour at room temperature. The primary antibody Rabbit-a-MiTF (Sigma) was diluted 1:500 in PBS with 1% BSA and reacted overnight in a humidity chamber at 4ºC. The tissue was washed 3 times in PBS with 0.1% Triton-x100 for 2 min and then 3 times in PBS for 2 min each. The secondary antibody Alexa 594 Donkey-a-Rabbit was diluted 1:10,000 in PBS with 1% BSA and reacted for 1 hour in a humidty chamber at room temperature. The slide was then washed 3 times in PBS containing 1% Tritonx100 for 2 min, 2 times in PBS for 2 min, and a third time in PBS containing 1:10,000 DAPI and ToPro for 2 min. The slide was imaged on an Olympus IX81 fluorescent microscope using an excitation/emission wavelength of 594/617 nm. MiTF is a nuclear gene, so DAPI was used as a control to ensure that only the IHC fluorescence observed in the nuclear region was used. MiTF was scored into three categories: 0 = No MiTF, 1 = MiTF above background, 2 = High MiTF intensity. Scoring was done blindly, without any knowledge of any of the tissue classifications. An example of a 2 scoring is shown in Figure 26, where the MiTF and DAPI stains overlay perfectly and there is little to no MiTF staining outside the DAPI regions
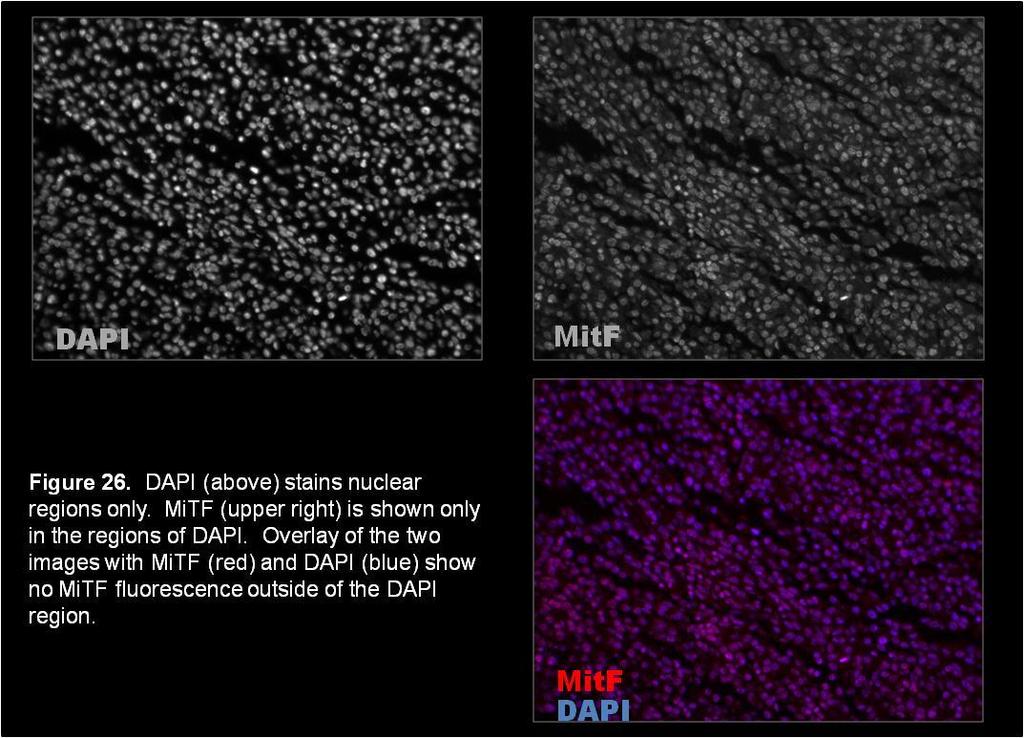
126

127 Tissue cores were grouped into 3 classes according to their scored MiTF reading. Table 16 shows selected proteins that correlated with these groups. As MiTF is only present in ~20% of melanoma and effects several molecular pathways, a uniform protein trend corroborating MiTF intensity from 0 to 1 to 2 scoring was not observed. However, several of the proteins demonstrated significantly higher intensity in the groups. The viable regions of HH0193 for the MiTF scoring cohort was composed of 64 tissue cores containing acral, LN met, mucosal, and primary melanoma tumors. The level of MiTF appeared to be independent of melanoma subtype, though mucosal tumors showed the highest level of score 2 staining. Table 16. Tissue cores analyzed with MiTF immunohistochemistry. MiTF_0 corresponds to staining below the background, MiTF_1 distinguishable from the background, and MiTF_2 as intense staining. No distinguishable correlation between melanoma subtype and intense MiTF staining was apparent, as in the case with clinical class comparisons. All cores were grouped based on their 0, 1, or 2 scoring independently of the subtype. MiTF staining did not correlate to a uniform intensity of any proteins, an expected result as MiTF regulates several cellular functions. Rather, tissues that showed MiTF staining (score 1 and 2) contained a greater number of intense peaks of the various histone species and
128 glutathione s transferase as compared to the background (score 0), Table 17. Several peptides demonstrated the opposite trend, notably, m/z 976 (actin), 1067, and In the previous analysis, grouping all tumors by the intensity of m/z (histone H2A), an actin peak (1198.8) followed the same trend, but in the MiTF profile, a different actin peak (m/z 976.4) showed an opposite trend. The collagen peaks displayed no correlation with MiTF expression, reaffirming a sense that the histone peaks are indicative of intra-cellular biology and the collagen indicative of the extra-cellular tumor microenvironment
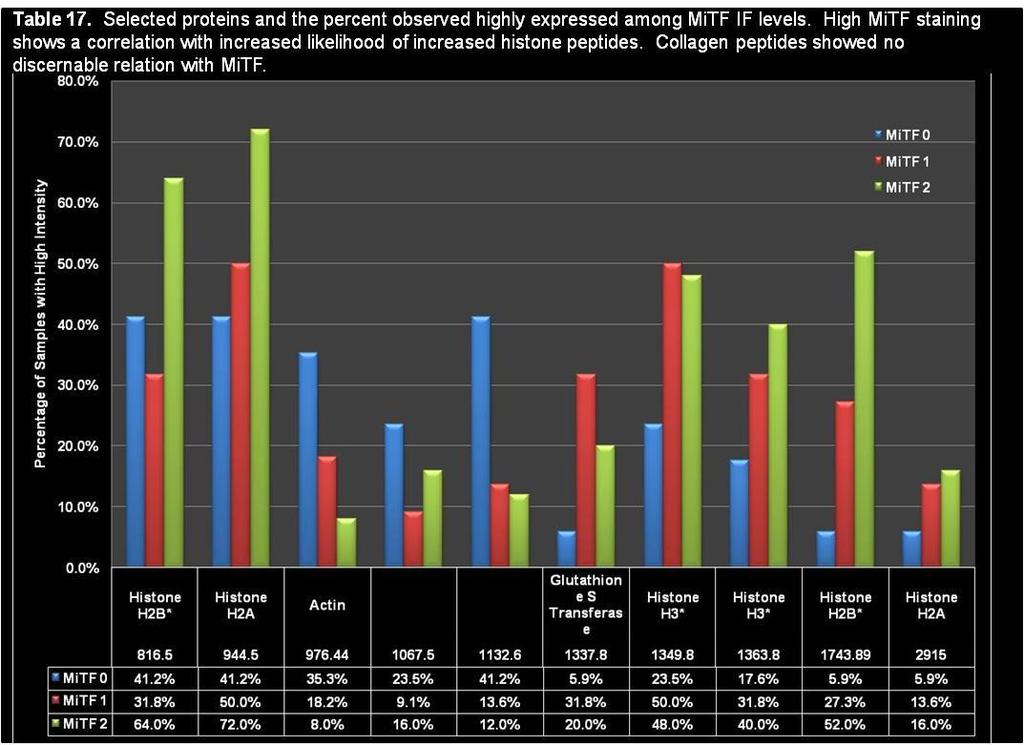
129
130 Discussion Tissue microarrays present the opportunity to investigate large sample numbers and with MALDI IMS in a direct comparison to more traditionsal methods (e.g. immunofluorescenc) in an effort to classify with high both cancer and human tissue samples. In the two TMA s analyzed by proteomic MALDI IMS, a high degree of heterogeneity was observed, both in the cellular architecture and morphology as well as in the MALDI IMS and immunofluorescent MiTF staining. This underscores the need to develop high throughput technologies and platforms capable of the large numbers required to understand and measure numerous variables. These include age, gender, treatment, stage at original diagnosis, and location of the tumor, genetic mutations, and activated oncogenic pathways. Here, we have focused exclusively on the biology as determined by the protein signature levels of tryptic peptides. Clinical information for both HH0193 and HH0086 TMA s where available to group the tissue core on the basis of the melanoma subtype, namely, as acral lentiginous, mucosal, lymph node metastasis, primary skin melanoma and normal skin. The most notable trend was the decrease in collagen levels from normal skin to primary tumor to metastatic tumors infiltrating lymph nodes. Control skin, here composed of mostly the top layers of the skin, displayed very intense levels of collagen I and III, nearly an order of magnitude above most primary melanoma tumors. Histologically, control skin is clearly distinguishable from the tumor samples, and the MALDI IMS results echoed this high separation with molecular models able to distinguish the groups with 95% classification accuracy. Normal skin is composed of the dermis and epidermis, which consist of mainly connective tissue and keratinocytes and relatively
131 few melanocytes, the precursors of melanoma. In the histological analysis, the majority of primary tumors and lymph node metastases engulfed the 1.5 mm tissue core, leaving little native dermal/ln architecture, resulting in data collection from tumor regions fully equilibrated with their ECM. The significant drop in collagen levels in the primary melanoma tumors signifies the structural rearrangement the malignant melanocytes perform during growth. In primary tumors, the equilibrated ECM content may derive either from that formed directly by the melanoma cells or a result of left-over ECM from the skin. In either case, the melanocytes have reorganized their micro-environment to a condition suitable for their growth. Continuing this trend as the melanoma metastasizes to the lymph nodes, collagen levels drop further. The lymph node environment is significantly different, as the lymphocytes flow freely past each other to exchange immunoreactive signals. While these general trends where observed, a portion of the LN tumors displayed significant levels of collagen and several primary tumors low levels. This suggests that certain melanomas may require collagen adhering and functioning with the ECM through their integrins to grow successfully while in others that pathway has been altered and cells can proliferate without it. These results are intriguing in light of work showing that preconditioning of collagen-i networks by aggressive melanoma cells allowed less aggressive cells to develop vasculogenesis, functioning more like aggressive cells. 113 One of the peculiar findings was the drop in a set of collagen peaks in normal skin that was marked as cancer-adjacent normal skin. While 3 samples is a low number to make exhaustive conclusions, the findings are interesting, especially if future
132 experiments show a trend in the melanoma cells to exert a degradation influence on collagen beyond just the advancing tumor border. 114 When examining proteomic differences between the 3 stage I/II tumors (acral, mucosal, and primary skin), the data was intriguing. Instead of clear, consistent protein differences between the groups, we observed significant variations where a single peptide would appear at high intensity intermittently throughout and between classes while still showing low intensity in many of the cores. When analyzing the relationship of these peptides, 2 classes of peptides were found that independently sort the tissues regardless of their subtype: histone and collagen. A collection of histone peptides that make up the chromatin complex, H2A, H2B, H3, and H4, were found. Histone peptides from H2A, H2B, and H3 generally showed similar intensity trends, but H4 was not correlated. This may be due to the low intensity and limited number of H4 peptides discovered. Despite observing histone H4 as a positive prognostic marker in our fresh frozen samples, peptides containing the first 21 amino acids of the protein were not observed, due to 7 tryptic cleavage sites in this area alone. Unlike histones H4 and H3, which exhibit extensive acetylation, methylation and phosphorylation in bulk material the H2A forms observed here are interesting in their total lack of internal modifications. 115 Thus it appears that the levels of histone H2A specifically is indicative of the tumor density or of the tumor turn over and not of various isoforms or PTMs. Histone H3 remains extensively modified, more than any of the other histone proteins, and thus cannot be readily interpreted based on the few peptide fragments shown. However, the technology is clearly under development to monitor
133 both the independent methylation and acetylation sites as well as their spatial distribution throught the melanoma tissue in a high throughput manner. When sorted and dichotomized by m/z (histone H2A) or m/z , molecular models successfully classified the high/low groups with 80% accuracy, higher than when the tissues were separated based on clinical subtypes. Each separation was unique, grouping different subsets of cores together. In addition, m/z (actin) and (fibrinogen) displayed similar intensity distributions to the histone peaks while m/z , 1235, 1459, and 2957 show similarity with the collagen sorting. Taken collectively, it appears that the histone collection of proteins is indicative of the cellular density and proliferation while collagen represents a portion of the tumor microenvironment. The results of the MiTF scoring emphasize this conclusion. With the numerous controlling pathways that MiTF regulates, it is not surprising that no single peptide uniformly increased in correlation with MiTF IF levels. In general it is believed that increased levels of MiTF correspond to an aggressive tumor, as the protein activates proliferative pathways and inhibits cell-cycle arrest. 6 The positive and intense MiTF scoring tissues possessed a high percentage of tissue cores with more intense histone peaks than the level 0 scoring. This corroborates the conclusion that an increase in histone levels is a function of cell growth/density and functionally separate from the influence of the collagen matrix. In addition, glutathione s-transferase (GST) was found increased in a higher percentage of MiTF positive tissues. Glutathione S-transferases (GSTs) are a family of isoenzymes that catalyze the detoxification of substrates of reactive oxygen species (ROS) via conjugation with glutathione. GST has been found
134 to be increased in several tumors and specifically, over-expressed in solid tumors resistant to drugs. 116 Whether these MiTF and GST s findings show a causative or correlative relationship is unclear, but particularly interesting is GSTs and melanomas resistance to drug treatment. Our results indicate that melanomas should be classified based on internal cell biology (increased histone, MiTF, and GST) and external environments (collagen) and our results indicate these trends are independent of traditional clinical classifications. Interestingly, these discrepancies are independent of clinical classifications. Incorporating TMAs with MALDI IMS in a high throughput, multi-platform approach, we may be poised to decipher the biological complexity and persistent low therapeutic response rates observed in melanoma
135 CHAPTER V CONCLUSIONS AND FUTURE PERSPECTIVES Towards Improved Patient Care It is clear that patients presenting with malignant melanoma exhibit a heterogeneous group of tumor cells, independent of stage and location based clinical subtype. This no doubt contributes to so many treatments for melanoma continuing to under-perform. Toward improved patient care and patient specific customized treatment strategies, robust diagnosis of the state of the melanoma cells must be determined. The work detailed here pushes the frontier toward that goal by providing proteins that relate to more aggressive stage III disease as well as providing evidence and methodology for determining cellular microenvironments and function. In stage III melanoma, critical decisions concerning advanced surgical and adjuvant treatments must be made. The results presented give evidence for molecular based distinguishing features of more aggressive tumors. These protein markers include proteins implicated in altered cytoskeleton dynamics, in the case of modified thymosin beta 4 and 10, as well as measurements of cell cycle progression, in the case of decreased acetylated forms of histone H4. Positive prognostic markers, including
136 cytochrome C show a resistance to of the host to the tumor regions which is ultimately insufficient to completely halt tumor growth. These markers provide distinguishing diagnostic and prognostic information on an individual patient basis, while also improving our understanding of the complex biology in metastatic melanoma. This high degree of complexity manifests in heterogeneous tumors, as shown from analyzing melanoma TMS s. Yet, peptide signals measured across the various clinical subtypes reveal defining features indicative of the cell biology and its microenvironment. As melanocytes transform into uncontrolled aggressive cells, these results show they modify their environment by manipulating the collagen anchorage structures around them. As they invade and establish metastatic colonies in foreign tissues, their collagen microenvironment is further reduced. During this same oncogenesis, internal cellular alterations are progressing, shown here as increasing levels of several histone proteins. The changed tumor microenvironment, as measured by collagen levels, and indications of cell cycle progression, as measured by histone proteins, can independently sub classify tumors with comparable or greater commonality compared to traditional location based clinical classification. The MALDI IMS tryptic digestion findings were further directly integrated with IF of MiTF levels, confirming the independent classification of histone and collagen levels. These two platforms, one generating rich intact protein data from fresh biopsies and the other integrating IF and MALDI IMS for large cohorts of fixed specimens, provide a powerful base to continue to understand this disease. As with all developing and emerging technologies, future experiments must be done to validate and elucidate further the mechanisms involved in the protein markers discovered. While fresh frozen
137 tissue analysis remains closer to the native tissue, limitations exist with long term preservation and scale. Tissue microarrays, while chemically modified, present a high throughput and viable solution to obtaining the sample numbers required to account for the large diversity in the scope of melanoma patients. It is my recommendation that detailed in-depth analysis continue to be performed while pushing the mass range of detected intact proteins and improving the selectivity of all proteins detected. Large cohort analyses connecting investigative proteomics with established biomarkers, such as MiTF, will require high-throughput platforms such as TMAs. The protein and peptide signals identified here bridge statistical model computation with biologic function. The top-down identification of two proteins containing unregistered C-terminal modifications gives strong emphasis to improving platforms to identify proteins in their natural state directly from complex samples. MALDI IMS provides a powerful tool in distinguishing different PTM form of proteins, and improved identification abilities would benefit tremendously. Lastly, while patient confidentiality remains a vital part of medical care, it can severly limit research into improved patient diagnosis and prognosis. In these investigations, it was incredibly difficult to obtain samples containing patient follow-up information, such as treatment and survival information. There is a strong push to separate tissues in tumor banks from the actual patient, and I strongly encourage methods to both ensure patient confidentiality while continuing to provide researchers with the necessary information to continue to understand the disease
138 Future Outlooks: Advancement in IMS Increasing Analytes by Multimodal Imaging While proteins are the cornerstone of cellular biology and continue to be the focus of pharmaceutical targets, they alone do not explain or expound upon the complex nature of the cell. It is clear that as we push forward, we must combine multiple analyte detection in diagnosis and prognosis determination, especially in the area of investigative research. Towards this end, our laboratory is actively engaged in technology to acquire images of multiple analytes from single tissue sections using MALDI IMS, Figure 27. This multimodal imaging approach has been demonstrated in principle and is shown here. At present, the technology works by sequentially applying matrix, collecting MALDI images of the analyte, and matrix removal for the next analyte. This process is done in increasing order of damage to the tissue, beginning with sublimed DHB for lipid analysis, SA coating for intact protein analysis, and finally by aggressive tissue digestion using trypsin. From the uniform DHB coating, two lipid images are collected: first, lipids that ionize optimally in (+) mode, then offsetting the analysis array and acquiring lipids that ionize optimally in (-) mode from the same coating of uniformly distributed matrix. Not only are two distinct imaging data sets collected, but because
139 the matrix layer is sublimed and perfectly uniformly coated, the MALDI images can be acquired at very high lateral resolutions, currently on the order of 60 µm
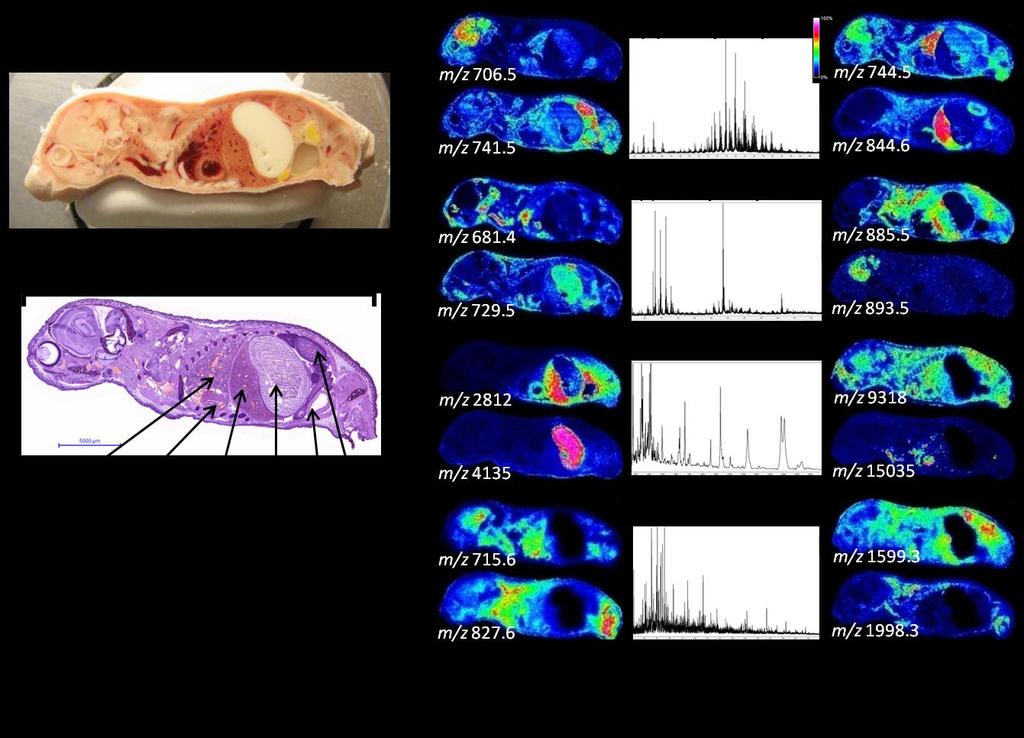
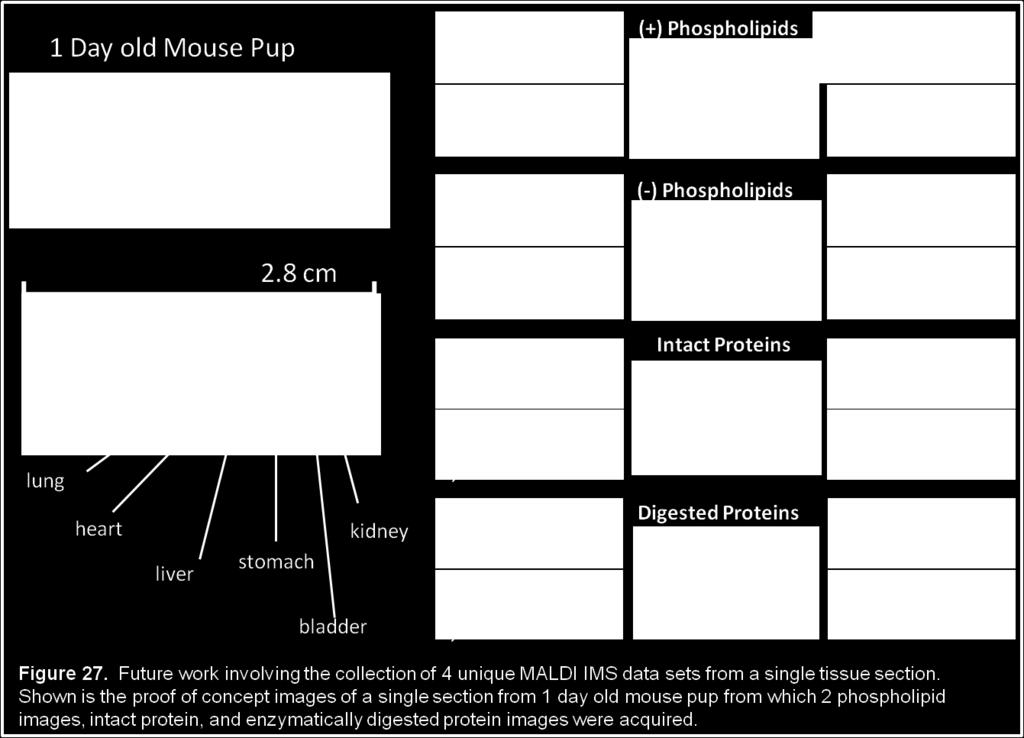
140
Sequence Identification And Spatial Distribution of Rat Brain Tryptic Peptides Using MALDI Mass Spectrometric Imaging
 Sequence Identification And Spatial Distribution of Rat Brain Tryptic Peptides Using MALDI Mass Spectrometric Imaging AB SCIEX MALDI TOF/TOF* Systems Patrick Pribil AB SCIEX, Canada MALDI mass spectrometric
MALDI Imaging Mass Spectrometry
 MALDI Imaging Mass Spectrometry Nan Kleinholz Mass Spectrometry and Proteomics Facility The Ohio State University Mass Spectrometry and Proteomics Workshop What is MALDI Imaging? MALDI: Matrix Assisted
Biological Mass Spectrometry. April 30, 2014
 Biological Mass Spectrometry April 30, 2014 Mass Spectrometry Has become the method of choice for precise protein and nucleic acid mass determination in a very wide mass range peptide and nucleotide sequencing
Bruker Daltonics. autoflex III smartbeam. The Standard in MALDI-TOF Performance MALDI-TOF/TOF. think forward
 Bruker Daltonics autoflex III smartbeam The Standard in MALDI-TOF Performance think forward MALDI-TOF/TOF Designed for a Routine High Level of Performance The autoflex III smartbeam brings the power of
Technical Note # TN-31 Redefining MALDI-TOF/TOF Performance
 Bruker Daltonics Technical Note # TN-31 Redefining MALDI-TOF/TOF Performance The new ultraflextreme exceeds all current expectations of MALDI-TOF/TOF technology: A proprietary khz smartbeam-ii TM MALDI
MALDI-IMS (MATRIX-ASSISTED LASER DESORPTION/IONIZATION
 MALDI-IMS (MATRIX-ASSISTED LASER DESORPTION/IONIZATION IMAGING MASS SPECTROMETER) IN TISSUE STUDY YANXIAN CHEN MARCH 8 TH, WEDNESDAY. SEMINAR FOCUSING ON What is MALDI imaging mass spectrometer? How does
Three Dimensional Mapping and Imaging of Neuropeptides and Lipids in Crustacean Brain
 Three Dimensional Mapping and Imaging of Neuropeptides and Lipids in Crustacean Brain Using the 4800 MALDI TOF/TOF Analyzer Ruibing Chen and Lingjun Li School of Pharmacy and Department of Chemistry, University
Solving practical problems. Maria Kuhtinskaja
 Solving practical problems Maria Kuhtinskaja What does a mass spectrometer do? It measures mass better than any other technique. It can give information about chemical structures. What are mass measurements
Proteomic Biomarker Discovery in Breast Cancer
 Proteomic Biomarker Discovery in Breast Cancer Rob Baxter Laboratory for Cellular and Diagnostic Proteomics Kolling Institute, University of Sydney, Royal North Shore Hospital robert.baxter@sydney.edu.au
Mass spectrometry imaging. What does MS imaging offer?
 BMG 744 Mass spectrometry imaging Stephen Barnes, PhD With sincere acknowledgments to David Stella, PhD and Kyle A. Floyd, MS, former students in the Barnes Laboratory (2005 2012) and Kevin Schey, PhD,
An Overview of Melanoma. Harriet Kluger, M.D. Associate Professor Section of Medical Oncology Yale Cancer Center
 An Overview of Melanoma Harriet Kluger, M.D. Associate Professor Section of Medical Oncology Yale Cancer Center Melanoma Statistics Median age at presentation 45-55 55 years Incidence: 2003 54,200 cases
Small Molecule Drug Imaging of Mouse Tissue by MALDI-TOF/TOF Mass Spectrometry and FTMS
 Bruker Daltonics Application Note # MT-93/FTMS-38 Small Molecule Drug Imaging of Mouse Tissue by MALDI-TOF/TOF Mass Spectrometry and FTMS Introduction Matrix Assisted Laser Desorption Ionization (MALDI)
Springer Healthcare. Staging and Diagnosing Cutaneous Melanoma. Concise Reference. Dirk Schadendorf, Corinna Kochs, Elisabeth Livingstone
 Concise Reference Staging and Diagnosing Cutaneous Melanoma Dirk Schadendorf, Corinna Kochs, Elisabeth Livingstone Extracted from Handbook of Cutaneous Melanoma: A Guide to Diagnosis and Treatment Published
Fundamentals of Soft Ionization and MS Instrumentation
 Fundamentals of Soft Ionization and MS Instrumentation Ana Varela Coelho varela@itqb.unl.pt Mass Spectrometry Lab Analytical Services Unit Index Mass spectrometers and its components Ionization methods:
Agilent Protein In-Gel Tryptic Digestion Kit
 Agilent 5188-2749 Protein In-Gel Tryptic Digestion Kit Agilent Protein In-Gel Tryptic Digestion Kit Instructions Kit Contents The Protein In-Gel Tryptic Digestion Kit includes sufficient reagents for approximately
Melanoma. Kaushik Mukherjee MD A. Scott Pearson MD
 Melanoma Kaushik Mukherjee MD A. Scott Pearson MD Disclosures You still have to study Not all inclusive No Western blots Extensive use of Google Image Search and Sabiston Melanoma Basics 8 th most common
MS-IMS (MALDI-IMAGING)?
?") MS-IMS (MALDI-IMAGING)? Protein Chemistry/Proteomics and Peptide Synthesis and Array Unit Biomedicum Helsinki and Haartman Institute E-Mail: marc.baumann@helsinki.fi (http://research.med.helsinki.fi/corefacilities/proteinchem)
MS-IMS (MALDI-IMAGING)? Protein Chemistry/Proteomics and Peptide Synthesis and Array Unit Biomedicum Helsinki and Haartman Institute E-Mail: marc.baumann@helsinki.fi (http://research.med.helsinki.fi/corefacilities/proteinchem)
Matrix Assisted Laser Desorption Ionization Time-of-flight Mass Spectrometry
 Matrix Assisted Laser Desorption Ionization Time-of-flight Mass Spectrometry Time-of-Flight Mass Spectrometry. Basic principles An attractive feature of the time-of-flight (TOF) mass spectrometer is its
MALDI Imaging Drug Imaging Detlev Suckau Head of R&D MALDI Bruker Daltonik GmbH. December 19,
 MALDI Imaging Drug Imaging Detlev Suckau Head of R&D MALDI Bruker Daltonik GmbH December 19, 2014 1 The principle of MALDI imaging Spatially resolved mass spectra are recorded Each mass signal represents
Comparison of mass spectrometers performances
 Comparison of mass spectrometers performances Instrument Mass Mass Sensitivity resolution accuracy Quadrupole 1 x 10 3 0.1 Da* 0.5-1.0 pmol DE-MALDI 2 x 10 4 20 ppm 1-10 fmol peptide 1-5 pmol protein Ion
Mass Spectrometry. Mass spectrometer MALDI-TOF ESI/MS/MS. Basic components. Ionization source Mass analyzer Detector
 Mass Spectrometry MALDI-TOF ESI/MS/MS Mass spectrometer Basic components Ionization source Mass analyzer Detector 1 Principles of Mass Spectrometry Proteins are separated by mass to charge ratio (limit
MALDI-TOF. Introduction. Schematic and Theory of MALDI
 MALDI-TOF Proteins and peptides have been characterized by high pressure liquid chromatography (HPLC) or SDS PAGE by generating peptide maps. These peptide maps have been used as fingerprints of protein
(III) MALDI instrumentation
 MALDI instrumentation") Dr. Sanjeeva Srivastava (I) Basics of MALDI-TF (II) Sample preparation In-gel digestion Zip-tip sample clean-up Matrix and sample plating (III) MALDI instrumentation 2 1 (I) Basics of MALDI-TF Analyte
Dr. Sanjeeva Srivastava (I) Basics of MALDI-TF (II) Sample preparation In-gel digestion Zip-tip sample clean-up Matrix and sample plating (III) MALDI instrumentation 2 1 (I) Basics of MALDI-TF Analyte
Ionization Methods. Neutral species Charged species. Removal/addition of electron(s) Removal/addition of proton(s)
 Removal/addition of proton(s)") Ionization Methods Neutral species Charged species Removal/addition of electron(s) M + e - (M +. )* + 2e - electron ionization Removal/addition of proton(s) M + (Matrix)-H MH + + (Matrix) - chemical ionization
Ionization Methods Neutral species Charged species Removal/addition of electron(s) M + e - (M +. )* + 2e - electron ionization Removal/addition of proton(s) M + (Matrix)-H MH + + (Matrix) - chemical ionization
Ion Source. Mass Analyzer. Detector. intensity. mass/charge
 Proteomics Informatics Overview of spectrometry (Week 2) Ion Source Analyzer Detector Peptide Fragmentation Ion Source Analyzer 1 Fragmentation Analyzer 2 Detector b y Liquid Chromatography (LC)-MS/MS
Characterization of Disulfide Linkages in Proteins by 193 nm Ultraviolet Photodissociation (UVPD) Mass Spectrometry. Supporting Information
 Mass Spectrometry. Supporting Information") Characterization of Disulfide Linkages in Proteins by 193 nm Ultraviolet Photodissociation (UVPD) Mass Spectrometry M. Montana Quick, Christopher M. Crittenden, Jake A. Rosenberg, and Jennifer S. Brodbelt
Characterization of Disulfide Linkages in Proteins by 193 nm Ultraviolet Photodissociation (UVPD) Mass Spectrometry M. Montana Quick, Christopher M. Crittenden, Jake A. Rosenberg, and Jennifer S. Brodbelt
PTM Discovery Method for Automated Identification and Sequencing of Phosphopeptides Using the Q TRAP LC/MS/MS System
 Application Note LC/MS PTM Discovery Method for Automated Identification and Sequencing of Phosphopeptides Using the Q TRAP LC/MS/MS System Purpose This application note describes an automated workflow
2. Ionization Sources 3. Mass Analyzers 4. Tandem Mass Spectrometry
 Dr. Sanjeeva Srivastava 1. Fundamental of Mass Spectrometry Role of MS and basic concepts 2. Ionization Sources 3. Mass Analyzers 4. Tandem Mass Spectrometry 2 1 MS basic concepts Mass spectrometry - technique
Mass Spectrometry. Actual Instrumentation
 Mass Spectrometry Actual Instrumentation August 2017 See also http://www.uni-bielefeld.de/chemie/analytik/ms f additional infmation 1. MALDI TOF MASS SPECTROMETRY ON THE ULTRAFLEX 2 2. ESI MASS SPECTROMETRY
Cutaneous Melanoma: Epidemiology (USA) The Sentinel Node in Head and Neck Melanoma. Cutaneous Melanoma: Epidemiology (USA)
 The Sentinel Node in Head and Neck Melanoma. Cutaneous Melanoma: Epidemiology (USA)") The Sentinel Node in Head and Neck Melanoma Cutaneous Melanoma: Epidemiology (USA) 6 th leading cause of cancer among men and women 68,720 new cases of invasive melanoma in 2009 8,650 deaths from melanoma
The Sentinel Node in Head and Neck Melanoma Cutaneous Melanoma: Epidemiology (USA) 6 th leading cause of cancer among men and women 68,720 new cases of invasive melanoma in 2009 8,650 deaths from melanoma
Data Independent MALDI Imaging HDMS E for Visualization and Identification of Lipids Directly from a Single Tissue Section
 Data Independent MALDI Imaging HDMS E for Visualization and Identification of Lipids Directly from a Single Tissue Section Emmanuelle Claude, Mark Towers, and Kieran Neeson Waters Corporation, Manchester,
Dermatopathology: The tumor is composed of keratinocytes which show atypia, increase mitoses and abnormal mitoses.
 Squamous cell carcinoma (SCC): A common malignant tumor of keratinocytes arising in the epidermis, usually from a precancerous condition: 1- UV induced actinic keratosis, usually of low grade malignancy.
Next-Generation Immunohistochemistry: Multiplex tissue imaging with mass cytometry
 Nat Met, April 2014 Nat Med, April 2014 Next-Generation Immunohistochemistry: Multiplex tissue imaging with mass cytometry Journal Club Timo Böge Overview Introduction Conventional Immunohistochemistry
Mass Spectrometry. - Introduction - Ion sources & sample introduction - Mass analyzers - Basics of biomolecule MS - Applications
 - Introduction - Ion sources & sample introduction - Mass analyzers - Basics of biomolecule MS - Applications Adapted from Mass Spectrometry in Biotechnology Gary Siuzdak,, Academic Press 1996 1 Introduction
Impact of Prognostic Factors
 Melanoma Prognostic Factors: where we started, where are we going? Impact of Prognostic Factors Staging Management Surgical intervention Adjuvant treatment Suraj Venna, MD Assistant Clinical Professor,
1. Sample Introduction to MS Systems:
 MS Overview: 9.10.08 1. Sample Introduction to MS Systems:...2 1.1. Chromatography Interfaces:...3 1.2. Electron impact: Used mainly in Protein MS hard ionization source...4 1.3. Electrospray Ioniztion:
In-Gel Tryptic Digestion Kit
 INSTRUCTIONS In-Gel Tryptic Digestion Kit 3747 N. Meridian Road P.O. Box 117 Rockford, IL 61105 89871 1468.2 Number Description 89871 In-Gel Tryptic Digestion Kit, sufficient reagents for approximately
LOCALISATION, IDENTIFICATION AND SEPARATION OF MOLECULES. Gilles Frache Materials Characterization Day October 14 th 2016
 LOCALISATION, IDENTIFICATION AND SEPARATION OF MOLECULES Gilles Frache Materials Characterization Day October 14 th 2016 1 MOLECULAR ANALYSES Which focus? LOCALIZATION of molecules by Mass Spectrometry
Automated Sample Preparation/Concentration of Biological Samples Prior to Analysis via MALDI-TOF Mass Spectroscopy Application Note 222
 Automated Sample Preparation/Concentration of Biological Samples Prior to Analysis via MALDI-TOF Mass Spectroscopy Application Note 222 Joan Stevens, Ph.D.; Luke Roenneburg; Tim Hegeman; Kevin Fawcett
Double charge of 33kD peak A1 A2 B1 B2 M2+ M/z. ABRF Proteomics Research Group - Qualitative Proteomics Study Identifier Number 14146
 Abstract The 2008 ABRF Proteomics Research Group Study offers participants the chance to participate in an anonymous study to identify qualitative differences between two protein preparations. We used
Analysis of Peptides via Capillary HPLC and Fraction Collection Directly onto a MALDI Plate for Off-line Analysis by MALDI-TOF
 Analysis of Peptides via Capillary HPLC and Fraction Collection Directly onto a MALDI Plate for Off-line Analysis by MALDI-TOF Application Note 219 Joan Stevens, PhD; Luke Roenneburg; Kevin Fawcett (Gilson,
MALDI-TOF analysis of whole blood: its usefulness and potential in the assessment of HbA1c levels
 MALDI-TOF analysis of whole blood: its usefulness and potential in the assessment of HbA1c levels Jane Y. Yang, David A. Herold Department of Pathology, University of California San Diego, 9500 Gilman
Trypsin Mass Spectrometry Grade
 058PR-03 G-Biosciences 1-800-628-7730 1-314-991-6034 technical@gbiosciences.com A Geno Technology, Inc. (USA) brand name Trypsin Mass Spectrometry Grade A Chemically Modified, TPCK treated, Affinity Purified
REDOX PROTEOMICS. Roman Zubarev.
 REDOX PROTEOMICS Roman Zubarev Roman.Zubarev@ki.se Physiological Chemistry I, Department for Medical Biochemistry & Biophysics, Karolinska Institutet, Stockholm What is (RedOx) Proteomics? Proteomics -
Introduction to Proteomics 1.0
 Introduction to Proteomics 1.0 CMSP Workshop Pratik Jagtap Managing Director, CMSP Objectives Why are we here? For participants: Learn basics of MS-based proteomics Learn what s necessary for success using
Protein Analysis using Electrospray Ionization Mass Spectroscopy *
 OpenStax-CNX module: m38341 1 Protein Analysis using Electrospray Ionization Mass Spectroscopy * Wilhelm Kienast Andrew R. Barron This work is produced by OpenStax-CNX and licensed under the Creative Commons
Biological Mass spectrometry in Protein Chemistry
 Biological Mass spectrometry in Protein Chemistry Tuula Nyman Institute of Biotechnology tuula.nyman@helsinki.fi MASS SPECTROMETRY is an analytical technique that identifies the chemical composition of
New Instruments and Services
 New Instruments and Services http://planetorbitrap.com/orbitrap fusion Combining the best of quadrupole, Orbitrap, and ion trap mass analysis in a revolutionary Tribrid architecture, the Orbitrap Fusion
LC/MS/MS SOLUTIONS FOR LIPIDOMICS. Biomarker and Omics Solutions FOR DISCOVERY AND TARGETED LIPIDOMICS
 LC/MS/MS SOLUTIONS FOR LIPIDOMICS Biomarker and Omics Solutions FOR DISCOVERY AND TARGETED LIPIDOMICS Lipids play a key role in many biological processes, such as the formation of cell membranes and signaling
New Instruments and Services
 New Instruments and Services Liwen Zhang Mass Spectrometry and Proteomics Facility The Ohio State University Summer Workshop 2016 Thermo Orbitrap Fusion http://planetorbitrap.com/orbitrap fusion Thermo
PosterREPRINT A NOVEL APPROACH TO MALDI-TOF-MS SAMPLE PREPARATION. Presented at ABRF 2002, Austin, Texas, USA, 9th - 12th March 2002.
 Introduction A NOVEL APPROACH TO MALDI-TOF-MS SAMPLE PREPARATION Ed Bouvier 2, Jeff Brown 1, Emmanuelle Claude 1, John L. Gebler 2, Weibin Chen 2, *Dominic Gostick 1, Kevin Howes 1, James Langridge 1,
The study of phospholipids in single cells using an integrated microfluidic device
 Supporting Information: The study of phospholipids in single cells using an integrated microfluidic device combined with matrix-assisted laser desorption/ionization mass spectrometry Weiyi Xie,, Dan Gao,
Application Note # MT-91. High Quality MALDI Imaging of Proteins and Peptides in Small Rodent Organ Tissues. Bruker Daltonics.
 Bruker Daltonics Application Note # MT-91 18385 Da 6230 Da 7843 Da High Quality MALDI Imaging of Proteins and Peptides in Small Rodent Organ Tissues New developments in MALDI instrumentation, laser technology
Krunal Amin 7/17/2010 Josh Cannon Topics in Biology
 SUMMER VENTURES UNC CHARLOTTE 2010 1 Malignant Melanoma Krunal Amin 7/17/2010 Josh Cannon Topics in Biology 2 Abstract Malignant melanoma is a cancer of melanocytes. It is caused by environmental (mainly
Analysis of Triglycerides in Cooking Oils Using MALDI-TOF Mass Spectrometry and Principal Component Analysis
 Analysis of Triglycerides in Cooking Oils Using MALDI-TOF Mass Spectrometry and Principal Component Analysis Kevin Cooley Chemistry Supervisor: Kingsley Donkor 1. Abstract Triglycerides are composed of
Isolation of pure cell populations from healthy and
 Direct Analysis of Laser Capture Microdissected Cells by MALDI Mass Spectrometry Baogang J. Xu and Richard M. Caprioli Department of Chemistry, Vanderbilt University, Nashville, Tennessee, USA Melinda
O O H. Robert S. Plumb and Paul D. Rainville Waters Corporation, Milford, MA, U.S. INTRODUCTION EXPERIMENTAL. LC /MS conditions
 Simplifying Qual/Quan Analysis in Discovery DMPK using UPLC and Xevo TQ MS Robert S. Plumb and Paul D. Rainville Waters Corporation, Milford, MA, U.S. INTRODUCTION The determination of the drug metabolism
Agilent 6410 Triple Quadrupole LC/MS. Sensitivity, Reliability, Value
 Agilent 64 Triple Quadrupole LC/MS Sensitivity, Reliability, Value Sensitivity, Reliability, Value Whether you quantitate drug metabolites, measure herbicide levels in food, or determine contaminant levels
Advances in Hybrid Mass Spectrometry
 The world leader in serving science Advances in Hybrid Mass Spectrometry ESAC 2008 Claire Dauly Field Marketing Specialist, Proteomics New hybrids instruments LTQ Orbitrap XL with ETD MALDI LTQ Orbitrap
INTRODUCTION TO MALDI IMAGING
 INTRODUCTION TO MALDI IMAGING Marten F. Snel, Emmanuelle Claude, Thérèse McKenna, and James I. Langridge Waters Corporation, Manchester, UK INT RODUCTION The last few years have seen a rapid increase in
An Alternative Approach: Top-Down Bioanalysis of Intact Large Molecules Can this be part of the future? Lecture 8, Page 27
 An Alternative Approach: Top-Down Bioanalysis of Intact Large Molecules Can this be part of the future? Lecture 8, Page 27 Top-down HRAM Bioanalysis of Native Proteins/Molecules Relative Abundance 100
Metastatic Melanoma. Cynthia Kwong February 16, 2017 SUNY Downstate Medical Center Department of Surgery Grand Rounds
 Metastatic Melanoma Cynthia Kwong February 16, 2017 SUNY Downstate Medical Center Department of Surgery Grand Rounds Case Presentation 77 year old male with previous history of scalp melanoma and thyroid
Characterization of Noncovalent Complexes of Polyelectrolytes by Mass Spectrometry
 The University of Akron IdeaExchange@UAkron Honors Research Projects The Dr. Gary B. and Pamela S. Williams Honors College Spring 2015 Characterization of Noncovalent Complexes of Polyelectrolytes by Mass
Malignant Melanoma Early Stage. A guide for patients
 This melanoma patient brochure is designed to help educate melanoma patients and their caregivers. It was developed under the guidance of Dr. Michael Smylie, Professor, Department of Oncology, University
Rapid, Simple Impurity Characterization with the Xevo TQ Mass Spectrometer
 Robert Plumb, Michael D. Jones, and Marian Twohig Waters Corporation, Milford, MA, USA INTRODUCTION The detection and characterization of impurities and degradation products of an active pharmaceutical
ANALYTISCHE STRATEGIE Tissue Imaging. Bernd Bodenmiller Institute of Molecular Life Sciences University of Zurich
 ANALYTISCHE STRATEGIE Tissue Imaging Bernd Bodenmiller Institute of Molecular Life Sciences University of Zurich Quantitative Breast single cancer cell analysis Switzerland Brain Breast Lung Colon-rectum
Skin Cancer. 5 Warning Signs. American Osteopathic College of Occupational and Preventive Medicine OMED 2012, San Diego, Monday, October 8, 2012 C-1
 Skin Cancer AMERICAN OSTEOPATHIC COLLEGE OF OCCUPATIONAL & PREVENTIVE MEDICINE OMED 2012 October 8, 2012 E. Robert Wanat II, D.O., M.P.H. Learning Objectives: Identify the 3 Basic Types of Skin Cancer
Dermatopathology. Dr. Rafael Botella Estrada. Hospital La Fe de Valencia
 Dermatopathology Dr. Rafael Botella Estrada. Hospital La Fe de Valencia Melanoma and mimics Dr. Martin Mihm Malignant lesions result from the accumulation of mutations Class I lesions (benign) Class II
Don t miss a thing on your peptide mapping journey How to get full coverage peptide maps using high resolution accurate mass spectrometry
 Don t miss a thing on your peptide mapping journey How to get full coverage peptide maps using high resolution accurate mass spectrometry Kai Scheffler, PhD BioPharma Support Expert,LSMS Europe The world
Molecular Imaging and Breast Cancer
 Molecular Imaging and Breast Cancer Breast cancer forms in tissues of the breast usually in the ducts, tubes that carry milk to the nipple, and lobules, the glands that make milk. It occurs in both men
FPO. Label-Free Molecular Imaging. Innovation with Integrity. Discover, localize and quantify biochemical changes and molecular markers
 FPO Label-Free Molecular Imaging Discover, localize and quantify biochemical changes and molecular markers Innovation with Integrity Mass Spectrometry Bruker, the global leader in MALDI-MS technology,
New Developments in LC-IMS-MS Proteomic Measurements and Informatic Analyses
 New Developments in LC-IMS-MS Proteomic Measurements and Informatic Analyses Erin Shammel Baker Kristin E. Burnum-Johnson, Xing Zhang, Cameron P. Casey, Yehia M. Ibrahim, Matthew E. Monroe, Tao Liu, Brendan
SYNAPT G2-S High Definition MS (HDMS) System
 System") SYNAPT G2-S High Definition MS (HDMS) System High performance, versatility, and workflow efficiency of your MS system all play a crucial role in your ability to successfully reach your scientific and business
SYNAPT G2-S High Definition MS (HDMS) System High performance, versatility, and workflow efficiency of your MS system all play a crucial role in your ability to successfully reach your scientific and business
Living Beyond Cancer Skin Cancer Detection and Prevention
 Living Beyond Cancer Skin Cancer Detection and Prevention Cutaneous Skin Cancers Identification Diagnosis Treatment options Prevention What is the most common cancer in people? What is the most common
Mass Spectrometry Course Árpád Somogyi Chemistry and Biochemistry MassSpectrometry Facility) University of Debrecen, April 12-23, 2010
 University of Debrecen, April 12-23, 2010") Mass Spectrometry Course Árpád Somogyi Chemistry and Biochemistry MassSpectrometry Facility) University of Debrecen, April 12-23, 2010 Introduction, Ionization Methods Mass Analyzers, Ion Activation Methods
Mass Spectrometry Course Árpád Somogyi Chemistry and Biochemistry MassSpectrometry Facility) University of Debrecen, April 12-23, 2010 Introduction, Ionization Methods Mass Analyzers, Ion Activation Methods
Melanoma: The Basics. What is a melanocyte?
 Melanoma: The Basics What is a melanocyte? A melanocyte is a normal cell, found in the skin, which produces melanin. Melanin is a black or dark brown pigment that is seen in the skin, hair, and parts of
Applications for MALDI-TOF Imaging Present and Future
 Y Position 8563 / (3000-30000) 12124 / (3000-30000) 14044 / (3000-30000) 10158 35 / (3000-30000) 15012 / (3000-30000) 10894 / (3000-30000) 4964 / (3000-30000) 12414 / (3000-30000) Area Chromatogram - All
Molecular Imaging and Cancer
 Molecular Imaging and Cancer Cancer causes one in every four deaths in the United States, second only to heart disease. According to the U.S. Department of Health and Human Services, more than 512,000
Metabolomics: quantifying the phenotype
 Metabolomics: quantifying the phenotype Metabolomics Promises Quantitative Phenotyping What can happen GENOME What appears to be happening Bioinformatics TRANSCRIPTOME What makes it happen PROTEOME Systems
Biomolecular Mass Spectrometry
 Lipids ot different than other organic small molecules Carbohydrates Polymers of monosaccharides linked via glycosidic bonds (acetals/ ketals) many different combinationsvery interesting no time ucleic
A Definitive Lipidomics Workflow for Human Plasma Utilizing Off-line Enrichment and Class Specific Separation of Phospholipids
 A Definitive Lipidomics Workflow for Human Plasma Utilizing Off-line Enrichment and Class Specific Separation of Phospholipids Jeremy Netto, 1 Stephen Wong, 1 Federico Torta, 2 Pradeep Narayanaswamy, 2
Multiplex Protein Quantitation using itraq Reagents in a Gel-Based Workflow
 Multiplex Protein Quantitation using itraq Reagents in a Gel-Based Workflow Purpose Described herein is a workflow that combines the isobaric tagging reagents, itraq Reagents, with the separation power
Integumentary System
 Integumentary System The integumentary system is commonly known as the Skin Largest organ of human body 10% total body weight and would cover over 20 square feet Functions of Skin 1. Protection Barrier
Ultra Performance Liquid Chromatography Coupled to Orthogonal Quadrupole TOF MS(MS) for Metabolite Identification
 for Metabolite Identification") 22 SEPARATION SCIENCE REDEFINED MAY 2005 Ultra Performance Liquid Chromatography Coupled to Orthogonal Quadrupole TOF MS(MS) for Metabolite Identification In the drug discovery process the detection and
22 SEPARATION SCIENCE REDEFINED MAY 2005 Ultra Performance Liquid Chromatography Coupled to Orthogonal Quadrupole TOF MS(MS) for Metabolite Identification In the drug discovery process the detection and
Molecular Cartography:
 Molecular Cartography: Moving Towards Combined Topographical and Chemical Imaging Using AFM and Mass Spectrometry Olga S. Ovchinnikova Organic and Biological Mass Spectrometry Group, Chemical Sciences
Identifying Skin Cancer. Mary S. Stone MD Professor of Dermatology and Pathology University of Iowa Carver College of Medicine March, 2018
 Identifying Skin Cancer Mary S. Stone MD Professor of Dermatology and Pathology University of Iowa Carver College of Medicine March, 2018 American Cancer Society web site Skin Cancer Melanoma Non-Melanoma
Identification of Steroids in Water by Ion Trap LC/MS/MS Application
 Identification of Steroids in Water by Ion Trap LC/MS/MS Application Environmental Author Paul Zavitsanos and Christine Miller Agilent Technologies, Inc. Centerville Road Wilmington, DE 9- USA Abstract
Proteomics/Peptidomics
 Proteomics/Peptidomics System biology tools and preclinical models for translational research in endometriosis, ESHRE Campus workshop, 4-5 September 2009 E. Waelkens Proteomics: What? Proteins Proteomics
Improve Protein Analysis with the New, Mass Spectrometry- Compatible ProteasMAX Surfactant
 Improve Protein Analysis with the New, Mass Spectrometry- Compatible Surfactant ABSTRACT Incomplete solubilization and digestion and poor peptide recovery are frequent limitations in protein sample preparation
130327SCH4U_biochem April 09, 2013
 Option B: B1.1 ENERGY Human Biochemistry If more energy is taken in from food than is used up, weight gain will follow. Similarly if more energy is used than we supply our body with, weight loss will occur.
Supporting information for: Memory Efficient. Principal Component Analysis for the Dimensionality. Reduction of Large Mass Spectrometry Imaging
 Supporting information for: Memory Efficient Principal Component Analysis for the Dimensionality Reduction of Large Mass Spectrometry Imaging Datasets Alan M. Race,,, Rory T. Steven,, Andrew D. Palmer,,,
MS/MS to Targeted Proteomics (MRM)
") MS/MS to Targeted Proteomics (MRM) How it worked on the Human Lens Proteome Jayson Falkner PhD jay@singleorganism.com Genes Show Limited Value in Predicting Diseases With only a few exceptions, what the
MS/MS to Targeted Proteomics (MRM) How it worked on the Human Lens Proteome Jayson Falkner PhD jay@singleorganism.com Genes Show Limited Value in Predicting Diseases With only a few exceptions, what the
Using CART to Mine SELDI ProteinChip Data for Biomarkers and Disease Stratification
 Using CART to Mine SELDI ProteinChip Data for Biomarkers and Disease Stratification Kenna Mawk, D.V.M. Informatics Product Manager Ciphergen Biosystems, Inc. Outline Introduction to ProteinChip Technology
TECHNICAL BULLETIN. R 2 GlcNAcβ1 4GlcNAcβ1 Asn
 GlycoProfile II Enzymatic In-Solution N-Deglycosylation Kit Product Code PP0201 Storage Temperature 2 8 C TECHNICAL BULLETIN Product Description Glycosylation is one of the most common posttranslational
Proteins. Amino acids, structure and function. The Nobel Prize in Chemistry 2012 Robert J. Lefkowitz Brian K. Kobilka
 Proteins Amino acids, structure and function The Nobel Prize in Chemistry 2012 Robert J. Lefkowitz Brian K. Kobilka O O HO N N HN OH Ser65-Tyr66-Gly67 The Nobel prize in chemistry 2008 Osamu Shimomura,
Supporting Information
 Supporting Information Wiley-VCH 2006 69451 Weinheim, Germany Tissue Imaging at Atmospheric Pressure using Desorption Electrospray Ionization (DESI) Mass Spectrometry Justin M. Wiseman, Demian R. Ifa,
An optical dosimeter for the selective detection of gaseous phosgene with ultra-low detection limit
 Supporting information for An optical dosimeter for the selective detection of gaseous phosgene with ultra-low detection limit Alejandro P. Vargas, Francisco Gámez*, Javier Roales, Tània Lopes-Costa and
Trypsin Digestion Mix
 G-Biosciences 1-800-628-7730 1-314-991-6034 technical@gbiosciences.com A Geno Technology, Inc. (USA) brand name 239PR Trypsin Digestion Mix Provides optimal buffered conditions for in gel trypsin digestion
WHAT DOES THE PATHOLOGY REPORT MEAN?
 Melanoma WHAT IS MELANOMA? Melanoma is a type of cancer that affects cells called melanocytes. These cells are found mainly in skin but also in the lining of other areas such as nose and rectum, and also