Doing Thousands of Hypothesis Tests at the Same Time. Bradley Efron Stanford University
|
|
|
- Ellen Green
- 5 years ago
- Views:
Transcription
1 Doing Thousands of Hypothesis Tests at the Same Time Bradley Efron Stanford University 1
2 Simultaneous Hypothesis Testing 1980: Simultaneous Statistical Inference (Rupert Miller) 2, 3,, 20 simultaneous tests Today: Several thousand tests High Throughput Devices: Microarrays, fmri, proteomics, large-scale surveys Love/Hate Classical single-test theory frequentist, Bayes, empirical Bayes 2
3 A Microarray Example: The Prostate Data (Singh et al. 2002) 102 Subjects: 50 normal, 52 cancer genes: Which genes are non-null? i.e. expressed differently in cancer vs normal subjects? 3
4 t-statistics and z-scores i th row of X normals (x i1, x i2,, x i50 ) cancer (x i51, x i52,, x i102 ) t i t i = two-sample t-stat, cancer vs normals z-scores where Theoretical Null 4
5 5
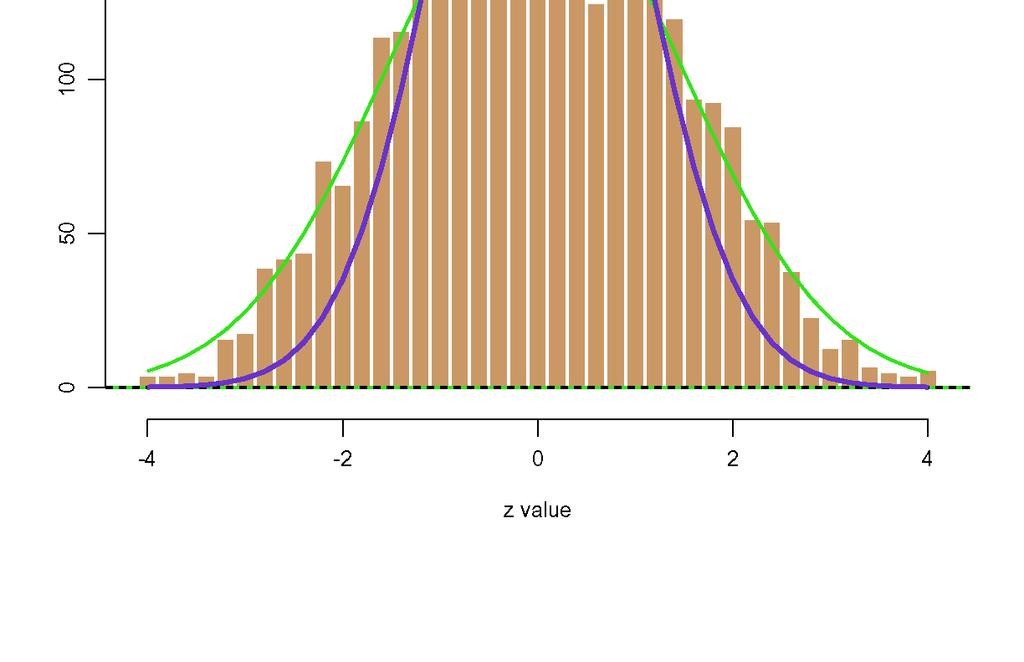
6 The Two-Groups Model Two Classes of Genes null, non-null p 0 = Prob {null}, p 1 = Prob {non-null}, f 0 (z) density if null f 1 (z) density if non-null Theoretical Null (fits center of histogram) 6
7 False Discovery Rates (Efron 2006) Mixture density Bayes Rule Local false discovery rate Replace densities with cdfs 7
8 Empirical Bayes Estimate mixture density f(z) from observed z-values Don t need: independent, t-tests 8
9 9
10 Basic Fdr Idea Histogram has 49 bins, width # {null genes in # {null genes in About one sixth of the 17 genes in are false discoveries 10
11 11
12 The Non-Null Counts So estimated number non-nulls in is where Plotted bars used smoothed version. 12
13 Power Diagnostics (Efron 2006, Section 3) Good Power: Expected Non-Null fdr Prostate Data (Bad!) Why aren t our favorite genes on your list of non-null cases? 13
14 Increased Sample Size Multiply number microarrays by 100 non-tumor men, 104 tumor) Can estimate improvement in c:
15 The BRCA Data (Hedenfalk et al. 2001) Microarray study comparing tumors from women with BRCA1 or BRCA2 mutations 15 microarrays: 7 BRCA1, 8 BRCA2, same 3226 genes: Theoretical Null 15
16 16
17 Four Arguments Against the Theoretical Null Central histogram doesn t match theoretical Central hist matches empirical null Four Reasons Why null Reason 1 Failed Assumptions: Maybe nonnormality of microarray measurements Distorts student s t distribution for Permutation Null: Scramble the 102 microarrays (gives 17
18 Reason 2: Unobserved Covariates (Efron 2004, Section 4) BRCA Study Observational Unobserved Covariates Age, Wt, Stage, Race If observed would be factored out of Tends to widen null density Could account for BRCA histogram Won t show up in permutation distribution 18
19 Reason 3: Correlation Across Arrays Student-t null density assumes independence across microarrays Principle Component Analysis showed correlation Less than 13 df Not detectable from permutations 19
20 Reason 4: Correlation Across Genes (Efron 2007) independence of gene measurements. However: gene-wise correlations affect BRCA: 5 million pairwise correlations rms correlation = 0.15 Even if Not detectable from permutations. 20
21 21
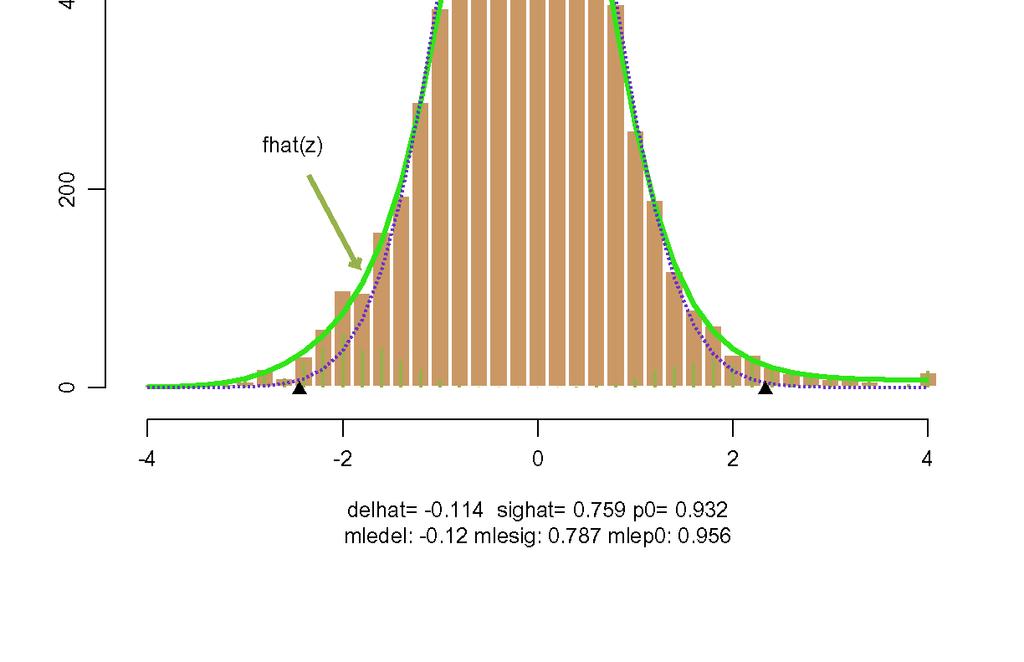
22 Empirical Null Estimation Theoretical may not fit -value histogram central peak fit from histogram counts near [ zero assumption ] Central Matching : (1) Plot (2) Find best quadratic match near (3) coeffs of match Nearly unbiased for Efron (2004). 22
23 23
24 Direct Maximum Likelihood Estimation of Assume all the are from the null density Let Then follows a truncated distribution: can estimate More biased, less variable than central matching method 24
25 25
26 Large-Scale Simultaneous Testing Not just a lot of classical single tests Multiplicities Empirical Bayes Can learn things you didn t want to know Permutation methods not cure-alls Modelling: Better to minimize Model inside of? Big data sets should supply own models 26
27 References Efron (2004). Large-scale simultaneous hypothesis testing: The choice of a null hypothesis. JASA 99, Efron (2006). Microarrays, empirical Bayes, and the two-groups model. Efron (2007). Correlation and large-scale simultaneous significance testing. JASA 102, Singh et al. (2002). Gene expression correlates of clinical prostate cancer behavior. Cancer Cell 1: Hedenfalk et al. (2001). Gene expression profiles in hereditary breast cancer. N. Engl. J. Med Van t Wout et al. (2003). Cellular human gene expression upon human immunodeficiency versus type 1 infection of CDS + T-Cell lines. J. Virol locfdr R program, available on CRAN on Efron site above. 27
Comments on Significance of candidate cancer genes as assessed by the CaMP score by Parmigiani et al.
 Comments on Significance of candidate cancer genes as assessed by the CaMP score by Parmigiani et al. Holger Höfling Gad Getz Robert Tibshirani June 26, 2007 1 Introduction Identifying genes that are involved
False Discovery Rates and Copy Number Variation. Bradley Efron and Nancy Zhang Stanford University
 False Discovery Rates and Copy Number Variation Bradley Efron and Nancy Zhang Stanford University Three Statistical Centuries 19th (Quetelet) Huge data sets, simple questions 20th (Fisher, Neyman, Hotelling,...
Computer Age Statistical Inference. Algorithms, Evidence, and Data Science. BRADLEY EFRON Stanford University, California
 Computer Age Statistical Inference Algorithms, Evidence, and Data Science BRADLEY EFRON Stanford University, California TREVOR HASTIE Stanford University, California ggf CAMBRIDGE UNIVERSITY PRESS Preface
Chapter 25. Paired Samples and Blocks. Copyright 2010 Pearson Education, Inc.
 Chapter 25 Paired Samples and Blocks Copyright 2010 Pearson Education, Inc. Paired Data Data are paired when the observations are collected in pairs or the observations in one group are naturally related
Bayesians, Frequentists, and Scientists
 Bayesians, Frequentists, and Scientists Bradley EFRON Broadly speaking, nineteenth century statistics was Bayesian, while the twentieth century was frequentist, at least from the point of view of most
MS&E 226: Small Data
 MS&E 226: Small Data Lecture 10: Introduction to inference (v2) Ramesh Johari ramesh.johari@stanford.edu 1 / 17 What is inference? 2 / 17 Where did our data come from? Recall our sample is: Y, the vector
Comparison of Gene Set Analysis with Various Score Transformations to Test the Significance of Sets of Genes
 Comparison of Gene Set Analysis with Various Score Transformations to Test the Significance of Sets of Genes Ivan Arreola and Dr. David Han Department of Management of Science and Statistics, University
ST440/550: Applied Bayesian Statistics. (10) Frequentist Properties of Bayesian Methods
 Frequentist Properties of Bayesian Methods") (10) Frequentist Properties of Bayesian Methods Calibrated Bayes So far we have discussed Bayesian methods as being separate from the frequentist approach However, in many cases methods with frequentist
(10) Frequentist Properties of Bayesian Methods Calibrated Bayes So far we have discussed Bayesian methods as being separate from the frequentist approach However, in many cases methods with frequentist
ROLE OF RANDOMIZATION IN BAYESIAN ANALYSIS AN EXPOSITORY OVERVIEW by Jayanta K. Ghosh Purdue University and I.S.I. Technical Report #05-04
 ROLE OF RANDOMIZATION IN BAYESIAN ANALYSIS AN EXPOSITORY OVERVIEW by Jayanta K. Ghosh Purdue University and I.S.I. Technical Report #05-04 Department of Statistics Purdue University West Lafayette, IN
UNLOCKING VALUE WITH DATA SCIENCE BAYES APPROACH: MAKING DATA WORK HARDER
 UNLOCKING VALUE WITH DATA SCIENCE BAYES APPROACH: MAKING DATA WORK HARDER 2016 DELIVERING VALUE WITH DATA SCIENCE BAYES APPROACH - MAKING DATA WORK HARDER The Ipsos MORI Data Science team increasingly
Institutional Ranking. VHA Study
 Statistical Inference for Ranks of Health Care Facilities in the Presence of Ties and Near Ties Minge Xie Department of Statistics Rutgers, The State University of New Jersey Supported in part by NSF,
Stepwise method Modern Model Selection Methods Quantile-Quantile plot and tests for normality
 Week 9 Hour 3 Stepwise method Modern Model Selection Methods Quantile-Quantile plot and tests for normality Stat 302 Notes. Week 9, Hour 3, Page 1 / 39 Stepwise Now that we've introduced interactions,
Bayesian performance
 Bayesian performance In this section we will study the statistical properties of Bayesian estimates. Major topics include: The likelihood principle Decision theory/bayes rules Shrinkage estimators Frequentist
Assignment #6. Chapter 10: 14, 15 Chapter 11: 14, 18. Due tomorrow Nov. 6 th by 2pm in your TA s homework box
 Assignment #6 Chapter 10: 14, 15 Chapter 11: 14, 18 Due tomorrow Nov. 6 th by 2pm in your TA s homework box Assignment #7 Chapter 12: 18, 24 Chapter 13: 28 Due next Friday Nov. 13 th by 2pm in your TA
Here are the various choices. All of them are found in the Analyze menu in SPSS, under the sub-menu for Descriptive Statistics :
 Descriptive Statistics in SPSS When first looking at a dataset, it is wise to use descriptive statistics to get some idea of what your data look like. Here is a simple dataset, showing three different
Physiological Mechanisms of Lucid Dreaming. Stephen LaBerge Sleep Research Center Stanford University
 Physiological Mechanisms of Lucid Dreaming Stephen LaBerge Sleep Research Center Stanford University For those of you here who aren t familiar with the general approach we have been using in our research
Understanding Statistics for Research Staff!
 Statistics for Dummies? Understanding Statistics for Research Staff! Those of us who DO the research, but not the statistics. Rachel Enriquez, RN PhD Epidemiologist Why do we do Clinical Research? Epidemiology
Lec 02: Estimation & Hypothesis Testing in Animal Ecology
 Lec 02: Estimation & Hypothesis Testing in Animal Ecology Parameter Estimation from Samples Samples We typically observe systems incompletely, i.e., we sample according to a designed protocol. We then
Structural Equation Modeling (SEM)
") Structural Equation Modeling (SEM) Today s topics The Big Picture of SEM What to do (and what NOT to do) when SEM breaks for you Single indicator (ASU) models Parceling indicators Using single factor scores
Structural Equation Modeling (SEM) Today s topics The Big Picture of SEM What to do (and what NOT to do) when SEM breaks for you Single indicator (ASU) models Parceling indicators Using single factor scores
MODEL-BASED CLUSTERING IN GENE EXPRESSION MICROARRAYS: AN APPLICATION TO BREAST CANCER DATA
 International Journal of Software Engineering and Knowledge Engineering Vol. 13, No. 6 (2003) 579 592 c World Scientific Publishing Company MODEL-BASED CLUSTERING IN GENE EXPRESSION MICROARRAYS: AN APPLICATION
Application of Resampling Methods in Microarray Data Analysis
 Application of Resampling Methods in Microarray Data Analysis Tests for two independent samples Oliver Hartmann, Helmut Schäfer Institut für Medizinische Biometrie und Epidemiologie Philipps-Universität
Response to the ASA s statement on p-values: context, process, and purpose
 Response to the ASA s statement on p-values: context, process, purpose Edward L. Ionides Alexer Giessing Yaacov Ritov Scott E. Page Departments of Complex Systems, Political Science Economics, University
Reflection Questions for Math 58B
 Reflection Questions for Math 58B Johanna Hardin Spring 2017 Chapter 1, Section 1 binomial probabilities 1. What is a p-value? 2. What is the difference between a one- and two-sided hypothesis? 3. What
Even Small Sins can Cause Cancer or perhaps just bad dumb luck
 Even Small Sins can Cause Cancer or perhaps just bad dumb luck Excessive Environmental risks and heredity get the most blame for cancer, but new research released says that even moderate bad lifestyle
Propensity Score Methods for Estimating Causality in the Absence of Random Assignment: Applications for Child Care Policy Research
 2012 CCPRC Meeting Methodology Presession Workshop October 23, 2012, 2:00-5:00 p.m. Propensity Score Methods for Estimating Causality in the Absence of Random Assignment: Applications for Child Care Policy
Score Tests of Normality in Bivariate Probit Models
 Score Tests of Normality in Bivariate Probit Models Anthony Murphy Nuffield College, Oxford OX1 1NF, UK Abstract: A relatively simple and convenient score test of normality in the bivariate probit model
Hour 2: lm (regression), plot (scatterplots), cooks.distance and resid (diagnostics) Stat 302, Winter 2016 SFU, Week 3, Hour 1, Page 1
, plot (scatterplots), cooks.distance and resid (diagnostics) Stat 302, Winter 2016 SFU, Week 3, Hour 1, Page 1") Agenda for Week 3, Hr 1 (Tuesday, Jan 19) Hour 1: - Installing R and inputting data. - Different tools for R: Notepad++ and RStudio. - Basic commands:?,??, mean(), sd(), t.test(), lm(), plot() - t.test()
Agenda for Week 3, Hr 1 (Tuesday, Jan 19) Hour 1: - Installing R and inputting data. - Different tools for R: Notepad++ and RStudio. - Basic commands:?,??, mean(), sd(), t.test(), lm(), plot() - t.test()
Bayes Factors for t tests and one way Analysis of Variance; in R
 Bayes Factors for t tests and one way Analysis of Variance; in R Dr. Jon Starkweather It may seem like small potatoes, but the Bayesian approach offers advantages even when the analysis to be run is not
Metabolomic Data Analysis with MetaboAnalyst
 Metabolomic Data Analysis with MetaboAnalyst User ID: guest6501 April 16, 2009 1 Data Processing and Normalization 1.1 Reading and Processing the Raw Data MetaboAnalyst accepts a variety of data types
What do you think of the following research? I m interested in whether a low glycemic index diet gives better control of diabetes than a high
 What do you think of the following research? I m interested in whether a low glycemic index diet gives better control of diabetes than a high glycemic index diet. So I randomly assign 100 people with type
Fundamental Clinical Trial Design
 Design, Monitoring, and Analysis of Clinical Trials Session 1 Overview and Introduction Overview Scott S. Emerson, M.D., Ph.D. Professor of Biostatistics, University of Washington February 17-19, 2003
HW 1 - Bus Stat. Student:
 HW 1 - Bus Stat Student: 1. An identification of police officers by rank would represent a(n) level of measurement. A. Nominative C. Interval D. Ratio 2. A(n) variable is a qualitative variable such that
"PRINCIPLES OF PHYLOGENETICS: ECOLOGY AND EVOLUTION"
 "PRINCIPLES OF PHYLOGENETICS: ECOLOGY AND EVOLUTION" Integrative Biology 200B University of California, Berkeley Lab for Jan 25, 2011, Introduction to Statistical Thinking A. Concepts: A way of making
Bias Adjustment: Local Control Analysis of Radon and Ozone
 Bias Adjustment: Local Control Analysis of Radon and Ozone S. Stanley Young Robert Obenchain Goran Krstic NCSU 19Oct2016 Abstract Bias Adjustment: Local control analysis of Radon and ozone S. Stanley Young,
Midterm Exam ANSWERS Categorical Data Analysis, CHL5407H
 Midterm Exam ANSWERS Categorical Data Analysis, CHL5407H 1. Data from a survey of women s attitudes towards mammography are provided in Table 1. Women were classified by their experience with mammography
Tutorial 3: MANOVA. Pekka Malo 30E00500 Quantitative Empirical Research Spring 2016
 Tutorial 3: Pekka Malo 30E00500 Quantitative Empirical Research Spring 2016 Step 1: Research design Adequacy of sample size Choice of dependent variables Choice of independent variables (treatment effects)
UNIT 4 ALGEBRA II TEMPLATE CREATED BY REGION 1 ESA UNIT 4
 UNIT 4 ALGEBRA II TEMPLATE CREATED BY REGION 1 ESA UNIT 4 Algebra II Unit 4 Overview: Inferences and Conclusions from Data In this unit, students see how the visual displays and summary statistics they
15.301/310, Managerial Psychology Prof. Dan Ariely Recitation 8: T test and ANOVA
 15.301/310, Managerial Psychology Prof. Dan Ariely Recitation 8: T test and ANOVA Statistics does all kinds of stuff to describe data Talk about baseball, other useful stuff We can calculate the probability.
Statistical Analysis of Biomarker Data
 Statistical Analysis of Biomarker Data Gary M. Clark, Ph.D. Vice President Biostatistics & Data Management Array BioPharma Inc. Boulder, CO NCIC Clinical Trials Group New Investigator Clinical Trials Course
How should the propensity score be estimated when some confounders are partially observed?
 How should the propensity score be estimated when some confounders are partially observed? Clémence Leyrat 1, James Carpenter 1,2, Elizabeth Williamson 1,3, Helen Blake 1 1 Department of Medical statistics,
Final Exam PS 217, Spring 2004
 Final Exam PS 217, Spring 24 1. What is the relationship between power and effect size? That is, when you are considering a research design in which there is a large effect size, what are the implications
PSYCH-GA.2211/NEURL-GA.2201 Fall 2016 Mathematical Tools for Cognitive and Neural Science. Homework 5
 PSYCH-GA.2211/NEURL-GA.2201 Fall 2016 Mathematical Tools for Cognitive and Neural Science Homework 5 Due: 21 Dec 2016 (late homeworks penalized 10% per day) See the course web site for submission details.
Gene Selection for Tumor Classification Using Microarray Gene Expression Data
 Gene Selection for Tumor Classification Using Microarray Gene Expression Data K. Yendrapalli, R. Basnet, S. Mukkamala, A. H. Sung Department of Computer Science New Mexico Institute of Mining and Technology
Introduction. Patrick Breheny. January 10. The meaning of probability The Bayesian approach Preview of MCMC methods
 Introduction Patrick Breheny January 10 Patrick Breheny BST 701: Bayesian Modeling in Biostatistics 1/25 Introductory example: Jane s twins Suppose you have a friend named Jane who is pregnant with twins
Bayesians methods in system identification: equivalences, differences, and misunderstandings
 Bayesians methods in system identification: equivalences, differences, and misunderstandings Johan Schoukens and Carl Edward Rasmussen ERNSI 217 Workshop on System Identification Lyon, September 24-27,
Carrying out an Empirical Project
 Carrying out an Empirical Project Empirical Analysis & Style Hint Special program: Pre-training 1 Carrying out an Empirical Project 1. Posing a Question 2. Literature Review 3. Data Collection 4. Econometric
Hypothesis-Driven Research
 Hypothesis-Driven Research Research types Descriptive science: observe, describe and categorize the facts Discovery science: measure variables to decide general patterns based on inductive reasoning Hypothesis-driven
Outlier Analysis. Lijun Zhang
 Outlier Analysis Lijun Zhang zlj@nju.edu.cn http://cs.nju.edu.cn/zlj Outline Introduction Extreme Value Analysis Probabilistic Models Clustering for Outlier Detection Distance-Based Outlier Detection Density-Based
STATISTICAL INFERENCE 1 Richard A. Johnson Professor Emeritus Department of Statistics University of Wisconsin
 STATISTICAL INFERENCE 1 Richard A. Johnson Professor Emeritus Department of Statistics University of Wisconsin Key words : Bayesian approach, classical approach, confidence interval, estimation, randomization,
Making Inferences from Experiments
 11.6 Making Inferences from Experiments Essential Question How can you test a hypothesis about an experiment? Resampling Data Yield (kilograms) Control Group Treatment Group 1. 1.1 1.2 1. 1.5 1.4.9 1.2
GlobalAncova with Special Sum of Squares Decompositions
 GlobalAncova with Special Sum of Squares Decompositions Ramona Scheufele Manuela Hummel Reinhard Meister Ulrich Mansmann October 30, 2018 Contents 1 Abstract 1 2 Sequential and Type III Decomposition 2
Appendix B Statistical Methods
 Appendix B Statistical Methods Figure B. Graphing data. (a) The raw data are tallied into a frequency distribution. (b) The same data are portrayed in a bar graph called a histogram. (c) A frequency polygon
MBios 478: Systems Biology and Bayesian Networks, 27 [Dr. Wyrick] Slide #1. Lecture 27: Systems Biology and Bayesian Networks
![MBios 478: Systems Biology and Bayesian Networks, 27 [Dr. Wyrick] Slide #1. Lecture 27: Systems Biology and Bayesian Networks](/thumbs/80/82116384.jpg "MBios 478: Systems Biology and Bayesian Networks, 27 [Dr. Wyrick] Slide #1. Lecture 27: Systems Biology and Bayesian Networks") MBios 478: Systems Biology and Bayesian Networks, 27 [Dr. Wyrick] Slide #1 Lecture 27: Systems Biology and Bayesian Networks Systems Biology and Regulatory Networks o Definitions o Network motifs o Examples
MBios 478: Systems Biology and Bayesian Networks, 27 [Dr. Wyrick] Slide #1 Lecture 27: Systems Biology and Bayesian Networks Systems Biology and Regulatory Networks o Definitions o Network motifs o Examples
Two-Way Independent ANOVA
 Two-Way Independent ANOVA Analysis of Variance (ANOVA) a common and robust statistical test that you can use to compare the mean scores collected from different conditions or groups in an experiment. There
Midterm STAT-UB.0003 Regression and Forecasting Models. I will not lie, cheat or steal to gain an academic advantage, or tolerate those who do.
 Midterm STAT-UB.0003 Regression and Forecasting Models The exam is closed book and notes, with the following exception: you are allowed to bring one letter-sized page of notes into the exam (front and
CS4495 Computer Vision Introduction to Recognition. Aaron Bobick School of Interactive Computing
 CS4495 Computer Vision Introduction to Recognition Aaron Bobick School of Interactive Computing What does recognition involve? Source: Fei Fei Li, Rob Fergus, Antonio Torralba. Verification: is that
Undesirable Optimality Results in Multiple Testing? Charles Lewis Dorothy T. Thayer
 Undesirable Optimality Results in Multiple Testing? Charles Lewis Dorothy T. Thayer 1 Intuitions about multiple testing: - Multiple tests should be more conservative than individual tests. - Controlling
Application of Local Control Strategy in analyses of the effects of Radon on Lung Cancer Mortality for 2,881 US Counties
 Application of Local Control Strategy in analyses of the effects of Radon on Lung Cancer Mortality for 2,881 US Counties Bob Obenchain, Risk Benefit Statistics, August 2015 Our motivation for using a Cut-Point
CS2220 Introduction to Computational Biology
 CS2220 Introduction to Computational Biology WEEK 8: GENOME-WIDE ASSOCIATION STUDIES (GWAS) 1 Dr. Mengling FENG Institute for Infocomm Research Massachusetts Institute of Technology mfeng@mit.edu PLANS
Audio: In this lecture we are going to address psychology as a science. Slide #2
 Psychology 312: Lecture 2 Psychology as a Science Slide #1 Psychology As A Science In this lecture we are going to address psychology as a science. Slide #2 Outline Psychology is an empirical science.
Still important ideas
 Readings: OpenStax - Chapters 1 11 + 13 & Appendix D & E (online) Plous - Chapters 2, 3, and 4 Chapter 2: Cognitive Dissonance, Chapter 3: Memory and Hindsight Bias, Chapter 4: Context Dependence Still
Confidence Intervals On Subsets May Be Misleading
 Journal of Modern Applied Statistical Methods Volume 3 Issue 2 Article 2 11-1-2004 Confidence Intervals On Subsets May Be Misleading Juliet Popper Shaffer University of California, Berkeley, shaffer@stat.berkeley.edu
Unit 1 Exploring and Understanding Data
 Unit 1 Exploring and Understanding Data Area Principle Bar Chart Boxplot Conditional Distribution Dotplot Empirical Rule Five Number Summary Frequency Distribution Frequency Polygon Histogram Interquartile
Homework Exercises for PSYC 3330: Statistics for the Behavioral Sciences
 Homework Exercises for PSYC 3330: Statistics for the Behavioral Sciences compiled and edited by Thomas J. Faulkenberry, Ph.D. Department of Psychological Sciences Tarleton State University Version: July
SUPPLEMENTARY INFORMATION
 doi:10.1038/nature10866 a b 1 2 3 4 5 6 7 Match No Match 1 2 3 4 5 6 7 Turcan et al. Supplementary Fig.1 Concepts mapping H3K27 targets in EF CBX8 targets in EF H3K27 targets in ES SUZ12 targets in ES
An Introduction to Bayesian Statistics
 An Introduction to Bayesian Statistics Robert Weiss Department of Biostatistics UCLA Fielding School of Public Health robweiss@ucla.edu Sept 2015 Robert Weiss (UCLA) An Introduction to Bayesian Statistics
EPSE 594: Meta-Analysis: Quantitative Research Synthesis
 EPSE 594: Meta-Analysis: Quantitative Research Synthesis Ed Kroc University of British Columbia ed.kroc@ubc.ca March 28, 2019 Ed Kroc (UBC) EPSE 594 March 28, 2019 1 / 32 Last Time Publication bias Funnel
Stat 13, Intro. to Statistical Methods for the Life and Health Sciences.
 Stat 13, Intro. to Statistical Methods for the Life and Health Sciences. 0. SEs for percentages when testing and for CIs. 1. More about SEs and confidence intervals. 2. Clinton versus Obama and the Bradley
Selection at one locus with many alleles, fertility selection, and sexual selection
 Selection at one locus with many alleles, fertility selection, and sexual selection Introduction It s easy to extend the Hardy-Weinberg principle to multiple alleles at a single locus. In fact, we already
Differential Item Functioning
 Differential Item Functioning Lecture #11 ICPSR Item Response Theory Workshop Lecture #11: 1of 62 Lecture Overview Detection of Differential Item Functioning (DIF) Distinguish Bias from DIF Test vs. Item
Week 10 Hour 1. Shapiro-Wilks Test (from last time) Cross-Validation. Week 10 Hour 2 Missing Data. Stat 302 Notes. Week 10, Hour 2, Page 1 / 32
 Cross-Validation. Week 10 Hour 2 Missing Data. Stat 302 Notes. Week 10, Hour 2, Page 1 / 32") Week 10 Hour 1 Shapiro-Wilks Test (from last time) Cross-Validation Week 10 Hour 2 Missing Data Stat 302 Notes. Week 10, Hour 2, Page 1 / 32 Cross-Validation in the Wild It s often more important to describe
Week 10 Hour 1 Shapiro-Wilks Test (from last time) Cross-Validation Week 10 Hour 2 Missing Data Stat 302 Notes. Week 10, Hour 2, Page 1 / 32 Cross-Validation in the Wild It s often more important to describe
LOGO. Statistical Modeling of Breast and Lung Cancers. Cancer Research Team. Department of Mathematics and Statistics University of South Florida
 LOGO Statistical Modeling of Breast and Lung Cancers Cancer Research Team Department of Mathematics and Statistics University of South Florida 1 LOGO 2 Outline Nonparametric and parametric analysis of
certain genotypes known to be associated with genetic disease or a predisposition to genetic disease
 DARYL L. THULL, MS 1 Good morning. So I thought that it would be helpful to sort of go back and see what population screening for genetic disease, sort of what the definition is. And it's testing to identify
Pushing Out the Frontiers. Nick D. K. Petraco and Many Others John Jay College of Criminal Justice!
 Applications of in Forensic Science Pushing Out the Frontiers Nick D. K. Petraco and Many Others John Jay College of Criminal Justice Outline Admissibility of Scientific Evidence is a problem Frye and
GPP 501 Microeconomic Analysis for Public Policy Fall 2017
 GPP 501 Microeconomic Analysis for Public Policy Fall 2017 Given by Kevin Milligan Vancouver School of Economics University of British Columbia Lecture Sept 6th: Consumer Choice GPP501: Lecture Sept 6
THE GOOD, THE BAD, & THE UGLY: WHAT WE KNOW TODAY ABOUT LCA WITH DISTAL OUTCOMES. Bethany C. Bray, Ph.D.
 THE GOOD, THE BAD, & THE UGLY: WHAT WE KNOW TODAY ABOUT LCA WITH DISTAL OUTCOMES Bethany C. Bray, Ph.D. bcbray@psu.edu WHAT ARE WE HERE TO TALK ABOUT TODAY? Behavioral scientists increasingly are using
Fixed Effect Combining
 Meta-Analysis Workshop (part 2) Michael LaValley December 12 th 2014 Villanova University Fixed Effect Combining Each study i provides an effect size estimate d i of the population value For the inverse
Sam: Annette, can we just start out with a brief simple explanation of what neuro-immune diseases are, including ME and CFS?
 Sam: Annette, can we just start out with a brief simple explanation of what neuro-immune diseases are, including ME and CFS? Annette: They are systemic diseases that impact the nervous system and immune
Name Psychophysical Methods Laboratory
 Name Psychophysical Methods Laboratory 1. Classical Methods of Psychophysics These exercises make use of a HyperCard stack developed by Hiroshi Ono. Open the PS 325 folder and then the Precision and Accuracy
Bayesian and Frequentist Approaches
 Bayesian and Frequentist Approaches G. Jogesh Babu Penn State University http://sites.stat.psu.edu/ babu http://astrostatistics.psu.edu All models are wrong But some are useful George E. P. Box (son-in-law
Dylan Small Department of Statistics, Wharton School, University of Pennsylvania. Based on joint work with Paul Rosenbaum
 Instrumental variables and their sensitivity to unobserved biases Dylan Small Department of Statistics, Wharton School, University of Pennsylvania Based on joint work with Paul Rosenbaum Overview Instrumental
Describe what is meant by a placebo Contrast the double-blind procedure with the single-blind procedure Review the structure for organizing a memo
 Please note the page numbers listed for the Lind book may vary by a page or two depending on which version of the textbook you have. Readings: Lind 1 11 (with emphasis on chapters 10, 11) Please note chapter
AClass: A Simple, Online Probabilistic Classifier. Vikash K. Mansinghka Computational Cognitive Science Group MIT BCS/CSAIL
 AClass: A Simple, Online Probabilistic Classifier Vikash K. Mansinghka Computational Cognitive Science Group MIT BCS/CSAIL AClass: A Simple, Online Probabilistic Classifier or How I learned to stop worrying
Analysis of Variance (ANOVA)
") Research Methods and Ethics in Psychology Week 4 Analysis of Variance (ANOVA) One Way Independent Groups ANOVA Brief revision of some important concepts To introduce the concept of familywise error rate.
Research Methods and Ethics in Psychology Week 4 Analysis of Variance (ANOVA) One Way Independent Groups ANOVA Brief revision of some important concepts To introduce the concept of familywise error rate.
Sheila Barron Statistics Outreach Center 2/8/2011
 Sheila Barron Statistics Outreach Center 2/8/2011 What is Power? When conducting a research study using a statistical hypothesis test, power is the probability of getting statistical significance when
Standard Deviation and Standard Error Tutorial. This is significantly important. Get your AP Equations and Formulas sheet
 Standard Deviation and Standard Error Tutorial This is significantly important. Get your AP Equations and Formulas sheet The Basics Let s start with a review of the basics of statistics. Mean: What most
Testing for. Prostate Cancer
 Testing for Prostate Cancer Who this booklet is for: This booklet is to help men who do not have any symptoms decide if they want to be tested. Prostate cancer affects many men. There are tests to find
Multitasking: Why Your Brain Can t Do It and What You Should Do About It.
 Multitasking: Why Your Brain Can t Do It and What You Should Do About It. Earl K. Miller The Picower Institute for Learning and Memory and Department of Brain and Cognitive Sciences, Massachusetts Institute
HYPOTHESIS TESTING 1/4/18. Hypothesis. Hypothesis. Potential hypotheses?
 HYPOTHESIS TESTING Hypothesis A statement about the relationship between variables that makes a falsifiable prediction Relationship can be (as one variable changes, the other changes too) or (change in
OMICS Journals are welcoming Submissions
 OMICS Journals are welcoming Submissions OMICS International welcomes submissions that are original and technically so as to serve both the developing world and developed countries in the best possible
A Golden Age of Drug Discovery in Cancer A Chat With Yujiro Hata, CEO of IDEAYA Biosciences
 WXPRESS, Innovation That Matters June 9, 2016 A Golden Age of Drug Discovery in Cancer A Chat With Yujiro Hata, CEO of IDEAYA Biosciences By Hui Cai, VP of Corporate Alliances at WuXi AppTec (@HuiCai2)
Quantitative Methods in Computing Education Research (A brief overview tips and techniques)
") Quantitative Methods in Computing Education Research (A brief overview tips and techniques) Dr Judy Sheard Senior Lecturer Co-Director, Computing Education Research Group Monash University judy.sheard@monash.edu
Quantitative Methods in Computing Education Research (A brief overview tips and techniques) Dr Judy Sheard Senior Lecturer Co-Director, Computing Education Research Group Monash University judy.sheard@monash.edu
Biostatistics. Donna Kritz-Silverstein, Ph.D. Professor Department of Family & Preventive Medicine University of California, San Diego
 Biostatistics Donna Kritz-Silverstein, Ph.D. Professor Department of Family & Preventive Medicine University of California, San Diego (858) 534-1818 dsilverstein@ucsd.edu Introduction Overview of statistical
Working Together To Outrun Cancer
 Lesson: Talking to Students About Cancer Curriculum Connection: Language Arts / Health Education Grade Level: Primary Time: Approximately 40-60 minutes Lesson Snapshot Sometimes teachers wonder how they
Quantitative Biology Lecture 1 (Introduction + Probability)
") 21 st Sep 2015 Quantitative Biology Lecture 1 (Introduction + Probability) Gurinder Singh Mickey Atwal Center for Quantitative Biology Why Quantitative Biology? (1. Models) Galileo Galilei The Book of
21 st Sep 2015 Quantitative Biology Lecture 1 (Introduction + Probability) Gurinder Singh Mickey Atwal Center for Quantitative Biology Why Quantitative Biology? (1. Models) Galileo Galilei The Book of
Decision Making Process
 Survey Says: How to Create High Quality Surveys to Assist in the Evidence Anaheim, California Based Decision Making Process Daniel Byrd, Ph.D. University of California Office of the President CAIR Conference:
Patrick Breheny. January 28
 Confidence intervals Patrick Breheny January 28 Patrick Breheny Introduction to Biostatistics (171:161) 1/19 Recap Introduction In our last lecture, we discussed at some length the Public Health Service
Identifying Peer Influence Effects in Observational Social Network Data: An Evaluation of Propensity Score Methods
 Identifying Peer Influence Effects in Observational Social Network Data: An Evaluation of Propensity Score Methods Dean Eckles Department of Communication Stanford University dean@deaneckles.com Abstract
Bayesian Inference. Review. Breast Cancer Screening. Breast Cancer Screening. Breast Cancer Screening
 STAT 101 Dr. Kari Lock Morgan Review What is the deinition of the p- value? a) P(statistic as extreme as that observed if H 0 is true) b) P(H 0 is true if statistic as extreme as that observed) SETION
How was your experience working in a group on the Literature Review?
 Journal 10/18 How was your experience working in a group on the Literature Review? What worked? What didn t work? What are the benefits of working in a group? What are the disadvantages of working in a