Initiation and regulation of effector T cell responses in the prostate
|
|
|
- Myles Quinn
- 5 years ago
- Views:
Transcription

 thesis, University of Iowa, 2011. https://ir.uiowa.edu/etd/3311. Follow this and additional works at: https://ir.uiowa.edu/etd Part of the Immunology of Infectious Disease Commons")
1 University of Iowa Iowa Research Online Theses and Dissertations 2011 Initiation and regulation of effector T cell responses in the prostate Jessica M. Haverkamp University of Iowa Copyright 2011 Jessica M. Haverkamp This dissertation is available at Iowa Research Online: Recommended Citation Haverkamp, Jessica M.. "Initiation and regulation of effector T cell responses in the prostate." PhD (Doctor of Philosophy) thesis, University of Iowa, Follow this and additional works at: Part of the Immunology of Infectious Disease Commons
2 INITIATION AND REGULATION OF EFFECTOR T CELL RESPONSES IN THE PROSTATE by Jessica M. Haverkamp An Abstract Of a thesis submitted in partial fulfillment of the requirements for the Doctor of Philosophy degree in Immunology in the Graduate College of The University of Iowa July 2011 Thesis Supervisors: Professor Emeritus Timothy L. Ratliff Associate Professor Thomas S. Griffith
3 1 ABSTRACT Myeloid-derived suppressor cells (MDSC) are a heterogeneous population of immature myeloid cells identified in mice as Gr-1 + CD11b + cells with the ability to inhibit T cell function. MDSC are emerging as important regulators of T cell mediated immune responses. Current paradigm suggests that despite heterogeneity, all Gr-1 + CD11b + cells are suppressive when exposed to inflammatory stimuli. In vitro evaluation shows MDSC from multiple tissue sites have suppressive activity, and in vivo inhibition of MDSC enhances T cell function. However, the relative capacity of MDSC present at localized inflammatory sites or in peripheral tissues to suppress T cell responses in vivo has not been directly evaluated. Using a tissue specific acute inflammatory prostatitis model, we demonstrate that MDSC inhibition of CD8 + T-cell proliferation is restricted to the inflammatory site. Further, MDSC from inflammatory sites possess immediate capacity to inhibit T-cell function, whereas those isolated from peripheral tissues (spleens and liver) were not suppressive without activation of inos by exposure to IFN-γ. Using two mouse models of prostate cancer, we extend these findings to the tumor micro-environment. During a chronic inflammatory response induced by tumor growth, we show Gr-1 + CD11b + cells from the tumor site possess immediate capacity to regulate effector T cell function whereas those from the spleen do not. In both tumor models and in our prostatitis model, long term culture of activated T cells with splenic Gr-1 + CD11b + cells converted precursor cells into functional MDSC during standard in vitro suppression assays. These data highlight the importance of MDSC in the prostate, and demonstrate the function of MDSC during a localized inflammatory response is restricted to the site of an ongoing immune response.
4 2 Growing evidence suggests that prostatitis associated with chronic prostatitis/chronic pelvic pain syndrome (CP/CPPS) is mediated in part by the loss of T cell and B cell tolerance to prostate antigens. Clinical data demonstrates the presence of T cell proliferative responses to prostate auto-antigens in CP/CPPS patients. However, the mechanisms leading to this loss of tolerance are not clearly understood, largely because of a lack of available animal models. We report the development of a new mouse model for the study of chronic prostate inflammation (CPI), the Prostate Ovalbumin Expressing Transgenic-3 (POET-3) model. Adoptive transfer of antigen specific OT-I T cells induces CPI characterized by infiltration of exogenous (OT-I) and endogenous T cells into the prostate persisting as long as 45 days after transfer. In vitro and in vivo data demonstrate inflammation induced loss of T cell tolerance to prostate auto-antigens. Auto-antibody responses to prostate antigens were detected in POET-3 mice after induction of CPI. These data have important therapeutic implications for treatment of CPI. Abstract Approved: Thesis Supervisor Title and Department Date Thesis Supervisor Title and Department Date
5 INITIATION AND REGULATION OF EFFECTOR T CELL RESPONSES IN THE PROSTATE by Jessica M. Haverkamp A thesis submitted in partial fulfillment of the requirements for the Doctor of Philosophy degree in Immunology in the Graduate College of The University of Iowa July 2011 Thesis Supervisors: Professor Emeritus Timothy L. Ratliff Associate Professor Thomas S. Griffith
6 Graduate College The University of Iowa Iowa City, Iowa CERTIFICATE OF APPROVAL PH.D. THESIS This is to certify that the Ph.D. thesis of Jessica M. Haverkamp has been approved by the Examining Committee for the thesis requirement for the Doctor of Philosophy degree in Immunology at the July 2011 graduation. Thesis Committee: Timothy L. Ratliff, Thesis Supervisor Thomas S. Griffith, Thesis Supervisor Kevin L. Legge Stanley Perlman Michael D. Henry
7 To Craig: For all the sacrifices you have made for me, for encouraging me, and for supporting me no matter what the cost. ii
8 Anybody who has been seriously engaged in scientific work of any kind realizes that over the entrance to the gates of the temple of science are written the words: Ye must have faith. Max Planck iii
9 ACKNOWLEDGMENTS I would like to thank the members of my thesis committee: Dr. Thomas Griffith, Dr. Kevin Legge, Dr. Stanley Perlman, Dr. Michael Henry, and Dr. Timothy Ratliff: for encouraging me to continually improve the quality of my scientific research and for teaching me the value of constructive criticism. Specifically, I would like to thank Dr. Thomas Griffith for agreeing to serve as the head of my thesis committee, which allowed me to remain a student in the University of Iowa Immunology Program while completing my research in Dr. Ratliff s lab at Purdue University. I would also like to thank Dr. Timothy Ratliff for accepting me into his lab, for his continued confidence in me, for giving me so many opportunities to travel and present my work at national and international meetings, and for the freedom which he gave me over the direction of my research projects; all of which have helped me to develop as an independent scientist. Moving to a new university during graduate school was something that I never considered would happen. However, I know now that I am stronger for having gone through this experience. Lastly, I would like to thank my family for teaching me the importance of education and supporting my curiosity about nature. To my mother and grandfather who helped me catch snakes, bees, and fireflies in our back yard to keep as pets : Thank you. I know that if it weren t for you dedicating so much of your lives to helping me achieve my goals, I would never be where I am today. iv
10 ABSTRACT Myeloid-derived suppressor cells (MDSC) are a heterogeneous population of immature myeloid cells identified in mice as Gr-1 + CD11b + cells with the ability to inhibit T cell function. MDSC are emerging as important regulators of T cell mediated immune responses. Current paradigm suggests that despite heterogeneity, all Gr-1 + CD11b + cells are suppressive when exposed to inflammatory stimuli. In vitro evaluation shows MDSC from multiple tissue sites have suppressive activity, and in vivo inhibition of MDSC enhances T cell function. However, the relative capacity of MDSC present at localized inflammatory sites or in peripheral tissues to suppress T cell responses in vivo has not been directly evaluated. Using a tissue specific acute inflammatory prostatitis model, we demonstrate that MDSC inhibition of CD8 + T-cell proliferation is restricted to the inflammatory site. Further, MDSC from inflammatory sites possess immediate capacity to inhibit T-cell function, whereas those isolated from peripheral tissues (spleens and liver) were not suppressive without activation of inos by exposure to IFN-γ. Using two mouse models of prostate cancer, we extend these findings to the tumor micro-environment. During a chronic inflammatory response induced by tumor growth, we show Gr-1 + CD11b + cells from the tumor site possess immediate capacity to regulate effector T cell function whereas those from the spleen do not. In both tumor models and in our prostatitis model, long term culture of activated T cells with splenic Gr-1 + CD11b + cells converted precursor cells into functional MDSC during standard in vitro suppression assays. These data highlight the importance of MDSC in the prostate, and demonstrate the function of MDSC during a localized inflammatory response is restricted to the site of an ongoing immune response. v
11 Growing evidence suggests that prostatitis associated with chronic prostatitis/chronic pelvic pain syndrome (CP/CPPS) is mediated in part by the loss of T cell and B cell tolerance to prostate antigens. Clinical data demonstrates the presence of T cell proliferative responses to prostate auto-antigens in CP/CPPS patients. However, the mechanisms leading to this loss of tolerance are not clearly understood, largely because of a lack of available animal models. We report the development of a new mouse model for the study of chronic prostate inflammation (CPI), the Prostate Ovalbumin Expressing Transgenic-3 (POET-3) model. Adoptive transfer of antigen specific OT-I T cells induces CPI characterized by infiltration of exogenous (OT-I) and endogenous T cells into the prostate persisting as long as 45 days after transfer. In vitro and in vivo data demonstrate inflammation induced loss of T cell tolerance to prostate auto-antigens. Auto-antibody responses to prostate antigens were detected in POET-3 mice after induction of CPI. These data have important therapeutic implications for treatment of CPI. vi
12 TABLE OF CONTENTS LIST OF FIGURES...X CHAPTER I: INTRODUCTION...1 Prostate Inflammation...1 Clinical Data...2 Animal models of non-bacterial prostate inflammation...3 Links to other prostatic diseases...4 Regulation of Inflammation...5 Myeloid-derived Suppressor Cells...7 MDSC in Pathological Conditions...8 MDSC in Benign Inflammatory Diseases...9 MDSC in Cancer...11 Mechanisms of Suppressive Function...13 Inflammation Independent Mechanisms...13 Inflammation Dependent Mechanisms...14 Inflammation and Cancer...15 The Tumor Promoting Roles of the Adaptive Immune System...17 The Tumor Promoting Roles of the Innate Immune System...18 Summary...20 CHAPTER II. IN VIVO SUPPRESSIVE FUNCTION OF MYELOID-DERIVED SUPPRESSOR CELLS IS RESTRICTED TO THE INFLAMMATORY SITE...30 Abstract...30 Introduction...30 Materials and Methods...32 Mice and in vivo experiments...32 Flow cytometry...32 Isolation of leukocytes...32 Histology and Immunohistochemistry...33 Arg1 assay...33 Detection of inos...34 Reactive oxygen and nitrogen species...34 Quantitative real-time PCR hour T cell suppression assay...35 Effector T cell suppression assay...35 In vivo depletion experiments...36 Results...36 Gr-1 + CD11b + cells are expanded during acute prostate inflammation...36 Arg1 and inos expression is restricted to Gr-1 + CD11b + cells at the inflammatory site...37 Gr-1 + CD11b + cells from inflamed prostates have a distinct phenotype compared to cells from the inflammatory site...40 Gr-1 + CD11b + cells from inflamed prostates suppress T cell proliferation in vitro...41 Gr-1 + CD11b + cells from the inflammatory site possess immediate regulatory capacity...42 In vivo regulatory function of MDSC is restricted to cells present at the inflammatory site...43 Discussion...44 vii
13 CHAPTER III. REGULATION OF IMMUNE RESPONSES DURING PROSTATE CANCER BY MYELOID DERIVED SUPPRESSOR CELLS...76 Abstract...76 Introduction...76 Materials and Methods...78 Mice and in vivo experiments...78 Flow cytometry...78 Isolation of leukocytes...78 Histology and Immunohistochemistry...79 Arg1 assay...79 Detection of inos...79 Quantitative real-time PCR hour T cell suppression assay...80 Effector T cell suppression assay...80 Results...81 Arg1 and inos are elevated in Gr-1 + CD11b + cells from RM-1 prostate tumors...81 Gr-1 + CD11b + cells from RM-1 prostate tumors regulate antigen specific T cell proliferation...82 Gr-1 + CD11b + cells from the tumor site possess immediate capacity to regulate T cell proliferation...82 Gr-1 + CD11b + cells expand in prostates of aged POET- 3/Luc/Pten +/- mice...83 POET-3/Luc/Pten +/- mice develop chronic prostate inflammation resulting in alterations to the prostate epithelium...84 Gr-1 + CD11b + cells accumulate in prostates of C57BL/6/Luc/Pten -/- mice...84 Gr-1 + CD11b + cells from prostates of C57BL/6/Luc/Pten -/- mice possess the immediate regulatory capacity...85 Discussion...85 CHAPTER IV. THE ROLE OF VITAMIN D IN MYELOID-DERIVED SUPPRESSOR CELL FUNCTION ABSTRACT Introduction Materials and Methods Mice and in vivo experiments Isolation of leukocytes and flow cytometry Isolation of RNA and cdna and quantitative real-time PCR Microarray analysis and statistical analysis Effector T cell suppression assay Results Microarray analysis reveals genes over-expressed in tumor resident MDSC The vitamin d receptor is over-expressed in tumor resident MDSC Discussion CHAPTER V. INFLAMMATION INDUCED LOSS OF TOLERANCE TO PROSTATE ANTIGENS Abstract Introduction Materials and Methods Mice viii
14 Adoptive transfer of OT-I cells Histology and histopathological scoring Flow cytometry Antigens ELISA Immunization with PSBP peptides In vitro re-stimulation with PSBP peptides Adoptive transfer of chronic prostate inflammation Results Adoptive transfer of OT-I cells induces chronic prostate inflammation in POET-3 mice Infiltration of endogenous T cells during chronic prostate inflammation Prostate auto-antigen specific T and B cells expand during chronic prostate inflammation Immunization with prostate antigens boosts auto-immune inflammation in POET-3 mice New prostate-auto-antigens develop during chronic prostate inflammation Discussion CHAPTER VI: DISCUSSION Regarding the Data and the Impact of the Scientific Discoveries REFERENCES ix
15 LIST OF FIGURES Figure 1: Classification of myeloid-derived suppressor cell subsets in mice...22 Figure 2: Expansion, recruitment and activation of myeloid-derived suppressor cells during steady state and disease states...24 Figure 3: Myeloid-derived suppressor cells employ multiple mechanisms to inhibit T cell function...26 Figure 4: The role of myeloid cells in tumor progression and their interaction with the adaptive immune system...28 Figure 5: Adoptive transfer of OT-I cells induces acute prostate inflammation in POET-3 mice Figure 6: Acute prostate inflammation expands Gr-1+CD11b+ cells Figure 7: Acute prostate inflammation expands Gr-1+CD11b+ cells Figure 8: Gr-1+ cells accumulate in prostate tissue during acute prostate inflammation...54 Figure 9: Gr-1+CD11b+ cells isolated the inflammatory site express Arg1 and inos Figure 10: inos expression is elevated in Gr-1+CD11b+ cells from the inflammatory site Figure 11: Protein nitration in prostate tissue during acute prostate inflammation...60 Figure 12: Expression of inos and Arg1 are elevated in subsets of CD11b+ cells from the inflammatory site Figure 13: Gr-1+CD11b+ cells from the inflammatory site have a lower maturation status compared to cells from the spleen...64 Figure 14: Gr-1+CD11b+ cells from inflamed prostates suppress T cell proliferation in vitro...66 Figure 15: Gr-1+CD11b+ cells from the inflammatory site possess immediate capacity to regulate T cell proliferation...68 Figure 16: Gr-1+CD11b+ cells from peripheral tissues lack immunosuppressive activity on antigen activated CD8+ T cells...70 Figure 17: In vivo regulatory function of MDSC is restricted to cells present at the inflammatory site Figure 18: Anti-Gr-1 treatment does not result in loss of CD8+ cells...74 x
16 Figure 19: RM-1 prostate tumors expand Gr-1+CD11b+ cells in the spleen and tumor site...89 Figure 20: Agr1 and inos are elevated in Gr-1+CD11b+ cells from RM-1 prostate tumors...91 Figure 21: Gr-1+CD11b+ cells isolated from RM-1 prostate tumors regulate T cell proliferation...93 Figure 22: Gr-1+CD11b+ cells isolated from RM-1 prostate tumors possess immediate regulatory capacity...95 Figure 23: Generation of C57BL/6/Luc/Pten-/- and POET-3/Luc/Pten-/+ mice...97 Figure 24: Aged POET-3/Luc/Pten-/+ mice develop spontaneous prostate inflammation which worsens with adoptive transfer of OT-I cells Figure 25: Prostate inflammation in POET-3/Luc/Pten -/+ mice after adoptive transfer of OT-I cells Figure 26: Gr-1+CD11b+ cells accumulate in the prostates of POET- 3/Luc/Pten -/+ mice Figure 27: Alterations in the prostate epithelium during chronic prostate inflammation in POET-3/Luc/Pten-/+ mice Figure 28: Gr-1+CD11b+ cells accumulate in prostates of C57BL/6/Luc/Pten -/- mice Figure 29: Gr-1+CD11b+ cells from the prostates of C57BL/6/Luc/Pten -/- mice are functional MDSC Figure 30: Heat map over-expressed and under-expressed mrnas in tumor resident MDSC subsets Figure 31: Over-expressed mrnas in tumor resident MDSC subsets Figure 32: Vitamin D receptor expression in subsets of tumor resident MDSC Figure 33: The impact of vitamin D on the function of tumor isolated MDSC Figure 34: Adoptive transfer of OT-I cells induces chronic prostate inflammation Figure 35: Endogenous and exogenous T cells accumulate in chronically inflamed prostates Figure 36: T cell responses to prostate-specific auto-antigens develop during chronic prostate inflammation Figure 37: Prostate specific auto-antibodies are present during chronic prostate inflammation xi
17 Figure 38: Immunization with prostate antigens expands T cells recognizing non-mova prostate antigens Figure 39: Chronic prostate inflammation is adoptively transferable Figure 40: Model for the initiation and regulation of prostate inflammation xii
18 1 CHAPTER I: INTRODUCTION Prostate Inflammation Prostatitis is an inflammation of the prostate gland characterized by several clinical symptoms including fever, dysuria, acute or relapsing urinary tract infections (UTI) and chronic pelvic pain (1). Epidemiological studies estimate that 10-12% of men world wide will experience some form of prostatitis like symptoms in their lifetime, many of which result in reduced quality of life (2-12). Unlike other prostatic diseases such as prostate cancer, prostatitis affects men of all ages (13). However, similar to prostate cancer, the incidence of prostatitis does increase with age, with the incidence rate for men at 535, at 1,534, at 1,921, at 3,493, and at 3,756 (per 100,000 per year). Prostatitis can be further classified based on the presence (category I, II) or absence (category III, IV) of uropathogenic bacteria (1). Prostatitis patients presenting with rapid onset of dysuria, fever and bacterial growth in urine cultures are classified under category I or acute bacterial prostatitis. Category II prostatitis patients present with relapsing episodes of UTIs and the presence of bacterial growth in urine cultures. Together type I and II prostatitis comprise 5-10% of all prostatitis cases (13). Type III prostatitis, also known as chronic prostatitis/chronic pelvic pain syndrome (CP/CPPS), is diagnosed in men experiencing genitourinary pain in the absence of bacterial infection (1). Approximately 90% of prostatitis patients are diagnosed with type III prostatitis, which can be subdivided into category IIIA or IIIB based on the presence or absence of white blood cells (WBC), respectively, in expressed prostate secretions or urine specimens (13). It is important to note currently there are no standard diagnostic tests for CP/CPPS and in the majority of patients, no treatable cause of symptoms can be identified. Further, prostatitis is associated with staggering medical costs, with an estimated $84 million spent annually on prostatitis in the United States alone, not
19 2 including pharmaceutical expenses (13). Despite the prevalence of prostatitis and its impact at both an economic level and on the overall quality of life of patients diagnosed with this disease, prostatitis largely remains a disease of unknown etiology. Careful examination of prostate inflammation and its impact on the prostate are needed in order to more clearly elucidate the causes of prostatitis with the goal of developing better diagnostic tests and therapies that will ultimately improve the quality of life of men living with prostatitis. Clinical Data Because there are a limited number of available mouse models of prostatitis (discussed below), much of the data concerning the immune response in the prostate has been generated from autopsy or biopsy tissue samples. One study looking at autopsy samples found that healthy prostate tissue contains leukocytes, largely composed of T cells, with higher numbers located in the stroma than in the epithelium (14). Interestingly, CD4 + T cells were pre-dominantly found in the stroma of the prostate, whereas CD8 + T cells were more commonly found in the epithelium (14). A separate study, examining prostate tissue from type IIIB patients found infiltrating leukocytes in both the stroma and acini were composed of CD20 + (B cells), whereas CD3 + CD8 + T and CD3 + CD4 + T cells, were predominantly found in the acini with elevated levels of CD8 + cells among the total CD3 + population (15). In addition to increased levels of lymphocytes in prostate tissue, prostatitis patients also demonstrate increased numbers of leukocytes in expressed prostatic secretions and urine specimens (16). In a study grouping type II and III prostatitis patients, urine specimens were found to be contain elevated levels of granulocytes, macrophages, T cells and B cells ( 81.6%, 11.1%, 5.5%,1.8% of total cells, respectively) (16). The involvement of the innate immune system in prostatitis is illustrated by a study showing that levels of monocyte chemotactic protein 1 (MCP-1) and macrophage
20 3 inflammatory protein 1α (MIP-1α) were elevated in both type IIIA and IIIB patients, relative to controls (17). MCP-1 recruits monocytes, memory T cells and dendritic cells (DCs) to sites of inflammation and its presence in urine specimens from CP/CPPS patients suggests it is involved in the recruitment of leukocytes into inflamed prostate tissue. MIP-1α is produced by macrophages and can induce the synthesis and release of pro-inflammatory cytokines such as IL-1, IL-6 and TNF-α, suggesting a possible role for this chemokine in further augmentation of inflammation in CP/CPPS patients. Indeed, elevated levels of TNF-α have been found in the serum from CP/CPPS patients (18). These studies while informative are largely descriptive and do not address the function of leukocytes or their potential impact on the prostate epithelium. In vitro studies using primary peripheral blood mononuclear cells (PBMCs) from chronic prostatitis patients have begun to identify the role of lymphocytes in prostatic disease, suggesting some forms of prostatitis may have an auto-immune etiology. Further, prostate inflammation is reported to increase with age, which is reminiscent of other autoimmune diseases (19). Indeed a number of studies on clinical specimens obtained from CP/CPPS patients show both CD4 + and CD8 + T cells isolated from peripheral blood of type III prostatitis patients contain auto-reactive lymphocytes that proliferate and produce IFN-γ in response to prostate antigens such as prostate specific antigen (PSA) and seminal plasma (20-24). These data provide evidence toward an auto-immune etiology in some forms of prostatitis; however, the role of these prostate specific lymphocytes in the inflammatory process has not been examined. Animal models of non-bacterial prostate inflammation Several rodent models of chronic abacterial prostatitis have been utilized to help better understand prostatitis. Spontaneous prostate inflammation in the lateral prostate has been described, at varying levels for aged Wistar, Lewis and Copenhagen rats, as well as aged NOD mice (25-27). Hormones have also been used to induce prostatitis,
21 4 with 17-β-estradiol increasing the incidence and severity of prostate inflammation in aged Wistar rats (28). Immunization with homogenized prostate extracts or with male accessory gland extracts in the presence of complete Freunds adjuvant have also been used to induce prostate inflammation in rodents (25, 29-31). In both rats and mice, a major auto-antigen in prostate extracts has been identified, prostate steroid binding protein (PSBP) (29-30). PSBP is a highly androgen regulated epithelial protein expressed predominantly in the ventral prostate with very low levels present in the dorsal-lateral prostate (32). Thymectomy 3 days after birth results in the development of lobe specific prostate inflammation, primarily in the anterior with limited occurrence in the dorsal and no occurrence in the ventral prostate (33). In this model inflammation is also strain dependent with approximately a 30% occurrence rate in C57BL/6 mice (33-35). Existing models of prostatitis lack of antigen-specificity, show large variations in age, strain susceptibility, anatomical site(s) affected, and are complicated by defective tolerance mechanisms, all of which makes data interpretation difficult. Links to other prostatic diseases According to the latest American Cancer Society statistics, prostate cancer is the most frequently diagnosed cancer in males, and the second leading cause of cancer related deaths in American men. The development of prostate cancer has been linked to both genetic and environmental factors, and growing evidence suggests a role for chronic inflammation in prostate cancer (36). Several studies have correlated the presence of inflammatory cytokines, chemokines, and growth factors with an increased risk for developing prostate cancer, leading to the hypothesis that chronic inflammation plays a role in the development and progression of prostate cancer. However, a direct relationship between inflammation and prostate cancer has yet to be demonstrated.
22 5 Strong clinical data suggest that a history of prostatitis is a risk factor for prostate cancer. One such study examined the relationship between men who develop prostatitis and those who go on to develop prostate cancer, examining prostate needle biopsy specimens from 177 men with abnormal clinical results (37). From this group, 144 tissue samples showed signs of chronic inflammation and over the next 5 years 20% of these patients were diagnosed with adenocarcinomas and 6% were diagnosed with high-grade prostatic intraepithelial neoplasia (PIN), a precursor of cancer (37). In contrast, of the 33 patients with no detectable inflammation, only 6% of the patients developed adenocarcinomas (37). These data demonstrate a history of chronic inflammation is associated with an increased risk for both prostate cancer and PIN. Further, in a metaanalysis published by Denis et al, men with a history of prostatitis were found to have an increased risk for developing prostate cancer (38). This study did not examine the type of prostatitis associated with an increased risk for prostate cancer, but found that a history of sexually transmitted diseases also increased the risk for developing prostate cancer (38). Direct evidence establishing a relationship between prostate inflammation and prostate cancer is limited by the lack of animal models in which both prostate inflammation and prostate cancer can be studied. In a mouse model of chronic bacterial prostatitis induced by E. coli infection, 12 weeks post- infection prostate hyperplasia, dysplasia and PIN developed (39-40). This study demonstrates that chronic bacterial inflammation induces morphological changes leading to early events associated transformation but the impact on the development of prostate cancer remains unknown. Regulation of Inflammation The resolution phase of an inflammatory response is a dynamic process during which adaptive and innate immune responses interact to dampen inflammation. Much of this interaction occurs through the production of cytokines with immunoregulatory functions as both IL-10 and TGF-β can be secreted by both T cells and myeloid cells. T
23 6 regulatory cells (Treg) are well known for their role in dampening immune responses to infections, self-antigens and tumor antigens (41). Treg are thought to exert their suppressive function through either production of regulatory cytokines such as IL-10, TGF-β and IL-35 or by cell-cell contact with antigen presenting cells (APCs) whereby regulatory signals are sent through membrane proteins such as CTLA-4 or membrane bound TGF-β (41-44). Regulatory B cells are a recently defined subset of B cells identified as CD1d high CD5 + cells producing IL-10 (45-46). Important roles for B cell dependent IL-10 production in animal models of experimental autoimmune encephalomyelitis (EAE), chronic colitis and collagen induced arthritis models have been established (46-48). In addition to adaptive immune responses, regulatory myeloid cells also play a strong role in dampening inflammation. DCs dampen immune responses through the production of IL-10 and 2, 3-indoleamine dioxygenase (IDO) leading to T cell dysfunctions including anergy and impaired effector function (49-51). Immunosuppressive macrophages can encompass alternatively activated (M2) macrophages, tumor associated macrophages (TAM) and myeloid derived suppressor cells (MDSC) (52). Immunoregulatory functions of M2 macrophages are associated with elevated expression of arginase I (Arg1), IL-10, TGF-β and decreased IL-12 production and when present inside tumors are considered to be TAM (53). MDSC employ multiple mechanisms to regulate T cell function, including inhibition of T cell migration and T cell signaling and induction of apoptosis. The tumor microenvironment is composed of multiple populations of myeloid cells including TAM and MDSC, two populations of cells which share some phenotypic similarity (54). However, in contrast to TAM, which can be identified based on M1 or M2 characteristics, MDSC appear to be a distinct population of cells simultaneously expressing properties of both M1 and M2 populations (54).
24 7 Myeloid-derived Suppressor Cells MDSC are a heterogeneous population of immature myeloid identified in mice as Gr-1 + CD11b + cells with the ability to inhibit T cell proliferation (55). In humans MDSC populations are less well defined but are generally thought to be HLA-DR low CD14 + (56-58). MDSC are potent inhibitors of both innate and adaptive immune responses. MDSC can inhibit antigen specific or non-specific T cell and NK cell function and can also modulate cytokine production by macrophages (59-61). Expanded populations of MDSC have been identified in the blood, spleen, liver, bone marrow and lymph nodes of mice with inflammatory diseases ranging from viral and bacterial infections to auto-immune diseases and cancer (62-67). The markers Gr-1 and CD11b identify multiple populations of immune cells including neutrophils, eosinophils and monocytes and up to six populations of Gr- 1 + CD11b + cells can be identified in the spleens of healthy mice (68-69). Because of this heterogeneity, many studies have attempted to identify subsets of MDSC with enhanced regulatory capacity. Recently, Bronte and colleagues examined the immunosuppressive strength among populations of CD11b + cells from spleens of tumor-bearing mice with varying levels of Gr-1 expression (69). Gr-1 int cells, comprising monocytes and myeloid precursors were more suppressive both in vitro and in vivo than Gr-1 hi granulocyte like cells and expressed higher levels of Arg1 and inos (69). Other studies have tried to identify novel surface markers on functional MDSC (59, 70-72). Indeed, in certain models F4/80, CD40, IL-4Rα, and CD49d have all been found to be expressed on MDSC with enhanced regulatory function (59, 70-72). However, to date there is no specific marker or phenotype that can consistently identify non-regulatory Gr-1 + CD11b + cells from functional MDSC. The Gr-1 antibody recognizes two epitopes, Ly6G and Ly6C, making conclusions about the type of cell responsible for suppressive function among the Gr-1 + CD11b + cell phenotype difficult. MDSC have recently been subdivided into either monocyte or
25 8 granulocyte like cells based on their Ly6C and Ly6G expression (62-63). CD11b + cells expressing Ly6G and low Ly6C levels are classified as granulocytic MDSC and express arginase 1 (Arg1). CD11b + cells expressing high levels of Ly6C but not Ly6G are identified as monocytic MDSC expressing both Arg1 and inducible nitric oxide synthase (inos) (Fig. 1) (55, 63). Both subpopulations of MDSC have been shown to have suppressive function; however, whether granulocytic or monocytic MDSC are preferentially expanded seems to be independently associated with inflammatory stimuli present in a particular disease. MDSC in Pathological Conditions Growing evidence suggests that expansion and recruitment of MDSC is a common feature of most pathological diseases. Expanded populations of MDSC have been found in a wide range of diseases encompassing viral and bacterial infections, autoimmune diseases and cancer (64-66, 73). During an inflammatory disease, it is thought that cytokines such as GM-CSF and M-CSF feedback into the bone marrow mobilizing large numbers of immature myeloid cells into the periphery (Fig. 2). Once in the peripheral tissues, these immature myeloid cells (IMC) are recruited into inflammatory tissues where cytokines and microbial products activate the suppressive function of MDSC through up-regulation of Arg1 and inos. In this model one stimulus is necessary for mobilization of IMC from the bone marrow but is not sufficient for these IMC to gain suppressive function; rather, a second stimulus coming from pro-inflammatory cytokines in the periphery is needed for MDSC to acquire suppressive function. What remains unclear is where in the periphery MDSC receive this activating stimulus. Current thinking suggests that in chronic inflammatory conditions such as cancer this activating stimulus can be received both in the tumor site and in peripheral tissues distal to the inflammatory site such as the spleen. However, little information exists about the differences between MDSC phenotype and function in cells present in different
26 9 anatomical locations of diseased animals. Thus, while inflammation is known to be a strong activator of MDSC function, few studies have characterized the phenotype or function of cells in the inflammatory site and even fewer have directly compared MDSC from different anatomical sites from inflamed animals. MDSC in Benign Inflammatory Diseases It is clear that Gr-1 + CD11b + cells play an important role in the regulation of T cell mediated inflammatory diseases. During experimental autoimmune encephalomyelitis (EAE), expanded populations of CD11b + Ly6C hi cells were found in the bone marrow, blood, spleen and in the CNS (74). At the peak of clinical disease, 30% of infiltrating cells in the CNS were CD11b + Ly6C hi cells (74). However, even with such large numbers of these cells in the inflammatory site (CNS) neither the phenotype nor function of these cells was examined. Using cells isolated from the spleen, the immunosuppressive function was found to be restricted to the CD11b + Ly6C hi population (74). Interestingly, in this study IFN-γ produced by activated T cells was required for the suppressive function of spleen CD11b + Ly6C hi cells (74). These data provide one example where expanded populations of MDSC are found both in the spleen and at the site of inflammation during a tissue specific autoimmune disease where only the cells in the spleen were carefully examined. Only one study to date has examined the function of Gr-1 + CD11b + cells isolated from the inflammatory site during an acute inflammatory disease. De Santo et. al. demonstrate that during influenza virus infection, Gr-1 + CD11b + cells increased in number in the lung and were able to inhibit antigen specific CD8 + T cell proliferation in vitro through the expression of both Arg1 and inos (66). Further, the adoptive transfer of MDSC into influenza infected mice reduced the percentage of influenza specific splenic T cells in vivo (66). The suppressive function of Gr-1 + CD11b + cells isolated from the spleens of influenza infected mice was not examined (66). This study demonstrates
27 10 MDSC in the lungs of influenza infected mice contribute to the regulation of virus specific T cell responses, but does not compare the functional properties of cells from the inflammatory site and peripheral tissues such as the spleen. In addition to regulating T cell responses during localized benign inflammatory diseases, MDSC also play a role in regulation of T cell responses to systemic diseases such as trauma and sepsis (65, 75-76). During surgically induced abdominal trauma Gr- 1 + CD11b + cells rapidly accumulate in the spleen (76). When the phenotype of trauma induced or control splenic Gr-1 + CD11b + cells was examined, both groups of cells had low expression of MHC II, CD80, CD86 and F4/80 and were found to be a mixture of mature neutrophils and immature myeloid cells upon morphological analysis (76). In vitro studies demonstrate trauma-induced Gr-1 + CD11b + cells inhibit T cell proliferation and IL-2 production (76). Further, Arg1 expression was detected in freshly isolated trauma- induced Gr-1 + CD11b + cells and not in control splenic Gr-1 + CD11b + cells (76). The presence of Arg1 expression only in trauma-induced Gr-1 + CD11b + cells suggest that these cells are functional MDSC capable of regulating immune responses in vivo. However, this was not directly evaluated in this study. Polymicrobial sepsis expands Gr-1 + CD11b + cells, composed of predominately immature myeloid cells, in the spleen, lymph nodes and bone marrow (65). In vitro studies demonstrate spleen Gr-1 + cells from septic mice inhibited IFN-γ production by CD8 + T cells (65). Further, upon in vitro stimulation with LPS spleen Gr-1 + cells produced IL-10, TNF-α, RANTES and MIP-1β (65). In vivo studies using Gr-1 depletion demonstrated Gr-1 + cell production of cytokines and chemokines contributed to Th2 polarization during sepsis (65). Thus, in addition to altering T cell proliferation, MDSC can also shape T cell dependent immune responses in vivo by altering the Th1/Th2 balance during sepsis.
28 11 MDSC in Cancer MDSC facilitate tumor growth and progression through immune and non-immune mechanisms. The immune mechanisms leading to tumor escape include inhibiting T cell mediated responses to tumor antigens and the disruption of myelopoiesis (77). The ability of MDSC to inhibit T cell immune responses is strongly linked to the expression of Arg1 and inos and the production of reactive oxygen and nitrogen species (ROS, RNS) (55). MDSC can directly suppress tumor antigen specific T cell responses and contribute to the state of immunosuppression during tumor growth (71, 77-78). Further contributing to the immunosuppressive environment present during tumor growth, altered myelopoiesis during cancer sustains large numbers of immature myeloid cells in the periphery, reducing numbers of mature antigen presenting cells (APCs) (77, 79). Nonimmune mechanisms by which MDSC promote tumor growth and metastasis include the production of pro-angiogenic factors such as vascular endothelial growth factor (VEGF) and metalloproteases which promote invasion and metastasis (79-80). The important role MDSC play in tumor progression can be further illustrated in studies where targeted disruption of MDSC in vivo resulted in improved anti-tumor immunity (81-82). Indeed multiple mechanisms have been used to inhibit or eliminate MDSC, all of which resulted in delayed tumor growth and/or enhanced anti-tumor responses. Depletion of Gr-1 cells in tumor-bearing mice results in delayed tumor outgrowth and enhanced survival time (82). Using inhibitors of Arg1 and inos, Serafini and colleagues demonstrated that impairing the mechanisms MDSC use to inhibit antitumor immune responses reverses tumor-induced immunosuppression in vivo (81). Using multiple tumor models, the authors demonstrate that treatment of tumor-bearing mice with phosphodiesterase-5 inhibitors, which block Arg1 and inos activity in MDSC, delays tumor progression and improves anti-tumor T cell responses in vivo (81). Despite the clear role for MDSC in tumor growth, few studies have examined the function or phenotype of MDSC from the tumor site. Early studies by Gabrilovich and
29 12 colleagues demonstrated that tumor-derived soluble factors were necessary for MDSC to remain inhibitory (77). When MDSC from spleens of tumor-bearing mice were adoptively transferred into healthy controls, they rapidly differentiated into mature DC, granulocytes and macrophages. Thus, even with clear data demonstrating the importance of inflammatory stimuli in sustaining and enhancing suppressive function of MDSC, the function of cells at the tumor site has not been well studied. Among tumor-infiltrating leukocytes, multiple cell types share surface markers associated with MDSC, including tumor-associated macrophages (TAMs) and granulocytes. The relationship between MDSC and these cell types remains unclear largely due to the lack of studies examining MDSC at the tumor site. One study examining the phenotype of tumor-infiltrating CD11b + cells found three distinct populations: SSC hi CD11b + Gr-1 -/int eosinophils, SSC low CD11b + Gr-1 hi neutrophils and a morphologically heterogeneous population of SSC lo CD11b + Gr-1 int/dull cells bearing similarity to inflammation-associated macrophages (83). While the suppressive function of these populations was not directly tested, Arg1 and inos were expressed by both the neutrophil like and monocyte like populations (83). Recently, the function and phenotype of Gr-1 + CD11b + cells isolated from the tumor site or the spleen were directly compared (60). Tumor and spleen MDSC from the same animal shared a similar phenotype across multiple tumor models (60). Functionally, both tumor and spleen MDSC could inhibit antigen specific T cell proliferation, with tumor MDSC having significantly higher suppressive function than spleen MDSC (60). However, only tumor MDSC could inhibit antigen non-specific T cell proliferation (60). These data demonstrate that although the phenotype of Gr-1 + CD11b + cells from the spleen and tumor site appear to be similar, functionally MDSC from the tumor site are more immunosuppressive than cells from peripheral tissues.
30 13 Mechanisms of Suppressive Function Suppressive function in MDSC is activated by a wide variety of stimuli including IFN-γ, toll-like receptor (TLR) ligands, IL-4, IL-13 and transforming growth factor-β (TGF-β) (55). With the exception of TLR ligands, these stimuli are produced by T cells and highlight the important role of T cell-mdsc crosstalk. MDSC are potent inhibitors of innate and adaptive immunity and use multiple immunosuppressive mechanisms that are both inflammation dependent and inflammation independent. Inflammation dependent suppressive mechanisms include the production of reactive oxygen and nitrogen species (ROS, RNS) by MDSC via the expression of Arg1 and inos, two enzymes directly regulated by inflammatory cytokines (84-85). Inflammation independent mechanisms by which MDSC inhibit T cell activation include altering Th1/Th2 balance in microenvironments and preventing functional T cell: APC contacts by altering T cell migration (86-87). Inflammation Independent Mechanisms MDSC use multiple inflammation independent mechanisms to prevent T cell activation. MDSC block T cell activation through depravation of cystine, an amino acid that is necessary for full activation of T cells. Under normal conditions cysteine is picked up and presented to T cells in its reduced form (cystine) by APCs. However, MDSC effectively deplete cystine from microenvironments thereby limiting its availability and preventing full activation and function of T cells (86). Down-regulation of L-selectin is another mechanism MDSC use to inhibit efficient T cell activation, preventing T cell homing to lymph nodes and impaired anti-tumor T cell responses (86-87). MDSC can also shape immune responses through the production of cytokines such as IL-10, TGF-β (88). MDSC can down-regulate macrophage production of IL-12 by producing IL-10, shifting the microenvironment toward a tumor promoting TH2 response (61). Additionally, MDSC-produced IL-10 and TGF-β have been
31 14 implicated in the generation of T regulatory cells (Treg) in vitro; however, validation of this has not yet been demonstrated in vivo (89). Inflammation Dependent Mechanisms The immunosuppressive function of MDSC is directly linked to the expression of Arg1 and inos (55, 73, 78, 85, 90). Both the Arg1 and inos enzymes metabolize L- arginine, a critical amino acid for T cell proliferation, thereby limiting availability of this important amino acid. Arg1 expression leads to inhibition of T cell proliferation through down modulation of the TCR ζ chain whereas inos expression inhibits MCH II expression and induces T cell apoptosis (84, 91). In addition to directly contributing to immunosuppression through L-arginine depletion, Arg1 and inos also make ROS and RNS, the production of which is augmented by inflammation (Fig. 3) (88, 92). RNS produced by MDSC include nitric oxide (NO) and peroxynitrite (55). inos produces NO which is directly toxic to T cells, inducing apoptosis in vitro via an IFN-γ dependent mechanism (74). However, under conditions where Arg1 and inos are both present, NO combines with superoxide to generate peroxynitrite. Peroxynitrite is a strong oxidizing agent and can induce the nitration of cysteine, methionine, tryptophan and tyrosine residues (84). Further, nitrated tyrosine residues in both the T cell receptor and CD8 + molecules can block the ability of T cells to recognize peptide:mhc complexes, further contributing to MDSC induced immunosuppression (73). In the tumor microenvironment inflammation augments the immunosuppressive function of MDSC (88, 92). Over-expression of IL-1β or IL-6 in the tumor environment results in increased suppressive activity of splenic Gr-1 + CD11b + cells, due in part to enhanced production of RON and RNS (92-94). In addition to directly enhancing immunosuppressive function of MDSC, inflammatory signals can also induce a positive feedback loop enabling MDSC to promote their own anti-tumor activities. IL-13 can promote the production of IFN-γ and IL-13 by MDSC by binding to the IL-4Rα on
32 15 MDSC, thereby allowing MDSC to sustain their own Arg1 and inos production (71). These data demonstrate the importance of inflammation in the function of MDSC and the impact it has on the magnitude of the immunosuppressive environment activated by MDSC. Further, the role of inflammation in the function of MDSC provides significant evidence toward understanding how inflammation can impact development and progression of cancer. Inflammation and Cancer Chronic inflammation is now definitively linked to the development of several human cancers and is implicated in many more (95). Persistent bacterial, viral or parasitic infection or inflammation from some auto-immune diseases all lead to an increased incidence of cancer in the target organ of the inflammatory disease (reviewed extensively by Coussens and Karin) (95-97). An inflammatory microenvironment is a component of all solid tumors and is a result of interaction between tumor cells, stromal cells and immune cells. Once a solid tumor is established, tumor cells recruit inflammatory cells (possibly initiated during necrosis before neo-vascularization of the tumor occurs) that produce cytokines and chemokines that augment tumor cell proliferation. Myeloid cells including TAM, MDSC and M1/M2 cells play a central role in the relationship between inflammation and cancer, creating a bidirectional interaction between both immune cells and the tumor itself (Fig. 4). Further, myeloid cells and inflammation impact tumor growth at every stage of development from initiation to metastasis. One way that chronic infections may lead to cancer is through the production of molecules that can act as DNA mutagens, such as ROS and RNS. In response to infection, myeloid cells are activated to produce ROS and RNS to help eliminate the pathogen invading the host. High concentrations of ROS and RNS produced locally by myeloid cells such as macrophages, neutrophils or MDSC at the site of the infection may
33 16 induce DNA damage or genomic instability. Further, immune cells recruited into the site of inflammation may induce ROS in the epithelial cells themselves through the production of cytokines like TNF-α (95). These data highlight the important role of immune cell and tumor cell crosstalk and suggest that inflammation is responsible for tumor initiation at least in some instances. Inflammation may also support the growth of a single transformed cell into a fully developed primary tumor during tumor promotion. Immune cells recruited into the tumor produce cytokines and chemokines that activate the NF-κB, STAT-3 or AP1 pathways activate genes controlling proliferation, survival, motility and angiogenesis (98-99). In skin cancer, the tumor promoting role of AP1 was activated by TNF-α, leading to increased proliferation, differentiation and ultimately leading to transformation (100). In a mouse model of colitis-associated cancer (CAC), inactivation of NF-κB in myeloid cells decreased tumor growth and blocked cytokine production in response to colitis demonstrating a direct role for myeloid cells in tumor promotion (101). In order for a tumor to continue to grow it must obtain its own blood supply through a process called angiogenesis. TAMs are recruited into tumors through hypoxia by the expression of angiopoetin-2 and VEGF (95). Once inside the tumor microenvironment TAMs produce pro-angiogenic factors such as IL-8, hypoxia inducible factor-1α (HIF-1α) and VEGF, the expression of which is directly regulated by STAT-3, AP1 and NF-κB ( ). These examples demonstrate the role that inflammation plays in tumor promotion and highlight the importance of the NF-κB, STAT-3 and AP1 transcription factors in both immune cells and tumor cells in the tumor microenvironment.
34 17 The Tumor Promoting Roles of the Adaptive Immune System The adaptive immune system is well known for its role in anti-tumor immune functions. Th1 cells produce IFN-γ the hallmark cytokine associated with immune surveillance and are normally thought to play a protective role against tumor development. In a mouse model of pancreatic cancer, CD4 + cells are recruited to the tumor site, produce IFN-γ and arrest papilloma development (104). However, both T and B lymphocytes can also promote tumor growth through the production of cytokines and antibodies. CD4 + cells play a direct role in promotion of epithelial carcinogenesis by enhancing neutrophil recruitment and MMP production (105). This study did not characterize the subset of CD4 + T cells involved in tumor promotion, but a role for Th1, Th2 and Th17 cells has been established in other tumor models. Qin et al. showed IFN-γ promoted early papilloma development in a chemically induced model of skin cancer by enhancing the inflammatory response induced by the chemical carcinogen (106). This response was directly linked to the ability of IFN- γ to enhance IL-17 production in the skin demonstrating that in this model both Th1 and Th17 cells play a role in tumor promotion (106). Further in mouse models of melanoma and bladder cancer, IL-17 dependent IL-6 production led to activation of STAT-3 in both tumor and tumor stromal cells, which enhanced tumor growth by increasing pro-survival and pro-angiogenesis signals (107). In a mouse model of mammary carcinoma, Th2 cells producing either IL- 13 or IL-4 acted through myeloid cells to accelerate tumor growth ( ). Further, production of IL-4 promoted tumor invasion and metastasis by regulating the phenotype and function of TAM (109). The impact of T cells on tumor progression is largely mediated by the production of tumor promoting cytokines and augmentation of inflammatory responses necessary for malignant transformation. Similarly, B cells can also skew the immune response in favor of the tumor by activating and recruiting immune cells into pre-malignant tumor tissue. In
35 18 a mouse model of skin cancer, loss of T and B cells resulted in delayed tumor progression, in part through decreased recruitment of leukocytes into pre-malignant tumor tissue (110). Notably, even though in this model B cells were not found to infiltrate pre-malignant skin, B cells were found to be sufficient for progression to malignancy. In this model, the production of antibodies by B cells led to formation of immune complexes which bound to activating Fcγ receptors on myeloid cells and mast cells resulting in malignant conversion ( ). These studies indicate that cytokines and antibodies produced by lymphocytes can create a protumorigenic environment, activating inflammatory pathways in immune cells, tumor cells, and the tumor stroma. The Tumor Promoting Roles of the Innate Immune System The most prevalent subset of tumor infiltrating leukocytes are myeloid cells, and while up to 50% of the tumor mass can be composed of these cells, tumor associated myeloid cells represent an extremely heterogeneous population of cells including MDSC, M1 and M2 polarized macrophages. Further myeloid cells play a critical role in shaping the inflammatory response inside a tumor via communication with the adaptive and innate immune cells and by establishing a paracrine loop between tumor cells (Fig. 4) (112). Myeloid cells in tumors bearing an M2 or TAM phenotype promote metastasis through production of pro-angiogenic factors such as VEGF, epidermal growth factor (EGF) and MMPs (112). Further, MDSC and TAM have both been shown to promote tumor growth by inhibiting immune surveillance. HIF-1α expression in both TAM and MDSC lead to T cell suppression, which in MDSC was linked to enhanced expression of Arg1 and inos (60, 113). Tumor infiltrating neutrophils (TAN) can also promote tumor growth (82, 114). TAN production of MMP9 activated VEGF:VEGF-R signaling, leading to angiogenesis in a mouse model of pancreatic cancer (114). However, these studies both
36 19 used anti-gr-1 antibody to deplete neutrophils, which in recent years also has been shown to eliminate MDSC from tumor-bearing hosts. In a recent study by Fridlender and colleagues, TAN, clearly defined as CD11b + Ly6G + cells with morphological characteristics of mature neutrophils, were for the first time classified as N1 or N2 like (115). TAN acquired an N2 phenotype (high Arg1, CCL2 and CCL5) after exposure to TGF-β and supported tumor growth (115). N1 TAN (low Arg1, increased ROS, increased TNF-α) were found in the absence of TGF-β and acquired enhanced anti-tumor lytic activity (115). These studies demonstrate neutrophils can influence tumor growth, however, their exact role and their relationship to granulocytic-mdsc requires further investigation. Another component of the innate immune system that supports tumor growth is mast cells (MC). MC promote tumor growth by enhancing tissue remodeling through production of MMPs that lead to the degradation of the extra cellular matrix, by enhancing angiogenesis and by directly suppressing anti-tumor immune responses. (116). MC infiltration into pre-malignant tissue is critical for malignant transformation during skin cancer and for tumor growth in established tumors ( ). The pro-angiogenic role of MC is mediated by their production of heparin, heparanase, TNF, VEGF and angiopoietin (116, 119). MC are most well known for their potent pro-inflammatory roles in allergy and auto-immunity; however, a role for MC in regulation of T cell response during allograft transplantation and cancer is now emerging (116). MC production of IL- 10 and the expression of PD-L1 and PD-L2 (ligands for the inhibitory co-stimulatory PD1-receptor on T cells) have been shown to lead to inhibition of T cell responses (116). These data highlight the multiple ways in which MC can influence tumor development and once again demonstrate the complex interactions between the innate and adaptive immune system during cancer development. Thus pro-inflammatory stimuli such as cytokines, chemokines and growth factors not only support immune cell function and
37 20 communication during tumor growth but also act as an important means of communication between immune cell and tumor cell crosstalk. Summary Chronic abacterial prostate inflammation is a prevalent disease with an enigmatic etiology, due in large part to the paucity of appropriate animal models. Clinical data have for several years implicated the development of prostate reactive lymphocytes in sustaining chronic inflammatory responses in the prostate. In agreement with these findings, T and B cell responses to prostate auto-antigens such as PSBP have been shown to sustain inflammation in several animal models of prostate inflammation. However, because these data were generated in animal models with defective tolerance mechanisms, how lymphocyte responses to prostate antigens like PSBP develop is still unclear. Beyond auto-immunity, it is still not clear how immune responses in the prostate are regulated. Work by Tung and colleagues have established the role for Treg in control of immune tolerance in the prostate; however, the role of other regulatory cell populations like MDSC is unknown. MDSC are now well established in their ability to regulate adaptive immune responses during microbial infection, trauma, auto-immunity and cancer. Much like Treg cells before the discovery of Foxp3, MDSC are identified as a Gr-1 + CD11b + cell with the functional ability to inhibit T cell proliferation during in vitro suppression assays. Thus if a Gr-1 + CD11b + cell taken from the spleen of a mouse with an inflammatory disease is able to inhibit T cell proliferation in vitro it is termed a MDSC. Gr-1 + CD11b + cells accumulate in multiple tissues in mice with inflammatory diseases. Whether Gr- 1 + CD11b + cells taken from the site of inflammation or from peripheral tissues are comparable in their ability to inhibit T cell proliferation is not known. MDSC are expanded in multiple mouse models of cancer and promote tumor growth by suppressing anti-tumor immunity and promoting angiogenesis. However, if
38 21 MDSC are expanded by prostate tumor growth, and their role in prostate cancer is not yet established. Further, the majority of tumor models used to study the role of MDSC in cancer use heterotopic transplantable tumors and not spontaneous models of cancer development. MDSC are supported and sustained by inflammatory signals derived from the tumor. Clinical data have established a strong link between chronic inflammation and an increased risk for developing prostate cancer. However, whether chronic prostate inflammation can accelerate tumor growth and metastasis is not yet clear.
39 22 Figure 1: Classification of myeloid-derived suppressor cell subsets in mice. MDSC are identified in mice as immature myeloid cells expressing Gr-1 and CD11b without markers of mature macrophages or dendritic cells. MDSC can be subdivided into 2 major categories based on expression of Ly6G and Ly6C, monocytic MDSC (M- MDSC) and granulocytic MDSC (PMN-MDSC). M-MDSC express CD11b and high levels of Ly6C and do not express Ly6G. It is thought that M-MDSC use both Arg1 and inos to suppress T cell responses. M-MDSC when removed from inflammatory stimuli can differentiate into mature macrophages or dendritic cells. PMN-MDSC also express CD11b, but express Ly6G and low levels of Ly6C. PMN-MDSC use primarily Arg1 to inhibit T cell responses and are terminally differentiated cells.

40 Adapted from Nat Rev Immunol Mar;9(3):
41 24 Figure 2: Expansion, recruitment and activation of myeloid-derived suppressor cells during steady state and disease states. Immature myeloid cells emerge from the bone marrow and in a healthy animal differentiate into macrophages, dendritic cells and granulocytes in peripheral tissues. When the animal experiences an inflammatory disease such as infection, trauma or tumor growth inflammatory signals feed back into the bone marrow increasing the numbers of immature myeloid cells exiting the bone marrow. Expanded populations of immature myeloid cells accumulate in peripheral tissues such as the spleen and are then recruited into inflammatory tissues. At these inflammatory sites MDSC are exposed to activation signals ranging from TLR ligands to pro-inflammatory cytokines.
42 Adapted from Nat Rev Immunol Mar;9(3):
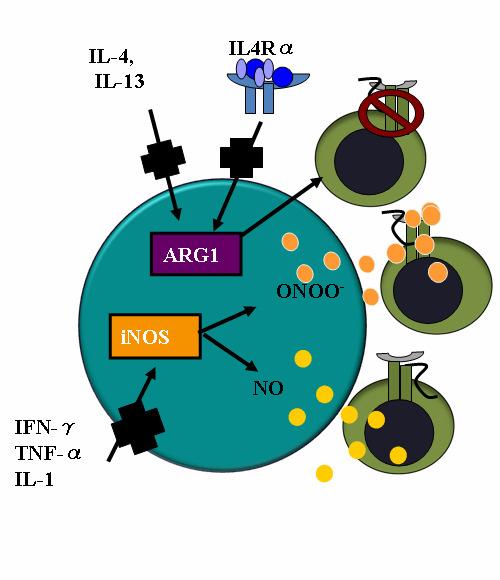
43 26 Figure 3: Myeloid-derived suppressor cells employ multiple mechanisms to inhibit T cell function. The suppressive function of MDSC is strongly linked to the expression of two enzymes which metabolize L-arginine: Argianse-1 (Arg1) and inducible nitric oxide synthase (inos). Arg-1 inhibits T cell proliferation by metabolizing L-arginine, which limits the availability of this necessary amino acid, thereby limiting T cell proliferation. The lack of L-arginine also decreases the levels of CD3ζ on T cells. inos metabolizes L-arginine to produce nitric oxide (NO) which can directly induce T cell apoptosis. Arg1 by limiting L-arginine levels available to inos can induce inos to produce peroxynitrites (ONOO - ) which can then bind to and chemically modify the T cell receptor, preventing T cell activation by cognate peptide:mhc complexes. The expression of both Arg1 and inos are induced by inflammatory cytokines; Arg-1 by IL-4, IL-13; inos by IFN-γ, TNF-α and IL-1.
44 27
45 28 Figure 4: The role of myeloid cells in tumor progression and their interaction with the adaptive immune system. Myeloid cells can have tumor-promoting or anti-tumor roles in cancer depending on the context of the tumor microenvironment. Red indicates M1 polarization; green M2 polarization. Arrows indicate crosstalk between macrophages and lymphocytes. Tam, tumor associated macrophage, TAN, tumor-associated neutrophil.
:889-96 29")
46 Adapted from: Nat Immunol Oct;11(10):
47 30 CHAPTER II. IN VIVO SUPPRESSIVE FUNCTION OF MYELOID-DERIVED SUPPRESSOR CELLS IS RESTRICTED TO THE INFLAMMATORY SITE Abstract Current paradigm suggests that despite the heterogeneity of myeloid-derived suppressor cells (MDSC), all Gr-1 + CD11b + cells can exert suppressive function when exposed to inflammatory stimuli. In vitro evaluation shows MDSC from multiple tissue sites have suppressive activity, and in vivo inhibition of MDSC enhances T-cell function. However, the relative capacity of MDSC present at localized inflammatory sites or in peripheral tissues to suppress T-cell responses in vivo has not been directly evaluated. In the current study, we observed that during a tissue specific inflammatory response, MDSC inhibition of CD8 + T-cell proliferation and IFN-γ production was restricted to the inflammatory site. Using a prostate specific inflammatory model we showed that MDSC from inflammatory sites possess immediate capacity to inhibit T-cell function, whereas those isolated from peripheral tissues (spleens and liver) were not suppressive without activation of inos by exposure to IFN-γ. These data suggest that MDSC are important regulators of immune responses in the prostate during acute inflammation and that regulation of T-cell function by MDSC during a localized inflammatory response is restricted in vivo to the site of an ongoing immune response. Introduction Myeloid-derived suppressor cells (MDSC) are a heterogeneous population of immature myeloid cells identified in mice as Gr-1 + CD11b + cells with the ability to suppress T cell proliferation (55, 120). Expanded populations of MDSC with in vitro suppressive function have been identified in the blood, spleen, bone marrow, liver, tumor and sites of ongoing inflammatory conditions in mice (62-63, 66-67). Current thinking suggests that MDSC acquire suppressive function only after exposure to factors present
48 31 in inflammatory or tumor microenvironments (68, 121). However, while it is understood that inflammatory factors and/or activated T cells are necessary for activation of suppressive function in MDSC; current in vitro studies to evaluate the suppressive potential of MDSC utilize long term culture with activated T cells, allowing the acquisition of suppressive function that may not have been present at the time of isolation. MDSC play an important role during benign inflammatory conditions in vivo (64-65, ). MDSC shape the immune response to viral antigens, influence antibody production during sepsis, and down-regulate T cell responses to auto-antigens (64-65, ). Thus, while it is clear that MDSC regulate cell mediated immune responses, it is unclear whether MDSC present in tissues peripheral to a local inflammatory site functionally regulate T cell responses. To characterize the suppressive capacity of MDSC from inflammatory or peripheral sites during a localized inflammatory response, we used the Prostate Ovalbumin-Expressing Transgenic (POET-3) mouse model of prostate inflammation. POET-3 mice provide an animal model where a CD8 + T cell dependent inflammatory response to ovalbumin is induced locally in the prostate (124). Herein we demonstrate that during a tissue specific inflammatory response the suppressive activity of MDSC in vivo is restricted to cells present in the inflammatory environment. In support of these data, in vivo depletion of Gr-1 + cells during acute prostate inflammation specifically increased T cell function at the inflammatory site while T cell function in the spleen was not affected. Together these data demonstrate that in vivo regulation of T cell function by MDSC during a tissue specific inflammatory response is localized to the inflammatory site.
49 32 Materials and Methods Mice and in vivo experiments Prostate ovalbumin expressing transgenic-3 mice (POET-3) were generated as previously described (124). Rag-/-Thy1.1 + OT-I (OT-I) mice were generated by breeding Rag-/-mice (Jackson Laboratories) to Thy1.1 + OT-I mice. All animals used were male mice between 8-12 weeks of age. All protocols for the reported animal studies were approved by The Lab Animal Program at Purdue University. To induce prostate inflammation, splenocytes were isolated from OT-I mice and cultured at 5X10 5 /ml with 1µg/mL SIINFEKL (Ova peptide , American Peptide) for 48hrs. Live cells were purified by Fico/Lite (Atlanta Biologicals) and 5X10 6 cells were injected i.v. into POET- 3 mice. Flow cytometry Single cell suspensions were then incubated with TruStain FcX antibody (BioLegend) then stained with directly conjugated antibodies (ebioscience; BioLegend) according to manufacturer instructions. Flow-cytometric analysis was performed on a FACS Canto (BD Biosciences) and data were analyzed using FlowJo software (Tree Star). Isolation of leukocytes Leukocytes were isolated from spleens by grinding spleens between frosted microscope slides in PBS. Red blood cells were lysed with ACK buffer and passed through a 70 µm filter. For isolation of leukocytes from prostate tissue, prostates were placed in a solution of 2 µg/ml Collagenase D (Roche Diagnostics) in RPMI containing 10% FBS. Tissue was minced and placed at 37 C for 1 hr for digestion followed by passing through a 70 µm filter. To isolate leukocytes from the liver, liver tissue was removed, placed in 2mg/mL collagenase D solution, pressed through a 70µM filter and
50 33 incubated at 37 C for one hour with shaking. Cells were then re-filtered, washed and passed through a 30% Percoll gradient to separate hepatocytes from red blood cells and leukocytes (Sigma-Aldrich). Red blood cells were lysed with ACK, washed and the remaining leukocyte pellet was stained for FACS. Histology and Immunohistochemistry Prostate lobes were dissected and placed in 10% neutral buffered formalin for histology and processed for hematoxylin and eosin staining and for nitrotyrosine staining. For nitrotyrosine staining antigen retrieval was done using citrate buffer (ph6) and sections endogenous peroxidases were blocked with.3% hydrogen peroxide for 10 minutes. Blocking was performed using 2.5% horse serum (Vector Laboratories) for 20 minutes and anti-nitrotyrosine antibody (1:1,000, Millipore) was incubated for 30 minutes at room temperature. Control sections received no anti-nitrotyrosine antibody. Peroxidase anti-rabbit Ig (ImmPRESS reagent, Vector Laboratories) was applied to sections for 30 minutes, after which slides were developed using DAB kit (Vector Laboratories). The slides were counterstained with hematoxylin (Vector Laboratories), dehydrated, cleared and mounted using Vectamount (Vector Laboratories). For immunohistochemistry, prostate lobes were dissected and snap frozen in Tissue Tek (Sakura). Frozen sections (5µm thick) were air-dried and then fixed in acetone for 5 minutes. Endogenous peroxidase activity was blocked with 3% hydrogen peroxide in PBS for 5 min. Sections were blocked with 10% rat serum in PBS, followed by staining with biotinylated anti-gr-1 (BD Biosciences) at 1:100 or rat IgG2a isotype control (BD Biosciences) at 1:100 in 10% rat serum in PBS. DAB kit (Vector Laboratories) was applied for visualization. Arg1 assay For analysis of Arg1 enzyme function, CD45 + Gr-1 + CD11b + cells from freshly isolated tissues were sorted and re-suspended at a concentration of 1X10 7 per ml in lysis
51 34 buffer. The level of Arg1 activity was assessed in supernatants of cell lysates according to manufacturer instructions (BioAssay Systems). Units per liter are defined as 1 unit of Arg1 able to convert 1 µm of L-arginine to ornithine and urea per minute at ph 9.5 and 37 C. Detection of inos For detection of inos protein by flow cytometry, an intracellular staining kit was used according to manufacturer instructions (BD Biosciences) using FITC mouse antiinos (BD Biosciences) or FITC mouse IgG2a isotype control (BioLegend) at a 1:100 dilution. Reactive oxygen and nitrogen species ROS and RNS production was measured in prostate and spleen tissue by 5- (and- 6)carboxy-2,7-dichlorodihydrofluoresceindiacetate (DCFDA, Invitrogen) staining. Cells were incubated at 37 C in RPMI, or in RPMI in the presence of N W- hydroxyl-nor-larginine (nor-noha, 10µM, Calbiochem) or with N G- Monomethyl-Larginine monoacetate salt (LNMMA, 100µM, Calbiochem) for 30 minutes. DCFDA (2ųM) was then added and cells were incubated for another 30 minutes at 37 C. Cells were then washed twice with cold PBS and incubated with antibodies for flow cytometry. After 20 minutes, cells were washed twice in cold PBS, and analyzed by flow cytometry. Quantitative real-time PCR Total RNA was prepared from FACS sorted CD45 + Gr-1 + CD11b + cells using the RNAeasy kit (Qiagen). cdna was synthesized using qscript flex cdna synthesis kit (Quanta Biosciences). Quantitative RT-PCR was carried out using TaqMan primer and probe sets for mouse Arg1, inos, C/EBPβ and 18s rrna (Applied Biosystems). Relative mrna expression = 2 (Ct of gene Ct of 18s rrna), where Ct is the threshold cycle
52 35 value. Data were normalized to 18s RNA and are representative of three independent experiments. 72 hour T cell suppression assay CD45 + Gr-1 + CD11b + cells were pooled from 5 mice per group and sorted from tissues using the icyte Reflection (icyte) cell sorter. Thy1.1 + OT-I spleen cells were added at 1X10 5 cells per well in the presence of SIINFEKL peptide (1µg/mL). After 48hr, BrdU (BD Biosciences) was added to monitor proliferation. At 72hr, the percentage of BrdU + Thy1.1 + cells was analyzed by flow cytometry. Where indicated neutralizing IFN-γ antibody, LNMMA or nor-noha were added at the beginning of culture (10µg/mL, clone H22; R&D systems). The percentage suppression of proliferation is calculated as (1- proliferation with MDSC proliferation without MDSC) X 100. Where neutralizing IFN-γ antibody is used the percentage suppression of proliferation with is calculated as (1- proliferation with MDSC with inhibitor proliferation without MDSC with inhibitor ) X 100. Effector T cell suppression assay CD45 + Gr-1 + CD11b + cells were pooled from 5 mice per group and sorted from tissues using the icyte Reflection (icyte) cell sorter. OT-I cells were pre-activated for hours with SIINFEKL (1µg/mL), purified by Fico/Lite gradient and added at 1X10 5 cells per well in the presence of SIINFEKL peptide (1mg/mL). BrdU was added directly to culture wells and cells were harvested for analysis after 12 hours. To evaluate proliferation, the percentage of BrdU + Thy1.1 + cells was analyzed by flow cytometry. Where indicated neutralizing IFN-γ antibody, LNMMA or nor-noha were added at the beginning of culture (10µg/mL, clone H22; R&D systems). The percentage suppression of proliferation is calculated as (1- proliferation with MDSC proliferation without MDSC) X 100. Where neutralizing IFN-γ antibody is used the percentage suppression of proliferation with is calculated as (1- proliferation with MDSC with inhibitor proliferation without MDSC with inhibitor) X 100.
53 36 In vivo depletion experiments POET-3 mice received 100µg IV anti-gr-1 depletion antibody clone RB6-8C5 (a kind gift of Dr. John Harty, The University of Iowa) or isotype control antibody (SFR8, ebiosciences) four hours prior to adoptive transfer of Thy1.1 + cells as described above. Mice received additional injections of antibody at day 2 and day 4, and on day 6 prostate and spleen tissue were harvested and single cell suspensions were prepared. Intracellular IFN-γ (Biolegend) staining of prostate and spleen tissue was performed according to manufacturer instructions (BD) after re-stimulation with SIINFEKL peptide (5µg/mL) for 5 hours. Results Gr-1 + CD11b + cells are expanded during acute prostate inflammation To determine if MDSC were expanded during prostate inflammation, we used the Prostate Ovalbumin-Expressing Transgenic (POET-3) mouse model of prostate inflammation (124). Adoptive transfer of activated Thy1.1 + OT-I T cells induced prostate inflammation as shown by histological analysis (Fig. 5) and by the presence of CD45 + leukocytes in prostate tissue (Fig. 6A). The peak of the acute inflammatory response was observed between day 6 and 10 before declining between day 10 and 14 (Fig. 6A). Importantly, all lobes of the prostate show similar levels and kinetics of CD45 + infiltration (Fig. 6A), demonstrating the inflammatory response is not restricted to one area of the prostate as has been seen in other rodent models of prostate inflammation (125). Naïve prostate tissue contained only trace numbers of Gr-1 + CD11b + cells, preventing further study of these cells (Fig.6A, number of events per 250,000: dorsal lateral ; anterior ; ventral , Fig. 7). To determine if Gr- 1 + CD11b + cells were present among the cellular infiltrate in inflamed prostates, flow cytometry analysis was performed on inflamed prostate tissue. Gr-1 + CD11b + cell infiltration into inflamed prostates is transient with the peak infiltration occurring at day
54 37 6, followed by a rapid loss of these cells within 14 days (Fig. 6B, C). Remarkably, at day 4 Gr-1 + CD11b + cells are a major constituent cell type among the infiltrating leukocyte populations, representing 58.0% + 1.7, 49.9% + 4.5, of all CD45 + leukocytes in the dorsal-lateral, anterior, and ventral prostates, respectively, of inflamed POET-3 mice (mean + SD). Similarly, six days post-immunization Gr-1 + CD11b + cells represent , , of CD45 + cells in the dorsal-lateral, anterior and ventral prostate lobes, respectively (mean +SD) (Fig. 6C). Importantly, at all time points tested the percentages of Gr-1 + CD11b + cells among the CD45 + population were similar in all prostate lobes (Fig. 6C). The presence of Gr-1 + CD11b + cells was confirmed by immunohistochemical analysis of Gr-1 + cells in prostate tissue (Fig. 8). Given the large accumulation of Gr-1 + CD11b + cells in inflamed prostates, we next examined the kinetics of Gr-1 + CD11b + accumulation in the spleen and lymph nodes during acute prostate inflammation. The percentage of splenic Gr-1 + CD11b + cells increased relative to naïve control mice at days 6 and 10 but the difference lost significance by day 14 as a result of variability among the mice evaluated (Fig. 6D). In the lumbar lymph nodes, which drain the prostate, Gr-1 + CD11b + cells were increased at day 6 and at day 10 (Fig. 6E). In the brachial lymph nodes, distal to the prostate, the numbers of Gr-1 + CD11b + cells were similar between naïve and OT-I treated mice (Fig. 6F). These data demonstrate acute prostate inflammation is characterized by a rapid but transient accumulation of Gr-1 + CD11b + cells at the inflammatory site and in the draining lymph nodes, and an approximately 2-fold increase in the spleen. Arg1 and inos expression is restricted to Gr-1 + CD11b + cells at the inflammatory site The suppressive function of MDSC can largely be attributed to Arg1 and inos expression, and inflammation can significantly increase expression of these enzymes (88, 92, ). We therefore hypothesized that Arg1 and inos mrna levels would be
55 38 higher in Gr-1 + CD11b + cells isolated from the inflammatory site. Even though CD45 + Gr- 1 + CD11b + levels were elevated in spleens of mice with prostate inflammation (Fig.6D), neither Arg1 nor inos mrnas were detectable in freshly isolated cells (Fig. 9A). In contrast, both Arg1 and inos mrnas were highly expressed in freshly isolated CD45 + Gr-1 + CD11b + cells from inflamed prostates (Fig. 9A). Enhanced expression of Arg1 and inos in CD45 + Gr-1 + CD11b + cells from the inflammatory site was not an artifact of treatment with collagenase D, as splenocytes incubated with this enzyme were not observed to express detectable Arg1 or inos mrna (Fig. 9A). To determine if mrna expression correlates with protein expression, the level of intracellular inos was examined in CD45 + Gr-1 + CD11b + cells isolated from the spleen and inflamed prostates. In agreement with the RT-PCR data, CD45 + Gr-1 + CD11b + cells from the inflammatory site express elevated inos protein; however, inos protein was detected only in a portion of the total CD45 + Gr-1 + CD11b + cells from inflamed prostates (Fig. 9B, Fig. 10A). Further analysis showed no detectable expression of inos in CD45 + CD11b - cells, demonstrating the specificity of the antibody (Fig. 10B). Arg1 enzyme activity was used to evaluate protein expression in freshly isolated CD45 + Gr-1 + CD11b + cells from spleens or inflamed prostates. Gr-1 + CD11b + cells from the spleens of mice with prostate inflammation express low but detectable levels of Arg1 enzyme activity (Fig. 9C), whereas those from inflamed prostates express higher levels (Fig. 9C). Arg1 activity was not detected in CD45 + Gr-1 + CD11b + cells from the spleens of naïve mice (Fig. 9C). The transcription factor C/EBPβ controls the immunosuppressive activity of MDSC through its ability to regulate Arg1 and inos expression ( ). Therefore, we next asked if cells from the inflammatory site would also have elevated expression of C/EBPβ. CD45 + Gr-1 + CD11b + cells from prostates and spleens of mice with prostate inflammation, and from the spleens of naïve mice expressed C/EBPβ. The highest expression was observed in CD45 + Gr-1 + CD11b + cells from inflamed prostate. (Fig. 9D).
56 39 Arg1 and inos metabolize L-arginine to produce reactive oxygen species (ROS) and reactive nitrogen species (RNS) such as superoxide (O - 2 ), peroxynitrite (ONOO - ) and hydrogen peroxide (H 2 O 2 ) (55, 84, 120, ). To determine if CD45 + Gr-1 + CD11b + cells from both inflamed prostates and from the spleen of mice with prostate inflammation express ROS and RNS the oxidation sensitive dye DCFDA was used. Only CD45 + Gr-1 + CD11b + cells isolated from inflamed prostates expressed elevated ROS and RNS (Fig. 9E). Fluorescence of DCFDA can indicate activity of both the Arg1 and inos enzymes and can detect both ROS and RNS. Therefore to examine the contribution of both Arg1 and inos to DCFDA fluorescence, selective inhibitors of these enzymes were used. Treatment with LNMMA, a selective inos inhibitor only partially decreased DCFDA fluorescence, whereas treatment with nor-noha, a selective Arg1 inhibitor, resulted in a total loss of DCFDA fluorescence in CD45 + Gr-1 + CD11b + cells from the inflammatory site (Fig. 9E) ( ). These data demonstrate ROS and RNS are elevated only in CD45 + Gr-1 + CD11b + cells from inflamed prostates, suggesting Gr- 1 + CD11b + cells present at the inflammatory site are functionally distinct from those in the spleen. Gr-1 + CD11b + cells are a heterogeneous population of monocytic MDSC that express inos and granulocytic MDSC, which do not express inos (55, 62-63). Thus it is possible that Gr-1 + CD11b + cells in inflamed prostates represent a mixed population of inos expressing monocytic cells and non-expressing granulocytic MDSC. Production of nitric oxide (NO) by inos can lead to the nitration of proteins in inflammatory tissues and is indicative of NO mediated cell damage (135). Therefore, given that inos was present in MDSC in inflamed prostate tissue, we asked if nitrated proteins could be detected in inflamed prostate tissue. Nitrotyrosine residues were present only in inflamed prostate tissue and further confirm the activity of inos during acute prostate inflammation (Fig. 11).
57 40 Gr-1 + CD11b + cells from inflamed prostates have a distinct phenotype compared to cells from the inflammatory site Given that Gr-1 + CD11b + cells from the inflammatory site expressed increased levels of Arg1 and inos, we next asked if there were phenotypic differences in the populations of cells from the spleen and inflammatory site. The Gr-1 antibody RB6-8C5 recognizes two epitopes, Ly6G and Ly6C, and MDSC have recently been subdivided into either monocytic or granulocytic subsets based on their Ly6C and Ly6G expression (62-63). Therefore we next examined the morphology of the cells by flow cytometry to determine which subset(s) of MDSC were expanded during prostate inflammation. CD11b + cells from inflamed prostates and spleens were found to compose a mixture of Ly6G + Ly6C + and Ly6C + Ly6G - cells, with the predominant population being the monocytic Ly6C + Ly6G - cell fraction (Fig. 12A). Importantly, the ratio of the Ly6G + Ly6C + to the Ly6C + Ly6G - cells among the total CD11b + population was similar in the prostate and spleen of inflamed mice (.46,.47 respectively), suggesting that functional differences between the spleen and prostate were not due to the differential expansion of MDSC subsets (Fig. 12A). Monocytic and granulocytic subpopulations of MDSC have different mechanisms of suppression (62-63). Therefore, we next determined the level of Arg1 and inos in the CD11b + subsets. Arg1 and inos were expressed only in cells from the inflammatory environment, with the monocytic population of cells having the highest inos mrna expression, while both subsets of cells expressed Arg1 (Fig. 12B, C). Further, cells isolated from the inflammatory environment expressed the highest levels of C/EBPβ, with expression being predominately associated with the Ly6C + Ly6G + subset (Fig. 12D). Further phenotype analysis revealed that CD45 + Gr-1 + CD11b + cells from inflamed prostates expressed lower levels of CD71 than cells from spleens, suggesting a nonproliferating phenotype (Fig. 13). PD-L1 was equivalently expressed on CD45 + Gr- 1 + CD11b + cells from all tissues. Levels of F4/80, MHC II, MHC I, CD80 and CD86 were
58 41 lower on cells from the inflammatory site, suggesting that cells from inflamed prostates are of a lower maturation status compared to cells in the periphery (Fig. 13). No expression of CD34, CD115 or IL-4Rα was detected on cells from prostate or spleen tissue (Fig. 13). Gr-1 + CD11b + cells from inflamed prostates suppress T cell proliferation in vitro Given that Arg1 and inos are associated with suppressive function of MDSC, we next tested the ability of Gr-1 + CD11b + cells from inflamed prostates and spleens to suppress antigen-specific CD8 + T cell proliferation (136). Gr-1 + CD11b + cells isolated from inflamed prostates and spleens of inflamed or control mice strongly inhibit T cell activation at a 1:1 ratio (Fig. 14A). MDSC isolated from inflamed prostates remained significantly suppressive at a lower MDSC: OT-I cell ratio suggesting MDSC from the inflammatory site have a stronger suppressive activity compared to MDSC from the spleen (Fig. 14A). The regulatory function of MDSC has been shown to be dependent upon IFN-γ, either by its direct ability to induce inos, or through its ability to induce MDSC to produce cytokines such as IL-4 and IL-13 that induce Arg1 expression (62, 71, 74, 127, 137). Therefore, we next asked if the suppressive function was dependent upon IFN-γ. When IFN-γ was neutralized the suppressive function of prostate Gr-1 + CD11b + cells was not significantly changed, whereas the function of cells isolated from spleens of mice receiving OT-I cells or from naïve controls was inhibited (Fig. 14B). These data demonstrate a selective dependence of splenic Gr-1 + CD11b + cells on IFN-γ for in vitro measured suppressive function. It is well known that CD8 + T cells produce IFN-γ when stimulated, and that IFN-γ can directly modulate levels of inos or Arg1 through a positive feedback mechanism (71, 120, 126, 138). Therefore, we next asked if the expression of these enzymes was induced in splenic Gr-1 + CD11b + cells during the suppression assay itself. Neither Arg1
59 42 nor inos mrna were detected in freshly isolated splenic Gr-1 + CD11b + cells prior to being placed in culture with activated T cells (Fig. 14C, D). However, inos mrna was induced in splenic Gr-1 + CD11b + cells during the suppression assay, in an IFN-γ dependent manner (Fig. 14C). In contrast, the constitutive expression of Arg1 and inos mrna in Gr-1 + CD11b + cells from inflamed prostates was high before (0hr) co-culture with T cells, and inos levels were further elevated by the presence of IFN-γ during the suppression assay (Fig. 14C). Arg1 mrna was not detected in any group of cells after culture with OT-I cells, most likely due to the strong production of IFN-γ during the assay (Fig. 14D). Consistent with previous reports on the role of IFN-γ in MDSC, these data suggest IFN-γ converts precursor splenic Gr-1 + CD11b + cells into functional MDSC during conventional suppression assays (68, 71). Furthermore, these data suggest spleen Gr-1 + CD11b + cells have differential regulatory capacity compared to cells from the inflammatory site in vivo. Gr-1 + CD11b + cells from the inflammatory site possess immediate regulatory capacity To test the hypothesis that precursor spleen Gr-1 + CD11b + cells have differential regulatory capacity compared to cells present at the inflammatory site, we developed a novel short term in vitro suppression assay to evaluate the immediate capacity of Gr- 1 + CD11b + cells to inhibit T cell proliferation. In this assay, sorted populations of Gr- 1 + CD11b + cells were cultured with pre-activated OT-I T cells for 12 hours to minimize exposure of Gr-1 + CD11b + cells to IFN-γ. Freshly isolated Gr-1 + CD11b + cells from the spleens of mice with prostate inflammation or from control mice showed little suppressive activity in short term suppression assays (Fig. 15A). In contrast, Gr- 1 + CD11b + cells from inflamed prostates strongly suppressed proliferation of pre-activated effector T cells at both at 1:1 and 1:4 ratios (Fig. 15A). Importantly, suppressive function of MDSC from the inflammatory site does not require in vitro IFN-γ production during
60 43 the suppression assay (Fig. 15B). To confirm that exposure to IFN-γ had not induced inos mrna in MDSC during the assay RT-PCR was performed on freshly isolated cells and on cells recovered at the end of the suppression assay. inos mrna was present only in cells from inflamed prostates and was not detectable in cells from the spleen at any time point tested (Fig. 15C). Furthermore, freshly isolated Gr-1 + CD11b + cells from the liver of mice with prostate inflammation do not express Arg1 and inos and can not suppress antigen activated CD8 + T cell proliferation in the 12 hr assay, further confirming that Gr-1 + CD11b + cells from peripheral tissues are not functional MDSC (Fig. 16A-C). These data demonstrate that freshly isolated Gr-1 + CD11b + cells from the inflammatory site but not peripheral tissues suppress proliferation of effector T cells directly ex vivo, supporting the hypothesis that the suppressive function of MDSC is acquired in vivo at the inflammatory site. Our RT-PCR data suggested that both Arg1 and inos were involved in the suppressive function of MDSC isolated from inflamed prostates. When the ability of MDSC from inflamed prostates to inhibit antigen activated T cell proliferation was tested inhibitors of both inos (LNMMA) and Arg1 (nor-noha) activity partially blocked the suppressive function (Fig. 15D). In vivo regulatory function of MDSC is restricted to cells present at the inflammatory site Our in vitro data suggested that in vivo regulatory function of MDSC was restricted to the inflammatory site during a tissue specific inflammatory process. Therefore, to test this hypothesis, we asked whether MDSC from either inflamed prostates or spleens of mice with prostate inflammation were able to inhibit T cell function in vivo using anti-gr-1 to block MDSC function (82). Inflammation was induced by the injection of Thy OT-I cells in the presence or absence of anti-gr-1 treatment. Six days later Thy1.1 + OT-I cells were isolated from inflamed prostates and
61 44 spleens of POET-3 (Thy1.2) mice and tested for IFN-γ production in vitro. Thy OT- I cells from inflamed prostates of mice given anti-gr-1 antibody showed a significant increase in their ability to produce IFN-γ compared to isotype control treated mice, whereas Thy1.1 + cells from the spleen were not affected (Fig. 17A). High dose anti-gr-1 treatment has been reported to deplete subsets of CD8 + T cells ( ). Therefore we chose a dose where depletion of CD8 + T cells was not observed (Fig.18). Consistent with the impact of anti-gr-1 on T cell function in vitro, an increase in prostate inflammation as measured by CD45 + cells (Fig. 17B) was observed in anti-gr-1 treated mice compared to isotype treated control animals. Notably, the total number of OT-I cells (Thy1.1 + cells) into inflamed prostates of anti-gr-1 treated mice was almost double that of isotype treated controls (Fig. 17C). In contrast, the number of Thy1.1 + cells remained unchanged in the spleen relative to isotype controls (Fig. 17C). These data demonstrate that during localized inflammatory responses, inhibition of MDSC function with anti-gr-1 enhances T cell function at the inflammatory site in vivo but has no effect on T cell function in the spleen, supporting our conclusion that MDSC are only active at the site of inflammation. Discussion Herein we show that MDSC are important regulators of T cell function during inflammatory responses in the prostate. Further, both in vitro and in vivo experiments demonstrate that the ability of MDSC to inhibit CD8 + T cell proliferation and IFN-γ production is restricted to the site of inflammation. Acute prostate inflammation resulted in accumulation of large numbers of Gr- 1 + CD11b + cells into inflamed prostates, with MDSC composing approximately 40% of all CD45 + cells at the peak of the inflammatory response. These data are supported by other inflammatory models such as experimental autoimmune encephalomyelitis (EAE), where at the peak of clinical disease over 30% of infiltrating cells in the CNS were CD11b +
62 45 Ly6C high cells (74). However, in contrast to our study, the function of MDSC at the inflammatory site was not examined. One of the hallmarks of MDSC is their expression of Arg1 and inos, which are necessary for inhibition of T cell responses (55, 78, 141). Analysis of Arg1 and inos enzyme activity demonstrates that MDSC present in inflammatory tissues have increased expression of these enzymes, whereas cells from peripheral tissues such as the spleen or liver do not. Arg1 and inos expression were highly expressed only in freshly isolated cells from the inflammatory site. In support of these data CD11b + cells infiltrating rat kidney allografts have increased inos levels, however these studies were not able to confirm that these cells had suppressive activity (142). MDSC are a heterogeneous population of cells and multiple markers have been identified that correspond with increased regulatory capacity in multiple animal models. This, together with the differential expression of regulatory enzymes raised the possibility that different populations of cells were expanded in the inflammatory site and spleen. Subset analyses showed that Ly6G + and Ly6C + populations were similar in spleens and inflamed prostates. Further marker analysis showed that Gr-1 + CD11b + cells from the inflammatory site have a more immature phenotype than cells from the spleen, as evaluated by decreased expression of MHC I, MHC II, CD80, CD86 and F4/80 on cells from inflamed prostates. Given the high expression of ROS and RNS by cells from the inflammatory site, it is not surprising that these cells have a lower maturation status. Production of ROS can inhibit the differentiation of myeloid cells via its ability to modulate the expression of genes through regulation of signaling pathways such as NFκB, MAPK and AKT (77, 143). Using standard in vitro suppression assays, Gr-1 + CD11b + cells from both the spleen and inflammatory site were able to inhibit T cell activation; however, cells from the inflammatory site were more potent suppressors and not dependent upon IFN-γ produced in vitro. Interestingly, cells from the spleen of inflamed mice were consistently
63 46 more suppressive than cells from spleens of naïve mice, suggesting that low levels of inflammatory cytokines may result in partial in vivo priming. These data demonstrate Gr- 1 + CD11b + cells from inflamed prostates suppress T cell function in vitro, and establish that MDSC are important regulators of immune responses in the prostate. Our study is the first to directly demonstrate long term culture with activated T cells can convert precursor splenic Gr-1 + CD11b + cells into functional MDSC through IFN- γ induction of inos. When the suppressive function of MDSC was tested in assays where their exposure to T cells was minimized, only MDSC isolated from an acute inflammatory site were able to inhibit T cell proliferation. While other studies have investigated MDSC function from specific sites such as the liver, spleen, bone marrow, lymph node and tumor, none simultaneously investigate MDSC function from other sites distal to the local inflammatory response in a manner directly testing immediate function after isolation (67-68, 71, 87, ). When the suppressive capacity of Gr-1 + CD11b + cells from peripheral tissues (spleen and liver) was directly compared to cells from the inflammatory site, only cells from the inflammatory site were able to inhibit antigen activated T cell proliferation. Furthermore, using Arg1 and inos inhibitors, the ability of prostate MDSC to inhibit antigen activated OT-I cells was partially dependant on both enzymes. The data presented herein are the first to show a site specific difference in the ability of MDSC to down-regulate T cell function directly ex vivo. Furthermore, given that MDSC comprise a dominant population at the site of inflammation, the short-term suppressor assay, which tests the ability of MDSC to control pre-activated T cells, may better reflect the in vivo function of MDSC at inflammatory sites. The ability of MDSC to suppress T cell function during normal immune responses in vivo has been demonstrated in several experimental models (64-65, ). However, none of these previous studies examined the function of T cells at a site of localized inflammation in comparison to peripheral tissues in vivo. Using a tissue specific
64 47 inflammatory model where OVA antigen (and the resulting inflammatory response) is restricted to the prostate, we found that MDSC inhibited T cell function only at the inflammatory site, demonstrating a restricted in vivo regulatory pattern for MDSC. The in vitro studies reported herein provide compelling data supporting the hypothesis that MDSC are functional in vivo only at the site of inflammation. The in vivo studies monitoring T cell expansion and function support the in vitro data; however, the absence of OVA antigen presentation in the spleen limits ones ability to definitively conclude that MDSC lack the capacity to regulate in the absence of additional signals. Functionally, the in vivo demonstration that MDSC do not regulate T cell expansion and function in the spleen supports our conclusion that MDSC regulation is restricted to the site of inflammation, providing a mechanism by which this occurs. Additionally, there is extensive evidence demonstrating that MDSC gain function in the presence of activated T cells due to exposure to IFN-γ, and that regulation is antigen-specific (146). In addition, previous studies where spleen Gr-1 + CD11b + cells are adoptively transferred into tumor bearing hosts, T cell function is diminished in vivo, showing transferred MDSC inhibit T cell expansion (128). In the POET model, OVA is not present in the spleen and accordingly, OT-I cells are not activated in this tissue. Therefore, obtaining direct evidence to support the absence of capacity to regulate in the spleen is complicated by the fact that if OVA is presented in the spleen, OT-I cells will respond by producing IFN-γ and activate function in MDSC. This conclusion is supported by data herein where spleen-derived MDSC are activated by IFN-γ in a 72 hr. assay. Thus current published data together with the data presented herein support the conclusion that MDSC are active only at the site of inflammation. Because of the apparent need for cytokine activation, these data further suggest that in vivo MDSC function to control activated T cells.
65 48 Figure 5: Adoptive transfer of OT-I cells induces acute prostate inflammation in POET-3 mice. Prostate tissue was harvested from naïve control POET-3 mice or from POET-3 mice 6 days after adoptive transfer of pre-activated OT-I cells. Representative images of hematoxylin and eosin stained ventral prostate tissue (5 mice/group, no less than 3 independent experiments). All images were acquired with the Olympus BX5 microscope using Northern Eclipse software.
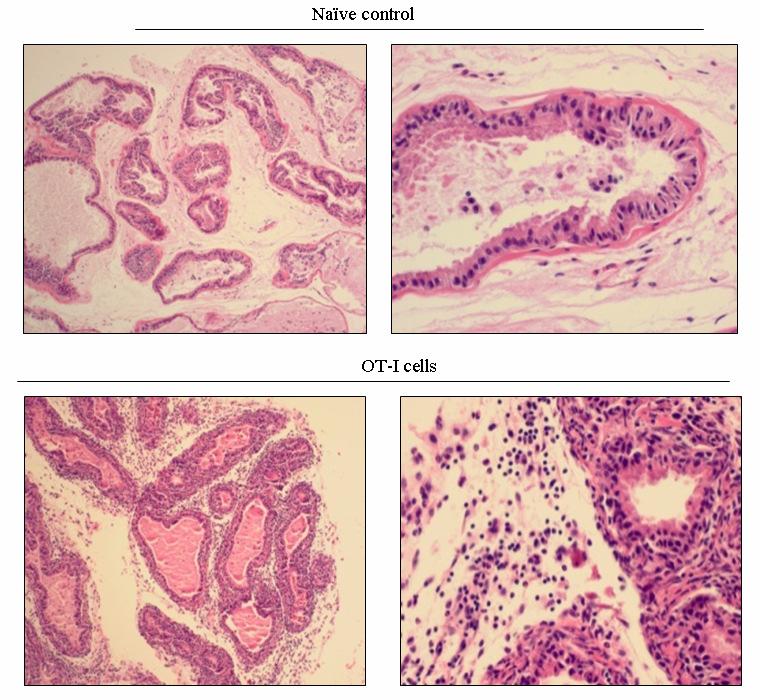
66 49
67 50 Figure 6: Acute prostate inflammation expands Gr-1+CD11b+ cells. Pre-activated OT-I cells were adoptively transferred into POET-3 mice, naïve controls received no injection. On the indicated days the numbers of CD45+ and CD45+Gr- 1+CD11b+ cells in prostate tissue (A-C) or spleen tissue (D) or in lymph nodes (E, F) were measured using flow cytometry. All data represent the mean + SD; ** p<0.01, *p<0.05, Student s t test. Data for each panel were compiled from no less that 3 independent experiments using no less than 5 mice/group.
68 51
69 52 Figure 7: Acute prostate inflammation expands Gr-1+CD11b+ cells. Pre-activated OT-I cells were adoptively transferred into POET-3 mice, naïve controls received no injection. After 6 days the percentage of CD45+Gr-1+CD11b+ cells in prostate was measured using flow cytometry. Plots are gated on CD45+ cells and show representative gating strategy used in Fig.6. Data are representative of no less than five independent experiments.
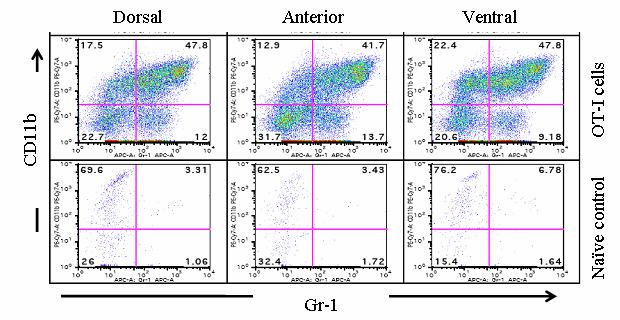
70 53
71 54 Figure 8: Gr-1+ cells accumulate in prostate tissue during acute prostate inflammation. Prostate tissue was harvested from naïve control POET-3 mice or from POET-3 mice 6 days after adoptive transfer of pre-activated OT-I cells. Representative images of two independent experiments of immunohistochemical staining for Gr-1+ cells in ventral prostate tissue. Scale bars= 50µM (3 mice/group). All images were acquired with the Olympus BX5 microscope using Northern Eclipse software.
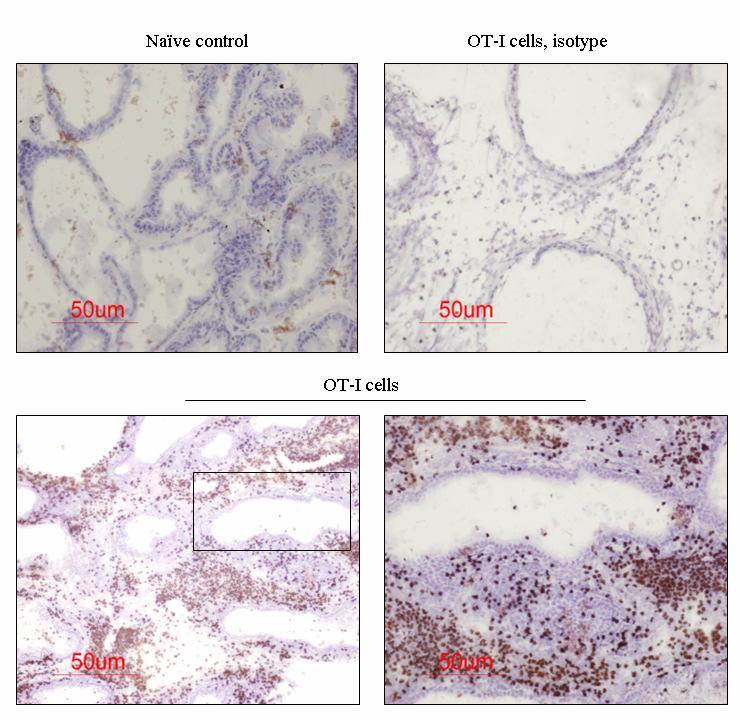
72 55
73 56 Figure 9: Gr-1+CD11b+ cells isolated the inflammatory site express Arg1 and inos. Pre-activated OT-I cells were adoptively transferred into POET-3 mice and 6 days later prostates and spleens were harvested; spleens from naïve mice served as controls. (A, D) Arg1 and inos (A) or C/EBPβ (D) mrna expression was measured by quantitative RT- PCR analysis in freshly isolated CD45+ Gr-1+CD11b+ cells from control naïve mice, from POET-3 mice receiving OT-I T cells. Samples were performed in duplicate and the data presented are the average value. ND, no detected expression. (B) The percentage of inos-expressing cells among the total CD45+ Gr-1+CD11b+ population. Data are pooled from 2 independent experiments, (mean + SD). *p<0.05, Students t test. (C) Arg1 activity in freshly isolated CD45+ Gr-1+CD11b+ cells was measured in duplicates as described in Materials and methods. ND, no detected expression. (E) Production of reactive oxygen and nitrogen species by CD45+Gr-1+CD11b+ cells was measured by incubation with DCFDA in the presence or absence of inhibitors as described in Materials and Methods section. Inset numbers show MFI of empty FL1 channel (gray solid histogram); DCFDA (green line); nor-noha and DCFDA (orange line); LNMMA and DCFDA (blue line). Data for all figure panels were pooled from5 mice/group. Each experiment was performed at least 3 times and data are reported for a representative experiment except for panel B where 2 experiments were pooled.
74 57
75 58 Figure 10: inos expression is elevated in Gr-1+CD11b+ cells from the inflammatory site. Pre-activated OT-I cells were adoptively transferred into POET-3 mice and 6 days later prostate and spleen tissues were harvested for analysis. Spleens from naïve POET-3 mice were used as controls. (A) Intracellular staining for inos expression. Plots are gated on CD45+Gr-1+CD11b+ cells showing inos (top panel) or isotype control (bottom panel). (B) Intracellular staining for inos expression. Plots are gated on CD45+CD11b- cells. Representative data are shown, from pooled samples of no less than three mice per group. The data were reproducible in 3 independent experiments, 5 mice/group.
76 59
77 60 Figure 11: Protein nitration in prostate tissue during acute prostate inflammation. Prostate tissue was harvested from naïve control POET-3 mice or from POET-3 mice 6 days after adoptive transfer of pre-activated OT-I cells and immunohistochemical staining for nitrotyrosine residues was performed. (A) Arrow heads point to areas of high nitrotyrosine staining. Boxes indicate the area shown in panel B. Images were taken with the 10X objective. (B) Images were taken with the 20X objective. Arrow heads point to areas of high nitrotyrosine staining. (C) Prostate tissue, no primary antibody. Images taken with 20x objective. All data are representative images, from experiments repeated twice. All images were acquired with the Olympus BX5 microscope.
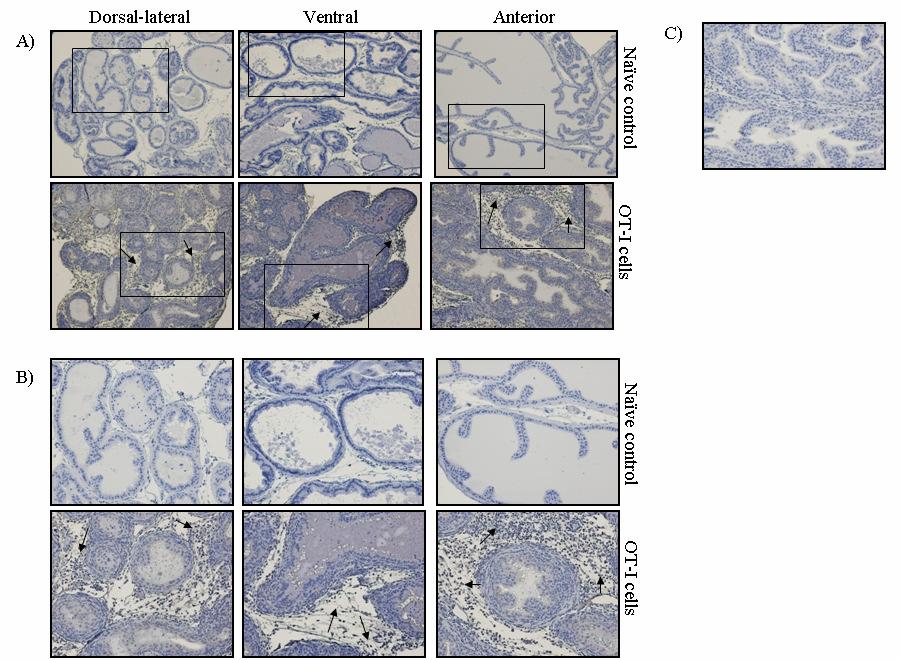
78 61
79 62 Figure 12: Expression of inos and Arg1 are elevated in subsets of CD11b+ cells from the inflammatory site. Prostate and spleen tissues were harvested from POET-3 mice 6 days after adoptive transfer of OT-I cells, spleens from naïve mice served as controls. (A) Cells were stained with antibodies specific for CD45, CD11b, Ly6G and Ly6C. Plots are gated on CD45 + CD11b + cells. (B-D) Subpopulations of CD45 + CD11b + cells were sorted from spleens and prostate tissue and the expression of inos (B) Arg1 (C) or C/EBPβ (D) were evaluated by RT-PCR as described in Materials and Methods. Samples were analyzed in duplicate and data are presented as average values. ND, no detected expression. Data reported for all panels are pooled samples from 5 mice/group and are representative of no less than 3 independent experiments.
80 63
81 64 Figure 13: Gr-1+CD11b+ cells from the inflammatory site have a lower maturation status compared to cells from the spleen. Pre-activated OT-I cells were adoptively transferred into POET-3 mice and 6 days later prostate and spleen tissues were harvested for analysis. Spleens from naïve POET-3 mice were used as controls. Cells were stained for flow cytometry for the indicated antigen. Plots are gated on CD45 + Gr-1 + CD11b + cells. Isotypes are shown as un-shaded histograms and antigen staining is shown as shaded histograms. Data are from pooled samples of 5 mice per group and are representative of no less than 3 independent experiments.
82 65
83 66 Figure 14: Gr-1+CD11b+ cells from inflamed prostates suppress T cell proliferation in vitro. Pre-activated OT-I cells were adoptively transferred into POET-3 mice and 6 days later CD45 + Gr-1 + CD11b + cells from prostate or spleens or from spleens of naïve controls were purified by cell sorting as described in Materials and Methods. Purified CD45 + Gr- 1 + CD11b + cells were placed in culture at varying ratios with naïve Thy1.1 + OT-I cells. After 48 (A) or 72 (B) hours proliferation was measured by examining BrdU incorporation in the Thy1.1 + OT-I cells as described in Materials and Methods. Neutralizing IFN-γ antibody was added to wells at the beginning of culture where indicated. Data are pooled from 2 independent experiments (mean + SD) using 5 mice/group. Quantitative RT-PCR analysis of inos (C) and Arg1 (D) mrna expression in prostate and spleen CD45 + Gr-1 + CD11b + cells prior to being placed in suppression assays (0 hr) and cells sorted from culture wells at the end of the suppression assay (horizontal bar), 1:1 MDSC:OT-I cell ratio. ND, no expression detected. Data are pooled from 5 mice/group and representative of 2 independent experiments.
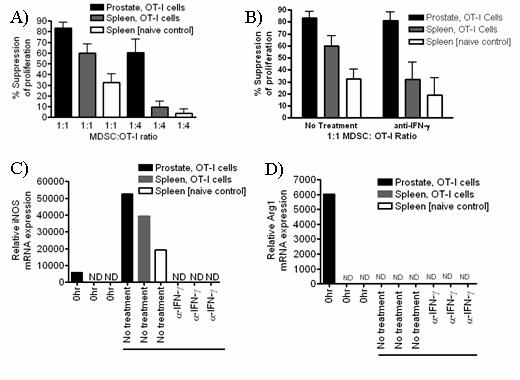
84 67
85 68 Figure 15: Gr-1+CD11b+ cells from the inflammatory site possess immediate capacity to regulate T cell proliferation. Pre-activated OT-I cells were adoptively transferred into POET-3 mice and 6 days later CD45 + Gr-1 + CD11b + cells from prostates and spleens or from spleens of naïve control mice were purified by cell sorting. (A, B, C) CD45 + Gr-1 + CD11b + cells were placed in culture at varying ratios with pre-activated Thy1.1 + OT-I cells and after 12 hours proliferation was measured by examining BrdU incorporation in the Thy1.1 + OT-I cells as described in Materials and Methods. (B) Neutralizing IFN-γ antibody was added to wells at the beginning of culture where indicated. (A, B) Data are pooled from 2 independent experiments (mean + SD) using 5mice/group in each experiment. (C) Quantitative RT-PCR analysis of inos mrna expression in prostate and spleen CD45 + Gr-1 + CD11b + cells prior to being placed in suppression assays (0 hr) and on cells sorted from culture wells at the end of the suppression assay (12 hour culture, horizontal bar) (1:1 MDSC:OT-I cell ratio). Samples were performed in duplicate. ND, no expression detected. Data are reported from a representative experiment that was reproducible in 3 independent experiments. (D) Purified CD45 + Gr-1 + CD11b + cells from prostates were placed in culture (1:2 MDSC:OT-I cell ratio) with pre-activated Thy1.1 + OT-I cells and after 12 hours proliferation was measured by examining BrdU incorporation in the Thy1.1 + OT-I cells as described in Materials and Methods. LNMMA or nor-noha was added at the indicated concentrations at the beginning of the culture. Data were pooled from 5 mice/group and are representative of at least two independent experiments.
86 69
87 70 Figure 16: Gr-1+CD11b+ cells from peripheral tissues lack immunosuppressive activity on antigen activated CD8+ T cells. Pre-activated OT-I cells were adoptively transferred into POET-3 mice and 6 days later prostates, spleens and livers were harvested for analysis. Spleens and livers from naïve POET-3 mice were used as controls. Following tissue harvest, CD45 + Gr-1 + CD11b + cells were sorted from prostates, spleen or liver. (A, B) The expression of Arg1 (A) or inos (B) mrna was evaluated using RT-PCR, samples were performed in duplicate and the value presented is the average value of the replicates from one experiment. (C) Purified CD45 + Gr-1 + CD11b + cells were placed in culture at varying ratios with pre-activated Thy1.1 + OT-I cells and after 12 hours proliferation was measured by examining BrdU incorporation in the Thy1.1 + OT-I cells as described in detail in Materials and methods. All data are representative of two independent experiments.
88 71
89 72 Figure 17: In vivo regulatory function of MDSC is restricted to cells present at the inflammatory site. Pre-activated OT-I cells were injected into POET-3 mice and prostates and spleens were harvested from mice receiving anti-gr-1 or isotype control antibody 6 days later. (A) Cells were re-stimulated with SIINFEKL peptide (5µg/mL) for 5 hours and the number of CD45 + IFN-γ + Thy1.1 + OT-I cells was measured using intracellular staining (mean + SD, n=4). *p<0.05, Students t test. (B, C) The number of CD45 + cells in prostate tissue (B) and the number of CD45 + Thy1.1 + OT-I cells (C) in prostate or spleen tissue of POET-3 mice receiving anti-gr-1 or isotype control antibody injection was examined by flow cytometry. Prostate and spleen tissues were pooled from 4 mice/group. The data are representative of no less than 3 independent experiments.
90 73
91 74 Figure 18: Anti-Gr-1 treatment does not result in loss of CD8+ cells. POET-3 mice were adoptively transferred with OT-I cells on day 0, and received injections of anti-gr-1 (α-gr-1 group) or isotype control antibody (no treatment group) on days 0, 2 and 4. On day 6 peripheral blood was taken and the percentage of CD8 + cells was assessed by flow cytometry. Data are mean ± SD from 5 mice/group. The data were reproducible in 3 independent experiments.
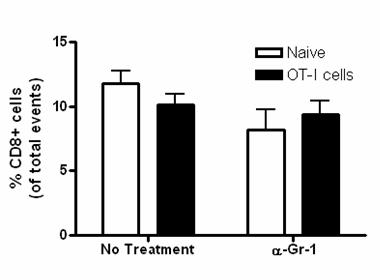
92 75
93 76 CHAPTER III. REGULATION OF IMMUNE RESPONSES DURING PROSTATE CANCER BY MYELOID DERIVED SUPPRESSOR CELLS Abstract Myeloid derived suppressor cells (MDSC) are emerging as important regulators of T cell mediated immune responses during acute inflammation and chronic inflammatory diseases created by the tumor micro-environment. Recently, using a tissue specific acute inflammatory prostatitis model, our laboratory demonstrated that only Gr- 1 + CD11b + cells isolated from the site of an acute inflammatory environment were functional MDSC. Further, these studies demonstrated long term culture of activated T cells with Gr-1 + CD11b + cells from spleens converted precursor cells into functional MDSC. Using two mouse models of prostate cancer, a heterotopic RM-1 tumor model and the spontaneous C57BL/6/Luc/Pten-/- model we now extend these findings to the tumor micro-environment. Thus, similar to an acute inflammatory model, only Gr- 1 + CD11b + cells from the inflammatory environment of a tumor possess immediate capacity to regulate effector T cell function. Introduction MDSC have been identified in heterotopic thymoma, melanoma, mammary and colon cancer models, as well as in spontaneous lung and pancreatic cancer mouse models ( ). However, whether MDSC expand in response to tumor growth and their ability to inhibit anti-tumor immunity remains unknown. Expanded populations of MDSC in tumor bearing hosts have been found the blood, spleen, liver and other peripheral tissue sites as well as in the tumor site (67, 147, 149). However, only recently has the phenotype and function of MDSC in the tumor site been closely compared to those from the peripheral tissues. In vivo studies examining the function of MDSC in tumor bearing mice have clearly demonstrated MDSC promote tumor growth by
94 77 inhibiting anti-tumor immune responses (69, 81, 128, 145). Several studies have demonstrated that removal of MDSC through chemotherapeutic drugs or drug inhibitors of Arg1 and inos increased IFN-γ production from splenic or tumor-draining lymph node (TDLN) CD8 + T cells in response to tumor antigens (81, 145). Further, adoptive transfer of MDSC isolated from spleens of tumor-bearing mice suppressed antigen specific immune responses in the draining lymph node of immunized tumor free hosts, demonstrating MDSC regulate immune responses in vivo (69, 128). However, whether transferred spleen MDSC are capable of suppressing immune responses in the periphery or only acquire suppressive function once they reach draining lymph nodes is not clear. Recently Gabrilovich and colleagues demonstrated that the MDSC from the spleen and tumor site while sharing a similar phenotype were functionally distinct (147). MDSC from the spleen exerted antigen specific inhibition of CD8 + T cell function using ROS, whereas MDSC from the tumor site could inhibit both antigen specific and antigen non-specific inhibition through Arg1 and inos (147). These data demonstrate functional differences exist between MDSC from peripheral tissues such as the spleen and those from the tumor site using standard in vitro suppression assays. However, given our data demonstrating that standard in vitro suppression assays can convert precursor MDSC into functional cells, it remains unknown if MDSC from the spleen or tumor site possess the immediate capacity to regulate T cell responses in vitro. To characterize the suppressive capacity of MDSC from spleens and prostate tumors of prostate tumor-bearing mice, we used the heterotopic RM-1 tumor model and the C57/Luc/Pten -/- spontaneous prostate tumor mouse model. Herein we demonstrate that during prostate tumor growth MDSC inhibit T cell responses and that only MDSC from the tumor site possess the immediate capacity to inhibit T cell proliferation in vitro.
95 78 Materials and Methods Mice and in vivo experiments Male C57BL/6 mice were obtained from the Transgenic Mouse Facility at Purdue University. For RM-1 tumor studies, 5X10 5 RM-1 cells were injected s.c. on the flank area. Mice were sacrificed when tumor sizes reached 20 mm in diameter. Measurements were performed with a caliper by measuring the largest diameter and its perpendicular length. C57/Luc/Pten -/- mice were generated by obtaining B6.Cg-Tg(Pbsn-cre)4Prb (Pb- Cre4 + ) mice from the NIH Mouse Models of Human Cancer Consortium and C;129S4- Ptentm1Hwu/J (Pten fl/fl ) mice from Jackson laboratories. FVB.129S6 (B6)-Gt (ROSA)26Sortm1(Luc)Kael/J (ROSA26-LSL-Luc) mice were a kind gift from Dr. William Kaelin (Dana-Farber Cancer Institute). Mice were intercrossed to combine alleles and backcrossed to C57BL/6J-Tyrc-2J/J (Jackson Labs) for 7 generations to generate C57/Luc/Pten -/- mice. To obtain POET 3/Luc/Pten +/- mice, C57/Luc/Pten -/- mice were crossed to POET 3 mice. All animals used were male mice between 8-12 weeks of age. All protocols for the reported animal studies were approved by The Lab Animal Program at Purdue University or the University of Iowa. Flow cytometry Single cell suspensions were incubated with TruStain FcX antibody (BioLegend) then stained with directly conjugated antibodies (ebioscience; BioLegend) according to manufacturer instructions. Flow-cytometric analysis was performed on a FACS Canto (BD Biosciences) and data were analyzed using FlowJo software (Tree Star). Isolation of leukocytes Leukocytes were isolated from spleens by grinding between frosted microscope slides in PBS. Red blood cells were lysed with ACK buffer and passed through a 70 µm filter. Leukocytes were isolated from prostate tumor tissue by placing tissue in a solution
96 79 of 2 µg/ml Collagenase D (Roche Diagnostics) in RPMI containing 10% FBS. Tissue was minced and placed at 37 C for 1 hr for digestion followed by passing through a 70 µm filter. Red blood cells were lysed with ACK, washed and the remaining leukocyte pellet was stained for FACS. Histology and Immunohistochemistry Prostate lobes were dissected and placed in 10% neutral buffered formalin for histology and processed for hematoxylin and eosin staining. Arg1 assay For analysis of Arg1 enzyme function, CD45 + Gr-1 + CD11b + cells from freshly isolated tissues were sorted and re-suspended at a concentration of 1X10 7 per ml in lysis buffer. The level of Arg1 activity was assessed in supernatants of cell lysates according to manufacturer instructions (BioAssay Systems). Units per liter are defined as 1 unit of Arg1 able to convert 1 µm of L-arginine to ornithine and urea per minute at ph 9.5 and 37 C. Detection of inos For detection of inos protein by flow cytometry, an intracellular staining kit was used according to manufacturer instructions (BD Biosciences) using FITC mouse antiinos (BD Biosciences) or FITC mouse IgG2a isotype control (BioLegend) at a 1:100 dilution. Quantitative real-time PCR Total RNA was prepared from FACS sorted CD45 + Gr-1 + CD11b + cells using the RNAeasy kit (Qiagen). cdna was synthesized using qscript flex cdna synthesis kit (Quanta Biosciences). Quantitative RT-PCR was carried out using TaqMan primer and probe sets for mouse Arg1, inos, and 18s rrna (Applied Biosystems). Relative mrna expression = 2 (Ct of gene Ct of 18s rrna), where Ct is the threshold cycle value.
97 80 Data were normalized to 18s RNA and are representative of three independent experiments. 72 hour T cell suppression assay CD45 + Gr-1 + CD11b + cells were pooled from 5 mice per group and sorted from tissues using the icyte Reflection (icyte) cell sorter. Thy1.1 + OT-I spleen cells were added at 1X10 5 cells per well in the presence of SIINFEKL peptide (1µg/mL). After 48hr, BrdU (BD Biosciences) was added to monitor proliferation. At 72hr, the percentage of BrdU + Thy1.1 + cells was analyzed by flow cytometry. Where indicated neutralizing IFN-γ antibody, LNMMA or nor-noha were added at the beginning of culture (10µg/mL, clone H22; R&D systems). The percentage suppression of proliferation is calculated as (1- proliferation with MDSC proliferation without MDSC) X 100. Where neutralizing IFN-γ antibody is used the percentage suppression of proliferation with is calculated as (1- proliferation with MDSC with inhibitor proliferation without MDSC with inhibitor ) X 100. Effector T cell suppression assay CD45 + Gr-1 + CD11b + cells were pooled from 5 mice per group and sorted from tissues using the icyte Reflection (icyte) cell sorter. OT-I cells were pre-activated for hours with SIINFEKL (1µg/mL), purified by Fico/Lite gradient and added at 1X10 5 cells per well in the presence of SIINFEKL peptide (1mg/mL). BrdU was added directly to culture wells and cells were harvested for analysis after 12 hours. To evaluate proliferation, the percentage of BrdU + Thy1.1 + cells was analyzed by flow cytometry. Where indicated neutralizing IFN-γ antibody, LNMMA or nor-noha were added at the beginning of culture (10µg/mL, clone H22; R&D systems). The percentage suppression of proliferation is calculated as (1- proliferation with MDSC proliferation without MDSC) X 100. Where neutralizing IFN-γ antibody is used the percentage suppression of proliferation with is calculated as (1- proliferation with MDSC with inhibitor proliferation without MDSC with inhibitor) X 100.
98 81 Results Arg1 and inos are elevated in Gr-1 + CD11b + cells from RM-1 prostate tumors Previous studies using the POET-3 model demonstrated that the function of MDSC was restricted to the inflammatory site during acute prostatitis. However, it remained possible that this phenomenon was restricted to acute tissue specific diseases and would not pertain to inflammatory conditions where systemic cytokines produced by chronic infections or tumors are present. To determine if the regulatory function of MDSC was also restricted to the tumor site we used the transplantable RM-1 prostate tumor model (150). RM-1 tumors expanded the percentage of Gr-1 + CD11b + cells in the spleens of tumor-bearing mice and recruited them to the tumor site (Fig. 19A, B). Further phenotype analysis by flow cytometry demonstrated that Ly6C - Ly6G + cells predominated in both the tumors site and spleen of tumor-bearing and naïve controls (Fig. 19C). In both Gr-1 + CD11b + cells isolated from the spleen and tumor site of tumor-bearing mice, Arg1 mrna was detected; however, the level of expression was much higher in Gr-1 + CD11b + cells from the tumor site (825 vs 167,464 relative mrna expression, respectively) (Fig 20A). No Arg1 mrna was detected in the spleens of naïve tumor-free mice (Fig. 20A). inos mrna was only detected in Gr-1 + CD11b + cells from the tumor site (Fig. 20A). To determine if these data correlate with protein expression Arg1 enzyme activity and inos protein expression were evaluated in Gr-1 + CD11b + cells from the tumor site compared to cells from spleens of tumor-bearing or tumor-free mice. inos protein expression was detected only in Gr-1 + CD11b + cells present at the tumor site (Fig. 20B). Gr-1 + CD11b + cells from the tumor site had elevated levels of Arg1 enzyme activity, whereas cells from spleens of naïve or tumor-bearing mice had only trace activity (Fig. 20C). Thus, Gr- 1 + CD11b + cells present in RM-1 prostate tumors express elevated Arg1 and inos enzyme levels.
99 82 Gr-1 + CD11b + cells from RM-1 prostate tumors regulate antigen specific T cell proliferation Because Arg1 and inos were elevated in MDSC from the tumor site, we next investigated if Gr-1 + CD11b + cells from the spleen or tumor site from prostate tumorbearing mice were able to suppress antigen specific CD8 + T cell proliferation. Even at a 1:4 MDSC:OT-I cell ratio, cells from both the tumor site and spleen of tumor-bearing and naïve mice were strongly suppressive in conventional suppressor cell assays, although MDSC isolated from the tumor site were more potent suppressors (Fig. 21A). MDSC from the tumor site were partially dependent upon IFN-γ for suppressive function, whereas cells from the spleen of tumor-bearing mice were completely dependent upon IFN-γ (Fig. 21A). The partial dependence of MDSC from the tumor site on IFN-γ for suppressive function may be explained by the high levels of Arg1 present in freshly isolated cells (Fig. 20). Because the suppressive activity of splenic MDSC was significantly reduced by neutralizing IFN-γ, we next asked if inos was induced in these cells during the suppression assay. Indeed, inos mrna was induced in Gr-1 + CD11b + cells from the spleen of tumor-bearing mice, and was increased in cells from the tumor site, in an IFN-γ dependent manner (Fig. 21B). Arg1 mrna was not detectable in cells recovered from suppression assays (Fig. 21C). Thus, these data confirm that Gr- 1 + CD11b + cells expanded during RM-1 tumor growth are functional MDSC. Gr-1 + CD11b + cells from the tumor site possess immediate capacity to regulate T cell proliferation To compare the immediate suppressive capacity of Gr-1 + CD11b + cells isolated from the tumor site or spleen of tumor-bearing mice, the suppressive function during short term suppression assays was evaluated. Only MDSC from the tumor site were able to suppress proliferation of pre-activated CD8 + T cells, and this inhibition was partially dependent upon IFN-γ (Fig. 22). The partial inhibition of suppression is not a result of
100 83 incomplete neutralization of IFN-γ because the concentration used in these studies is sufficient to abrogate any detectible IFN-γ in the supernatant of in vitro stimulated OT-I cells (data not shown). These data demonstrate that in the tumor setting, the ability of freshly isolated MDSC to inhibit effector T cell function is restricted to cells present at the tumor site. Gr-1 + CD11b + cells expand in prostates of aged POET-3/Luc/Pten +/- mice To study the role of MDSC during primary prostate tumor growth, we crossed POET-3 mice with a genetically susceptibility prostate cancer model, the C57BL/6/Luc/Pten -/- mouse model (Fig. 23). The C57BL/6/Luc/Pten -/- mouse model expresses a conditional floxed Pten allele, for tissue-specific disruption of Pten; a conditional floxed allele for luciferase expression; a transgene specifically expressing Cre recombinase in the prostatic epithelium. In this model, Cre recombinase activity simultaneously activates Pten disruption and luciferase expression in the prostate epithelium. Aged POET-3/Luc/Pten +/- mice developed low levels of spontaneous inflammation, especially in the dorsolateral prostate, as measured by histology and increased infiltration of leukocytes (Fig. 24 (top panel), Fig. 25). Further, the adoptive transfer of pre-activated OT-I cells into aged POET-3/Luc/Pten +/- mice resulted in enhanced inflammation and leukocyte recruitment into all lobes of the prostate (Fig. 24 (bottom panel), Fig. 25). Among the infiltrating CD45 + cells, Gr-1 + CD11b + cells were expanded predominately in the dorsal prostate of aged naïve mice (Fig. 26, top panels). OT-I treated mice had higher percentages of Gr-1 + CD11b + cells in all lobes of the prostate, and levels were similar between aged and young mice (Fig. 26). These data demonstrate that Gr-1 + CD11b + cells are expanded by induction of acute prostatitis in
101 84 POET-3/Luc/Pten +/- mice and spontaneously accumulate in the prostates of aged naïve POET-3/Luc/Pten +/- mice. POET-3/Luc/Pten +/- mice develop chronic prostate inflammation resulting in alterations to the prostate epithelium POET-3/Luc/Pten +/- mice are genetically susceptible to developing prostate cancer as a result of loss of one Pten allele. Therefore, we next asked if induction of chronic prostate inflammation in POET-3/Luc/Pten +/- mice would result in lasting changes to the prostate epithelium. Thirty days after adoptive transfer of OT-I cells into aged POET-3/Luc/Pten +/- mice, hyperplastic acini characterized by a proliferative epithelium with apoptotic cells (arrows) and a reduced lumen were found in prostate tissue (Fig. 27). These data demonstrate chronic inflammation can be induced in POET- 3/Luc/Pten +/- mice, and resulted in alterations in the prostate epithelium. Gr-1 + CD11b + cells accumulate in prostates of C57BL/6/Luc/Pten -/- mice Data from POET-3/Luc/Pten -/+ mice demonstrated that expanded populations of Gr-1 + CD11b + cells were found in prostate tissue. However, overall numbers of Gr- 1 + CD11b + cells were relatively low in naïve aged POET-3/Luc/Pten -/+ mice. Therefore, to determine if Gr-1 + CD11b + cells from primary prostate tumors were functional MDSC, we used C57BL/6/Luc/Pten-/- mice, which develop a more aggressive disease than Pten- /+ mice (Svensson and Henry, Submitted 2010). C57BL/6/Luc/Pten-/- mice showed signs of prostate inflammation in all lobes of the prostate characterized by elevated numbers of CD45 + (Fig. 28A) and CD45 + Gr-1 + CD11b + (Fig. 28 B,C) cells. Surprisingly, Gr-1 + CD11b + cells represented an overwhelming majority of the total CD45 + cells in all lobes of the prostate in Pten-/- mice (Fig. 28C). The number of Gr-1 + CD11b + cells in the spleen of Pten-/- mice was not significantly different compared to Pten+/+ wild type controls (Fig. 28D).
102 85 Gr-1 + CD11b + cells from prostates of C57BL/6/Luc/Pten -/- mice possess the immediate regulatory capacity To determine if Gr-1 + CD11b + cells were functional MDSC, we first examined the levels of Arg1 and inos mrna in cells from prostates and spleens of C57BL/6/Luc/Pten-/- mice. Arg1 and inos were expressed in Gr-1 + CD11b + cells isolated from dorsal, anterior and ventral prostate lobes, with the ventral prostate having the highest levels of Arg1 (Fig. 29A). In contrast, no Arg1 or inos was detected in Gr-1 + CD11b + cells isolated from spleens (Fig. 29A). These data suggested that only Gr-1 + CD11b + cells from prostates of C57BL/6/Luc/Pten-/- mice were functional suppressor cells and to confirm this we tested their inhibitory activity using short term in vitro suppression assays. Gr-1 + CD11b + cells from prostates of C57BL/6/Luc/Pten-/- mice strongly suppressed effector T cell proliferation and were more potent suppressors compared to cells from the spleen of C57BL/6/Luc/Pten-/- or control mice (Fig. 29B). Interestingly, in this model MDSC isolated from spleens of C57BL/6/Luc/Pten-/- or control mice were able to suppress proliferation, albeit at much lower levels than those from the tumor site (Fig. 29B). These data suggest that spontaneous tumor growth may provide an advantage to Gr-1 + CD11b + cells in peripheral tissues, allowing for a more rapid induction of suppressive Arg1 or inos upon receiving appropriate activation signals. Further, the data demonstrate that in a spontaneous model of prostate cancer, MDSC from the tumor site possess the immediate capacity to inhibit T cell proliferation. Discussion MDSC are emerging as important regulators of anti-tumor immunity and are defined by their functional status. However, even though it is known that MDSC can be activated by cytokines produced by T cells, standard assays evaluating MDSC function involve long term co-culture with activated T cells. Using both a heterotopic and spontaneous prostate tumor models, we now demonstrate that Gr-1 + CD11b + cells from
103 86 the tumor site are functional MDSC. One interesting difference between the two prostate cancer models used in our studies was that in contrast to the RM-1 model, spleen MDSC from Pten-/- mice were able to inhibit T cell proliferation, albeit at a low level. It is possible that the inflammatory environment established by spontaneous tumor growth is better able to prime spleen MDSC for activation once they receive appropriate stimuli. However, the relative suppressive strength of spleen Gr-1 + CD11b + cells in these two models can not be compared directly without running these assays simultaneously. Regardless, data from the RM-1 tumor model support earlier studies in our laboratory demonstrating that standard suppression assays convert pre-cursor Gr-1 + CD11b + cells into functional MDSC through IFN-γ induction of inos. In agreement with the data presented herein, several studies have demonstrated functional differences among populations of MDSC isolated from different anatomical locations in tumor-bearing mice (83, 121, 147). In support of our findings that Arg1 and inos are up-regulated in MDSC from prostate tumors, Sawanobori et al demonstrated freshly isolated MDSC from the tumor site express inos and Arg1 mrna. However, the ability to suppress T cell proliferation was not measured (83). Likewise, Kusmartsev and Gabrilovich showed Arg1 and inos expression, and immunosuppressive function were restricted to F4/80 + TAM isolated from the tumor site; however, the investigators did not address the function of Gr-1 + CD11b + MDSC (121). Using standard in vitro suppression assays, Gr-1 + CD11b + cells from both the spleen and tumor site were able to inhibit T cell activation; however, cells from the tumor site were more potent suppressors in both models of prostate cancer. Recently, Gabrilovich and colleagues demonstrated a mechanism behind the differential function of MDSC present in the spleen and tumor site (147). Splenic MDSC were able to inhibit only antigen-specific T cell proliferation and expressed elevated NADPH and ROS; MDSC from the tumor site suppressed antigen-specific and nonspecific T cell proliferation via Arg1 and inos expression (147). Importantly, in these
104 87 studies, the suppressive function was measured using standard suppression assays. Thus, the differential function of MDSC from the spleen and tumor site may represent a differential response to exposure to activated T cells and not a true biologic difference. In contrast to our data, other studies comparing the function of Gr-1 + CD11b + cells from spleen, bone marrow and blood of tumor-bearing mice found no functional difference in their ability to suppress CD4 + or CD8 + T cell activation (151). Importantly, studies by other investigators use 48 or 72hr cultures to evaluate suppressive function of MDSC. Herein we describe a novel 12hr suppression assay to evaluate MDSC function. Therefore, these conflicting results may be explained by the activation status of the responder T cells used or the differences in the length of co-culture as it is well know that activated T cells can induce regulatory potential in MDSC. With the goal of examining the function of MDSC in a spontaneous prostate cancer model, we generated the POET-3/Luc/Pten +/- mouse model. Aged POET- 3/Luc/Pten +/- mice developed low levels of spontaneous prostate inflammation characterized by accumulation of Gr-1 + CD11b + cells. The adoptive transfer of preactivated OT-I cells resulted in increased inflammatory cell recruitment (CD45 + and Gr- 1 + CD11b + cells) and enhanced fibrosis in aged POET-3/Luc/Pten +/- mice, demonstrating that similar to the POET-3 model, acute prostatitis can be induced in these mice. The presence of CD45 + Gr-1 + CD11b + cells in prostates of POET-3/Luc/Pten +/- mice suggests these cells may play a role in development or progression of prostate cancer in part by dampening anti-tumor immunity. Data generated from the C57BL/6/Luc/Pten -/- model support the hypothesis that CD45 + Gr-1 + CD11b + cells in prostates of POET-3/Luc/Pten +/- are functionally suppressive; however, future studies using MDSC from prostates of POET-3/Luc/Pten +/- mice are necessary to directly test this hypothesis. Chronic inflammation could be established in POET-3/Luc/Pten +/- mice by a single injection of pre-activated OT-I cells, and preliminary data demonstrate this resulted in histological changes associated with hyperplasia. Future studies examining the
105 88 impact of adoptively transferring OT-I cells into POET-3/Luc/Pten-/- mice are necessary to determine the role of chronic prostate inflammation on the more aggressive Pten-/- background. C57BL/6/Luc/Pten -/- mice develop significant levels of spontaneous prostate inflammation in all lobes of the prostate by 4 months. We were surprised to find that this inflammation was strongly dominated by the presence of Gr-1 + CD11b + cells. To extend these findings to the POET-3 system, future studies comparing the level of spontaneous inflammation in age matched POET-3/Luc/Pten-/- versus POET-3/Luc/Pten +/- mice are necessary. One may speculate that inflammation will be higher in POET-3/Luc/Pten-/- mice compared to POET-3 mice heterozygous for Pten based on data generated from the C57BL/6/Luc/Pten -/- model. The POET-3/Luc/Pten -/+ model is clinically relevant to human prostate cancer, as alterations in PTEN expression are implicated in the development of human prostate cancer ( ). C57BL/6/Luc/Pten -/+ mice slowly develop focal murine prostate intraepithelial neoplasia (mpin) and do not progress to fulminate prostate cancer (manuscript submitted). This slow progression of disease makes for an ideal background on which to determine whether inflammation can accelerate progression of prostate cancer. These data provide a strong foundation for use of the POET-3/Luc/Pten-/+ mice in future studies exploring the impact of chronic prostate inflammation on the development of prostate cancer.
106 89 Figure 19: RM-1 prostate tumors expand Gr-1+CD11b+ cells in the spleen and tumor site. Spleen and tumor tissue were harvested from C57BL/6 mice bearing RM-1 prostate tumors, spleens from naïve mice were used as controls. (A) The percentage of CD45 + cells per total events (top pane, gated on forward/side scatter) and CD45 + Gr-1 + CD11b + cells among the total CD45 + cells (bottom panel, gated on CD45 + events) in tumor and spleen tissue was determined by flow cytometry as described in Materials and Methods. Data are pooled from 5 tumors or spleens and are representative of 3 independent experiments. (B) The percentage of CD45 + Gr-1 + CD11b + cells in tumor and spleen tissue of tumor-bearing mice and in the spleen of naïve control mice was determined by flow cytometry. Plots are gated on CD45 + events. Data are representative of no less than 3 independent experiments (mean + SD). The Student s t test p-value is reported, **p<.01. (C) The percentage of CD11b + cells among the total CD45 + cells (left panel) and the percentage of Ly6G and Ly6C cells (right panel) in tumor and spleen tissue was determined by flow cytometry. Plots are gated on CD45 + cells. Data are from pooled samples of 3 mice/group and are representative of 3 independent experiments.
107 90
108 91 Figure 20: Agr1 and inos are elevated in Gr-1+CD11b+ cells from RM-1 prostate tumors. Spleen and tumor tissue were harvested from C57BL/6 mice bearing RM-1 prostate tumors, spleens from naïve C57BL/6 mice were used as controls. (A) Arg1 and inos mrna expression was measured by quantitative RT-PCR analysis in freshly isolated CD45 + Gr-1 + CD11b + cells. Samples were performed in duplicate and the data presented are the average value. ND, no detected expression. (B) Intracellular staining for inos expression. Plots are gated on CD45 + Gr-1 + CD11b + cells showing inos (left panel) or isotype control (right panel). (C) Arg1 activity in freshly isolated CD45 + Gr-1 + CD11b + cells was measured in duplicates as described in Materials and Methods (mean + S.D.). All experiments were performed at least twice from pooled samples of no less than 3 mice per group.
109 92
110 93 Figure 21: Gr-1+CD11b+ cells isolated from RM-1 prostate tumors regulate T cell proliferation. Spleen and tumor tissue were harvested from C57BL/6 mice bearing RM-1 prostate tumors, spleens from naïve C57BL/6 mice were used as controls. CD45 + Gr-1 + CD11b + cells from the tumor site and spleen or from spleens of naïve control mice were purified by cell sorting. Tumor and spleen cells were pooled from 5 mice/group. (A) Purified CD45 + Gr-1 + CD11b + cells were placed in culture with naïve Thy1.1 + OT-I cells and after 72 hours proliferation was measured by examining BrdU incorporation in the Thy1.1 + OT-I cells as described in detail in materials and methods. Neutralizing IFN-γ antibody was added to wells at the beginning of culture where indicated. Data reported are a representative experiment from 2 independent studies. (B, C) inos (B) and Arg1 (C) mrna expression were evaluated by RT-PCR in cells that were freshly isolated (0hr) or in cells recovered after 72 hour culture (horizontal bar) with Thy1.1 + OT-I cells in the presence of SIINFEKL peptide (1µg/ml, 1:1 ratio). Neutralizing IFN-γ antibody was added to wells at the beginning of culture where indicated. All experiments were repeated twice, and the values presented are from one representative experiment.
111 94
112 95 Figure 22: Gr-1+CD11b+ cells isolated from RM-1 prostate tumors possess immediate regulatory capacity. Spleen and tumor tissue were harvested from C57BL/6 mice bearing RM-1 prostate tumors, spleens from naïve C57BL/6 mice were used as controls. CD45 + Gr-1 + CD11b + cells from the tumor site and spleen or from spleens of naïve control mice were purified by cell sorting. Tumor and spleen cells were pooled from 5 mice/group. Purified CD45 + Gr-1 + CD11b + cells were placed in culture with pre-activated Thy1.1 + OT-I cells and after 12 hours proliferation was measured by examining BrdU incorporation in the Thy1.1 + OT-I cells as described in Materials and Methods. Neutralizing IFN-γ antibody was added to wells at the beginning of culture where indicated. All experiments were repeated twice, and the values presented are from one representative experiment.
113 96
114 97 Figure 23: Generation of C57BL/6/Luc/Pten-/- and POET-3/Luc/Pten-/+ mice. C57BL/6/Luc/Pten-/- mice were generated as described in Materials and Methods. Briefly, Pten fl/fl, R26-LSL fl/fl and Pb-Cre4 mice were backcrossed onto the albino C57BL/6 background for 6 generations to reduce bioluminescence signal attenuation from pigment in the parental coat color. A conditional floxed (fl) Pten allele provides for tissue-specific disruption of Pten; a conditional floxed allele for luciferase expression; a transgene specifically expressing Cre recombinase in the prostatic epithelium. The resulting C57BL/6/Luc/Pten-/- mice express Cre only in the prostatic epithelium where it simultaneously inactivates Pten and activates luciferase expression. In this animal, prostate cancer is initiated by Pten deletion and can be monitored by bioluminescence imaging.
115 Image courtesy of Dr. Michael Henry 98
116 99 Figure 24: Aged POET-3/Luc/Pten-/+ mice develop spontaneous prostate inflammation which worsens with adoptive transfer of OT-I cells. Pre-activated OT-I cells were adoptively transferred into 7 month old POET-3/Luc/Pten- /+ mice and after 7 days prostate tissue was harvested for histology. Images were taken with the 20x objective and are representative images of H&E stained prostate tissue from naïve mice (top panels) or from mice receiving OT-I cells (bottom panels).
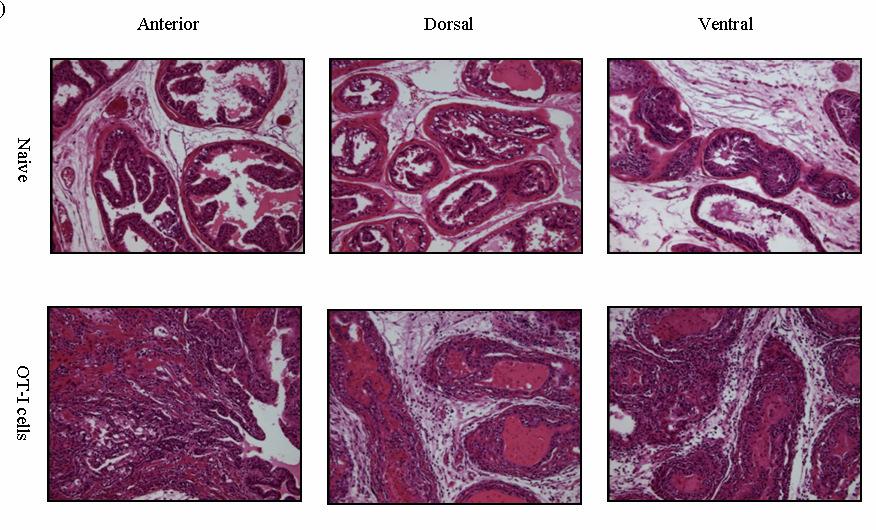
117 100
118 101 Figure 25: Prostate inflammation in POET-3/Luc/Pten -/+ mice after adoptive transfer of OT-I cells. Pre-activated OT-I cells were adoptively transferred into 7 month or 2 month old POET- 3/Luc/Pten -/+ mice and after 7 days prostates were harvested for analysis by flow cytometry. Representative flow cytometry plots showing the percentage of CD45 + cells among the total events are shown.
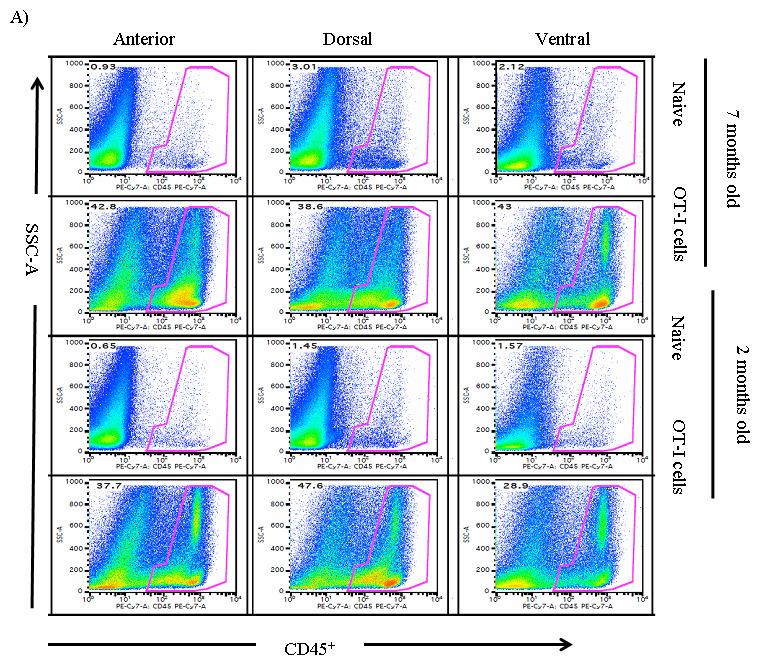
119 102
120 103 Figure 26: Gr-1+CD11b+ cells accumulate in the prostates of POET-3/Luc/Pten -/+ mice. Pre-activated OT-I cells were adoptively transferred into 7 month or 2 month old POET- 3/Luc/Pten -/+ mice and after 7 days prostates were harvested for analysis by flow cytometry. Representative flow cytometry plots showing the percentage of Gr-1 + CD11b + cells among the total CD45 + events are shown.
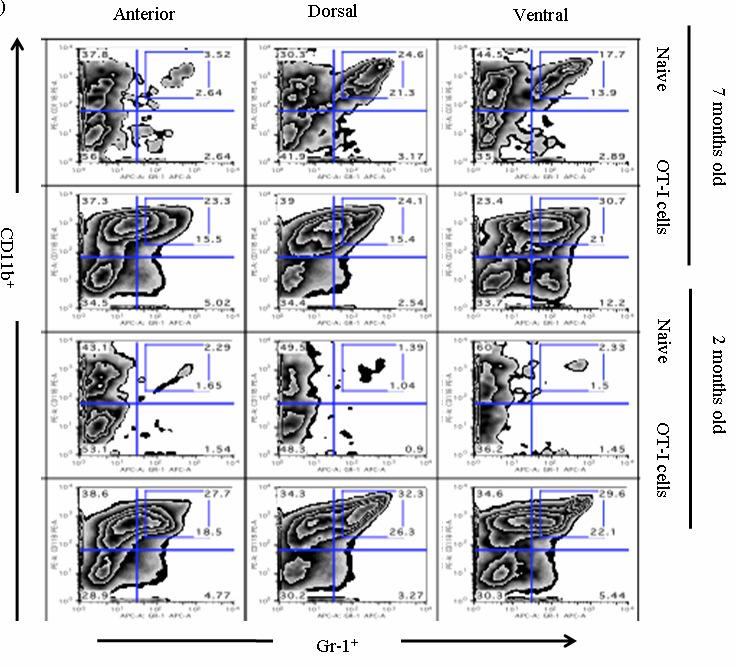
121 104
122 105 Figure 27: Alterations in the prostate epithelium during chronic prostate inflammation in POET-3/Luc/Pten-/+ mice. Pre-activated OT-I cells were adoptively transferred into 7 month old POET-3/Luc/Pten- /+ mice and after 30 days prostate tissue was harvested for histology. Images were taken with the 20x objective and are representative images of H&E stained prostate tissue from naïve mice (left panel) or from mice receiving OT-I cells (right panel). Representative histological changes as demonstrated by proliferative lesions characterized by giant cells (arrows) and cellular atypia in naive POET-3/Luc/ Pten -/+ mice (left panel), and by hyperplastic acini with proliferating epithelium characterized by increased apoptotic cells (arrows) and decreased lumen in POET-3/Luc/ Pten -/+ mice receiving OT-I cells (right panel).
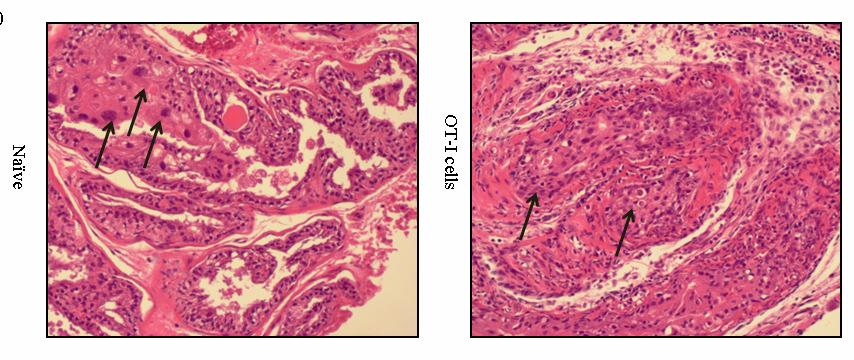
123 106
124 107 Figure 28: Gr-1+CD11b+ cells accumulate in prostates of C57BL/6/Luc/Pten -/- mice. Prostate and spleen tissues were harvested from 4 month old Ptenwt/wt mice or Pten-/ - mice (Ptenfl/ fl ). The numbers of infiltrating CD45 + cells (A) or CD45 + Gr-1 + CD11b + cells (B) or the percentage of Gr-1 + CD11b + cells of the total CD45 + population (C) in prostate tissue and the numbers of CD45 + Gr-1 + CD11b + cells spleen tissue (D) were assessed using flow cytometry. All experiments were done using 4 mice/group and were repeated 2 independent times.
125 108
126 109 Figure 29: Gr-1+CD11b+ cells from the prostates of C57BL/6/Luc/Pten -/- mice are functional MDSC. (A) Spleens and Prostate lobes were harvested from 4 month old Pten-/ - mice. Gr- 1 + CD11b + cells were isolated from tissues using flow cell sorting. Arg1 and inos mrna expression was measured by quantitative RT-PCR analysis in freshly isolated CD45 + Gr-1 + CD11b + cells. Samples were performed in duplicate and the data presented are the average value. ND, no detected expression. (B) Spleen tissues were harvested from 4 month old control (wt/wt) mice or Pten-/ - mice. Prostate tissues were harvested Pten-/ - mice. Gr-1 + CD11b + cells were isolated from tissues using flow cell sorting. Purified CD45 + Gr-1 + CD11b + cells were placed in culture with pre-activated Thy1.1 + OT- I cells and after 12 hours proliferation was measured by examining BrdU incorporation in the Thy1.1 + OT-I cells as described in Materials and Methods.
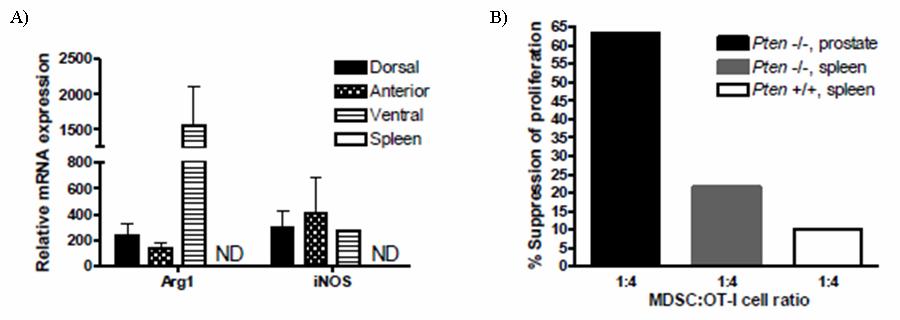
127 110
128 111 CHAPTER IV. THE ROLE OF VITAMIN D IN MYELOID-DERIVED SUPPRESSOR CELL FUNCTION ABSTRACT Tumor resident myeloid derived suppressor cells (MDSC) are functionally able to inhibit T cell proliferation. In contrast, MDSC from the spleen of tumor-bearing mice are not able to inhibit T cell proliferation without additional inflammatory stimuli. While the function of tumor and spleen resident MDSC is dramatically different, there is currently no specific marker to distinguish the two populations. We hypothesized that using gene array analysis, genes specific for functional MDSC could be identified. To test this hypothesis, RM-1 tumor cells were grown in the peritoneal cavity. MDSC from the peritoneal cavity were used as cells from the tumor site, cells from the spleen were used as spleen samples. Further, given an increasing interest in subsets of MDSC (monocytic vs. granulocytic), Ly6G + and Ly6C + populations were submitted for analysis. Samples from both peritoneal cavity (tumor site) and spleen were submitted for affymetrix gene arrays (Mouse Gene 1.0 ST) to identify genes specifically up regulated in cells from the tumor site relative to the spleen. Initial analysis revealed over 150 genes were increased by 5 or more fold in the tumor site versus spleen and almost 20 genes were increased by 20 or more fold. Among the top 25 genes up-regulated, Arg1 was over-expressed by 128 fold, inos (NOS2) by 32 fold, and the vitamin D receptor (VDR) by 25 fold. Introduction Our earlier observation that only Gr-1 + CD11b + cells isolated from the tumor microenvironment are functional MDSC is a unique observation. Given this finding, we hypothesized that gene array analysis would allow us to identify genes associated only with functional MDSC and not with precursor cells. Previous attempts using microarray analysis to identify MDSC related genes have compared gene expression profiles in
129 112 CD11b + cells from the spleen of normal and tumor-bearing mice (71). This study by Gallina and Bronte compared freshly isolated cells and cells collected after a 24hr culture. In freshly isolated cells, Bronte and colleagues identified that genes associated with an inflammatory granulocyte population and an alternatively activated macrophage signature were increased in CD11b + cells from spleens of tumor-bearing mice relative to controls (71). However, only when spleen cells from naïve or tumor bearing mice were cultured in vitro were Arg1 and inos elevated in array analysis (71). Given our work demonstrating the functional differences in the Gr-1 + CD11b + cells in the tumor site and spleen of tumor-bearing mice we designed comparative microarray studies with the aim of identify genes that are differentially expressed in spleen versus tumor resident Gr- 1 + CD11b + cells. The initial analysis revealed that over 150 genes were increased by 5 or more fold in the tumor site versus spleen and almost 20 genes were increased by 20 or more fold. Among the top 25 genes up-regulated in the tumor site relative to the spleen were several chemokines, Arg1, inos, the vitamin D receptor (VDR), secreted phosphoprotein 1 (SPP1). Materials and Methods Mice and in vivo experiments Male C57BL/6 mice were obtained from the Transgenic Mouse Facility at Purdue University. For RM-1 tumor studies, 5X10 5 RM-1 cells were injected i.p.. Mice were sacrificed after days. All animals used were male mice between 8-12 weeks of age. All protocols for the reported animal studies were approved by The Lab Animal Program at Purdue University. Isolation of leukocytes and flow cytometry Leukocytes were isolated from spleens by grinding spleens between frosted microscope slides in PBS. Peritoneal lavage was obtained by flushing the peritoneal
130 113 cavity with 10 ml sterile saline. Red blood cells were lysed with ACK buffer and passed through a 70 µm filter. Single cell suspensions were then incubated with TruStain FcX antibody (BioLegend) and stained with directly conjugated antibodies (ebioscience; BioLegend) according to manufacturer instructions. Flow-cytometric analysis was performed on a FACS Canto (BD Biosciences) and data were analyzed using FlowJo software (Tree Star). Isolation of RNA and cdna and quantitative real-time PCR Total RNA was prepared from FACS sorted cells using the RNAeasy kit (Qiagen). cdna was synthesized using qscript flex cdna synthesis kit (Quanta Biosciences). Quantitative RT-PCR was carried out using TaqMan primer and probe sets for mouse Arg1, inos, C/EBPβ and 18s rrna (Applied Biosystems). Relative mrna expression = 2 (Ct of gene Ct of 18s rrna), where Ct is the threshold cycle value. Data were normalized to 18s RNA and are representative of three independent experiments. Microarray analysis and statistical analysis C57BL/6 mice were injected ip with RM-1 cells. After 14 days peritoneal lavage and spleens were collected after which the cells were stained for CD45, CD11b, Ly6C and Ly6G and sorted. From the spleens CD45 + CD11b + Ly6C + Ly6G + and Ly6G - cells were sorted. From the peritoneal cavity CD45 + CD11b + Ly6C + Ly6G high, Ly6G low and Ly6G mid cells were sorted. RNA was immediately isolated from sorted cells and affymetrix gene arrays (Mouse Gene 1.0 ST) were performed by the Center for Medical Genomics at Indiana University School of Medicine. Statistical analysis was performed by the Center for Medical Genomics at Indiana University School of Medicine. Data presented are comparative analysis of genes over-expressed and under-expressed in the tumor site (peritoneal cavity) versus the spleen (p< 0.001).
131 114 Effector T cell suppression assay CD45 + Gr-1 + CD11b + cells were pooled from 5 mice per group and sorted from tissues using the icyte Reflection (icyte) cell sorter. OT-I cells were pre-activated for hours with SIINFEKL (1µg/mL), purified by Fico/Lite gradient and added at 1X10 5 cells per well in the presence of SIINFEKL peptide (1mg/mL). BrdU was added directly to culture wells and cells were harvested for analysis after 12 hours. To evaluate proliferation, the percentage of BrdU + Thy1.1 + cells was analyzed by flow cytometry. Where indicated vitamin d was added at the beginning of cultures. The percentage suppression of proliferation is calculated as (1- proliferation with MDSC proliferation without MDSC) X 100. Results Microarray analysis reveals genes over-expressed in tumor resident MDSC Given our work demonstrating the functional differences in the Gr-1 + CD11b + cells in the tumor site and spleen of tumor-bearing mice we designed comparative microarray studies with the aim of identify genes that are differentially expressed in spleen versus tumor resident Gr-1 + CD11b + cells. To test this hypothesis, we initially attempted to isolate RNA from spleens and solid tumors from RM-1 prostate tumorbearing C57BL/6 mice. However, after considerable effort, we realized that the process of isolating MDSC from solid tumor tissue (collagenase digestion) was degrading the RNA and was not an adequate approach to obtain high quality RNA for the array process. In order to circumvent this problem, we grew RM-1 tumor cells in the peritoneal cavity and MDSC from the peritoneal cavity were used as cells from the tumor site. Further, given an increasing interest in subsets of MDSC (monocytic vs. granulocytic), we chose to use the individual Ly6G + and Ly6C + populations to determine if any genes isolated specifically with each sub-population would identify functional MDSC. In the peritoneal
132 115 cavity CD45 + CD11b + Ly6C + populations contained Ly6G low, Ly6G mid, and Ly6G high subsets. In contrast, in the spleen CD45 + CD11b + Ly6C + populations contained Ly6G + and Ly6G neg populations. Samples from both peritoneal cavity (tumor site) and spleen were submitted for affymetrix gene arrays (Mouse Gene 1.0 ST) to identify genes specifically up regulated in cells from the tumor site relative to the spleen. The initial analysis revealed that over 150 genes were increased by 5 or more fold in the tumor site versus spleen and almost 20 genes were increased by 20 or more fold. A heat map of the top 50 over-expressed and under-expressed genes (tumor site relative to spleen) in the Ly6G low, Ly6G mid, and Ly6G high subsets was generated by selecting the probe sets with the 50 largest positive fold and 50 largest negative fold changes (p< 0.001, Fig. 30). In the Ly6G low population (tumor site relative to spleen), Arg1 was overexpressed by 128 fold and inos (NOS2) by 32 fold, suggesting that the over-expressed genes are characteristic of a regulatory population of cells. Among the top 25 genes upregulated in the Ly6G low subset were, several chemokines, Arg1, inos, the vitamin D receptor (VDR), secreted phosphoprotein 1 (SPP1) (Fig. 30, Fig. 31). Importantly, these microarray analyses have identified a unique set of genes associated with the tumor resident MDSC population compared to other arrays done on spleen (non-functional) CD11b + cells (71). Further validating our approach, our microarray analysis showed over-expression of both Arg1 and inos in tumor-resident MDSC compared to spleen cells. The vitamin d receptor is over-expressed in tumor resident MDSC Our array data also indicated that the VDR was highly over-expressed in tumor resident MDSC (Fig. 31, 32A). VDR agonists inhibit immune responses by acting both on DCs (inhibiting maturation and immune-stimulatory function) and T cells (inhibiting Th1 development and cytokine production) (174). Treatment of established EAP in NOD mice with the VDR agonist elocalictol resulted in decreased IFN-γ production by prostate
133 116 reactive CD4 + T cells (175). Further, up-regulation of VDR has not been observed in other arrays or other reports using MDSC, making the VDR a potentially novel target of MDSC function. RT-PCR data validate the data from the array analysis and demonstrate VDR is indeed over-expressed in cells from the tumor site relative to the spleen (Fig. 32B). These data raise the possibility that ligation of the VDR in MDSC may play a role in enhancing the function of MDSC. To test this hypothesis, the suppressive potential of MDSC in the presence of varying concentrations of vitamin D was evaluated. Preliminary data suggest that vitamin D may enhance the suppressive function of MDSC during in vitro assays (Fig. 33). Work to validate and repeat these experiments is ongoing in the lab. Discussion SPP1 (osteopontin), which was up-regulated over 70-fold in tumor-derived MDSC in our array analysis (Fig. 31), is expressed in leukocytes, has chemotactic properties, promotes cell activation and cytokine production, inhibits apoptosis in macrophages and T cells, and can inhibit IL-10 production, which in turn can enhance Th1 responses (176). Further, osteopontin binds to several integrin receptors on leukocytes that are involved in cell adhesion, migration and survival (176). Given these functions it is possible that production of osteopontin by MDSC recruits Gr-1 + CD11b + myeloid cells from the spleen (precursor MDSC) that then become activated in the local inflammatory environment. One can also speculate that by binding to integrin receptors on lymphocytes, osteopontin may also promote adhesion of MDSC to T cells, which may in turn facilitate cell contact dependent inhibitory mechanisms. Interestingly, osteopontin expression is induced by ligation of the VDR. Thus, it is possible that osteopontin contributes to the suppressive function of MDSC through down-stream VDR signaling. If our preliminary data demonstrating vitamin D enhances the suppressive function of
134 117 MDSC are correct, then it would be interesting to test if this is dependent upon VDR upregulation of osteopontin. The data described above were derived from comparing tumor resident MDSC to spleen cells. However, these array data may also be used to identify genes differentially or specifically expressed in individual MDSC subsets. When the standard Mouse Gene 1.0 ST RNA arrays were performed, there was enough RNA to simultaneously perform mirna (micro-rna) arrays with the same samples. Studies are ongoing in the laboratory to examine the role of micro-rna in the regulation of MDSC with the goal of developing targeted therapies to disrupt MDSC function. The array data generated herein will provide the foundation for future projects in the laboratory aimed at better understanding the role of MDSC in prostate cancer and prostate inflammation. Ultimately, the goal is to identify genes specifically associated with functional but not precursor MDSC. Achieving this goal would be a major milestone in the field of MDSC biology by providing a phenotypic or genotypic definition of functional MDSC. Currently, as mentioned above, MDSC are defined by their function using in vitro assays that are somewhat ambiguous in their ability to correctly predict in vivo function. If a specific marker for functional MDSC could be identified, targeted therapies aimed at inhibiting or deleting these cells could be designed to improve the lives of patients diagnosed with diseases ranging from cancer to auto-immune diseases. Further, from a basic science perspective, the ability to identify functional MDSC from precursor cells would greatly advance our ability to study these cells and alleviate much of the confusion that exists in the literature concerning which MDSC subset or phenotype is functional in a specific model.
135 118 Figure 30: Heat map over-expressed and under-expressed mrnas in tumor resident MDSC subsets. C57BL/6 mice were injected ip with RM-1 cells. After 14 days peritoneal lavage and spleens were collected after which the cells were stained for CD45, CD11b, Ly6C and Ly6G and sorted. From the spleens CD45 + CD11b + Ly6C + Ly6G + and Ly6G - cells were sorted. From the peritoneal cavity CD45 + CD11b + Ly6C + Ly6G high, Ly6G low and Ly6G mid cells were sorted. RNA was immediately isolated from cells and with the help of the Center for Medical Genomics at Indiana University School of Medicine affymetrix gene arrays (Mouse Gene 1.0 ST) were performed. Data presented are comparative analysis of genes over-expressed and under-expressed in the tumor site (peritoneal cavity) versus the spleen (p< 0.001).
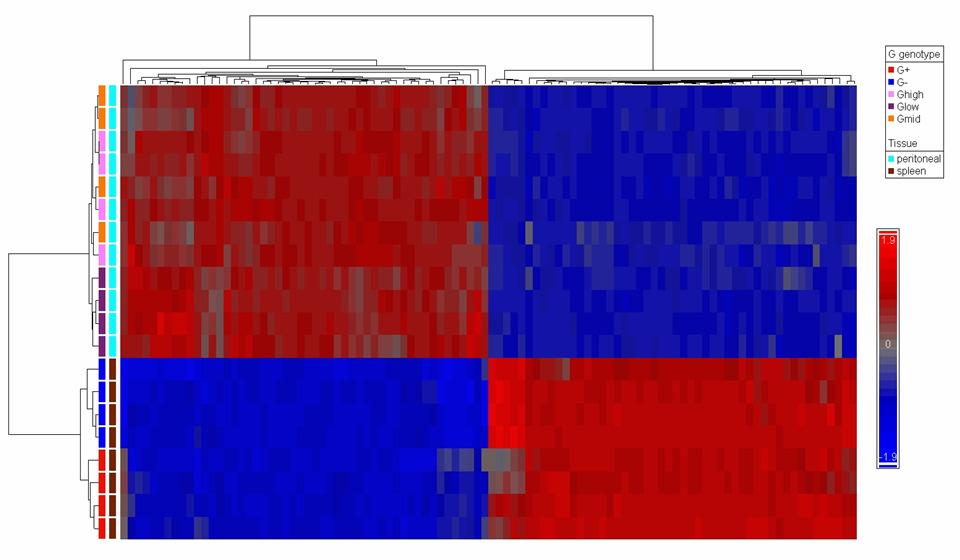
136 119
137 120 Figure 31: Over-expressed mrnas in tumor resident MDSC subsets. C57BL/6 mice were injected ip with RM-1 cells. After 14 days peritoneal lavage and spleens were collected after which the cells were stained for CD45, CD11b, Ly6C and Ly6G and sorted. RNA was immediately isolated from cells and with the help of the Center for Medical Genomics at Indiana University School of Medicine affymetrix gene arrays (Mouse Gene 1.0 ST ) were performed. A select list of genes among the top 50 over-expressed genes in the tumor (peritoneal cavity) resident CD45 + CD11b + Ly6G low cells relative to the spleen is shown along with the fold change detected.
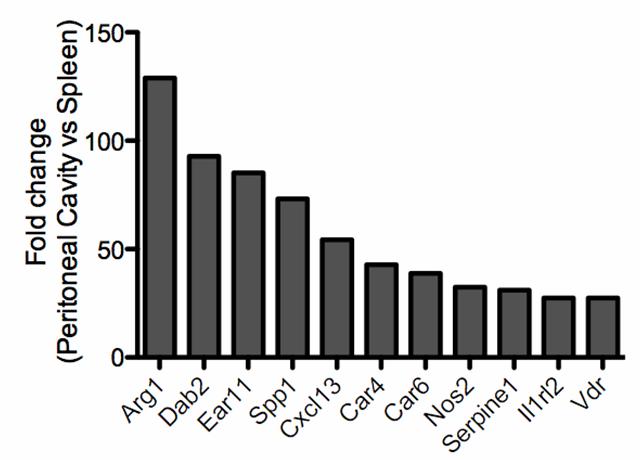
138 121
139 122 Figure 32: Vitamin D receptor expression in subsets of tumor resident MDSC. (A) C57BL/6 mice were injected ip with RM-1 cells. After 14 days peritoneal lavage and spleens were collected after which the cells were stained for CD45, CD11b, Ly6C and Ly6G. CD45 + CD11b + Ly6C + Ly6G high and Ly6G low cells were sorted from the peritoneal cavity or from the spleen. RNA was immediately isolated from cells and with the help of the Center for Medical Genomics at Indiana University School of Medicine affymetrix gene arrays (Mouse Gene 1.0 ST) were performed. Data are presented as the fold change in the expression of the vitamin D receptor (VDR) in the indicated populations of cells isolated from the tumor site versus the spleen. (B) The expression of VDR mrna in Gr- 1 + CD11b + cells from the tumor site or from the spleens of C57BL//6 bearing RM-1 tumors or from the spleens of naïve control mice was tested via RT-PCR. Samples were performed in duplicate and the data represent the average value of the two duplicate wells.
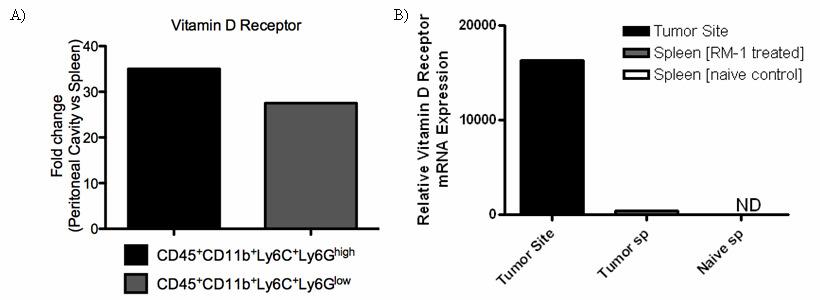
140 123
141 124 Figure 33: The impact of vitamin D on the function of tumor isolated MDSC. Tumor tissue was harvested from C57BL/6 mice bearing RM-1 prostate tumors and CD45 + Gr-1 + CD11b + were purified by cell sorting. Tumor cells were pooled from 5 mice/group. Purified CD45 + Gr-1 + CD11b + cells were placed in culture with pre-activated Thy1.1 + OT-I cells (1:2 MDSC:OT-I cell ratio) and after 12 hours proliferation was measured by examining BrdU incorporation in the Thy1.1 + OT-I cells as described above. Vitamin D was added at the indicated concentrations to wells at the beginning of culture where indicated.
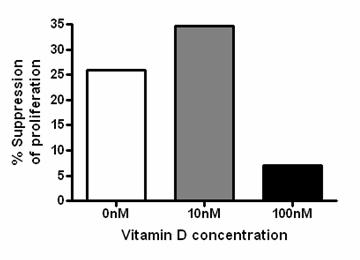
142 125
143 126 CHAPTER V. INFLAMMATION INDUCED LOSS OF TOLERANCE TO PROSTATE ANTIGENS Abstract Growing evidence suggests that chronic prostate inflammation (CPI) is mediated in part by the loss of T cell and B cell tolerance to prostate antigens. In both animal and human studies, proliferative responses to prostate auto-antigens are detectable during CPI. However, the mechanisms leading to this loss of tolerance are not clearly understood, largely because of a lack of available animal models. We now report the development of a new mouse model for the study of CPI, the Prostate Ovalbumin Expressing Transgenic-3 (POET-3) model. Adoptive transfer of antigen specific OT-I T cells induces CPI characterized by infiltration of exogenous (OT-I) and endogenous T cells into the prostate persisting as long as 45 days after transfer. Both in vitro and in vivo data demonstrate inflammation induced loss of T cell of tolerance to prostate autoantigens. Similarly, auto-antibody responses to prostate antigens were detected in POET- 3 mice after induction of chronic inflammation. These data demonstrate that initiation of a strong inflammatory response against mova induces auto-immune prostatitis characterized by development of prostate-specific auto-antigens and auto-antibodies and have important therapeutic implications for treatment of CPI. Introduction Prostate inflammation is associated with three major prostate diseases, chronic prostatitis-chronic pelvic pain syndrome (CP/CPPS), benign prostatic hyperplasia (BPH), and prostate cancer (14, ). It is estimated that as many as 12% of men may suffer from some form of prostatitis during their life, and 1 in 6 may suffer from prostate cancer (19, 157). Thus it is clear that diseases linked to prostate inflammation are major medical problems. Despite its prevalence and the multiplicity of associations between prostate diseases and chronic prostate inflammation (CPI), chronic prostatitis remains a poorly
144 127 understood disease with the majority of diagnosed cases in humans being of unknown etiology ( , 157). Generally, prostate inflammation is reported to increase with age, which is reminiscent of other auto-immune diseases (19). Indeed suggestive data from both clinical and animal specimens implicate autoimmunity in the development of CPI. A number of studies on clinical specimens obtained from CP/CPPS patients show some patients suffer from auto-immune inflammation characterized by the presence of both CD8 + and CD4 + T cells specific for prostate antigens such as prostate specific antigen (PSA) (20-24). Further, it is well documented that men with CP/CPPS have increased T cell proliferation and production of IFN-γ in response to seminal plasma compared to normal controls (20-21, 23). IFN-γ is associated with the pathogenesis of many autoimmune diseases due to its ability to activate macrophages, drive Th1 immune responses, support B cell maturation, and increase antigen presentation through enhanced MHC expression (158). Recently, Motrich and colleagues showed IRF-1 or STAT-1 deficient mice were resistant to induction of experimental autoimmune prostatitis (EAP), demonstrating the critical role for IFN-γ in auto-immune prostatitis (159). However, the role of prostate specific T cells and the mechanisms by which they become activated during CPI are unknown. Several inducible animal models have been used to characterize CPI after immunization of prostate extract in the presence of adjuvant, a process termed EAP. Pacheco-Rupil and colleagues demonstrated that rats immunized with prostate homogenate develop chronic prostate inflammation in a maximum of 90% of animals after multiple immunizations, but only approximately 30% after one immunization ( ). The inflammatory response was transferred by adoptive transfer of splenic T cells from immunized rats and was further shown to be dependent upon auto-reactive CD8 + T cells ( ). T cell-dependent EAP also has been reported in mice, during which T cell dependent responses develop against the dominant antigen, steroid binding protein
145 128 (25, 30, ). Importantly, these studies involve animal models where tolerance mechanisms have been removed or are defective. However, important limitations of these models include high variability among strain susceptibility, age dependence and incidence of disease. (25, , 164). While these studies were done using models defective in tolerance mechanisms, they support the hypothesis that chronic prostatitis is characterized by a loss of T cell tolerance. However, the mechanisms by which loss of tolerance to prostate antigens develops are not well understood. Using the Prostate Ovalbumin-Expressing Transgenic -3 (POET-3) mouse model, we now report that initiation of a strong inflammatory response against mova induces auto-immune prostatitis characterized by development of prostate-specific auto-antigens and auto-antibodies. Using adoptive transfer studies, we show that auto-immune prostatitis is transferable to non mova expressing mice, further confirming the role of inflammation in initiating loss of tolerance to other prostate antigens. Together, these data demonstrate a novel mechanism for development of auto-immune prostatitis, and provide for the first time an animal model to study the initiation and progression of auto-immune prostatitis without modulation of central or peripheral tolerance mechanisms. Materials and Methods Mice Prostate ovalbumin expressing transgenic-3 mice (POET-3) were generated as previously described (166). Rag-/-Thy1.1 + OT-I (OT-I) mice were generated by breeding C57BL/6 Rag-/-mice (Jackson Laboratories) to Thy1.1 + OT-I mice. Male C57BL/6 mice were obtained from the Transgenic Mouse Facility at Purdue University or from the National Cancer Institute. All animals used were male mice between 8-12 weeks of age. All protocols for the reported animal studies were approved by the appropriate animal care committees.
146 129 Adoptive transfer of OT-I cells Splenocytes were isolated from Thy1.1 + OT-I mice and cultured at 5X10 5 /ml with 1µg/mL SIINFEKL (Ova peptide , American Peptide) for 48hrs. Live cells were purified by Fico/Lite (Atlanta Biologicals) and 5X10 6 cells were injected iv into POET-3 mice. Histology and histopathological scoring Prostate lobes were dissected and fixed in 10% neutral buffered formalin and processed for histology. Hematoxylin and eosin stained sections were scored by a boardcertified pathologist using the following scoring system. 0: no detectable inflammation; 1: mild inflammation (scattered leukocyte infiltration, lack of tissue alteration/damage); 2: moderate inflammation (few focal leukocyte aggregates + mild interstitial edema and tissue alteration/damage); 3: severe inflammation (multifocal to coalescing aggregates of infiltrating leukocytes, + interstitial edema, tissue alteration/damage). Flow cytometry Prostate tissue was harvested and placed in a solution of 2 µg/ml Collagenase D (Roche Diagnostics) in RPMI containing 10% FBS. To isolate leukocytes from prostate tissue digests, the tissue was minced and placed at 37 C for 1 hr for digestion followed by passing through a 70 µm filter. Spleens were removed and ground between frosted microscope slides in PBS. Red blood cells were lysed with ACK buffer and passed through a 70 µm filter. Single cell suspensions were incubated with TruStain FcX antibody (BioLegend) then stained with directly conjugated antibodies (ebioscience) according to manufacturer instructions. Flow-cytometric analysis was performed on a FACS Canto (BD Biosciences) and data were analyzed using FlowJo software (Tree Star).
147 130 Antigens To prepare prostate or urinary bladder homogenate, prostate and urinary bladder tissues were isolated from C57BL/6 mice and homogenized at 4 C in the presence of a protease inhibitor cocktail and passed over a quiashredder column. Protein concentrations were measured using a BSA protein assay kit (Pierce). Peptides synthesis reagents and resin were purchased from Peptides International. Peptides were synthesized using Fast Fmoc-based solid phase peptide synthesis with a coupling reaction time of 2 x 10 min used. Synthesis was performed using a prelude peptide synthesizer (Protein Technologies) using CLEAR (Cross-Linked Ethoxylate Acrylate Resin)-Amide resin as the solid support and HCTU/NMM (0.190 M/0.4 M in DMF) for coupling. Amino acids were used at a final concentration of 0.1 M in DMF. The synthesized peptides were purified using preparative reverse-phase HPLC (Agilent 1200 series) and characterized using HPLC/MS (Thermo Accela/Finnigan LTQ) and MALDI-TOF MS (Voyager 4800, Applied Biosystems) mass spectrometry. ELISA Prostate or urinary bladder antigens (10µg/mL) in.1m bicarbonate buffer, ph 9.6 were plated (100µL/well) in 96 well ELISA plates (BD Biosciences) and incubated at 4 C overnight (BD Biosciences). All subsequent incubations were carried out for 2 hours at room temperature, and washes between incubations were with PBS with 0.05% Tween 20. The plates were blocked with 3% BSA in PBS and incubated with serum (1:100 dilution in 3% BSA in PBS). Horseradish peroxidase conjugated to goat anti-mouse IgG (1:2000 dilution, Bio-Rad) was used to detect bound antibody. ELISA plates were developed with BD OptEIA TMB substrate reagent kit (BD Biosciences) and stopped with 5N H 2 SO 4. Plates were read at 450nM with a 570nM reference filter using an ELISA reader (Thermo Fisher Scientific). Data are plotted as absorbance nM at
148 131 1:100 serum dilution. IFN-γ production was measured in culture supernatants using a BD OptEIA mouse IFN-γ ELISA kit (BD Biosciences). Immunization with PSBP peptides On day 0 Thy1.1 + OT-I cells were adoptively transferred into POET-3 mice, naïve mice received no injection. On day 14 naïve or inflamed mice received IFA alone, or IFA + 10µM PSBP 21-40, PSBP sc at the base of the tail and on day 28 spleen and prostate tissue were harvested for analysis. In vitro re-stimulation with PSBP peptides For in vitro studies spleen cells were re-stimulated (10 6 /well) for 72 hours with PSBP 21-40, PSBP at the indicated concentrations. Proliferation of Thy1.2 + cells was measured during in vitro cultures by monitoring BrdU (BD Biosciences) incorporation after a 24 hour pulse via flow cytometry. Adoptive transfer of chronic prostate inflammation Spleen and prostate draining LN cells were collected from naïve POET-3 mice or from POET-3 mice 30 days post adoptive transfer of OT-I cells. B cells were removed by B220 panning. Cell suspensions were plated at 10 5 /well in BD BioCoat T-cell activation plates (BD Biosciences) and after 24 hours live cells were purified by Fico/Lite (Atlanta Biologicals) and 5X10 6 cells were injected iv into C57BL/6 Rag1-/- mice. T cell activation was verified by testing CD69 levels on Thy1.2 + cells via flow cytometry. Results Adoptive transfer of OT-I cells induces chronic prostate inflammation in POET-3 mice The adoptive transfer of pre-activated OT-I cells into POET-3 mice but not C57BL/6 controls results in development of chronic prostate inflammation (Fig. 34A-E).
149 132 At day 4, the earliest time point evaluated, inflammatory infiltrates were present in the anterior, dorsal and ventral prostate lobes of POET-3 mice and were absent in the control C57BL/6 mice (Fig. 34A, B). The infiltrate increased in severity and was maximal in this study by day 7 for the anterior and dorsal lobes and at day 14 for the ventral lobe (Fig. 34A- D). By day 14 the anterior and dorsal inflammatory scores decreased dramatically, but were still elevated relative to control mice, and remained virtually unchanged by day 45 (Fig. 34A, D, E). The ventral lobe inflammatory scores were decreased by day 45 at which time they approximated the anterior and dorsal lobe inflammatory scores (Fig. 34A, E). The composition of the leukocytic infiltrate in POET-3 mice at day 4 was predominately polymorphonuclear (Fig. 34B). However, at day 7 and day 14 only a few polymorphonuclear cells were present with mononuclear inflammatory cells (Fig. 34C, D). By day 45 the infiltrate was predominately mononuclear (Fig. 34E). Other pathologic findings consisting of interstial edema and disruption of acini correlated with the inflammatory scores in that the more severe the inflammatory infiltrate the greater the severity of the edema and tissue damage (Fig. 34B-E). By day 14 some POET mice did have evidence of minimal interstitial fibrosis (Fig. 34D). These data establish the POET-3 mouse as a novel model for studying disease processes related to both acute and chronic prostate inflammation. Infiltration of endogenous T cells during chronic prostate inflammation Given that we could induce sustained prostate inflammation in POET-3 mice, we next examined the kinetics of leukocyte infiltration. Adoptive transfer of pre-activated Thy1.1 + OT-I cells into POET-3 mice congenic for Thy1.2 recruited CD45 + leukocytes, endogenous (Thy1.1 - ) CD4 + and CD8 + T cells and exogenous CD8 + cells (Thy1.1 + OT-I cells) into dorsal-lateral, anterior and ventral prostate lobes of POET-3 mice with the peak infiltration occurring at day 7 (Fig. 35A-D). At day 14 and 45 post adoptive transfer,
150 133 levels of endogenous (Thy1.1 - ) CD4 + and CD8 + cells were still elevated in ventral prostate tissue of POET-3 mice (Fig. 35B-C). These data demonstrate that early inflammation is characterized by both exogenous and endogenous T cells, and that endogenous T cells remain present during chronic prostate inflammation. Further, the data suggest T cells recognizing prostate-specific auto-antigens develop and sustain chronic prostate inflammation. Prostate auto-antigen specific T and B cells expand during chronic prostate inflammation Non-obese diabetic (NOD) mice demonstrate spontaneous prostate inflammation characterized by T cell reactivity toward prostatic steroid-binding protein (PSBP) (19). Therefore, we next asked if T cells specific for PSBP peptides were expanded during chronic prostate inflammation in POET-3 mice. Splenocytes from OT-I treated POET-3 mice produced higher amounts of IFN-γ in response to stimulation with PSBP peptides (Fig. 36A) and had higher percentages of proliferating T cells relative to naïve controls (Fig. 36B). Together, these data demonstrate T cells recognizing prostate-specific autoantigens develop during chronic prostate inflammation. Importantly, mice producing higher amounts of IFN-γ in response to PSBP re-stimulation had the highest numbers of CD45 + cells and Thy1.2 + in prostate tissue (Fig. 36C, D). Furthermore, all mice demonstrated increased CD4 + and CD8 + T cell infiltration into prostate tissue (Fig. 36E- F), suggesting that T cells specific for prostate-specific auto-antigens are also present in prostate tissue of chronically inflamed mice. A specific humoral response was observed with elevated levels of prostatespecific IgG present during chronic prostate inflammation (Fig. 37A) Importantly, levels of bladder-specific IgG were not increased in treated mice, suggesting that loss of B-cell tolerance was specific for prostate antigens (Fig. 37A). In support of these data, increased numbers of B cells were found in prostate tissue during chronic inflammation (Fig. 37B).
151 134 Immunization with prostate antigens boosts auto-immune inflammation in POET-3 mice Immunization of mice with PSBP has been shown to recruit T cells into prostate tissue (30, 164). In vitro data suggested that T cells specific for PSBP were expanded during chronic prostate inflammation (Fig. 36A, B). We next wanted to determine if administration of PSBP peptides to POET-3 mice with CPI would expand populations of PSBP specific T cells, and enhance prostate inflammation relative to controls. To test this, naïve or OT-I treated POET-3 mice were immunized with two immundominant class II PSBP peptides (164) (PSBP 21-40, PSBP ) and the level of prostate inflammation was determined by flow cytometry. Immunization of POET-3 mice with PSBP peptides significantly increased the number of endogenous (Thy1.2 + ) T cells into ventral prostate tissue relative to OT-I treated mice receiving incomplete Freunds adjuvant (IFA) alone (Fig. 38A). Similarly, the number of endogenous CD4 + T cells was significantly increased in the ventral prostate of peptide immunized OT-I treated mice (Fig. 38B). However, the number of endogenous CD8 + T cells was not significantly increased by peptide immunization (Fig. 38C). When splenocytes from peptide immunized mice were re-stimulated in vitro, increased IFN-γ production by CD4 + T cells was observed in POET-3 mice receiving OT-I cells (Fig. 38D). Naïve mice given IFA and peptide as well as POET-3 mice given OT-I cells and IFA produced some IFN-γ, however levels were higher in mice that had previously received OT-I cells (Fig. 38D). New prostate-auto-antigens develop during chronic prostate inflammation Because we could detect prostate auto-antigen and auto-antibody responses during chronic prostate inflammation, we hypothesized that inflammation had resulted in loss of tolerance to non-mova prostate antigens. To test this hypothesis we asked if prostate inflammation could be adoptively transferred into C57BL/6 Rag1-/- mice.
152 135 Importantly, these mice do not express ovalbumin, excluding the possibility that any prostate inflammation in these mice was the result of an anti-mova response. To avoid the possibility that regulatory T cells would suppress any prostate specific T cells transferred, we chose Rag1-/- mice which do not have regulatory T cells. Adoptive transfer of leukocytes from OT-I treated mice resulted in increased numbers of infiltrating leukocytes (CD45 + cells) and Thy1.2 + CD4 + T cells in the ventral prostate lobes of C57BL/6 Rag1-/- mice (Fig. 39A, B). Notably, this increase in leukocyte infiltration into the ventral prostate was not seen in recipient mice receiving activated T cells from naïve POET-3 mice, supporting the hypothesis that an anti-mova response in the POET-3 mice activates T cells specific neo-prostate antigens. Discussion Immunologic reactivity to prostate antigens is well described in several animal models of prostate inflammation; however, the mechanisms leading to loss of tolerance to prostate antigens are not clearly understood. Using the POET-3 model we demonstrate that a strong inflammatory trigger results in a loss of T cell and B cell tolerance to prostate antigens, leading to chronic auto-immune prostate inflammation. The adoptive transfer of OT-I cells into POET-3 mice induced an acute inflammatory response characterized by a polymorphonuclear infiltrate, which resolved to give way to a predominately mononuclear infiltrate during the chronic phase of the disease. Prostate inflammation can be induced in other rodent models by immunizing mice or rats with prostate homogenate or recombinant prostate proteins such as prostatic acid phosphatase (PAP), seminal vesicle protein 2 (SVS2) or PSBP ( , ). In contrast to these studies, induction of prostate inflammation in our model is induced by injection of antigen-specific T cells and not through immunization with prostate antigens. Further, whereas acute inflammation is initiated by an anti-ovalbumin response, chronic inflammation in the POET-3 model was sustained by non-mova prostate antigens.
153 136 Flow cytometric analysis of populations of leukocytes infiltrating prostate tissue shows that adoptive transfer of OT-I cells results in OT-I cell accumulation in prostate tissue as well as recruits endogenous T cells both during acute and chronic inflammation. Notably during chronic prostate inflammation (day 45) the number of endogenous CD4 + T cells present in the ventral prostate was increased, leading us to hypothesize that chronic prostate inflammation was characterized by the presence of prostate auto-antigen specific T cells. In support of our hypothesis, proliferation studies demonstrated that inflammation induced by OT-I cell transfer into POET-3 mice resulted in the expansion of PSBP autoantigen specific T cells. Recognition of prostate auto-antigens such as PSBP by T cells during EAP is well documented (164, ). However, one important distinction between these studies and the current work is that the expansion of auto-specific T cells in POET-3 mice arises as a result of an inflammatory response targeted against a nonoverlapping prostate protein. Further, it was recently demonstrated that tissue expression of cognate pmhc was required for recruitment of both naïve and pre-activated T cells into peripheral tissues both in the steady state and under inflammatory conditions (169). In this study Wang et al. demonstrated non-specific inflammatory signals are not sufficient for the retention and accumulation of auto-reactive T cells into peripheral tissues (169). These data support the hypothesis that endogenous T cells accumulating in the prostates of POET-3 mice recognize prostate specific antigens. PSBP is an abundant prostate-specific protein expressed predominantly by the ventral prostate (170). Therefore, our data demonstrating that chronic inflammation is most strongly associated with the ventral prostate, suggest that self-reactivity against PSBP or other prostate proteins expressed predominantly in the ventral prostate are mostly likely to develop. The rodent prostate consists of the ventral, dorsal-lateral prostate and anterior prostate lobes, each having overlapping and distinct protein
154 137 expression (171). Therefore, it is possible that the difference seen in the severity of the auto-immune response in each of the lobes is a reflection of the unique gene expression of each lobe. These data demonstrate that loss of tolerance to PSBP is induced by inflammation but does not suggest that PSBP is the only or dominant protein driving chronic inflammation in this model. Induction of inflammation by adoptive transfer into POET-3 mice resulted in a loss of B cell tolerance to prostate antigens. Importantly, loss of tolerance was specific to the anatomical site of the induced inflammatory response as no change in antibody reactivity to urinary bladder antigens was seen. In support of these data, the presence of prostate antigen specific auto-antibodies has been described in several models of EAP; however, their role in prostate inflammation remains unclear (33, 168). The presence of anti-prostate antibodies led us to investigate if B cells were recruited into prostate tissue after adoptive transfer of OT-I cells. In agreement with other EAP models (164, 168), B cells were found in elevated numbers, in prostate tissue from POET-3 mice with chronic prostate inflammation. However, here we report that elevated numbers of infiltrating B cells is predominately localized to the ventral prostate. Immunization of mice with PSBP, a protein predominantly expressed in ventral prostate, results in expansion of B220 + cells in prostates of NOD mice (164, 170). These data may explain why predominantly the ventral prostate is infiltrated by elevated numbers of B cells after OT-I cell transfer. Elevated numbers of B cells are also seen in human prostatitis patients (16). Thus, while it is clear that B cell loss of tolerance and recruitment of B cells into prostate tissue occurs in multiple models of EAP, the role of B cells in prostate tissue is unknown. B cells are important modulators of CD4 + T cell activation through their expression of costimulatory molecules, thus one possible role of B cells in prostate tissue is to support on going T helper cell function. In addition to their immunostimulatory functions, a subset of B cells, B10 cells, can also negatively regulate immune responses through their production of IL-10 ( ). B10 cells have been shown to play a role in auto-immune
155 138 diseases such as EAE (172) and may also be involved in the regulation of prostate inflammation in our model. In summary, we demonstrate that inflammation in the prostate can trigger the loss of tolerance to other (non-mova) prostate antigens. Epitope spreading is a well documented mechanism by which one initial inflammatory stimulus, such as infection or trauma, induces the priming of auto-reactive T and B cells against a different epitope in the same or against an epitope in a different protein. Herein we provide evidence that an initiating inflammatory event in the prostate results in development of auto-immune prostatitis through intermolecular epitope spreading. Furthermore, we present the POET- 3 model as a novel model for studying prostatitis wherein no intrinsic defects in tolerance have been introduced by genetic manipulation or through direct immunization with the target antigen. The studies reported herein provide new insight into the factors contributing to loss of tolerance and the resulting self directed immune response that sustains chronic auto-immune prostatitis.
156 139 Figure 34: Adoptive transfer of OT-I cells induces chronic prostate inflammation. Pre-activated Thy1.1 + OT-I cells were adoptively transferred into POET-3 or C57BL/6 mice and after 4, 7, 14, or 45 days prostate tissue was harvested for histological analysis. (A) H&E sections were scored by a pathologist as described in Materials and Methods. (A-E) Representative images of paraffin embedded prostate tissue (H&E, bar= 50µm) at day 4 (B), 7 (C), 14 (D), 45 (E). Data are from 4 mice/group and are representative of no less than three independent experiments.

157 Work completed by B. Charbonneau 140
158 141 Figure 35: Endogenous and exogenous T cells accumulate in chronically inflamed prostates. Pre-activated Thy1.1 + OT-I cells were adoptively transferred into POET-3 or C57BL/6 mice (4 mice/group) and after 4, 7, 14, or 45 days prostate tissue was harvested for analysis by flow cytometry. The number of CD45 + cells (A), CD45 + CD4 + Thy1.1 - cells (endogenous CD4 + T cells) (B), CD45 + CD8 + Thy1.1 - cells (endogenous CD8 + T cells) (C), CD45 + CD8 + Thy1.1 + cells (exogenous CD8 + OT-I cells) (D). Data are presented as the mean + SD, and are representative of no less than three independent experiments.
159 Work completed by B. Charbonneau 142
160 143 Figure 36: T cell responses to prostate-specific auto-antigens develop during chronic prostate inflammation. Pre-activated Thy1.1 + OT-I cells were adoptively transferred into POET-3 mice (5 mice/group) and after 20 days prostate tissue and spleens were harvested for in vitro analysis. Naïve POET-3 mice (3 mice/group) were used as controls. (A, B) Spleen cells were stimulated with PSBP peptides at the indicated concentrations. After 72 hours IFNγ was measured in culture supernatants by ELISA (A) and proliferation of Thy1.2 + cells was monitored through BrdU incorporation (B). Data are presented as the mean + SD. (C-F) The leukocyte infiltration in prostate tissue was examined by flow cytometry. Data are presented as the mean + SD. The number of CD45 + cells (C), CD45 + Thy1.2 + cells (endogenous T cells) (D), CD45 + Thy1.2 + CD4 + cells (E), CD45 + Thy1.2 + CD8 + cells (F) in prostate tissue. All experiments were repeated no less 3 times; data are from one representative experiment.
161 144
162 145 Figure 37: Prostate specific auto-antibodies are present during chronic prostate inflammation. Pre-activated Thy1.1 + OT-I cells were adoptively transferred into POET-3 mice (4 mice/group) and after 30 days prostate tissue and serum were harvested. Naïve POET-3 mice (3 mice/group) were used as controls. (A) The presence of serum prostate or bladder specific IgG was examined by ELISA as described in Materials and Methods. (B) The number of CD45 + CD19 + B cells was examined in prostate tissue by flow cytometry. All experiments were repeated no less 2 times; data are from one representative experiment. Data presented are the mean +SD.
163 146
164 147 Figure 38: Immunization with prostate antigens expands T cells recognizing nonmova prostate antigens. Pre-activated Thy1.1 + OT-I cells were adoptively transferred into POET-3 mice (4 mice/group) day 0. On day 14 naïve or POET-3 mice receiving OT-I cells were immunized sc at the base of the tail with 10µM PSBP peptides in IFA or with IFA alone. On day 28 prostate and spleen tissues were harvested. (A-B) Numbers of CD45 + Thy1.2 + (A) and CD45 + Thy1.2 + CD4 + (B) and CD45 + Thy1.2 + CD8 + cells were examined in prostate tissue by flow cytometry. Data are combined results from two independent experiments using 4 mice/group. *p<0.05, using the Students t test. (D) Spleen cells were re-stimulated in vitro with the indicated concentrations of PSBP 21-40, PSBP After 72 hours IFN-γ production was measured in supernatants by ELISA. Data presented are the mean + SD, and are representative of two independent experiments.
165 148
166 149 Figure 39: Chronic prostate inflammation is adoptively transferable. Pre-activated Thy1.1 + OT-I cells were adoptively transferred into POET-3 mice (4 mice/group) day 0. On day 30, spleen and prostate draining LN cells were collected from POET-3 mice receiving OT-I cells (5 mice/group) or from naïve POET-3 mice (3 mice/group) stimulated with anti-cd3 and transferred into C57BL/6 Rag1-/- mice (4 mice/group) as described in Materials and Methods. After 6 days prostates were harvested and the number of CD45 + (A) and CD45 + Thy1.2 + CD4 + (B) cells were examined by flow cytometry. *p<0.05, using the Students t test. Data presented are the mean + SD, and are representative of two independent experiments.
167 150
168 151 CHAPTER VI: DISCUSSION Regarding the Data and the Impact of the Scientific Discoveries Inflammatory responses in the prostate are poorly understood, due in part to a lack of appropriate animal models in which to study immune responses to prostate antigens. Using a novel mouse model of abacterial prostatitis we now demonstrate MDSC down modulate CD8 + T cell responses locally in the prostate during acute inflammation. Induction of acute prostate inflammation led to a rapid but transient accumulation of MDSC in the prostate (Fig. 6A-C). Arg1 and inos were highly expressed in MDSC from prostates of mice with prostatitis compared to cells bearing the same surface phenotype (Gr-1 + CD11b + ) from the spleen (Fig.9). However, when the suppressive capacity of Gr- 1 + CD11b + cells from both tissues (spleen and prostate) were evaluated using standard in vitro suppression assays, cells were able to inhibit T cell proliferation regardless of the tissue site they were isolated from (Figure 14A-B). Given the known role of T cell derived IFN-γ in activation of MDSC function, we hypothesized that exposure to this cytokine during the standard in vitro assay induced suppressive function in spleen Gr- 1 + CD11b + cells. Indeed, RT-PCR data from Gr-1 + CD11b + cells recovered after the standard assay demonstrate that IFN-γ produced during the in vitro assay conveys functional activity in spleen Gr-1 + CD11b + cells (Fig. 14C-D). Gr-1 + CD11b + cells from the prostate remained functional even when IFN-γ was neutralized during in vitro culture. These data raise two possibilities. First, that prostate MDSC inhibit T cell proliferation in an IFN-γ independent mechanism. Secondly, the data may suggest that MDSC from the prostate are independent of IFN-γ produced in vitro because they were activated locally at the inflammatory site in vivo. When the inhibitory function of Gr-1 + CD11b + cells from inflamed prostates or from the spleens of mice with prostatitis were evaluated using a short term (12hr) in vitro
169 152 assay only cells from inflamed prostates were able to inhibit T cell proliferation (Fig. 15). These data led us to conclude that only cells from the inflammatory site possess immediate capacity to inhibit T cell proliferation. In vivo studies demonstrating that depletion of Gr-1 + cells during acute prostatitis enhances T cell responses to antigen restimulation selectively in the prostate and does not change the function of splenic T cells further supports this conclusion. Thus, both in vivo and in vitro data demonstrate that during acute abacterial prostatitis MDSC are recruited to the prostate and regulate T cell responses locally at the site of inflammation. Further these data demonstrate for the first time that MDSC are important regulatory cells in controlling immune responses in the prostate. MDSC were initially identified as expanded populations of Gr-1 + CD11b + cells in the spleens of tumor-bearing mice with immunosuppressive functions. It is now clear that chronic inflammation associated with tumor growth is one of the main factors resulting in accumulation of MDSC in tumor-bearing hosts. Using the RM-1 heterotopic tumor model and the spontaneous prostate tumor model, the C57BL/6/Luc/Pten -/- mouse model, we demonstrate that levels of Arg1 and inos are elevated in Gr-1 + CD11b + cells from the tumor site compared to those from the spleen (Fig. 20, 28). Further, similar to findings in our prostatitis model, the immediate suppressive capacity of MDSC is restricted to the inflammatory site in the context of chronic inflammation induced by tumor growth (Fig. 19, 21, 27). The similarities in function between cells isolated from an acute or chronic inflammatory environment provide strong evidence to support the conclusion that only MDSC isolated from the site of an ongoing immune response are functional cells. Importantly, these findings suggest that the basic properties of MDSC are similar in both malignant and non-malignant diseases. In the broader context these data support a model wherein spleen Gr-1 + CD11b + cells represent a pool of pre-cursor MDSC that migrate into a site of an ongoing immune response, become activated, and acquire functional characteristics of MDSC.
170 153 MDSC are by definition Gr-1 + CD11b + cells lacking major markers of typical mature macrophages or DCs with the ability to inhibit T cell proliferation or cytokine production (55). It is becoming increasingly clear that MDSC have a high degree of plasticity, and that the mechanism(s) of suppression used are highly dependent upon the inflammatory stimuli present in their local micro-environment. Our data demonstrating the suppressive function of MDSC is restricted to cells present at the inflammatory site are then perhaps not surprising. However, our data stand in contrast to most if not all previous data in the field of MDSC biology. Whereas we define spleen Gr-1 + CD11b + cells as pre-cursor MDSC (without the immediate capacity to inhibit T cell proliferation), under the current definition spleen Gr-1 + CD11b + cells are functional MDSC if they are able to inhibit T cell proliferation in standard suppression assays. However, as our data suggest, the current definition does not accurately reflect the true biologic function of these cells in certain models. Rather, we suggest that the standard suppression assays tests only the ability of Gr-1 + CD11b + cells to become functional MDSC and should not be used to draw conclusions about the activation status of the cells in vivo. It is clear from our studies and from other investigators that Arg1 and inos are major mechanisms by which MDSC exert their suppressive function (60). Therefore it is logical to suggest that evaluation of these enzymes in freshly isolated Gr-1 + CD11b + cells by RT-PCR or biochemical analysis may more accurately predict inhibitory capacity in vivo. Using this method to evaluate the functional status of Gr-1 + CD11b + cells is attractive due to the relative simplicity of RT-PCR compared to the time and animal resources required for in vitro suppression assays. This approach may also help identify subsets of MDSC with enhanced inhibitory function. RT-PCR analysis can be done with fewer than 10,000 cells, allowing cells from multiple tissues and with multiple phenotypes to be quickly evaluated for suppressive capacity. The data presented herein have important implications for immunotherapy design. Our data suggest that activation of MDSC inhibitory function occurs not in the spleen but
171 154 in the inflammatory site itself. This possibility calls for heightened examination of MDSC in immunotherapy design. Specifically our data indicate that immunotherapy designed to augment inflammation at the tumor site with the aim of boosting anti-tumor immune responses may also enhance the inhibitory function of MDSC. Type III prostatitis, CP/CPPS, is a highly prevalent but poorly understood disease in part due to a lack of appropriate animal models. Previous clinical data suggested a role for auto-reactive lymphocytes in CP/CPPS; however, until now there was not a suitable animal model in which to study this disease. Previous studies in the lab by B. Charbonneau demonstrated adoptive transfer of pre-activated OT-I cells into POET-3 mice resulted in chronic prostate inflammation that was still detectable at day 45 and beyond (Fig. 34, 35). Analysis by flow cytometry demonstrated that at early time points (days 4 and 7) exogenous OT-I cells (Thy1.1 + CD8 + cells) and endogenous (Thy1.1 - ) CD4 + and CD8 + cells were recruited into inflamed prostates (Fig. 35 B-D). In contrast, at later time points (days 14 & 45) numbers of exogenous OT-I cells were dramatically reduced while numbers of endogenous CD4 + cells remained elevated, especially in the ventral prostate (Fig. 35 B, D). These data led us to hypothesize that initiation of prostate inflammation with OT-I cells activates a CD4 + mediated auto-immune response to nonmova prostate antigens. Splenocytes from POET-3 mice treated with OT-I cells but not from naïve controls produced IFN-γ (Fig. 36A) and proliferated (Fig. 36B) when restimulated in vitro with non-mova prostate antigens (PSBP peptides). In support of these data, in vivo studies demonstrated that administration of PSBP peptides to OT-I treated mice resulted in elevated numbers of endogenous (Thy1.2 + cells) CD4 + cells in the ventral prostate (Fig. 38A, B). Endogenous CD8 + T cells were not significantly increased after administration of PSBP peptides (Fig. 38C). When splenocytes from OT-I and PSBP or OT-I and vehicle treated mice were re-stimulated in vitro, culture supernatants from mice boosted with PSBP peptides in vivo had higher amounts of IFN-γ (Fig. 38D).
172 155 It is important to note that it is likely that in addition to PSBP, T cell responses to other prostate antigens develop during CPI. Both in vivo and in vitro data demonstrate that initiation of inflammation by OT-I cells in POET-3 mice results in T cell reactivity to non-mova prostate antigens such as PSBP peptides. This finding is somewhat analogous to epitope spreading seen in other models of viral infection or trauma where a T cell response to one antigen can spread to include T cells specific for another antigen in the same or a different protein. In this context, the demonstration of epitope spreading is not novel. However, what is novel about our finding is that this is the first demonstration of epitope spreading in prostate inflammation. Similarly, POET-3 mice treated with OT-I cells produced antibodies specifically reacting to prostate antigens and not antigens from other tissue sites such as the bladder (Fig. 37A). These data demonstrate loss of B cell tolerance to prostate antigens is dependent upon treatment with OT-I cells, is specific to prostate antigens and is not due to reactivity against mova as the prostate tissue used as a source of antigen was taken from C57BL/6 mice. Together, these data provide support for the hypothesis that some type III prostatitis (CP/CPPS) patients have an auto-immune disease. We now present the POET-3 mouse model as a novel model of acute and chronic prostate inflammation. This model provides significant advances over previous rodent models of EAP. In POET-3 mice, prostate inflammation is antigen specific, restricted to the prostate, uniformly expressed in all anatomical sites of the prostate and does not require aged animals. Further, and perhaps most importantly, these mice are on the C56BL/6 background with intact central and peripheral tolerance mechanisms. Thus, POET-3 mice represent a unique and suitable mouse model in which to elucidate the roles of individual leukocyte populations in prostate inflammation. Given that CPI in POET-3 mice is at least partially dependent upon activation of auto-reactive lymphocytes, this model may be used to further elucidate the mechanisms leading to
173 156 development of auto-immune prostatitis. Because inflammation can be uniformly induced in multiple animals, this model also provides the ability to study the impact of comorbidities such as smoking or obesity on prostate inflammation. To study the impact of prostate inflammation on the development and progression of prostate cancer, we generated the POET-3/Luc/Pten +/- mouse model (Fig. 23). MDSC spontaneously accumulate in the prostates of aged POET-3/Luc/Pten +/- mice. Further, adoptive transfer of pre-activated OT-I cells into POET-3/Luc/Pten +/- mice resulted in acute prostate inflammation and enhanced recruitment of MDSC in all lobes of the prostate (Fig ). In this model, significant histological changes were observed as early as 7 days post adoptive transfer of OT-I cells (Fig. 24, 27). Importantly, this inflammatory response generated hyperplastic and proliferative lesions within the prostate epithelium 30 days after adoptive transfer of OT-I cells (Fig. 27). While these data are preliminary, they establish the POET-3/Luc/Pten +/- mouse model as a novel model in which the impact of chronic prostate inflammation on prostate cancer progression can be evaluated. By crossing POET-3 mice to mouse models genetically susceptible to prostate cancer such as the C57BL/6/Luc/Pten -/- mouse model, the role of chronic prostate inflammation on prostate cancer can be investigated. Further, these models can also be used to develop new therapies for the treatment of prostatitis and prostate cancer. For example, our data have shown that large numbers of MDSC expressing Arg1 and inos accumulate in prostates of POET-3 and POET-3/Luc/Pten +/ mice. Serafini and colleagues demonstrated phosphodiesterase-5 (PDE-5) inhibitors such as sildenafil down-regulate Arg1 and inos expression in MDSC (81). A logical extension of these findings would be to test the efficacy of PDE-5 inhibitors in the POET-3 or POET-3 Luc/Pten +/- models to determine if these drugs may benefit type III prostatitis patients or prostate cancer patients. Using the POET-3 model, we demonstrated that initiation of a strong immune response in the prostate (to mova) can lead to loss of tolerance to other prostate
174 157 antigens. Our studies further demonstrate that loss of tolerance to epitopes in the PSBP protein is involved in this process. Using this information, we can now begin to ask by what mechanism this loss of tolerance is occurring by monitoring the magnitude of T cell responses to PSBP peptides. The development of auto-immunity has been demonstrated to be dependent upon IFN-γ in other animal models (177). Therefore, based on data generated from my studies, the loss of tolerance to PSBP antigens may be dependent upon IFN-γ. To test this hypothesis, an experiment where POET-3 mice (naive or OT-I treated) are given neutralizing IFN-γ antibody (XMG1.2) or isotype control (SFR8) antibody for 30 days could be performed. After 30 days, cells from spleens and prostate draining lymph nodes would be re-stimulated in vitro with PSBP peptides and the percentage of proliferating Thy1.2 + CD4 + cells monitored by flow cytometry. If the percentage of proliferating Thy1.2 + CD4 + cells was lower in mice receiving OT-I cells and neutralizing IFN-γ antibody compared to isotope treated control mice, the data would suggest that development of anti-psbp immune responses in OT-I treated mice is dependent upon IFN-γ. If the percentage of proliferating Thy1.2 + CD4 + cells was higher in mice receiving OT-I cells and neutralizing IFN-γ antibody compared to isotope treated control mice the data would indicate that IFN-γ inhibits rather than promotes reactivity to PSBP antigens in our model. The laboratory is currently in the process of evaluating the impact of IFN-γ on the development of PSBP reactive T cells. In vitro proliferation data from chapter V demonstrated Thy1.2 + CD4 + T cells were responding to PSBP antigens. These data suggest that CPI is dependent upon CD4 + T cells in the POET-3 model. However, flow cytometry data show that in addition to the presence of endogenous CD4 + T cells, low levels of endogenous CD8 + cells are also present during CPI. Thus, studies designed to determine which population of T cells is necessary or sufficient for sustaining CPI are necessary. Further, the studies in chapter V leave open the possibility that T cell responses to additional prostate antigens may develop as a result of OT-I initiated inflammation. CPI
175 158 in the POET-3 model seems to be predominately restricted to the ventral prostate. To test the hypothesis that initiation of mova inflammation results in loss of tolerance to other ventral prostate proteins, CPI could be initiated by OT-I transfer followed by immunization with a variety of ventral prostate proteins (similar to experiments in Fig. 38). The level of inflammation could then be measured by flow cytometry and histology to monitor the response to the protein. Understanding how a mova restricted CD8 + T cell response leads to the activation of prostate reactive CD4 + T cells is a complex question. In the POET-3 mouse, acute prostate inflammation is characterized by recruitment of large numbers of MDSC that produce high levels of peroxynitrite. Peroxynitrite can modify proteins by binding to amino acids such as cysteine and tyrosine, resulting in changes in protein conformation, signaling and recognition. Further, Herzog and colleagues demonstrated that modification of hen egg-white lysozyme (HEL) peptides by protein nitration led to alterations in T cell responses to HEL (178). These data demonstrate that protein nitration can alter the way in which antigens are recognized by T cells in vivo. These data raise the possibility that MDSC dependent nitration of prostate proteins alters antigen presentation to T cells and may be involved in the loss of tolerance during CPI. If this hypothesis is correct, then elimination of MDSC specific inos should delay or lead to reduction in the severity of CPI. MDSC can ingest and present antigen to T cells (55). It has also been established that when MDSC are removed from inflammatory stimuli through adoptive transfer into healthy mice they can differentiate into macrophages and DCs (179). These data suggest that MDSC present in the prostate during acute inflammation may ingest prostate antigens and upon resolution of the immune response as inflammatory signals decline differentiate into APCs. It is therefore tempting to speculate that MDSC may facilitate the development of auto-immunity by priming T cell responses through APCs function after acute inflammation resolves.
176 159 In summary, our findings in the POET-3 model identify for the first time the role of MDSC in regulation of T cell responses to in the prostate. Our data suggest a model whereby inflammation, initiated here by CD8 + T cells, recruits quiescent Gr-1 + CD11b + cells from peripheral tissues (Fig. 40). Once in the prostate inflammatory signals such as IFN-γ induce expression of inos and Arg1, converting Gr-1 + CD11b + cells into functionally suppressive MDSC (Fig. 40). MDSC then act locally to inhibit CD8 + T cell responses and induce protein nitration in the prostate (Fig. 40). By mechanisms that are yet unclear, although perhaps related to altered recognition of prostate proteins due to protein nitration or due to increased antigen presentation from MDSC that differentiate into APCs, endogenous T cell responses to prostate antigens drive chronic prostate inflammation (Fig. 40). Chronic inflammation results in alterations in the prostate epithelium when in the context of genetic susceptibility, such as Pten deletions, may lead to the development of prostate cancer.
177 160 Figure 40: Model for the initiation and regulation of prostate inflammation. In the POET-3 mouse, adoptive transfer or activated CD8 T cells specific for an exogenous prostate antigen (OVA) induces prostate specific inflammation. The resulting inflammatory response is characterized by the recruitment of Gr-1 + CD11b + cells, macrophages, endogenous CD4 +, and exogenous and endogenous CD8 + T cells. Inflammatory signals in the prostate activate Arg1 and inos in Gr-1 + CD11b + cells, converting these cells into MDSC capable of inhibiting CD8 + T cell responses locally in the prostate. Production of peroxynitrite results in nitration of proteins in the prostate. By mechanisms that are yet unclear, chronic prostate inflammation characterized by the presence of prostate auto-reactive endogenous CD4 + T cells develops as a consequence of CD8 + T cell initiated inflammation. The chronic inflammatory response results in significant changes in prostate epithelial cell proliferation and alters gene expression profiles.
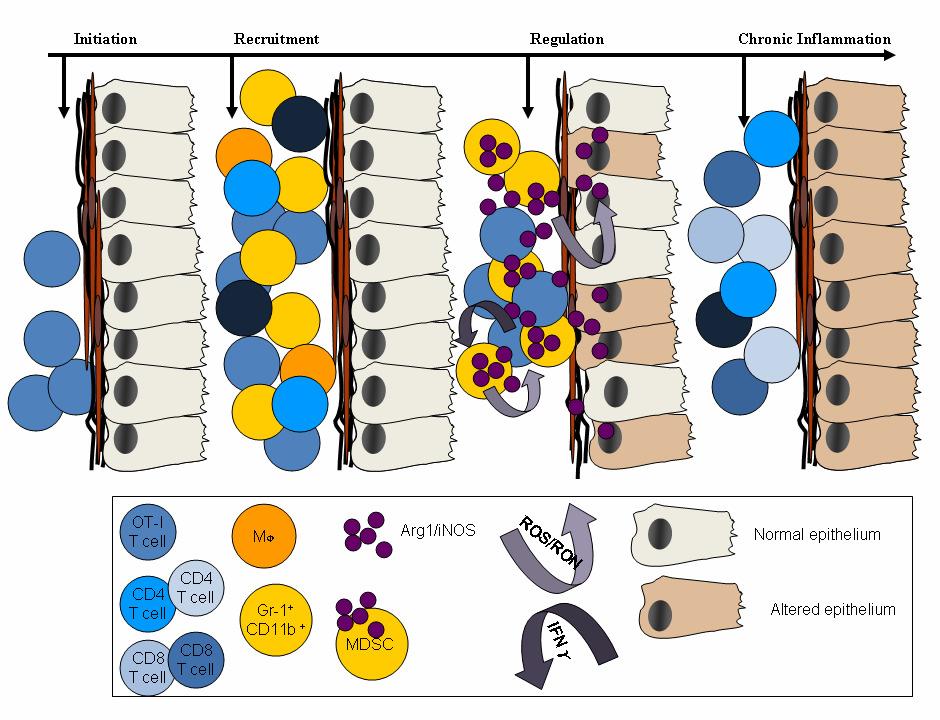
178 161
T-cell activation T cells migrate to secondary lymphoid tissues where they interact with antigen, antigen-presenting cells, and other lymphocytes:
 Interactions between innate immunity & adaptive immunity What happens to T cells after they leave the thymus? Naïve T cells exit the thymus and enter the bloodstream. If they remain in the bloodstream,
General Overview of Immunology. Kimberly S. Schluns, Ph.D. Associate Professor Department of Immunology UT MD Anderson Cancer Center
 General Overview of Immunology Kimberly S. Schluns, Ph.D. Associate Professor Department of Immunology UT MD Anderson Cancer Center Objectives Describe differences between innate and adaptive immune responses
ACTIVATION AND EFFECTOR FUNCTIONS OF CELL-MEDIATED IMMUNITY AND NK CELLS. Choompone Sakonwasun, MD (Hons), FRCPT
, FRCPT") ACTIVATION AND EFFECTOR FUNCTIONS OF CELL-MEDIATED IMMUNITY AND NK CELLS Choompone Sakonwasun, MD (Hons), FRCPT Types of Adaptive Immunity Types of T Cell-mediated Immune Reactions CTLs = cytotoxic T lymphocytes
ACTIVATION AND EFFECTOR FUNCTIONS OF CELL-MEDIATED IMMUNITY AND NK CELLS Choompone Sakonwasun, MD (Hons), FRCPT Types of Adaptive Immunity Types of T Cell-mediated Immune Reactions CTLs = cytotoxic T lymphocytes
Effector mechanisms of cell-mediated immunity: Properties of effector, memory and regulatory T cells
 ICI Basic Immunology course Effector mechanisms of cell-mediated immunity: Properties of effector, memory and regulatory T cells Abul K. Abbas, MD UCSF Stages in the development of T cell responses: induction
Allergy and Immunology Review Corner: Chapter 19 of Immunology IV: Clinical Applications in Health and Disease, by Joseph A. Bellanti, MD.
 Allergy and Immunology Review Corner: Chapter 19 of Immunology IV: Clinical Applications in Health and Disease, by Joseph A. Bellanti, MD. Chapter 19: Tolerance, Autoimmunity, and Autoinflammation Prepared
Manipulating the Tumor Environment
 Manipulating the Tumor Environment Vincenzo Bronte Verona University Hospital vincenzo.bronte@univr.it Escape from immune control can be viewed as one of the «Hallmarks of Cancer» D. Hanahan and R. A.
Cytokines modulate the functional activities of individual cells and tissues both under normal and pathologic conditions Interleukins,
 Cytokines http://highered.mcgraw-hill.com/sites/0072507470/student_view0/chapter22/animation the_immune_response.html Cytokines modulate the functional activities of individual cells and tissues both under
Tolerance 2. Regulatory T cells; why tolerance fails. Abul K. Abbas UCSF. FOCiS
 1 Tolerance 2. Regulatory T cells; why tolerance fails Abul K. Abbas UCSF FOCiS 2 Lecture outline Regulatory T cells: functions and clinical relevance Pathogenesis of autoimmunity: why selftolerance fails
Darwinian selection and Newtonian physics wrapped up in systems biology
 Darwinian selection and Newtonian physics wrapped up in systems biology Concept published in 1957* by Macfarland Burnet (1960 Nobel Laureate for the theory of induced immune tolerance, leading to solid
T Cell Effector Mechanisms I: B cell Help & DTH
 T Cell Effector Mechanisms I: B cell Help & DTH Ned Braunstein, MD The Major T Cell Subsets p56 lck + T cells γ δ ε ζ ζ p56 lck CD8+ T cells γ δ ε ζ ζ Cα Cβ Vα Vβ CD3 CD8 Cα Cβ Vα Vβ CD3 MHC II peptide
Effector T Cells and
 1 Effector T Cells and Cytokines Andrew Lichtman, MD PhD Brigham and Women's Hospital Harvard Medical School 2 Lecture outline Cytokines Subsets of CD4+ T cells: definitions, functions, development New
1. Overview of Adaptive Immunity
 Chapter 17A: Adaptive Immunity Part I 1. Overview of Adaptive Immunity 2. T and B Cell Production 3. Antigens & Antigen Presentation 4. Helper T cells 1. Overview of Adaptive Immunity The Nature of Adaptive
Tolerance, autoimmunity and the pathogenesis of immunemediated inflammatory diseases. Abul K. Abbas UCSF
 Tolerance, autoimmunity and the pathogenesis of immunemediated inflammatory diseases Abul K. Abbas UCSF Balancing lymphocyte activation and control Activation Effector T cells Tolerance Regulatory T cells
Question 1. Kupffer cells, microglial cells and osteoclasts are all examples of what type of immune system cell?
 Abbas Chapter 2: Sarah Spriet February 8, 2015 Question 1. Kupffer cells, microglial cells and osteoclasts are all examples of what type of immune system cell? a. Dendritic cells b. Macrophages c. Monocytes
Tumor Microenvironment and Immune Suppression
 Tumor Microenvironment and Immune Suppression Hassane M. Zarour,, MD Department of Medicine, Division of Hematology-Oncology, University of Pittsburgh Cancer Institute Hallmarks of Cancer: The Next Generation
Central tolerance. Mechanisms of Immune Tolerance. Regulation of the T cell response
 Immunoregulation: A balance between activation and suppression that achieves an efficient immune response without damaging the host. Mechanisms of Immune Tolerance ACTIVATION (immunity) SUPPRESSION (tolerance)
Mechanisms of Immune Tolerance
 Immunoregulation: A balance between activation and suppression that achieves an efficient immune response without damaging the host. ACTIVATION (immunity) SUPPRESSION (tolerance) Autoimmunity Immunodeficiency
ACTIVATION OF T LYMPHOCYTES AND CELL MEDIATED IMMUNITY
 ACTIVATION OF T LYMPHOCYTES AND CELL MEDIATED IMMUNITY The recognition of specific antigen by naïve T cell induces its own activation and effector phases. T helper cells recognize peptide antigens through
Autoimmunity. Autoimmunity arises because of defects in central or peripheral tolerance of lymphocytes to selfantigens
 Autoimmunity Autoimmunity arises because of defects in central or peripheral tolerance of lymphocytes to selfantigens Autoimmune disease can be caused to primary defects in B cells, T cells and possibly
Advances in Cancer Immunotherapy
 Advances in Cancer Immunotherapy Immunology 101 for the Non-Immunologist Arnold H. Zea, PhD azea@lsuhsc.edu Disclosures No relevant financial relationships to disclose This presentation does not contain
Medical Virology Immunology. Dr. Sameer Naji, MB, BCh, PhD (UK) Head of Basic Medical Sciences Dept. Faculty of Medicine The Hashemite University
 Head of Basic Medical Sciences Dept. Faculty of Medicine The Hashemite University") Medical Virology Immunology Dr. Sameer Naji, MB, BCh, PhD (UK) Head of Basic Medical Sciences Dept. Faculty of Medicine The Hashemite University Human blood cells Phases of immune responses Microbe Naïve
Medical Virology Immunology Dr. Sameer Naji, MB, BCh, PhD (UK) Head of Basic Medical Sciences Dept. Faculty of Medicine The Hashemite University Human blood cells Phases of immune responses Microbe Naïve
Lecture outline. Immunological tolerance and immune regulation. Central and peripheral tolerance. Inhibitory receptors of T cells. Regulatory T cells
 1 Immunological tolerance and immune regulation Abul K. Abbas UCSF 2 Lecture outline Central and peripheral tolerance Inhibitory receptors of T cells Regulatory T cells 1 The immunological equilibrium:
DNA vaccine, peripheral T-cell tolerance modulation 185
 Subject Index Airway hyperresponsiveness (AHR) animal models 41 43 asthma inhibition 45 overview 41 mast cell modulation of T-cells 62 64 respiratory tolerance 40, 41 Tregs inhibition role 44 respiratory
Scott Abrams, Ph.D. Professor of Oncology, x4375 Kuby Immunology SEVENTH EDITION
 Scott Abrams, Ph.D. Professor of Oncology, x4375 scott.abrams@roswellpark.org Kuby Immunology SEVENTH EDITION CHAPTER 11 T-Cell Activation, Differentiation, and Memory Copyright 2013 by W. H. Freeman and
Immune Regulation and Tolerance
 Immune Regulation and Tolerance Immunoregulation: A balance between activation and suppression of effector cells to achieve an efficient immune response without damaging the host. Activation (immunity)
Immunological Aspects of Parasitic Diseases in Immunocompromised Individuals. Taniawati Supali. Department of Parasitology
 Immunological Aspects of Parasitic Diseases in Immunocompromised Individuals Taniawati Supali Department of Parasitology 1 Defense mechanism in human Th17 (? ) Acute Chronic Th1 Th 2 Intracellular Treg
CYTOKINE RECEPTORS AND SIGNAL TRANSDUCTION
 CYTOKINE RECEPTORS AND SIGNAL TRANSDUCTION What is Cytokine? Secreted popypeptide (protein) involved in cell-to-cell signaling. Acts in paracrine or autocrine fashion through specific cellular receptors.
Innate Immunity. Chapter 3. Connection Between Innate and Adaptive Immunity. Know Differences and Provide Examples. Antimicrobial peptide psoriasin
 Chapter Know Differences and Provide Examples Innate Immunity kin and Epithelial Barriers Antimicrobial peptide psoriasin -Activity against Gram (-) E. coli Connection Between Innate and Adaptive Immunity
The Adaptive Immune Responses
 The Adaptive Immune Responses The two arms of the immune responses are; 1) the cell mediated, and 2) the humoral responses. In this chapter we will discuss the two responses in detail and we will start
Supporting Information
 Supporting Information Aldridge et al. 10.1073/pnas.0900655106 Fig. S1. Flow diagram of sublethal (a) and lethal (b) influenza virus infections. (a) Infection of lung epithelial cells by influenza virus
T cell maturation. T-cell Maturation. What allows T cell maturation?
 T-cell Maturation What allows T cell maturation? Direct contact with thymic epithelial cells Influence of thymic hormones Growth factors (cytokines, CSF) T cell maturation T cell progenitor DN DP SP 2ry
T Lymphocyte Activation and Costimulation. FOCiS. Lecture outline
 1 T Lymphocyte Activation and Costimulation Abul K. Abbas, MD UCSF FOCiS 2 Lecture outline T cell activation Costimulation, the B7:CD28 family Inhibitory receptors of T cells Targeting costimulators for
Improving cancer immunotherapy by targeting tumorinduced immune suppression
 Improving cancer immunotherapy by targeting tumorinduced immune suppression Author J. Stewart, Trina, J. Smyth, Mark Published 2011 Journal Title Cancer and Metastasis Reviews DOI https://doi.org/10.1007/s10555-011-9280-5
Immune response to infection
 Immune response to infection Dr. Sandra Nitsche (Sandra.Nitsche@rub.de ) 20.06.2018 1 Course of acute infection Typical acute infection that is cleared by an adaptive immune reaction 1. invasion of pathogen
Cytokine Arrays Reveal Black Ops Tactics of Tumor-induced Immunosuppression
 Cytokine Arrays Reveal Black Ops Tactics of Tumor-induced Immunosuppression Jarad J Wilson, Ph.D. Technical Support & Marketing Specialist Ruo-Pan Huang, MD, Ph.D. Founder and CEO What are Antibody Arrays?
Overview of the immune system
 Overview of the immune system Immune system Innate (nonspecific) 1 st line of defense Adaptive (specific) 2 nd line of defense Cellular components Humoral components Cellular components Humoral components
Innate Immunity II. Integration. Lindsay Nicholson Advanced Immunology L2
 Innate Immunity II Integration Lindsay Nicholson Advanced Immunology L2 l.nicholson@bristol.ac.uk Lecture 1 Defining Innate Immunity Recognition and effector mechanisms (I) Lecture 2 Recognition and effector
Basis of Immunology and
 Basis of Immunology and Immunophysiopathology of Infectious Diseases Jointly organized by Institut Pasteur in Ho Chi Minh City and Institut Pasteur with kind support from ANRS & Université Pierre et Marie
Innate Immunity. Connection Between Innate and Adaptive Immunity. Know Differences and Provide Examples Chapter 3. Antimicrobial peptide psoriasin
 Know Differences and Provide Examples Chapter * Innate Immunity * kin and Epithelial Barriers * Antimicrobial peptide psoriasin -Activity against Gram (-) E. coli Connection Between Innate and Adaptive
Immunological Tolerance
 Immunological Tolerance Introduction Definition: Unresponsiveness to an antigen that is induced by exposure to that antigen Tolerogen = tolerogenic antigen = antigen that induces tolerance Important for
Adaptive immune responses: T cell-mediated immunity
 MICR2209 Adaptive immune responses: T cell-mediated immunity Dr Allison Imrie allison.imrie@uwa.edu.au 1 Synopsis: In this lecture we will discuss the T-cell mediated immune response, how it is activated,
LESSON 2: THE ADAPTIVE IMMUNITY
 Introduction to immunology. LESSON 2: THE ADAPTIVE IMMUNITY Today we will get to know: The adaptive immunity T- and B-cells Antigens and their recognition How T-cells work 1 The adaptive immunity Unlike
Cell-Derived Inflammatory Mediators
 Cell-Derived Inflammatory Mediators Introduction about chemical mediators in inflammation Mediators may be Cellular mediators cell-produced or cell-secreted derived from circulating inactive precursors,
Targeting tumour associated macrophages in anti-cancer therapies. Annamaria Gal Seminar Series on Drug Discovery Budapest 5 January 2018
 Targeting tumour associated macrophages in anti-cancer therapies Annamaria Gal Seminar Series on Drug Discovery Budapest 5 January 2018 Macrophages: Professional phagocytes of the myeloid lineage APC,
Diseases of Immunity 2017 CL Davis General Pathology. Paul W. Snyder, DVM, PhD Experimental Pathology Laboratories, Inc.
 Diseases of Immunity 2017 CL Davis General Pathology Paul W. Snyder, DVM, PhD Experimental Pathology Laboratories, Inc. Autoimmunity Reflects a loss of immunologic tolerance Mechanisms Auto-antibodies
Examples of questions for Cellular Immunology/Cellular Biology and Immunology
 Examples of questions for Cellular Immunology/Cellular Biology and Immunology Each student gets a set of 6 questions, so that each set contains different types of questions and that the set of questions
Hematopoiesis. Hematopoiesis. Hematopoiesis
 Chapter. Cells and Organs of the Immune System Hematopoiesis Hematopoiesis- formation and development of WBC and RBC bone marrow. Hematopoietic stem cell- give rise to any blood cells (constant number,
Cytokines (II) Dr. Aws Alshamsan Department of Pharmaceu5cs Office: AA87 Tel:
 Dr. Aws Alshamsan Department of Pharmaceu5cs Office: AA87 Tel:") Cytokines (II) Dr. Aws Alshamsan Department of Pharmaceu5cs Office: AA87 Tel: 4677363 aalshamsan@ksu.edu.sa Learning Objectives By the end of this lecture you will be able to: 1 Understand the physiological
Cytokines (II) Dr. Aws Alshamsan Department of Pharmaceu5cs Office: AA87 Tel: 4677363 aalshamsan@ksu.edu.sa Learning Objectives By the end of this lecture you will be able to: 1 Understand the physiological
Determinants of Immunogenicity and Tolerance. Abul K. Abbas, MD Department of Pathology University of California San Francisco
 Determinants of Immunogenicity and Tolerance Abul K. Abbas, MD Department of Pathology University of California San Francisco EIP Symposium Feb 2016 Why do some people respond to therapeutic proteins?
Innate immunity. Abul K. Abbas University of California San Francisco. FOCiS
 1 Innate immunity Abul K. Abbas University of California San Francisco FOCiS 2 Lecture outline Components of innate immunity Recognition of microbes and dead cells Toll Like Receptors NOD Like Receptors/Inflammasome
There are 2 major lines of defense: Non-specific (Innate Immunity) and. Specific. (Adaptive Immunity) Photo of macrophage cell
 and. Specific. (Adaptive Immunity) Photo of macrophage cell") There are 2 major lines of defense: Non-specific (Innate Immunity) and Specific (Adaptive Immunity) Photo of macrophage cell Development of the Immune System ery pl neu mφ nk CD8 + CTL CD4 + thy TH1 mye
There are 2 major lines of defense: Non-specific (Innate Immunity) and Specific (Adaptive Immunity) Photo of macrophage cell Development of the Immune System ery pl neu mφ nk CD8 + CTL CD4 + thy TH1 mye
Immunology. T-Lymphocytes. 16. Oktober 2014, Ruhr-Universität Bochum Karin Peters,
 Immunology T-Lymphocytes 16. Oktober 2014, Ruhr-Universität Bochum Karin Peters, karin.peters@rub.de The role of T-effector cells in the immune response against microbes cellular immunity humoral immunity
Supplemental Table I.
 Supplemental Table I Male / Mean ± SEM n Mean ± SEM n Body weight, g 29.2±0.4 17 29.7±0.5 17 Total cholesterol, mg/dl 534.0±30.8 17 561.6±26.1 17 HDL-cholesterol, mg/dl 9.6±0.8 17 10.1±0.7 17 Triglycerides,
Scott Abrams, Ph.D. Professor of Oncology, x4375 Kuby Immunology SEVENTH EDITION
 Scott Abrams, Ph.D. Professor of Oncology, x4375 scott.abrams@roswellpark.org Kuby Immunology SEVENTH EDITION CHAPTER 13 Effector Responses: Cell- and Antibody-Mediated Immunity Copyright 2013 by W. H.
Tolerance 2. Regulatory T cells; why tolerance fails. FOCiS. Lecture outline. Regulatory T cells. Regulatory T cells: functions and clinical relevance
 1 Tolerance 2. Regulatory T cells; why tolerance fails Abul K. Abbas UCSF FOCiS 2 Lecture outline Regulatory T cells: functions and clinical relevance Pathogenesis of autoimmunity: why selftolerance fails
Corso di Laurea Specialistica in Biotecnologie Molecolari aa 2006/2007 Presentazione di Immunologia Molecolare INTERFERON GAMMA.
 Corso di Laurea Specialistica in Biotecnologie Molecolari aa 2006/2007 Presentazione di Immunologia Molecolare INTERFERON GAMMA Valentina Grosso The Inteferons 1957: Isaacs and Lindenmann discovered a
Supplemental Figure 1. Signature gene expression in in vitro differentiated Th0, Th1, Th2, Th17 and Treg cells. (A) Naïve CD4 + T cells were cultured
 Naïve CD4 + T cells were cultured") Supplemental Figure 1. Signature gene expression in in vitro differentiated Th0, Th1, Th2, Th17 and Treg cells. (A) Naïve CD4 + T cells were cultured under Th0, Th1, Th2, Th17, and Treg conditions. mrna
Supplemental Figure 1. Signature gene expression in in vitro differentiated Th0, Th1, Th2, Th17 and Treg cells. (A) Naïve CD4 + T cells were cultured under Th0, Th1, Th2, Th17, and Treg conditions. mrna
Chapter 13: Cytokines
 Chapter 13: Cytokines Definition: secreted, low-molecular-weight proteins that regulate the nature, intensity and duration of the immune response by exerting a variety of effects on lymphocytes and/or
Structure and Function of Antigen Recognition Molecules
 MICR2209 Structure and Function of Antigen Recognition Molecules Dr Allison Imrie allison.imrie@uwa.edu.au 1 Synopsis: In this lecture we will examine the major receptors used by cells of the innate and
Immunology for the Rheumatologist
 Immunology for the Rheumatologist Rheumatologists frequently deal with the immune system gone awry, rarely studying normal immunology. This program is an overview and discussion of the function of the
Immunity and Infection. Chapter 17
 Immunity and Infection Chapter 17 The Chain of Infection Transmitted through a chain of infection (six links) Pathogen: Disease causing microorganism Reservoir: Natural environment of the pathogen Portal
Immune Checkpoints. PD Dr med. Alessandra Curioni-Fontecedro Department of Hematology and Oncology Cancer Center Zurich University Hospital Zurich
 Immune Checkpoints PD Dr med. Alessandra Curioni-Fontecedro Department of Hematology and Oncology Cancer Center Zurich University Hospital Zurich Activation of T cells requires co-stimulation Science 3
Immunology Lecture 4. Clinical Relevance of the Immune System
 Immunology Lecture 4 The Well Patient: How innate and adaptive immune responses maintain health - 13, pg 169-181, 191-195. Immune Deficiency - 15 Autoimmunity - 16 Transplantation - 17, pg 260-270 Tumor
REPROGRAMING IMMUNITY IN RENAL CELL CARCINOMA
 REPROGRAMING IMMUNITY IN RENAL CELL CARCINOMA RETHINKING TYROSINE KINASE INHIBITORS Dr. L.M. Antón Aparicio. Complejo Universitario de La Coruña INTRODUCTION Angiogenesis, which is regulated by a fine
Regulation of anti-tumor immunity through migration of immune cell subsets within the tumor microenvironment Thomas F. Gajewski, M.D., Ph.D.
 Regulation of anti-tumor immunity through migration of immune cell subsets within the tumor microenvironment Thomas F. Gajewski, M.D., Ph.D. Professor, Departments of Pathology and Medicine Program Leader,
TCR, MHC and coreceptors
 Cooperation In Immune Responses Antigen processing how peptides get into MHC Antigen processing involves the intracellular proteolytic generation of MHC binding proteins Protein antigens may be processed
Lymphoid System: cells of the immune system. Answer Sheet
 Lymphoid System: cells of the immune system Answer Sheet Q1 Which areas of the lymph node have most CD3 staining? A1 Most CD3 staining is present in the paracortex (T cell areas). This is towards the outside
Title: NATURAL KILLER CELL FUNCTIONS AND SURFACE RECEPTORS
 LECTURE: 14 Title: NATURAL KILLER CELL FUNCTIONS AND SURFACE RECEPTORS LEARNING OBJECTIVES: The student should be able to: Describe the general morphology of the NK-cells. Enumerate the different functions
Animal Models to Understand Immunity
 Animal Models to Understand Immunity Hussein El Saghire hesaghir@sckcen.be Innate Adaptive immunity Immunity MAPK and NF-kB TLR pathways receptors Fast Slow Non-specific Specific NOD-like receptors T-cell
Myeloid-derived suppressor cell
 JJIAO 30 4 : 271 278, 2012 Myeloid-derived suppressor cell 1 1 Myeloid-derived suppressor cells MDSC MDSC T MDSC MDSC MDSC MDSC MDSC myeloid-derived suppressor cells MDSC MDSC, myeloid-derived suppressor
5% of patients with genetic immunodeficiency develop a cancer during their lifetime (200x)
") Immune surveillance 5% of patients with genetic immunodeficiency develop a cancer during their lifetime (200x) Transplanted patients following an immunosuppressor therapy are 80 times more likely to develop
Immune surveillance 5% of patients with genetic immunodeficiency develop a cancer during their lifetime (200x) Transplanted patients following an immunosuppressor therapy are 80 times more likely to develop
Genetics. Environment. You Are Only 10% Human. Pathogenesis of IBD. Advances in the Pathogenesis of IBD: Genetics Leads to Function IBD
 Advances in the Pathogenesis of IBD: Genetics Leads to Function Pathogenesis of IBD Environmental Factors Microbes Scott Plevy, MD Associate Professor of Medicine, Microbiology & Immunology UNC School
Cigarette Smoke Exposure and HIV-Related Neurologic Disease Progression Basic Mechanisms and Clinical Consequences
 Cigarette Smoke Exposure and HIV-Related Neurologic Disease Progression Basic Mechanisms and Clinical Consequences Walter Royal, III, MD Professor of Neurology University of Maryland School of Medicine
11/25/2017. THE IMMUNE SYSTEM Chapter 43 IMMUNITY INNATE IMMUNITY EXAMPLE IN INSECTS BARRIER DEFENSES INNATE IMMUNITY OF VERTEBRATES
 THE IMMUNE SYSTEM Chapter 43 IMMUNITY INNATE IMMUNITY EXAMPLE IN INSECTS Exoskeleton made of chitin forms the first barrier to pathogens Digestive system is protected by a chitin-based barrier and lysozyme,
Cutaneous Immunology: Innate Immune Responses. Skin Biology Lecture Series
 Cutaneous Immunology: Innate Immune Responses Skin Biology Lecture Series The Immune Response: Innate and Adaptive Components Source: Wolff, Goldsmith, Katz, Gilchrest, Paller, Leffell. Fitzpatrick s Dermatology
M.Sc. III Semester Biotechnology End Semester Examination, 2013 Model Answer LBTM: 302 Advanced Immunology
 Code : AS-2246 M.Sc. III Semester Biotechnology End Semester Examination, 2013 Model Answer LBTM: 302 Advanced Immunology A. Select one correct option for each of the following questions:- 2X10=10 1. (b)
PBS Class #2 Introduction to the Immune System part II Suggested reading: Abbas, pgs , 27-30
 PBS 803 - Class #2 Introduction to the Immune System part II Suggested reading: Abbas, pgs. 15-25, 27-30 Learning Objectives Compare and contrast the maturation of B and T lymphocytes Compare and contrast
Unit 5 The Human Immune Response to Infection
 Unit 5 The Human Immune Response to Infection Unit 5-page 1 FOM Chapter 21 Resistance and the Immune System: Innate Immunity Preview: In Chapter 21, we will learn about the branch of the immune system
Chapter 22: The Lymphatic System and Immunity
 Bio40C schedule Lecture Immune system Lab Quiz 2 this week; bring a scantron! Study guide on my website (see lab assignments) Extra credit Critical thinking questions at end of chapters 5 pts/chapter Due
FOCiS. Lecture outline. The immunological equilibrium: balancing lymphocyte activation and control. Immunological tolerance and immune regulation -- 1
 1 Immunological tolerance and immune regulation -- 1 Abul K. Abbas UCSF FOCiS 2 Lecture outline Principles of immune regulation Self-tolerance; mechanisms of central and peripheral tolerance Inhibitory
Melanoma gene expression profiles to identify mechanisms of tumor resistance
 Melanoma gene expression profiles to identify mechanisms of tumor resistance Helena Harlin Human Immunologic Monitoring Facility University of Chicago Introduction High frequencies of melanoma antigen-specific
Innate immune regulation of T-helper (Th) cell homeostasis in the intestine
 cell homeostasis in the intestine") Innate immune regulation of T-helper (Th) cell homeostasis in the intestine Masayuki Fukata, MD, Ph.D. Research Scientist II Division of Gastroenterology, Department of Medicine, F. Widjaja Foundation,
Innate immune regulation of T-helper (Th) cell homeostasis in the intestine Masayuki Fukata, MD, Ph.D. Research Scientist II Division of Gastroenterology, Department of Medicine, F. Widjaja Foundation,
CD40L TCR IL-12 TLR-L
 CD40L B cells plasmacells Neutrophils TCR inkt cells IL-12 Ab production Can inkt cells modulate the cytokine profile of neutrophils? TLR-L CD4+ and CD8+ T cell responses 1. The invariant TCR expressed
CYTOKINES. Based on: Cellular and Molecular Immunology, 4 th ed.,abbas A.K., Lichtman A.H. and Pober J.S. Sounders company; Philadelphia, 2010.
 CYTOKINES Based on: Cellular and Molecular Immunology, 4 th ed.,abbas A.K., Lichtman A.H. and Pober J.S. Sounders company; Philadelphia, 2010. 1 What are cytokines? Glycoproteins (15 25 kda): Interleukins
T Cell Activation, Costimulation and Regulation
 1 T Cell Activation, Costimulation and Regulation Abul K. Abbas, MD University of California San Francisco 2 Lecture outline T cell antigen recognition and activation Costimulation, the B7:CD28 family
Immune System AP SBI4UP
 Immune System AP SBI4UP TYPES OF IMMUNITY INNATE IMMUNITY ACQUIRED IMMUNITY EXTERNAL DEFENCES INTERNAL DEFENCES HUMORAL RESPONSE Skin Phagocytic Cells CELL- MEDIATED RESPONSE Mucus layer Antimicrobial
Newly Recognized Components of the Innate Immune System
 Newly Recognized Components of the Innate Immune System NOD Proteins: Intracellular Peptidoglycan Sensors NOD-1 NOD-2 Nod Protein LRR; Ligand Recognition CARD RICK I-κB p50 p65 NF-κB Polymorphisms in Nod-2
Potential Rebalancing of the Immune System by Anti-CD52 Therapy
 Potential Rebalancing of the Immune System by Anti-CD52 Therapy Johanne Kaplan, PhD VP Neuroimmunology Research Genzyme March 26, 2013 RESTRICTED USE SEE TRAINING MEMO 2011 DO Genzyme NOT 1COPY Corporation
RAISON D ETRE OF THE IMMUNE SYSTEM:
 RAISON D ETRE OF THE IMMUNE SYSTEM: To Distinguish Self from Non-Self Thereby Protecting Us From Our Hostile Environment. Innate Immunity Acquired Immunity Innate immunity: (Antigen nonspecific) defense
HLA and antigen presentation. Department of Immunology Charles University, 2nd Medical School University Hospital Motol
 HLA and antigen presentation Department of Immunology Charles University, 2nd Medical School University Hospital Motol MHC in adaptive immunity Characteristics Specificity Innate For structures shared
Third line of Defense
 Chapter 15 Specific Immunity and Immunization Topics -3 rd of Defense - B cells - T cells - Specific Immunities Third line of Defense Specific immunity is a complex interaction of immune cells (leukocytes)
Identification of Myeloid Derived Suppressor Cells in Tumor Bearing Dogs. A Thesis. Matthew G. Sherger
 Identification of Myeloid Derived Suppressor Cells in Tumor Bearing Dogs. A Thesis Presented in Partial Fulfillment of the Requirements for the Degree Master of Science in the Graduate School of The Ohio
Dendritic cells in cancer immunotherapy Aimin Jiang
 Dendritic cells in cancer immunotherapy Aimin Jiang Feb. 11, 2014 Dendritic cells at the interface of innate and adaptive immune responses Dendritic cells: initiators of adaptive immune responses Dendritic
The Immune System. These are classified as the Innate and Adaptive Immune Responses. Innate Immunity
 The Immune System Biological mechanisms that defend an organism must be 1. triggered by a stimulus upon injury or pathogen attack 2. able to counteract the injury or invasion 3. able to recognise foreign
Chapter 1. Chapter 1 Concepts. MCMP422 Immunology and Biologics Immunology is important personally and professionally!
 MCMP422 Immunology and Biologics Immunology is important personally and professionally! Learn the language - use the glossary and index RNR - Reading, Note taking, Reviewing All materials in Chapters 1-3
CANCER IMMUNOPATHOLOGY. Eryati Darwin Faculty of Medicine Andalas University
 CANCER IMMUNOPATHOLOGY Eryati Darwin Faculty of Medicine Andalas University Padang 18 Mei 2013 INTRODUCTION Tumor: cells that continue to replicate, fail to differentiate into specialized cells, and become
Chapter 1. Full file at
 Chapter 1 1. Which is the best definition of immunity? Answer: B A. The state of having been exposed to a pathogen repeatedly B. The state of being resistant to reinfection with a pathogen C. When an individual
Chapter 7 Conclusions
 VII-1 Chapter 7 Conclusions VII-2 The development of cell-based therapies ranging from well-established practices such as bone marrow transplant to next-generation strategies such as adoptive T-cell therapy
2. The normal of the gut, and vagina keep the growth of pathogens in check. 3. in the respiratory tract sweep out bacteria and particles.
 Chapter 39 Immunity I. Three Lines of Defense A. Surface Barriers to Invasion 1. is an important barrier. 2. The normal of the gut, and vagina keep the growth of pathogens in check. 3. in the respiratory