Predicting Changes in Cardiovascular Risk Factors in Type 2. Diabetes in the Post-UKPDS Era: Longitudinal Analysis of the
|
|
|
- Lambert Fisher
- 5 years ago
- Views:
Transcription
1 Predicting Changes in Cardiovascular Risk Factors in Type 2 Diabetes in the Post-UKPDS Era: Longitudinal Analysis of the Swedish National Diabetes Register Aliasghar Ahmad Kiadaliri 1,2,3* ; Philip M. Clarke 4 ; Ulf-G. Gerdtham 1,2,5 ; Peter Nilsson 6 ; Björn Eliasson 7 ; Soffia Gudbjörnsdottir 7 ; Katarina Steen Carlsson 1,2. 1 Division of Health Economics, Department of Clinical Sciences, Malmö University Hospital, Lund University, Sweden 2 Health Economics & Management, Institute of Economic Research, Lund University,, Sweden 3 Department of Health Management and Economics, School of Public Health, Tehran University of Medical Sciences, Iran 4 School of Public Health, University of Sydney, Australia 5 Department of Economics, Lund University, Sweden 6 Department of Clinical Sciences, Malmö University Hospital, Lund University, Sweden 7 Department of Medicine, Sahlgrenska University Hospital, University of Gothenburg, Sweden *Corresponding author: Aliasghar Ahmad Kiadaliri Address: Malmö University Hospital, CRC, Entrance 72, House 28, Plan 10, Room 027, Malmö, Sweden. aliasghar.ahmad_kiadaliri@med.lu.se Tel: Fax:
2 Abstract Aim of current study was to provide updated time-path equations for risk factors of type 2 diabetes-related cardiovascular complications for application in risk calculators and health economic models. Observational data from the Swedish National Diabetes Register were analysed using Generalized Methods of Moments estimation for dynamic panel models (N=5,043, aged years at diagnosis in ). Validation was performed using persons diagnosed in 2005 (n=414). Results were compared with the UKPDS outcome model. The value of the risk factor in the previous year was the main predictor of the current value of the risk factor. People with high (low) values of risk factor in year of diagnosis experienced a decreasing (increasing) trend over time. BMI was associated with elevations in all risk factors, while older age at diagnosis and being female generally corresponded to lower levels of risk factors. Updated time-path equations predicted risk factors more precisely than UKPDS outcome model equations in a Swedish population. Findings indicate new time paths for cardiovascular risk factors in the post-ukpds era. The validation analysis confirmed the importance of updating the equations as new data become available; otherwise, the results of health economic analyses may be biased. Key words: type 2 diabetes, cardiovascular disease, dynamic panel data, Sweden. 2
3 Introduction Type 2 diabetes is well known as a risk factor for cardiovascular disease (CVD) [1, 2], with a risk 2-4 times higher for patients with diabetes compared with the general population [3, 4]. The risk of death is doubled for persons with type 2 diabetes [5], and more than 75% of mortality among patients with type 2 diabetes is attributed to CVD [6]. Some of the main risk factors for increased risk of CVD deaths in patients with type 2 diabetes include: level of serum lipids, hyperglycaemia, systolic blood pressure (BP), smoking, and obesity [7 11]. One or more of these risk factors have also been shown to play a role in predicting the occurrence of other types of complications including amputation, renal impairment and eye-related complications [12, 13]. These risk factors are commonly used in clinical risk equations [14, 15] as well as health economic simulation models [16]. There is increasing interest in forecasting outcomes for people with diabetes, based on demographic and clinical characteristics. For example, it is recommended that the intensity of treatment for diabetes should be determined in part by the level of cardiovascular risk [17]. More generally, risk calculators and outcome tables [18] have been developed to inform patients with a given set of clinical characteristics of their risk of events and other outcomes such as life expectancy. Risk modelling is also used by health economists when quantifying the benefits of new technologies and interventions as well as the reductions in the cost of complications through better management of the disease. A key aspect of risk modelling is the understanding of how risk factors change over time, since these changes influence the progression of the disease and the risk of 3
4 complications. In the context of type 2 diabetes, the UKPDS outcome model [13] is the main source of predicting changes in risk factors over time and is widely used in health economic simulation models. One problem with using this model is that the levels and trends in common risk factors may be different across regions and over time owing to changes in clinical practice patterns, demographic characteristics of patients, and potentially other factors such as lifestyle [19]. For example, two recent studies have shown that mean BMI and systolic BP have substantially changed worldwide since 1980 [20, 21], implying that estimations based on data from 1980 may not reflect the current situation. These differences should be taken into account when making risk predictions. Studying the change in risk factors over time requires longitudinal data which are not readily available in many countries. The initiation of the Swedish National Diabetes Register (NDR) in 1996, including data on different risk factors, has provided the opportunity to examine the change in risk factors in people with diabetes in routine clinical practice over time. In this study, the time path during for five cardiovascular risk factors (HbA1c, systolic BP, BMI, total to HDL cholesterol ratio (TC: HDL), and LDL cholesterol) was predicted for persons newly diagnosed with type 2 diabetes in Changes in risk factors over time were analysed in detail and compared with equations from the UKPDS outcome model to investigate the need for updating health economic simulation models where the assessment of long-term consequences of risk factors is a key component. 4
5 Material and methods The Swedish National Diabetes Register (NDR) The NDR was established aiming for, inter alia, follow-up of quality indicators and benchmarking against national guidelines, as has been described elsewhere [22]. Individual-level demographic and clinical data on adults aged 18 years who have provided informed consent to participate are reported to the NDR by trained nurses or physicians in all hospital diabetes outpatient clinics and primary health care centres at least once a year. Participation in the NDR is not compulsory. Subjects Altogether 5,043 individuals in the NDR met the general inclusion criteria for this study: (1) type 2 diabetes onset during ; (2) years old at diagnosis; (3) at least three observations per individual as this is the minimum data requirement for our model; (4) no missing values on smoking or BMI in the year of diagnosis as these were used as covariates in all equations (1449 patients were excluded due to missing values on one or both of these variables). The definition of type 2 diabetes was treatment with diet or oral hypoglycaemic agent (OHA) only regardless the age at onset of diabetes, or treatment with insulin alone or in combination with OHA and age 40 years at onset of diabetes. Individuals were included in the analysis if data were available at diagnosis and at two or more measurements after diagnosis for the risk factor under consideration. Sample sizes ranged from n=2,281 (LDL cholesterol) to n=4,492 (BMI). While data on HbA1c, systolic BP and BMI were available in the year 2001, the lipid levels were reported to the 5
6 NDR starting in Hence, the sample sizes are smaller in lipid level estimations. Data on risk factor development were available from diabetes diagnosis to the end of Clinical and demographic characteristics Age at diagnosis, gender, duration of diabetes, BMI, smoking, systolic BP, HbA 1c, TC:HDL, and LDL cholesterol were used in the analyses. The level of HbA 1c was measured by the high-performance liquid chromatography (HPLC) Mono-S method following national standards in Sweden. For this study, all HbA 1c values were transformed to the Diabetes Control and Complications Trial (DCCT) standard levels using the formula HbA 1c (DCCT) = (0.923 HbA 1c [Mono-S]) [23]. Blood pressure recording in the NDR is the mean value of two readings (Korotkoff 1 5) in the supine position according to national guidelines [24]. A smoker was defined as an individual who smoked at least one cigarette per day or used a pipe daily, or who had stopped smoking within the previous 3 months. In cases where there was more than one measurement per year, the yearly mean was used in the analysis. Statistical analysis Keeping the UKPDS outcome model in mind, the time path for risk factors after diagnosis was analysed using a dynamic model where the current level of the risk factor (e.g. HbA 1c ) was allowed to be influenced by its value in the preceding year. Our model included a 1-year lag of the risk factor as follows: 6
7 RF it RF X i, t 1 j itj it (Equation 1) and it i v it, (Equation 2) where RF it represents the value of the risk factor for ith patient (i = 1 n) in year t after diagnosis of diabetes (t = 1 T), RF i,t-1 is the 1-year lag of the risk factor, X itj is a vector of the explanatory variables (j=1,2,,j), and β is a vector of coefficients. µ i is a patientspecific effect which was allowed to vary between patients but had to be constant within patients; ν it is the identically and independently distributed (i.i.d.) error term with mean zero and variance σ ν. Explanatory variables included the clinical and demographic variables presented above. In addition, to consider the observed decline in HbA 1c in the first year after diagnosis, an indicator variable was included in this equation. Moreover, the squares of continuous variables were included in all equations to consider any quadratic relationship. Due to skewness in the variable of duration of diabetes, the log transformation of this variable was used in the model. As the model in Equation (1) is dynamic, β measures the short-term effect of one unit change in the covariate in year t on the risk factor. The long-term effect (i.e. change in the risk factor in year t and all future years) due to one unit change in the covariate in the year t is measured as follows: 7
8 1 (Equation 3) Arellano-Bover/Blundell-Bond [25, 26] dynamic panel estimators were used to estimate the risk factor development over up to 7 years after diagnosis of diabetes. Using the Generalized Method of Moments (GMM) developed by Hansen [27], these estimators define the number of lags of the dependent variable, the predetermined variables, and the endogenous variables to be included for the instrument to be valid; and how to combine these valid instruments with the first differences of the strictly exogenous variables. We used xtabond2 command [28] in Stata version 10 for estimating our equations [29]. The 5% significance level was considered statistically significant in interpretation of results and we also comment on marginally significant results (p<0.10). The direct effects of each covariate on risk factors were examined individually. In the discussion we return to the total effect of each covariate including also the indirect (simultaneous) effect through BMI. Results are illustrated by 5-year predictions using mean values of covariates for two risk profiles: high risk (smoking man with BMI 32) and low risk (nonsmoking woman with BMI 27). External temporal validation The results from the time-path equations were used in an external temporal validation [30, 31]. From the NDR, we selected persons aged diagnosed with type 2 diabetes during 2005, with risk factor measurement during (n=414). We first predicted the time path of each risk factor using all covariates significant at the 10% level. We 8
9 compared these predictions with the observed values up to 3 years after diagnosis. Thereafter, the observed values were regressed on predicted values to test the one-sided hypothesis of positive correlation (H0: β1 0) [32]. Finally, the performance of our timepath equations relative to those previously reported in the UKPDS outcome model (Table 4 in [13]) was tested by comparing the two sets of predictions with observed values. The model predictions were assessed using the root mean squared error [33]. Results Table 1 shows the clinical characteristics in the year of diagnosis of type 2 diabetes for 5,043 persons in the total sample (column 1) and for 414 persons in the validation sample (column 2). Some characteristics were significantly different between the total sample and the validation sample in the year of diagnosis (Table 1, column 3). The median follow-up was 4 years with 9,536 (LDL) to 25,447 (BMI) person-years of follow-up data available for the analysis. Although there were missing observations for each risk factor, the results of ANOVA analysis showed that there were no significant differences in the mean of covariates between the available samples and the total sample. Time-path equations Table 2 shows the estimated time-path equations. For each equation, the first column shows the short-term effect of one unit change in the covariate while the second column shows the long-term effect of one unit change in the covariate based on Equation (3). In all equations, the coefficient of the lagged-dependent variable (the value of dependent variable in previous year) was <1, which implied a convergence of risk factor levels over 9
10 time, suggesting a decrease in the differences between individuals. Also, the short-term effect captured only part of the changes in covariates and a significant part of the effect became evident in the long term. Generally, a lower age at diagnosis was associated with a higher level of the risk factor, both in the short and in the long term, in all time-path equations except for systolic BP. In addition, higher BMI was correlated to higher values of all other risk factors. The interpretation of significant effects for each equation was as follows: HbA 1c The one-unit increase in BMI in the current year raised HbA 1c by 0.03% in the long term, after controlling for the other covariates (Table 2, column 1). Higher HbA 1c was predicted for people younger at diagnosis and with longer diabetes duration. There was a tendency for women to have lower HbA 1c (p=0.08). Smoking was an endogenous covariate indicating that current smoking was affected by previous levels of HbA 1c, and/or that unobservable factors were correlated to both smoking status and HbA 1c. Systolic BP BMI was positively associated with higher systolic BP and the short and long-term effects of the one-unit increase in BMI in the current year were 0.02 and 0.03 mmhg, respectively (Table 2, column 2). In the long term, the systolic BP was higher for men (0.12 mmhg) and smokers (0.18 mmhg). 10
11 TC: HDL Older age at diagnosis was related to a lower TC: HDL (Table 2, column 3). The one-unit increase in BMI in the current year increased the TC: HDL by 0.05 units in the long term. The TC: HDL was lower for females. LDL cholesterol LDL was lower for people who were older at diagnosis (Table 2, column 4). The level of LDL decreased with duration and increased with BMI, though at a declining rate. The LDL level was higher for females than for males. BMI BMI was higher for people younger at diagnosis. In the long term, BMI was about two units lower for a person who smoked in the current year than for a non-smoker. BMI increased with diabetes duration. Application of the equations The results from the time-path equations are illustrated by 5-year predictions for two risk profiles in Table 3. A person with a high-risk profile is a smoking man with BMI 32. A person with a low-risk profile is a non-smoking woman with BMI 27. Except for BMI, gender and smoking status, the starting values for other risk factors were chosen to reflect the sample mean value of the risk factors in the year of diagnosis (Table 1, column 1). Since a logit model on smoking (not reported; results available on request) did not show any changes in smoking status, it was assumed that the smoking status at baseline is 11
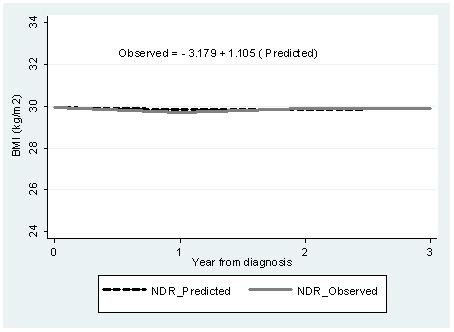
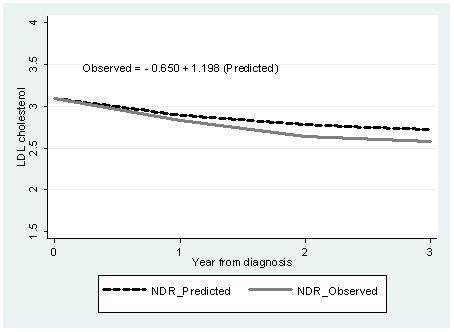
12 stable over time. Actually, 70% of people who smoked at diagnosis and 95% of people who did not smoke at diagnosis had unchanged smoking status at the last measurement. The predictions in Table 3 include the total effect of covariates on risk factors. We found that although both the person in the low-risk profile (Table 3, top) and the person in the high-risk profile (Table 3, bottom) were predicted to achieve a reduction in four out of five risk factors, the person with the high-risk profile would still experience higher risk levels for most risk factors after 5 years. Temporal external validation A temporal external validation was conducted in four sub-groups defined by smoking status and gender from the validation sample consisting of individuals diagnosed with type 2 diabetes in 2005 and registered in the NDR (Table 1, column 2). Figure 1a e shows the results of our external temporal validation for non-smoking males in our validation sample (n=210) (results on smokers and females are available on request). The NDR-predicted values based on the estimated time-path equations in Table 2 (dashed line) corresponded well with the NDR-observed values (solid line), except for systolic BP. The fitted equations in Figure 1a e show the results of regressing observed values on predicted values (positive correlation in all cases; p<0.001). The time paths predicted by corresponding UKPDS outcome model time-path equations (Table 4 in [13]; dotted line in Figure 1a-e) are clearly different from the predicted and observed NDR values. A comparison between the two models showed that the root mean squared error was lower for our NDR equations than for the UKPDS time-path equations (Table 4). The new time-path equations presented in Table 2 fitted the validation data 12
13 more closely than the time-path equations previously developed as part of the UKPDS outcome model. Discussion In this study, the time paths of five major cardiovascular risk factors (HbA 1c, systolic BP, BMI, TC: HDL, and LDL cholesterol) during were predicted for individuals diagnosed with type 2 diabetes in the years in NDR. Using simulation models to predict the development of diabetes-related morbidities and mortalities and their impact on the costs and quality of life are growing in the context of type 2 diabetes. Predicting the changes of risk factors over time and impact of these changes on the progression of complications is a critical part of these models. Most outcome analyses and health economic simulation models in diabetes studies are currently based on results obtained from the seminal UKPDS trial. The UKPDS data are based on older cohort, born in the 1920s and 1930s and even earlier, and diabetes management has, partly as a result of the trial, experienced considerable changes since then. It was of particular interest to update previous equations based on newer data on more recent cohorts. The results of temporal external validation showed that except for systolic BP, the NDR-predicted time paths can accurately simulate the actual time path of risk factors for people not used in model development (Figure 1a e). Particularly with regard to HbA 1c, LDL cholesterol and BMI, the model simulated the observed values fairly well. Compared with the time-path equations in the UKPDS outcome model, our model simulated the time path of risk factors more accurately in Swedish people with type 2 diabetes. 13
14 The value of a risk factor in the preceding year was a significant determinant of the current value of that risk factor. The equations indicated that risk factors converged over time, i.e. risk factors approached a certain limit over time. In addition to the short-term effect, changes in covariates in the current year produced effects that lasted longer (longterm effects). The relative effects of short- and long-term effects differed across the different risk factors. In four out of five risk factors, individuals at a higher age at diagnosis had lower values compared with younger individuals. People with higher BMI had higher levels of all other risk factors. Using GMM estimation provided some advantages. Firstly, the ordinary least squares (OLS) estimator gives biased results in a dynamic model (also known as dynamic panel bias ) [34, 35]. Secondly, it was possible to test for endogeneity where covariates were allowed to depend on past values of the dependent variable, but not on future values of it [27, 28]. Thirdly, GMM estimation has been shown to provide consistent results in panels with few time periods and many individuals [28], and works well for unbalanced panels [36]. Moreover, the dynamic specification of the model also enabled us to distinguish between short and long-term effects of changes in covariates in a single year. Our large sample including more than 5,000 patients with type 2 diabetes provided an excellent opportunity to detect the impact of covariates on risk factors. Moreover, compared with clinical trials, using routine clinical practice data for our prediction may increase the generalizability of our results. We also predicted time-path equations for LDL cholesterol and BMI, which were not estimated by previous studies of people with type 2 diabetes. 14
15 Our results are in line with Clarke et al [13] and Bhargava [37], who also found that the difference between people with different risk levels at diagnosis decreased over time since the coefficients of the lagged dependent variable were <1. In these data, it seems that patients with a higher value of a certain risk factor at diagnosis receive more intensive treatment and subsequently experience a decrease in the level of risk factor. Patients with lower value of certain risk factor seem to experience the inverse trend. Lower BMI in smokers has been shown both in the general population and in type 2 diabetes [9, 38]. Other findings have pointed towards a transient relationship between smoking and BMI [39]. Similar to the time-path equations in the UKPDS outcome model [13], we did not find a significant effect of smoking status on most risk factors. Smoking was still correlated to the risk factors through the indirect effect from BMI where smoking was significant. The negative relationship between age at diagnosis and risk factors implies that younger patients experience a worse risk profile compared with older ones. The result may therefore support more intensive treatment for younger patients. These findings are in line with previous studies. Eliason et al [40] reported from Sweden that patients under 50 years of age at diagnosis were considerably more obese and also had higher HbA 1c levels. Being female was generally associated with a lower level of risk factors which is in line with previous findings in Sweden [41] and possibly explain a lower risk of CVD among women with type 2 diabetes compared with men [11, 13]. The gender difference in risk profiles may be caused by differences in genetic factors, behavioural factors (life style, treatment compliance, etc.), or/and treatment modality (choice of treatment, intensity of 15
16 treatment, etc.). Further studies should explore to what extent these gender differences are modifiable. Somewhat worryingly, the higher coefficient on the lagged variable for BMI compared with other risk factors implies that weight loss is less readily achieved among people with type 2 diabetes. Previous studies using NDR data have shown that maintaining a high BMI was associated with higher risk of coronary heart disease (CHD) and CVD [8] and that BMI was an independent predictor of other risk factors in type 2 diabetes [42]. Compared with the UKPDS outcome model, our time-path equations produced a lower root mean squared error, implying better predictions in the external temporal validation sample of the Swedish NDR population. However, this does not necessarily imply inaccuracy of any of the estimations. The UKPDS outcome model used patients from a different time period, had different length of follow-up, applied a different statistical analysis, and used a trial design where patients were selected based on study criteria. There may also be differences in epidemiological features of UK and Swedish type 2 diabetes patients. We furthermore assume that the UKPDS study has affected the treatment for people with type 2 diabetes, producing changes in risk trajectories. We propose that these changes may be the dominating reason for the differences in results illustrated in Figure 1a e. Hence, there is a need for equations such as those estimated here that predict time paths of risk factors, and that reflect modern clinical practice. Nevertheless, it would be useful to further test the validity of the two sets of time-path equations using information on risk factors from other diabetes populations or ethnics groups. 16
17 The short follow-up limited us to consider only the contemporaneous relationships between risk factors and covariates. It was not possible to examine the lagged effect of covariates on current values of risk factors. Hence, examination of the lagged effect of covariates (e.g. BMI and smoking) on current risk factors is an issue for future research. Study Limitations The results of the study should also be interpreted with the study s limitations in mind. Data on smoking may have been affected by selection bias due to under-reporting by participants and under-recording by health care staff. We did not control for type of treatment when we examined the effect of patients characteristics on the time path of risk factors. Treatment would have been an endogenous covariate in our equations as it is typically determined by the level of risk factors. This strategy has been adopted also in previous studies [13, 37]. The definition of type 2 diabetes used in this study excluded most patients with type 1 diabetes, as <1% were aged <30 years at diagnosis, and <5% had an age at diagnosis of <40 years in different equations. Although there were no exclusion criteria regarding presence or absence of co-morbidities for participation in this study (in contrast to randomized clinical trials), which may have decreased the precision of the results, bringing them closer to routine practice across health centres. The equations were developed based on data in Swedish population and this may limit the generalizability of results to other population. Conclusion 17
18 In sum, the predictions of changes in risk factors over time are needed for informed decision making by clinicians and policy makers. As first step in developing an outcome model for type 2 diabetes in Sweden, the time paths of five major risk factors were predicted here. The results showed the importance of updating the equations as new data become available. The equations presented here can be used by anyone interested in predicting the future level of risk factors using population characteristics of relevance to their specific decision problem. Moreover, using these updated equations in constructing simulation models in health economic studies may result in more accurate models for evaluating alternative treatment strategies for type 2 diabetes. Competing interests: None. Acknowledgement: A.A.K. received funds from the Health Ministry of Iran to perform this research as a part of his PhD thesis. An unrestricted educational grant from Novo Nordisk Ltd is gratefully acknowledged. P.M.C. received funds through a Swedish Council for Working Life and Social Research Visiting Fellowship (dnr ). The Health Economics Programme (HEP) at Lund University receives core funding from FAS (dnr ), a Government Grant for Clinical Research (ALF) and the Skåne Region (Ulf-G. Gerdtham). This work was presented in annual meeting of European Association for the Study of Diabetes (EASD) in Lisbon, September
19 References 1. G. Charpentier, N. Genes, L. Vaur, et al. "Control of diabetes and cardiovascular risk factors in patients with type 2 diabetes: a nationwide French survey". Diabetes Metab, 29: , M. Imazu, K. Sumii, H. Yamamoto, et al. "Influence of type 2 diabetes mellitus on cardiovascular disease mortality: findings from the Hawaii Los Angeles Hiroshima study". Diabetes Res Clin Pract, 57: 61-69, K. Gu, C. Cowie, M. Harris. "Mortality in adults with and without diabetes in a national cohort of the U.S. population, ". Diabetes Care, 21: , P. Gaede, P. Vedel, N. Larsen, et al. "Multifactorial intervention and cardiovascular disease in patients with type 2 diabetes". N Engl J Med, 348: , G. Panzram, "Mortality and survival in type 2 (non-insulin-dependent) diabetes mellitus". Diabetologia, 30: , WA. Muller, "Diabetes mellitus long-time survival". J Insur Med, 30:17 27, J. Stamler, O. Vaccaro, J. D. Neaton, et al. "Diabetes, other risk factors, and 12 year cardiovascular mortality for men screened in the Multiple Risk Factor Intervention Trial". Diabetes Care, 16: , K. Eeg-Olofsson, J. Cederholm, P. M. Nilsson, et al. "Risk of cardiovascular disease and mortality in overweight and obese patients with type 2 diabetes: an observational study in 13,087 patients". Diabetologia, 52:65 73,
20 9. P. M. Nilsson, J. Cederholm, K. Eeg-Olofsson, et al. "Smoking as an independent risk factor for myocardial infarction or stroke in type 2 diabetes: a report from the Swedish National Diabetes Register". Eur J Cardiovasc Prev Rehabil, 16: , R. Pfister, R. Cairns, E. Erdmann, et al. "A clinical risk score for heart failure in patients with type 2 diabetes and macrovascular disease: An analysis of the PROactive study". Int J Cardiol, doi: /j.ijcard B. Zethelius, B. Eliasson, K. Eeg-Olofsson, et al. "A new model for 5-year risk of cardiovascular disease in type 2 diabetes, from the Swedish National Diabetes Register". Diabetes Res Clin Pract, 93: , N. Chaturvedi, L. K. Stevens, J. H. Fuller, et al. "Risk factors, ethnic differences and mortality associated with lower-extremity gangrene and amputation in diabetes: The WHO multinational study of vascular disease in diabetes". Diabetologia, 44 (suppl 2): S65-71, P. M. Clarke, A. M. Gray, A. Briggs, et al. "A model to estimate the lifetime health outcomes of patients with Type 2 diabetes: the United Kingdom Prospective Diabetes Study (UKPDS) Outcomes Model". Diabetologia, 47: , R. J. Stevens, V. Kothari, A. I. Adler, et al. "The UKPDS risk engine: a model for the risk of coronary heart disease in type II diabetes". Clin Sci, 101: , J. Cederholm, K. Eeg-Olofsson, B. Eliasson, et al. "Risk prediction of cardiovascular disease in type 2 diabetes: a risk equation from the Swedish National Diabetes Register". Diabetes Care, 31: ,
21 16. The Mount Hood 4 Modeling Group. "Computer modeling of diabetes and its complications: a report on the Forth Mount Hood Challenge Meeting". Diabetes Care, 30: , National Collaborating Centre for Chronic Conditions. "Type 2 diabetes: national clinical guideline for management in primary and secondary care (update)". Royal College of Physicians, London, J. Leal, A. M. Gray, P. M. Clarke. "Development of life-expectancy tables for people with type 2 diabetes". Eur Heart J, 30: , M. Drummond, M. Barbieri, J. Cook, et al. "Transferability of economic evaluations across jurisdictions: ISPOR Good Research Practice Task Force Report". Value Health, 12(4): , M. M. Finucane, G. A. Stevens, M. J. Cowan, et al. "National, regional, and global trends in body mass index since 1980: systematic analysis of health examination surveys and epidemiological studies with 960 country years and 9.1 million participants". Lancet, 377: , G. Danaei, M. M. Finucane, J. K. Lin, et al. "National, regional, and global trends in systolic blood pressure since 1980: systematic analysis of health examination surveys and epidemiological studies with 786 country years and 5.4 million participants". Lancet, 377: , S. Gudbjornsdottir, J. Cederholm, P. M. Nilsson, et al. "The National Diabetes Register in Sweden: an implementation of the St. Vincent Declaration for Quality Improvement in Diabetes Care". Diabetes Care, 26: ,
22 23. W. Hoelzel, C. Weykamp, J. O. Jeppsson, et al. "IFCC reference system for measurement of hemoglobin A1c in human blood and the national standardization schemes in the United States, Japan, and Sweden: a method-comparison study". Clin Chem, 50: , National Board on Health and Welfare, Stockholm, M. Arellano, O. Bover. Another look at the instrumental variables estimation of error-components models. Journal of Econometrics, 68: 29-51, R. Blundell, S. Bond. "Initial conditions and moment restrictions in dynamic panel data models". Journal of Econometrics, 87: , L. Hansen. "Large sample properties of generalized method of moment estimators". Econometrica, 50: , D. Roodman. "How to do xtabond2: An introduction to difference and system GMM in Stata". The Stata J, 9(1): , StataCorp. "Stata Statistical Software: Release 10". College Station, TX: StataCorp LP, E. W. Steyerberg. "Clinical Prediction Models: A Practical Approach to Development, Validation, and Updating". Springer, New York, D. G. Altman, P. Royston. "What do we mean by validating a prognostic model?". Statist Med, 19: , J. P. C. Kleijnen. "Verification and validation of simulation models". Eur J Oper Res, 82: ,
23 33. R. C. Fair. "Evaluating the predictive accuracy of models". In: Griliches Z, Intriligator MD. (eds) Handbook of Econometrics, Volume III. Elsevier Science Publishers, North Holland, pp ; S. Nickell. "Biases in dynamic models with fixed effects". Econometrica, 49(6): , A. Trognon. "Miscellaneous asymptotic properties of ordinary least squares and maximum likelihood estimators in dynamic error components models". Annales De l'insee, 30-31: , B. Lokshin. "Further results on bias in dynamic unbalanced panel data models with an application to firm R&D investment". UNU-MERIT Working Papers, A. Bhargava. "A longitudinal analysis of the risk factors for diabetes and coronary heart disease in the Framingham Offspring Study". Popul Health Metr, 1:3, US Department of Health and Human Services. The Health Benefits of Smoking Cessation: A Report of the Surgeon General. Rockville, MD: Office on Smoking and Health. DHHS Publication CDC , T. Mizoue, R. Ueda, N. Tokui, et al. "Body mass decrease after initial gain following smoking cessation". Int J Epidemiol, 27 (6): , B. Eliasson, K. Eeg-Olofsson, J. Cederholm, et al. "Antihyperglycaemic treatment of type 2 diabetes: results from a national diabetes register". Diabetes Metab, 33: , E. Fhärm. " Treatment of Cardiovascular Risk Factors in Type 2 Diabetes Time Trends and Clinical Practice". Umeå University Medical Dissertations, New Series No 1326,
24 42. M. Ridderstråle, S. Gudbjörnsdottir, B. Eliasson, et al. "Obesity and cardiovascular risk factors in type 2 diabetes: results from the Swedish National Diabetes Register". J Intern Med, 259: ,
25 Table 1. Total and validation samples characteristics in year of diagnosis of diabetes. Variable Total sample Validation sample No difference (n=5043) (n=414) Mean (±SD) Mean (±SD) p-value (1) a (2) (3) Male (n) Age at diagnosis 56.0 (8.8) 57.0 (8.0) 0.11 HbA1c (%) 7.0 (1.4) 6.8 (1.2) 0.02 BMI (Kg/m2) 29.8 (4.9) 29.8 (4.7) 0.87 Systolic BP (mmhg) (17.9) (16.6) 0.03 TC: HDL b 4.6 (1.4) 4.5 (1.2) 0.12 LDL cholesterol (mmoll -1 ) b 3.1 (1.0) 3.1 (1.0) 0.98 Smokers (proportion, %) <0.01 Female (n) Age at diagnosis 57.0 (9.0) 59.0 (7.0) <0.01 HbA1c (%) 6.9 (1.3) 6.8 (1.1) 0.07 BMI (Kg/m2) 30.7 (5.9) 30.4 (5.7) 0.42 Systolic BP (mmhg) (18.2) (15.6) 0.97 TC: HDL 4.4 (1.4) 4.2 (1.4) 0.19 LDL cholesterol (mmoll -1 ) 3.3 (1.0) 3.2 (1.0) 0.75 Smokers (proportion, %) a) The p-values based on ANOVA analysis showed that there were no statistically significant differences in the means of risk factors between total sample and estimation sub-samples for time paths of risk factors. b) As data on lipid levels were collected since 2002, these figures are based on data for 3214 patients. 25
26 26 Table 2. Estimates of GMM for risk factors from NDR data. (1) (2) (3) (4) (5) Risk Factors HbA1c b Systolic BP c (mmhg) TC: HDL LDL (mmoll -1 ) BMI (Kg/m2) Coefficient Longterm effect Coefficient Longterm effect Coefficient Longterm effect Coefficient Longterm effect Coefficient Constant *** ** ** *** * - Ln(diabetes duration) *** *** *** Year 1 a * NA - NA - NA - NA - Age at diagnosis *** * ** *** ** Female * ** *** *** Smoking *** *** BMI *** *** *** ** d - - BMI_ square NS - NS - NS ** d - - Lag of HbA 1c *** - NA - NA - NA Lag of SBP NA e ** - NA - NA Lag of TC: HDL NA - NA *** - NA Lag of LDL NA - NA - NA *** Lag of BMI NA - NA - NA - NA *** - N (patients) Person years Hansen Test AR1 f <0.001 <0.001 <0.001 <0.001 <0.001 AR ***, **, * denotes significance level at the 1, 5 and 10 % respectively; Hansen test on overidentifying restrictions; AR1 and AR2 show the test on first and second order autocorrelation respectively. a) Year_1: 1 if diabetes duration=1 year, 0 otherwise. b) In HbA 1c equation, the smoking was an endogenous variable. c) Systolic BP values transformed as Systolic BP/10. d) As the BMI squared is significant, the long-term effect will be different for different level of BMI. e) The covariate was not included in estimation. f) The strong evidence against null hypothesis of no autocorrelation in the first-differenced errors is expected in the model. Longterm effect
27 Risk factor Table 3. Prediction of risk factors for two hypothetical patients over 5 years after diagnosis Patient 1: Woman with BMI equal to 27 and 60 years old in year of diagnosis and non-smoking Value in year of diagnosis Year 1 Year 2 Year 3 Year 4 Year 5 HbA1c (%) Systolic BP (mmhg) BMI (Kg/m2) TC: HDL LDL cholesterol (mmoll -1 ) Patient 2: Man with BMI equal to 32 and 60 years old in year of diagnosis and smoking at diagnosis HbA1c (%) Systolic BP (mmhg) BMI (Kg/m2) TC: HDL LDL cholesterol (mmoll -1 )
28 Table 4. Root mean squared error of the regression of observed on predicted values in nonsmoker males. Risk factor Root mean squared error NDR equations UKPDS outcome model HbA1c Systolic BP TC: HDL
 HbA 1c ; b) Systolic BP; c) BMI; d) TC:HDL and e) LDL cholesterol for non-smoker males in the validation sample.")
29 Figure 1. Short Title: Predicted and observed time paths of risk factors. Detailed Legend: Time paths of a) HbA 1c ; b) Systolic BP; c) BMI; d) TC:HDL and e) LDL cholesterol for non-smoker males in the validation sample. Equations show the regression of NDR observed values on NDR predicted values (BMI and LDL were not estimated in UKPDS outcome model). (a) 29

30 (b) (c) 30

31 (d) (e) 31
Towards a Health Economic Simulation Model of Type 2 Diabetes in Sweden
 Towards a Health Economic Simulation Model of Type 2 Diabetes in Sweden Ahmad Kiadaliri, Aliasghar 2014 Link to publication Citation for published version (APA): Ahmad Kiadaliri, A. (2014). Towards a Health
Risk factor control in patients with Type 2 diabetes and coronary heart disease: findings from the Swedish National Diabetes Register (NDR)
") Blackwell Publishing Ltd Original Article: Complications DIABETICMedicine DOI: 10.1111/j.1464-5491.2008.02633.x Risk factor control in patients with Type 2 diabetes and coronary heart disease: findings
Blackwell Publishing Ltd Original Article: Complications DIABETICMedicine DOI: 10.1111/j.1464-5491.2008.02633.x Risk factor control in patients with Type 2 diabetes and coronary heart disease: findings
Optimizing risk assessment of total cardiovascular risk What are the tools? Lars Rydén Professor Karolinska Institutet Stockholm, Sweden
 Optimizing risk assessment of total cardiovascular risk What are the tools? Lars Rydén Professor Karolinska Institutet Stockholm, Sweden Cardiovascular Disease Prevention (CVD) Three Strategies for CVD
An implementation of the St. Vincent Declaration for Quality Improvement in Diabetes Care
 Pathophysiology/Complications O R I G I N A L A R T I C L E The National Diabetes Register in Sweden An implementation of the St. Vincent Declaration for Quality Improvement in Diabetes Care SOFFIA GUDBJÖRNSDOTTIR,
ESM1 for Glucose, blood pressure and cholesterol levels and their relationships to clinical outcomes in type 2 diabetes: a retrospective cohort study
 ESM1 for Glucose, blood pressure and cholesterol levels and their relationships to clinical outcomes in type 2 diabetes: a retrospective cohort study Statistical modelling details We used Cox proportional-hazards
The Metabolic Syndrome: Is It A Valid Concept? YES
 The Metabolic Syndrome: Is It A Valid Concept? YES Congress on Diabetes and Cardiometabolic Health Boston, MA April 23, 2013 Edward S Horton, MD Joslin Diabetes Center Harvard Medical School Boston, MA
Modelling Reduction of Coronary Heart Disease Risk among people with Diabetes
 Modelling Reduction of Coronary Heart Disease Risk among people with Diabetes Katherine Baldock Catherine Chittleborough Patrick Phillips Anne Taylor August 2007 Acknowledgements This project was made
Andrejs Kalvelis 1, MD, PhD, Inga Stukena 2, MD, Guntis Bahs 3 MD, PhD & Aivars Lejnieks 4, MD, PhD ABSTRACT INTRODUCTION. Riga Stradins University
 CARDIOVASCULAR RISK FACTORS ORIGINAL ARTICLE Do We Correctly Assess the Risk of Cardiovascular Disease? Characteristics of Risk Factors for Cardiovascular Disease Depending on the Sex and Age of Patients
Diabetes Guidelines in View of Recent Clinical Trials Are They Still Applicable?
 Diabetes Guidelines in View of Recent Clinical Trials Are They Still Applicable? Jay S. Skyler, MD, MACP Division of Endocrinology, Diabetes, and Metabolism and Diabetes Research Institute University of
BMJ Open. For peer review only - Journal: BMJ Open. Manuscript ID: bmjopen
 Aspirin treatment and risk of first incident cardiovascular diseases in patients with type diabetes: an observational study from the Swedish National Diabetes Register (NDR) Journal: BMJ Open Manuscript
well-targeted primary prevention of cardiovascular disease: an underused high-value intervention?
 well-targeted primary prevention of cardiovascular disease: an underused high-value intervention? Rod Jackson University of Auckland, New Zealand October 2015 Lancet 1999; 353: 1547-57 Findings: Contribution
Should we base treatment decisions on short-term or lifetime CVD risk? Rod Jackson University of Auckland New Zealand
 Should we base treatment decisions on short-term or lifetime CVD risk? Rod Jackson University of Auckland New Zealand Presentation outline Strengths & weaknesses of short-term risk approach Strengths &
The target blood pressure in patients with diabetes is <130 mm Hg
 Controversies in hypertension, About Diabetes diabetes and and metabolic Cardiovascular syndrome Risk ESC annual congress August 29, 2011 The target blood pressure in patients with diabetes is
Identification of subjects at high risk for cardiovascular disease
 Master Class in Preventive Cardiology Focus on Diabetes and Cardiovascular Disease Geneva April 14 2011 Identification of subjects at high risk for cardiovascular disease Lars Rydén Karolinska Institutet
Initiating Insulin in Primary Care for Type 2 Diabetes Mellitus. Dr Manish Khanolkar, Diabetologist, Auckland Diabetes Centre
 Initiating Insulin in Primary Care for Type 2 Diabetes Mellitus Dr Manish Khanolkar, Diabetologist, Auckland Diabetes Centre Outline How big is the problem? Natural progression of type 2 diabetes What
Total risk management of Cardiovascular diseases Nobuhiro Yamada
 Nobuhiro Yamada The worldwide burden of cardiovascular diseases (WHO) To prevent cardiovascular diseases Beyond LDL Multiple risk factors With common molecular basis The Current Burden of CVD CVD is responsible
Wine, Alcohol, and Cardiovascular Health: Revisiting the Health Benefits of Wine in the Framingham Heart Study. Michael Darden and Douglas Nelson
 http://www.davescampus.com/images/college-logos/tulane-university.j Wine Alcohol and Cardiovascular Health: Revisiting the Health Benefits of Wine in the Framingham Heart Study. Michael Darden and Douglas
SCIENTIFIC STUDY REPORT
 PAGE 1 18-NOV-2016 SCIENTIFIC STUDY REPORT Study Title: Real-Life Effectiveness and Care Patterns of Diabetes Management The RECAP-DM Study 1 EXECUTIVE SUMMARY Introduction: Despite the well-established
Prevention of complications: are we winning or losing the battle. Naveed Sattar Professor of Metabolic Medicine
 Prevention of complications: are we winning or losing the battle Naveed Sattar Professor of Metabolic Medicine Duality of Interest Declaration Consultant or speaker for: Amgen, AstraZeneca, Boehringer
Why is Earlier and More Aggressive Treatment of T2 Diabetes Better?
 Blood glucose (mmol/l) Why is Earlier and More Aggressive Treatment of T2 Diabetes Better? Disclosures Dr Kennedy has provided CME, been on advisory boards or received travel or conference support from:
Unraveling the concealed and calculated cardiovascular risks in diabetes
 15 P B Fernando Memorial Oration 2015 Unraveling the concealed and calculated cardiovascular risks in diabetes Weerarathna T P 1 Journal of the Ceylon College of Physicians, 2016, 47, 15-19 Abstract Cardiovascular
Factors Predictive of Weight Gain and Implications for Modeling in Type 2 Diabetes Patients Initiating Metformin and Sulfonylurea Combination Therapy
 Diabetes Ther (2015) 6:495 507 DOI 10.1007/s13300-015-0134-y ORIGINAL RESEARCH Factors Predictive of Weight Gain and Implications for Modeling in Type 2 Diabetes Patients Initiating Metformin and Sulfonylurea
Know Your Number Aggregate Report Single Analysis Compared to National Averages
 Know Your Number Aggregate Report Single Analysis Compared to National s Client: Study Population: 2242 Population: 3,000 Date Range: 04/20/07-08/08/07 Version of Report: V6.2 Page 2 Study Population Demographics
Testing the Predictability of Consumption Growth: Evidence from China
 Auburn University Department of Economics Working Paper Series Testing the Predictability of Consumption Growth: Evidence from China Liping Gao and Hyeongwoo Kim Georgia Southern University and Auburn
Analyzing diastolic and systolic blood pressure individually or jointly?
 Analyzing diastolic and systolic blood pressure individually or jointly? Chenglin Ye a, Gary Foster a, Lisa Dolovich b, Lehana Thabane a,c a. Department of Clinical Epidemiology and Biostatistics, McMaster
CVD Prevention, Who to Consider
 Continuing Professional Development 3rd annual McGill CME Cruise September 20 27, 2015 CVD Prevention, Who to Consider Dr. Guy Tremblay Excellence in Health Care and Lifelong Learning Global CV risk assessment..
Effectiveness of a Multidisciplinary Patient Assistance Program in Diabetes Care
 University of Rhode Island DigitalCommons@URI Senior Honors Projects Honors Program at the University of Rhode Island 2009 Effectiveness of a Multidisciplinary Patient Assistance Program in Diabetes Care
CVD risk calculation
 CVD risk calculation Cardiovascular disease (CVD) is the most common cause of death in Alberta, accounting for nearly one third (31%) of the overall deaths (1). The majority (90%) of the CVD cases are
Using the EQ-5D index score as a predictor of outcomes in patients with type 2 diabetes.
 Using the EQ-5D index score as a predictor of outcomes in patients with type 2 diabetes. WORK IN PROGRESS: PLEASE DO NOT QUOTE Status: In press with Medical Care Authors: Philip M. Clarke Ph.D 1,2 Alison
Modelling diabetes Professor Alastair Gray Health Economics Research Centre University of Oxford
 Oxford Technology Showcase 2016 Big Healthcare Challenges in chronic disease Modelling diabetes Professor Alastair Gray Health Economics Research Centre University of Oxford Chronic diseases.. are long-term
Score Tests of Normality in Bivariate Probit Models
 Score Tests of Normality in Bivariate Probit Models Anthony Murphy Nuffield College, Oxford OX1 1NF, UK Abstract: A relatively simple and convenient score test of normality in the bivariate probit model
Glycemic Control, Renal Complications, and Current Smoking in Relation to Excess Risk of Mortality in Persons With Type 1 Diabetes
 652901DSTXXX10.1177/1932296816652901Journal of Diabetes Science and TechnologyAhlén et al research-article2016 Special Section Glycemic Control, Renal Complications, and Current Smoking in Relation to
Blood Pressure Targets in Diabetes
 Stockholm, 29 th August 2010 ESC Meeting Blood Pressure Targets in Diabetes Peter M Nilsson, MD, PhD Department of Clinical Sciences University Hospital, Malmö Sweden Studies on BP in DM2 ADVANCE RCT (Lancet
Case study: Lean adult with no complications, newly diagnosed with type 2 diabetes
 Case study: Lean adult with no complications, newly diagnosed with type 2 diabetes Authored by Clifford Bailey and James LaSalle on behalf of the Global Partnership for Effective Diabetes Management. The
4 th March Sarah Davis School of Health and Related Research, University of Sheffield Jefferson Sheard Jefferson Sheard Consultancy, Sheffield
 REVIEW OF THE BRISTOL-MYERS SQUIBB / ASTRAZENECA RESPONSE TO THE ACD ON DAPAGLIFLOZIN FOR TYPE 2 DIABETES REPORT BY THE DECISION SUPPORT UNIT 4 th March 2013 Sarah Davis School of Health and Related Research,
The Clinical Unmet need in the patient with Diabetes and ACS
 The Clinical Unmet need in the patient with Diabetes and ACS Professor Kausik Ray (UK) BSc(hons), MBChB, MD, MPhil, FRCP (lon), FRCP (ed), FACC, FESC, FAHA Diabetes is a global public health challenge
Diabetes, Diet and SMI: How can we make a difference?
 Diabetes, Diet and SMI: How can we make a difference? Dr. Adrian Heald Consultant in Endocrinology and Diabetes Leighton Hospital, Crewe and Macclesfield Research Fellow, Manchester University Relative
Understanding new international guidelines to tackle CV Risk: A practical model John Deanfield, MD UCL, London United Kingdom s
 Understanding new international guidelines to tackle CV Risk: A practical model John Deanfield, MD UCL, London United Kingdom s Ho Chi Minh City, Vietnam August 7, 2014 JBS 2 Risk Guidelines (2005) Based
Northwestern University Feinberg School of Medicine Calculating the CVD Risk Score: Which Tool for Which Patient?
 Northwestern University Feinberg School of Medicine Calculating the CVD Risk Score: Which Tool for Which Patient? Donald M. Lloyd-Jones, MD, ScM, FACC, FAHA Senior Associate Dean Chair, Department of Preventive
The Diabetes Link to Heart Disease
 The Diabetes Link to Heart Disease Anthony Abe DeSantis, MD September 18, 2015 University of WA Division of Metabolism, Endocrinology and Nutrition Oswald Toosweet Case #1 68 yo M with T2DM Diagnosed DM
SUPPLEMENTAL MATERIAL
 SUPPLEMENTAL MATERIAL A Meta-analysis of LDL-C, non-hdl-c, and apob as markers of cardiovascular risk. Slide # Contents 2 Table A1. List of candidate reports 8 Table A2. List of covariates/model adjustments
Risk Factors, Mortality, and Cardiovascular Outcomes in Patients with Type 2 Diabetes
 The new england journal of medicine Original Article Risk Factors, Mortality, and Cardiovascular Outcomes in Patients with Type 2 Diabetes Aidin Rawshani, M.D., Araz Rawshani, M.D., Ph.D., Stefan Franzén,
Diabete: terapia nei pazienti a rischio cardiovascolare
 Diabete: terapia nei pazienti a rischio cardiovascolare Giorgio Sesti Università Magna Graecia di Catanzaro Cardiovascular mortality in relation to diabetes mellitus and a prior MI: A Danish Population
Logistic Regression Predicting the Chances of Coronary Heart Disease. Multivariate Solutions
 Logistic Regression Predicting the Chances of Coronary Heart Disease Multivariate Solutions What is Logistic Regression? Logistic regression in a nutshell: Logistic regression is used for prediction of
Diabetes Mellitus: A Cardiovascular Disease
 Diabetes Mellitus: A Cardiovascular Disease Nestoras Mathioudakis, M.D. Assistant Professor of Medicine Division of Endocrinology, Diabetes, & Metabolism September 30, 2013 1 The ABCs of cardiovascular
Clinical Therapeutics/Volume 33, Number 1, 2011
 Clinical Therapeutics/Volume 33, Number 1, 2011 Concurrent Control of Blood Glucose, Body Mass, and Blood Pressure in Patients With Type 2 Diabetes: An Analysis of Data From Electronic Medical Records
Appendix This appendix was part of the submitted manuscript and has been peer reviewed. It is posted as supplied by the authors.
 Appendix This appendix was part of the submitted manuscript and has been peer reviewed. It is posted as supplied by the authors. Appendix to: Banks E, Crouch SR, Korda RJ, et al. Absolute risk of cardiovascular
Comparability of patient-reported health status: multi-country analysis of EQ-5D responses in patients with type 2 diabetes
 Comparability of patient-reported health status: multi-country analysis of EQ-5D responses in patients with type 2 diabetes Joshua A Salomon, Anushka Patel, Bruce Neal, Paul Glasziou, Diederick E. Grobbee,
Guidelines on cardiovascular risk assessment and management
 European Heart Journal Supplements (2005) 7 (Supplement L), L5 L10 doi:10.1093/eurheartj/sui079 Guidelines on cardiovascular risk assessment and management David A. Wood 1,2 * 1 Cardiovascular Medicine
EuroPrevent 2010 Fatal versus total events in risk assessment models
 EuroPrevent 2010 Fatal versus total events in risk assessment models Pekka Jousilahti, MD, PhD,Research Professor National Institute for Health and Welfare, Finland Risk assessment models Estimates the
Population Health Metrics
 Population Health Metrics BioMed Central Research A longitudinal analysis of the risk factors for diabetes and coronary heart disease in the Framingham Offspring Study Alok Bhargava* Open Access Address:
Computer Modeling of Diabetes and Its Complications: A Report on the Fifth Mount Hood Challenge Meeting
 VALUE IN HEALTH 16 (2013) 670 685 Available online at www.sciencedirect.com journal homepage: www.elsevier.com/locate/jval Computer Modeling of Diabetes and Its Complications: A Report on the Fifth Mount
Ischemic Heart and Cerebrovascular Disease. Harold E. Lebovitz, MD, FACE Kathmandu November 2010
 Ischemic Heart and Cerebrovascular Disease Harold E. Lebovitz, MD, FACE Kathmandu November 2010 Relationships Between Diabetes and Ischemic Heart Disease Risk of Cardiovascular Disease in Different Categories
EUROPEAN SURVEY OF CARDIOVASCULAR DISEASE PREVENTION AND DIABETES EUROASPIRE IV. GUY DE BACKER Ghent University,Belgium
 EUROPEAN SURVEY OF CARDIOVASCULAR DISEASE PREVENTION AND DIABETES EUROASPIRE IV GUY DE BACKER Ghent University,Belgium ESC Congress 2012, aug.25-29th, Munich, Germany ESC Congress 2012, aug.25-29th, Munich,
Reduced 10-year Risk of CHD in Patients who Participated in Communitybased DPP: The DEPLOY Pilot Study
 Diabetes Care Publish Ahead of Print, published online December 23, 2008 Reduced 10-year CHD Risk: DEPLOY Pilot Study Reduced 10-year Risk of CHD in Patients who Participated in Communitybased DPP: The
Glycemic Control and Cardiovascular Disease in 7,454 Patients With Type 1 Diabetes
 Cardiovascular and Metabolic Risk O R I G I N A L A R T I C L E Glycemic Control and Cardiovascular Disease in 7,454 Patients With Type 1 Diabetes An observational study from the Swedish National Diabetes
Cardiovascular Disease Prevention: Current Knowledge, Future Directions
 Cardiovascular Disease Prevention: Current Knowledge, Future Directions Daniel Levy, MD Director, Framingham Heart Study Professor of Medicine, Boston University School of Medicine Editor-in-Chief, Journal
Deposited on: 13 June 2008 Glasgow eprints Service
 Clarke, P.M. and Gray, A.M. and Briggs, A. and Farmer, A.J. and Fenn, P. and Stevens, R.J. and Matthews, D.R. and Stratton, I.M. and Holman, R.R. (2004) A model to estimate the lifetime health outcomes
Table S1. Characteristics associated with frequency of nut consumption (full entire sample; Nn=4,416).
.") Table S1. Characteristics associated with frequency of nut (full entire sample; Nn=4,416). Daily nut Nn= 212 Weekly nut Nn= 487 Monthly nut Nn= 1,276 Infrequent or never nut Nn= 2,441 Sex; n (%) men 52
Table S1. Characteristics associated with frequency of nut (full entire sample; Nn=4,416). Daily nut Nn= 212 Weekly nut Nn= 487 Monthly nut Nn= 1,276 Infrequent or never nut Nn= 2,441 Sex; n (%) men 52
Preventive Cardiology Scientific evidence
 Preventive Cardiology Scientific evidence Professor David A Wood Garfield Weston Professor of Cardiovascular Medicine International Centre for Circulatory Health Imperial College London Primary prevention
Assessing the economics of a stratified treatment approach for Type 2 Diabetes
 Assessing the economics of a stratified treatment approach for Type 2 Diabetes A. Green 1, A. Gray 4, R. Holman 4, A. Farmer 4, N. Sattar 5, A. Jones 3, A. Hattersley 3, E. Pearson 2, C. Jennison 1, 1
1. Which one of the following patients does not need to be screened for hyperlipidemia:
 Questions: 1. Which one of the following patients does not need to be screened for hyperlipidemia: a) Diabetes mellitus b) Hypertension c) Family history of premature coronary disease (first degree relatives:
Epidemiologic Measure of Association
 Measures of Disease Occurrence: Epidemiologic Measure of Association Basic Concepts Confidence Interval for population characteristic: Disease Exposure Present Absent Total Yes A B N 1 = A+B No C D N 2
Scottish Diabetes Survey
 Scottish Diabetes Survey 2008 Scottish Diabetes Survey Monitoring Group Foreword The information presented in this 2008 Scottish Diabetes Survey demonstrates a large body of work carried out by health
Non-fasting lipids and risk of cardiovascular disease in patients with diabetes mellitus
 Diabetologia (2011) 54:73 77 DOI 10.1007/s00125-010-1945-z SHORT COMMUNICATION Non-fasting lipids and risk of cardiovascular disease in patients with diabetes mellitus S. van Dieren & U. Nöthlings & Y.
Scottish Diabetes Survey 2012
 Scottish Diabetes Survey 2012 Scottish Diabetes Survey Monitoring Group 1 Scottish Diabetes Survey Monitoring Group Contents Foreword... 3 Executive Summary... 5 Prevalence... 6 Undiagnosed diabetes...
Supplementary Appendix
 Supplementary Appendix This appendix has been provided by the authors to give readers additional information about their work. Supplement to: Rawshani Aidin, Rawshani Araz, Franzén S, et al. Risk factors,
Long-Term Cost-effectiveness of Saxagliptin for the Treatment of Type 2 Diabetes in South Africa
 Long-Term Cost-effectiveness of Saxagliptin for the Treatment of Type 2 Diabetes in South Africa Deon Olivier October 2012 1 Introduction Saxagliptin is a DPP-4 inhibitor for the treatment of type 2 diabetes
Population models of health impact of combination polypharmacy
 Population models of health impact of combination polypharmacy Global Summit on Combination Polypharmacy for CVD, 25 th September 2012 Dr Mark Huffman Northwestern University, Chicago Charity No: 1110067
CVD Risk Assessment. Michal Vrablík Charles University, Prague Czech Republic
 CVD Risk Assessment Michal Vrablík Charles University, Prague Czech Republic What is Risk? A cumulative probability of an event, usually expressed as percentage e.g.: 5 CV events in 00 pts = 5% risk This
Clinical and Economic Summary Report. for Employers
 Clinical and Economic Summary Report for Employers Magaly Rodriguez de Bittner, PharmD, CDE, FAPhA Director, P 3 Program Dawn Shojai, PharmD Assistant Director, P 3 Program P 3 Clinical & Economic Summary
Vascular Diseases. Overview: Selected Slides
 Vascular Diseases Overview: Selected Slides Total deaths and change in vascular death rates
Combined effects of systolic blood pressure and serum cholesterol on cardiovascular mortality in young (<55 years) men and women
 men and women") European Heart Journal (2002) 23, 528 535 doi:10.1053/euhj.2001.2888, available online at http://www.idealibrary.com on Combined effects of systolic blood pressure and serum cholesterol on cardiovascular
European Heart Journal (2002) 23, 528 535 doi:10.1053/euhj.2001.2888, available online at http://www.idealibrary.com on Combined effects of systolic blood pressure and serum cholesterol on cardiovascular
Citation for published version (APA): Ebbes, P. (2004). Latent instrumental variables: a new approach to solve for endogeneity s.n.
: Ebbes, P. (2004). Latent instrumental variables: a new approach to solve for endogeneity s.n.") University of Groningen Latent instrumental variables Ebbes, P. IMPORTANT NOTE: You are advised to consult the publisher's version (publisher's PDF) if you wish to cite from it. Please check the document
University of Groningen Latent instrumental variables Ebbes, P. IMPORTANT NOTE: You are advised to consult the publisher's version (publisher's PDF) if you wish to cite from it. Please check the document
Evolving patterns of tobacco use in northern Sweden
 Journal of Internal Medicine 2003; 253: 660 665 Evolving patterns of tobacco use in northern Sweden B. RODU 1, B. STEGMAYR 2, S. NASIC 2, P. COLE 3 & K. ASPLUND 2 From the 1 Department of Pathology, School
Depok-Indonesia STEPS Survey 2003
 The STEPS survey of chronic disease risk factors in Indonesia/Depok was carried out from February 2003 to March 2003. Indonesia/Depok carried out Step 1, Step 2 and Step 3. Socio demographic and behavioural
Risk Factors for Heart Disease
 Developmental Perspectives on Health Disparities from Conception Through Adulthood Risk Factors for Heart Disease Philip Greenland, MD Harry W. Dingman Professor Chair, Department of Preventive Medicine
Survey Scottish Diabetes. Survey Monitoring Group
 Scottish Diabetes Survey 2009 Scottish Diabetes Survey Monitoring Group 2 Foreword The Scottish Diabetes Survey is now in its ninth year. This 2009 Survey, as with previous versions, continues to demonstrate
Trends In CVD, Related Risk Factors, Prevention and Control In China
 Trends In CVD, Related Risk Factors, Prevention and Control In China Youfa Wang, MD, MS, PhD Associate Professor Center for Human Nutrition Department of International Health Department of Epidemiology
Module 2. Global Cardiovascular Risk Assessment and Reduction in Women with Hypertension
 Module 2 Global Cardiovascular Risk Assessment and Reduction in Women with Hypertension 1 Copyright 2017 by Sea Courses Inc. All rights reserved. No part of this document may be reproduced, copied, stored,
EXAMINING THE EDUCATION GRADIENT IN CHRONIC ILLNESS
 EXAMINING THE EDUCATION GRADIENT IN CHRONIC ILLNESS PINKA CHATTERJI, HEESOO JOO, AND KAJAL LAHIRI Department of Economics, University at Albany: SUNY February 6, 2012 This research was supported by the
Biases in clinical research. Seungho Ryu, MD, PhD Kanguk Samsung Hospital, Sungkyunkwan University
 Biases in clinical research Seungho Ryu, MD, PhD Kanguk Samsung Hospital, Sungkyunkwan University Learning objectives Describe the threats to causal inferences in clinical studies Understand the role of
Link between effectiveness and cost data The effectiveness and cost data came from the same sample of patients and were prospectively evaluated.
 Cost-effectiveness of primary prevention of cardiovascular disease with atorvastatin in type 2 diabetes: results from the Collaborative Atorvastatin Diabetes Study (CARDS) Raikou M, McGuire A, Colhoun
Optimal Design of Multiple Medication Guidelines for Type 2 Diabetes Patients
 Optimal Design of Multiple Medication Guidelines for Type 2 Diabetes Patients Jennifer E. Mason PhD Student Edward P. Fitts Department of Industrial and Systems Engineering NC State University, Raleigh,
Review of guidelines for management of dyslipidemia in diabetic patients
 2012 international Conference on Diabetes and metabolism (ICDM) Review of guidelines for management of dyslipidemia in diabetic patients Nan Hee Kim, MD, PhD Department of Internal Medicine, Korea University
Key causes of preventable deaths in New Zealand In a population of 10,000 New Zealanders, every year there will be about:
 Preventive care - Chronic Disease Management in primary care: a population perspective Rod Jackson University of Auckland New Zealand (22/11/8) Key causes of preventable deaths in New Zealand In a population
Diabetes Day for Primary Care Clinicians Advances in Diabetes Care
 Diabetes Day for Primary Care Clinicians Advances in Diabetes Care Elliot Sternthal, MD, FACP, FACE Chair New England AACE Diabetes Day Planning Committee Welcome and Introduction This presentation will:
Heart Age and Cardiovascular Risk
 Heart Age and Cardiovascular Risk Mark Cobain Unilever R+D Colworth Science Park Sharnbrook Bedfordshire Europrevent, Geneva April 16 2011 Conflict of Interest Statement Employment by Unilever PLC A producer
Since 1980, obesity has more than doubled worldwide, and in 2008 over 1.5 billion adults aged 20 years were overweight.
 Impact of metabolic comorbidity on the association between body mass index and health-related quality of life: a Scotland-wide cross-sectional study of 5,608 participants Dr. Zia Ul Haq Doctoral Research
Considering depression as a risk marker for incident coronary disease
 Considering depression as a risk marker for incident coronary disease Dr Adrienne O'Neil Senior Research Fellow Melbourne School of Population & Global Health The University of Melbourne & Visiting Fellow
GALECTIN-3 PREDICTS LONG TERM CARDIOVASCULAR DEATH IN HIGH-RISK CORONARY ARTERY DISEASE PATIENTS
 GALECTIN-3 PREDICTS LONG TERM CARDIOVASCULAR DEATH IN HIGH-RISK CORONARY ARTERY DISEASE PATIENTS Table of Contents List of authors pag 2 Supplemental figure I pag 3 Supplemental figure II pag 4 Supplemental
Welcome and Introduction
 Welcome and Introduction This presentation will: Define obesity, prediabetes, and diabetes Discuss the diagnoses and management of obesity, prediabetes, and diabetes Explain the early risk factors for
ARIC Manuscript Proposal # PC Reviewed: 2/10/09 Status: A Priority: 2 SC Reviewed: Status: Priority:
 ARIC Manuscript Proposal # 1475 PC Reviewed: 2/10/09 Status: A Priority: 2 SC Reviewed: Status: Priority: 1.a. Full Title: Hypertension, left ventricular hypertrophy, and risk of incident hospitalized
Master class in preventive cardiology Focus on diabetes and cardiovascular disease Geneva April
 Master class in preventive cardiology Focus on diabetes and cardiovascular disease Geneva April 14 2011 Introduction Course objectives A review of available guidelines Lars Rydén Cardiology Unit Department
The GUIDANCE study. Kamlesh Khunti University of Leicester, UK. on behalf of the GUIDANCE Study Group
 The GUIDANCE study Guillaume Charpentier, Kris Doggen, Noëmi Debacker, Kees Gorter, Odile Juy Christiane Kellner, Kamlesh Khunti, Oliver Kuß, Ulf Lindblad, Arne Melander, Lena Minning, Ulrich Müller, John
Why Do We Treat Obesity? Epidemiology
 Why Do We Treat Obesity? Epidemiology Epidemiology of Obesity U.S. Epidemic 2 More than Two Thirds of US Adults Are Overweight or Obese 87.5 NHANES Data US Adults Age 2 Years (Crude Estimate) Population
Models of preventive care in clinical practice to achieve 25 by 25
 Models of preventive care in clinical practice to achieve 25 by 25 Professor David A Wood Garfield Weston Professor of Cardiovascular Medicine International Centre for Circulatory Health Imperial College
ARTICLE. A. J. Hayes & J. Leal & A. M. Gray & R. R. Holman & P. M. Clarke
 Diabetologia (2013) 56:1925 1933 DOI 1007/s00125-013-2940-y ARTICLE UKPDS Outcomes Model 2: a new version of a model to simulate lifetime health outcomes of patients with type 2 diabetes mellitus using
ACCORD, ADVANCE & VADT. Now what do I do in my practice?
 ACCORD, ADVANCE & VADT Now what do I do in my practice? Richard M. Bergenstal, MD International Diabetes Center Park Nicollet Health Services University of Minnesota Minneapolis, MN richard.bergenstal@parknicollet.com
Page down (pdf converstion error)
") 1 of 6 2/10/2005 7:57 PM Weekly August6, 1999 / 48(30);649-656 2 of 6 2/10/2005 7:57 PM Achievements in Public Health, 1900-1999: Decline in Deaths from Heart Disease and Stroke -- United States, 1900-1999
1 of 6 2/10/2005 7:57 PM Weekly August6, 1999 / 48(30);649-656 2 of 6 2/10/2005 7:57 PM Achievements in Public Health, 1900-1999: Decline in Deaths from Heart Disease and Stroke -- United States, 1900-1999