Socio-demographic predictors of childhood overweight and obesity in Norway an epidemiological study
|
|
|
- Garry Blair
- 5 years ago
- Views:
Transcription


1 Socio-demographic predictors of childhood overweight and obesity in Norway an epidemiological study Anna Månsson Biehl Morbid Obesity Centre, Vestfold Hospital Trust, Tønsberg and Norwegian Institute of Public Health, Division of Epidemiology University of Oslo, Faculty of Medicine Oslo, 2013
2 Anna Månsson Biehl, 2014 Series of dissertations submitted to the Faculty of Medicine, University of Oslo No ISBN All rights reserved. No part of this publication may be reproduced or transmitted, in any form or by any means, without permission. Cover: Inger Sandved Anfinsen. Printed in Norway: AIT Oslo AS. Produced in co-operation with Akademika Publishing. The thesis is produced by Akademika Publishing merely in connection with the thesis defence. Kindly direct all inquiries regarding the thesis to the copyright holder or the unit which grants the doctorate.
3 CONTENTS Abstract 1 Acknowlegements 3 Abbreviations 4 List of papers 5 1. Introduction Epidemiology of childhood overweight and obesity Factors that affect overweight and obesity among children Measures of overweight and obesity Aims of the study Materials and methods Study design, study population and sampling methodology Data collection Ethics and approvals Summary of papers General discussion Methodological considerations Internal validity Main findings External validity Ethical considerations Conclusions and future directions References 39 Appendix 53 I - Overview table 53 II - Metodebok for skolehelsetjenesten (Method booklet) 57 III - ELEV-skjema (Pupil-form) 67 IV - SKOLE-skjema (School form) 71 V- Samtykke (Consent form) 75 Papers 79
4
5 Abstract Background: The increase in childhood overweight and obesity over the last decades means that we urgently need to broaden our understanding of current predictors of childhood adiposity. Monitoring of children s weight and height enables us to identify risk groups, follow trends and evaluate interventions, which in itself might have important implications for future public health. Aims: The overall aim of the thesis was to identify current risk groups for overweight and obesity in Norwegian children, differentiated between general and abdominal obesity. We aimed to examine urban-rural differences in overweight and obesity, and whether these differed in terms of maternal education (paper II). In addition the thesis sought to investigate whether parental marital status was associated with overweight and obesity and potential gender differences (paper III). The methodological study aimed to assess the impact instrument error might have on prevalence estimates in surveys (paper I). Methods: Height, weight and waist circumference (WC) were measured in a nationally representative sample of 3166 eight-year-olds in the 2010 Norwegian Child Growth study (NCG). The main outcome measures were general overweight and obesity (BMI 25kg/m 2 ) and abdominal obesity (waist-to-height ratio 0.5) in addition to BMI and WC as continuous variables. Prevalence ratio (PR) (equivalent with relative risk, RR) was estimated using log-binomial regression. In the methodological study, data from the 2008 NCG study were utilised. The coefficient of variation (CV) of instrument error was used in simulations in order to study the impact it had on the prevalence estimates. Results: Children living rurally were on average more overweight and obese (general and abdominal) than children in more urban areas. Children of low-educated mothers were also at higher risk of being overweight and obese than children of high-educated mothers and children living rurally especially. Additionally, height was on average lower in children with lower educational backgrounds. Children of divorced parents had higher prevalence of general- and abdominal obesity compared to children of married parents. Although formal tests of the interaction terms parental marital status by gender were not statistically significant, gender stratified analyses showed that the prevalence of abdominal obesity was significantly higher only amongst boys of divorced parents compared to boys with married parents. Furthermore, general overweight and obesity were more prevalent among girls (21.6 %) than among boys (16.5 %), whereas abdominal obesity was not significantly different between genders. In our methodological paper it was demonstrated that instrument error might lead to overestimation of the prevalence of overweight and obesity. 1
6 Conclusions: Our findings indicate that rurally residing children, children with low-educated mothers and children of divorced parents are at a greater risk of being overweight or obese (general and abdominal). Based on findings of the methodological study we elucidate the importance of maintenance or recalibration of measuring instruments to reduce instrument error and to obtain more accurate estimates in population-based surveys. The cross sectional nature of our data precludes the possibility of making causal inferences regarding the findings of the socio-demographic predictors. Nevertheless, our findings are of importance for policy-makers and scientists in the planning of preventive strategies to combat overweight and obesity among children, and also point to the importance of continuous monitoring of school children s anthropometry in Norway. 2
7 Acknowlegements The work presented in this thesis is the result of collaboration between the Norwegian Institute of Public Health and the Morbid Obesity Center, Vestfold Hospital Trust in Tønsberg, funded by South- Eastern Norway Regional Health Authority. I really appreciate that the Department of Health Statistics included me as a part of the department during this period. First, I am truly grateful to my main supervisor Haakon E. Meyer: supportive and patient when needed, always straightforward, but most of all your thorough scientific guidance and constructive advice have been invaluable for my work on this thesis. Thanks also go to my co-supervisors: Heine Strand, for your encouraging attitude and continuous statistical supervision; and Else-Karin Grøholt, for believing in me in the first place, giving me the opportunity to apply for a grant and your support and very valuable feedback; and the formal project leader and co-supervisor Jøran Hjelmesæth for being open to collaborating on an epidemiological project, for extensive engagement and for always being there. I am thankful to Ragnhild Hovengen, who initially sowed the seed of an idea that became this thesis, for your constant enthusiasm and encouragement. Thanks also go to co-author Mathieu Roelants for your constructive comments on the first paper; to Matthew McGee, for proofreading; to all of the children who participated in the Norwegian Child Growth study and, not least, the school nurses who took the measurements. Warm thanks to my all of colleagues on the 6th floor and my colleagues at the Morbid Obesity Center at Vestfold Hospital. Special thanks to Ólöf, for your kind-hearted support in moments of need; to Jørgen Meisfjord, for your awareness and attention to details, which has been most valuable to the NCG data; to Arve Sjølingstad for preparing the data files and troubleshooting assistance; to Steinar Bjørnæs for practical assistance with documents; to Wenche Jacobsen at the NIPH library, always ready to help; and to Heidi Lyshol, for your willingness to help and share your linguistic knowledge. Finally, a sincere thank you to my mother and my father for giving me the strength to fulfill my ambitions and to my three ever-supportive sisters. My beloved children Clara and Karl: you have been generous with me and my time with this project and I am infinitely happy that you are who you are. At times this work has been solitary and demanding, and in those moments you have been my anchor, Martin. My deepest gratitude to you. Jar, December 2013 Anna Månsson Biehl 3
8 Abbreviations BMI COSI CV IOTF NCG NIPH PR RR SEP WC WHtR WHO Body mass index the European Childhood Obesity Surveillance Initiative Coefficient of variation International Obesity Task Force Norwegian Child Growth Study Norwegian Institute of Public Health Prevalence ratio Relative risk Socio economic position Waist circumference Waist-to-height ratio World Health Organization 4
9 List of papers I) Impact of instrument error on the estimated prevalence of overweight and obesity in population-based surveys. BMC Public Health 2013, 13:146 * II) III) Adiposity among children in Norway by urbanity and maternal education: a nationally representative study. BMC Public Health 2013, 13:842 * Parental marital status and childhood overweight and obesity: A nationally representative study. Submitted for publication, Oct 2013 *Open access journal, author retains copyright. 5
10 6
11 1. Introduction In 380 B.C Hippocrates stated: Corpulence is not only a disease itself, but the harbinger of others (1). Childhood obesity has been referred to as one of the most serious public health challenges of the 21st century (2), and obesity is an increasingly important risk factor contributing to the global burden of disease (1). Overweight and obese children have higher risk of remaining overweight and obese into adulthood and a higher risk of developing non-communicable diseases later in life (3-5). Moreover, self-esteem among obese children is lower, which in itself may be detrimental to the child (6). Preventing childhood obesity is probably the most promising means of reversing the obesity epidemic (7). Therefore, the identification of groups at increased risk of being overweight and obese is integral (8), and is explored in the current thesis. 1.1 Epidemiology of childhood overweight and obesity Epidemiology is the study of the distribution and determinants of disease frequency in human populations. (9: p.1). One fundamental assumption of epidemiology is that disease does not occur at random but in subgroups at higher risk due to exposure to physical and genetic agents or social, economic and cultural factors (10). Monitoring children s anthropometric measures provides the means by which to understand how adiposity is distributed. Descriptive epidemiology is useful in order to follow the development over time and to compare populations, and to identify predictors of overweight and obesity in the paediatric population. Finally, monitoring gives a solid basis for evaluating interventions (7). One general pattern is that the entire body mass index (BMI) distribution has moved to the right, reflecting increasing proportions of overweight and obesity (11). However, in the United States, Australia and some European countries, there are indications that the BMI increase might be leveling off (12-14). However, some developing countries have experienced nutritional transition and report a conflicting picture of both under nutrition and over nutrition, also among children (15). There has been a shift in patterns from traditional diets to more Western diets (high in sugars, fat, and animalsource food) and inactivity (16, 17). Annual systematic measures of the height and weight of the total population of school children in Oslo were collected in the period (18). There was a distinct reduction in height and weight during the war ( ), showing children's growth to be affected by their environment and societal circumstances (18, 19). Liestøl et al. repeated similar measurements in 1980 and 1985 but only in girls. The results from 1920 onwards are shown in the graphs below. Figure 1 shows a slight increase in mean height in most age groups up until 1985, i.e. as long as data were collected and 7
12 centrally processed. The post-war figures show a trend of decreasing mean weight, with an increase in the period 1975 to 1985 (figure 2); mainly in the upper percentiles, which reflect an increase in the proportion of heavy girls (19). Figure 1: Mean height of 1-year age groups of schoolgirls in Oslo 1920 to (Liestøl et al 1995, reproduced with permission.) Figure 2: Mean weight of 1-year age groups of schoolgirls in Oslo 1920 to (Liestøl et al 1980, reproduced with permission.) Sundal undertook a systemic collection of the anthropometric data of children aged 0 15 years living in Bergen in the 1950s (20); the basis for the first Norwegian growth charts, as did Waaler in the 1970s (21); and the latter forms the basis for comparison with recently collected data by Juliusson (further described in 1.1.2). The latest example of comparable data over time in Norway is Young-HUNT; the adolescent part of the Nord-Trøndelag Health Study. Young-HUNT 1 was initiated in and followed by Young- HUNT 2 in and Young-HUNT 3 in (22). Young-HUNT data have been compared to systematic measurements of peers in the same geographical area in , providing greater insight into growth-trends among adolescents over more than four decades. The data show a considerable increase in overweight and obesity amongst adolescents in Nord-Trøndelag, with a more pronounced increase in boys than in girls (22, 23). 8
13 Most of the available data on childhood overweight and obesity in Norway are based on either small samples, performed in urban areas or rely on self-reported measurements. An overview shows Norwegian studies and the prevalence estimates of overweight and obesity from 1995 onwards (22-33) (appendix I). The main findings of studies with objectively measured anthropometric data will be presented in the following. The anthropometric data of children aged 0 19 years were collected in the Bergen Growth Study in (34). To enable comparison with similar data from (21) immigrant children, amongst others, were excluded. Increase in weight in this period was limited to the upper percentiles of weight-for-height in children aged between 6 and 11. In overweight and obesity was more prevalent amongst girls aged 6-11 years (18.4 %) than boys (15.7 %), although this gender difference was not statistically significant (30). In physical activity and anthropometric measurements were collected for Norwegian children aged 9 and 15 (35). This study also showed overweight and obesity to be more prevalent among girls than boys, whereas it was the opposite among the 15-year olds. Subsample data restricted to children from Oslo were compared with data collected in 2000 relating to 9 year-olds from Oslo (27). No changes in BMI were reported, whereas there was a significant increase in waist circumference (WC) for both genders from 2000 to (26). Furthermore, a follow-up of the nationwide sample ( ) was conducted in 2011, showing no significant increase of overweight and obesity among 9 year olds, whereas a borderline significant increase in overweight and obesity was found in 15 year old boys. Finally, in 2007 anthropometric data were collected from 11 year olds in counties surrounding Oslo (31). The estimates of overweight and obesity were suspiciously low compared to the studies discussed above, but still consistent with findings regarding gender differences; with overweight and obesity more prevalent among girls. This indicates that overweight and obesity is more prevalent, and that it has increased the most among teenage boys (22, 23), whereas in younger children, overweight and obesity is more prevalent among girls (22, 30, 36). In terms of abdominal obesity, data on WC of Norwegian children are scarce and restricted to the Oslo-subsample discussed above (26). A research group in Bergen has developed Norwegian reference values for WC and waist-to-height ratio (WHtR) (37) (further described in 1.3.1, Abdominal obesity). 9
14 The above overview of Norwegian studies illustrates the challenges inherent in the interpretation of results in terms of time trends and comparisons between subgroups and regions. Most data refer to restricted populations, small samples or data which have been obtained during different periods, which might imply that time trends are mixed up with geographic variations. Further, comparison might be limited to certain age groups and comparability impeded by different age categorisations. High-quality data of nationally representative samples and repeated measurements would therefore be preferable. A review conducted in 2006 revealed that only 15 of 53 Member States in the World Health Organization (WHO) European Region had nationally representative and objectively measured weight- and height measurements of children aged 0-6 years, whereas 19 countries monitored overweight and obesity in adolescents (38). Another recent review based on objectively measured anthropometric measurements in nationally representative samples of European adolescents reported that data were identified for only half of the countries and that the quality of the studies and comparability varied greatly (39). The WHO s European Childhood Obesity Surveillance Initiative (COSI) was established as a standard surveillance system to facilitate comparisons of nationally representative samples, examined according to common protocol. It was jointly developed by the WHO Regional Office for Europe and the participating member states. The Norwegian Child Growth study (NCG) (36) followed the protocol of COSI (40). 1.2 Factors that affect overweight and obesity among children Whether obesity is a disease or not is still debated (41). Kopelman states that Obesity is not a single disorder but a heterogeneous group of conditions with multiple causes. (42). Obesity is a complex condition with several causal contributors (41), and is determined by an interaction between genetic, environmental and psychosocial factors. Many of these factors are beyond the individuals control (41), which might contribute to an even greater harm to children and young individuals. Still, overweight and obesity is considered preventable. A presentation of a range of factors that affect the development of overweight and obesity follows. Overweight and obesity tend to aggregate within families (43). If one parent is obese then the risk increases that the child will become an obese adult (44, 45). To determine whether this is due to genetic or environmental (lifestyle related) factors, or an interaction, is difficult for many reasons (42). The genetic contribution that explains the variance of BMI is significant, suggesting that genetic factors play an important role in determining individual differences in adiposity operating through 10
15 susceptibility genes (46). This is consistent with Stunkard et al s study from 1990, which assessed the relative importance of genetic and environmental effects on BMI by studying twins who grew up apart. They concluded that the genetic influence on BMI was substantial and that childhood environment had a limited influence (47). The environment driven influence seems either to be attenuated or strengthened by susceptible genes. These genes are not essential or, by themselves, sufficient to explain the development of adiposity, but indicate that genetic factors determine who is most susceptible to becoming obese in any given environment (48). Genetic pathways that contribute directly to obesity have not yet been elucidated (49). Exceptions are some rare single gene defects, where obesity is a consistent finding (e.g. Prader-Willi syndrome) (42). Genome-wide association studies have identified common genetic variants associated with obesity (fatness), but each with a weak effect (50). From a historical perspective, natural selection has probably favoured those individuals with low metabolism (parsimonious energy metabolism). Radical societal changes in terms of nutrition and food availability, in combination with a reduced need to be physically active, is likely one part of the explanation behind the obesity epidemic; the concurrence of evolutionary heritage of biological factors interact with technological advances (51). Individuals (or tribes), who have not preserved traditional lifestyle, with greater genetic susceptibility are worse affected. For example, the dramatic environmental changes among American Indians tribes and Alaskan Natives, each with their own traditions, have caused poorer health status and higher prevalence of obesity than in the general US population (52). Lifestyle related factors like diet and physical activity level have changed in Norwegian children, as has already been noted. This reflects the fact that food availability has increased and the extensive consumption of energy-dense foods and soft drinks (38: ch. 7, 53). In combination with increased inactivity, e.g. due to screen activities, changing patterns of diet might impact upon children s growth and weight status (54, 55). Obesity during pregnancy is associated with gestational diabetes. There is no clear evidence that exposure to gestational diabetes is associated with childhood obesity (51). However, an association between gestational diabetes and greater mean birth weight has been shown, whereas the association was significantly attenuated when adjusting for maternal pre-pregnancy BMI (56). Infants of women with gestational diabetes have higher percentage body fat compared to the infants of healthy mothers (57). 11
16 Breastfeeding is another perinatal factor, with substantial research undertaken in this field. However, whether breastfeeding prevents the development of overweight and obesity later in life is still debated (58, 59). Both low- and high birth weight are associated with childhood overweight and obesity; size and growth (catch-up growth) during infancy are associated with increased risk of obesity and more central fat distribution among children and adults (60, 61). Findings from a study, based on data from the NCG point to early infancy as the first critical period for the onset of overweight at 8 years (62). The proportion of macrosomic offsprings ( 4500 g) decreased between in Norway (figure 3) (63). Likewise, the mean birth weight increased during the 1990s but decreased during the 2000s and is now at a normal level (figure 4)(64). Children born in 2002 make up the 2010 NCG sample; the same year that mean birth weight and the proportion of children with high birth weight ( 4500 g) hit peak levels in Norway. Results from the three rounds of the NCG-study (2008, 2010 and 2012) were relatively stable. Nonetheless, the highest prevalence of overweight and obesity was reported among children born in 2002 (36). One may wonder if the proportion of children with high birth weight and the proportion of overweight and obese children at 8 years of age will continue to correlate in subsequent age cohorts. This can be explored by following systematic measuring of children. Figure 3: The proportion (%) of infants with birth weight 4500 g, 2000 to Figure 4: Mean birth weight (gram) in Norway, 1990 to Source: Norwegian Institute of Public Health, 2013, Andelen tunge fortsetter å gå ned [internet] ( Source: Norwegian Institute of Public Health, Årstabeller for MFR for 2011,
17 Social stratification is of significance for health and the development of diseases. The term socioeconomic position (SEP) is commonly used in health research (65). A number of indicators including occupation, income and education, are used, with each of these indicators measuring a different aspect of SEP. The ability to distinguish between factors that influence different groups in society varies and depends amongst other things on health outcome and the population being studied. Education is a frequently applied indicator in epidemiology and is used as a generic measure of SEP (65). The association between SEP and child obesity varies across countries worldwide (66, 67). In developed countries there is largely an inverse relationship between SEP and adiposity (68), including Norway, based on self-reported data (29, 69) and objectively measured anthropometric data (30, 31). These findings are consistent with findings from Sweden, Denmark and Finland (70-72). Brundtland et al. compared the growth of children from varying social strata (areas with varying average income) in Oslo and found that prior to the war children from high-income areas were taller than children from lower strata. Until about 1955, children from the higher strata also weighed more, whereas in 1970 children from lower strata weighed more (18). Brundtland et al. reported that height differences between areas had nearly disappeared in 1970 in Oslo, while mean weight still was highest in low-income areas (18, 19). This information suggests that predictors, like SEP, are context- and time dependent. How various risk groups develop over time thus requires regular updates. Like the association between SEP and adiposity, the association between degree of urbanity and adiposity varies across countries. High SEP was reported to be associated with obesity in China and Russia, whilst obesity was more prevalent in urban areas of China and rural areas in Russia (66). Both in Norway and other developed countries, obesity is markedly more prevalent among adults from rural areas (73, 74). A recent Norwegian study of adults reported that obesity, over time, has become more prevalent in rural districts, with this only partly explained by educational inequalities between central and rural districts (75). It is well-known that parental obesity is a strong predictor of childand adolescent obesity (76). In almost all low- and middle income countries urban children are taller and heavier than children in rural areas (77), with the difference explained by the considerable advantage urban children have in term s of nutrition. Child and adolescent overweight and obesity measured in terms of geographical differences in developed countries have previously been reported in Sweden (71, 78-80), Finland (72, 81), Italy (82), the US (83-85), Canada (86-88) and Iceland (89). In these studies, overweight and 13
18 obesity had greater prevalence in rural areas, except for one study from New Zealand reporting leaner rural children (90). A Norwegian study based on 2008 NCG data has published findings on urban-rural differences, indicating a greater proportion of overweight and obese children in rural areas. However, the study did not contain data on SEP or other socio-demographic variables at individual level (91). Large changes in the socio-demographic composition, like increased immigration, in Norway and other Western countries over recent decades make it important to examine the effect this might have on childhood obesity. Previous studies have shown that immigrants to developed countries more rapidly develop obesity than the host population (26, 92-95). Immigrant families are exposed to cultural changes, including different food habits to that of the host population. Poor language skills might contribute to making the choice of healthy foods harder (96). The effect of acculturation was assessed in a Norwegian sample of adult immigrants living in Oslo. Acculturation was measured as language skills (proficiency in the Norwegian language), with those immigrants with better skills had more preferable BMI changes, whereas immigrants time of residency did not have any effect on BMI changes (97). Large differences in adiposity between immigrant groups from developing countries have been reported among grown-ups (98) and adolescents (99) in Oslo, Norway. In recent decades the numbers of families where parents are either cohabiting or divorced have increased in developed countries. It is claimed that the risk of a cohabitation dissolving is between double to four times that of it leading to marriage (100). Family structure is an important predictor of child well-being. Family stress has a role in the development of both overweight and underweight among children (101). Størksen et al investigated the long-term effects of parental divorce on children at an average of 8 years after the divorce. They reported moderate but significantly higher levels of anxiety and depression and lower levels of well-being in adolescents who had experienced parental divorce compared to those who had not (102). Previous studies have shown an association between family structure and overweight and obesity. Overweight and obesity were found to be more prevalent among children in single parent families and those with divorced parents (72, ), whereas other studies did not find any association (30, 108, 109). Some such studies have methodological limitations; either small samples, selfreported data and/or parental marital status measured at birth, i.e. not at the time anthropometric measurements were taken ( ). 14
19 Certain CNS pathology (51), sleeping problems (114, 115) and diversity of gut microbes (116) are other possible risk factors for the development of childhood overweight and obesity. 1.3 Measures of overweight and obesity Obesity is defined as...a condition of abnormal or excessive fat accumulation in adipose tissue that presents a risk to health (7, 117).; in that way is obesity linked to both excess fatness and risk. Regarding the use of key terms in this thesis: The recommended terminology is used when prevalence estimates are presented, e.g. percentage of overweight (including obesity), explained in Referring to the phenomenon in general the term overweight and obesity is used. Adiposity is used as a generic term referring to both general overweight and obesity, and abdominal obesity. Occasionally, if referring specifically to e.g. obesity (BMI 30kg/m 2 ), that specific term is used. Weight is the simplest measure of body size. To increase the correlation between weight and body fat, weight is adjusted for height (118). BMI, calculated as weight (kg) divided by the square of height (m 2 ), has been established as a valid but indirect measure of adipose tissue in epidemiological studies ( ). BMI is cheap and easy to measure and reproduce. BMI measures the sum of both fat mass and fat-free mass, but gives no indication of the distribution of body fat. Although BMI has been found to fairly well indicate adult body fatness (122, 123), the use of BMI in children have more limitations. Childhood and adolescent BMI varies with age and gender, with an increase in BMI during growth explained mainly by increases in fat-free mass rather than the fat-component; the opposite of that which applies in adults (124). Both the International Obesity Task Force (IOTF) and WHO BMI-based systems (see 1.3.1) were evaluated using densitometry, and both were found to have a very high specificity (i.e. low proportion of non-overweight misclassified as overweight) but low sensitivity, especially among females adolescents (i.e. high proportion misclassified as normal weight) (125). A corresponding study was performed based on the Centers for Disease Control and Prevention s classification (CDC). This reported that the accuracy of BMI varied according to the degree of fatness; among children 95 th percentile (i.e. among relatively fat children) BMI was a specific indicator of excess body fat and moderately sensitive (126). 15
20 WC is a complementary measure of body composition. Centralised body fat has health-implications and is associated with increased risk of cardiovascular and metabolic complications in children ( ). The lack of population specific WC reference values has led to that WC has been used in conjunction with height (waist circumference divided by height). WHtR is commonly used measure. Over the last few decades WC has increased in infants, children and adolescents to a greater extent than BMI (26, 133, 134). This indicates that the fat distribution has changed (or is changing) and suggests a steeper increase in abdominal fatness compared to height- and weight based adiposity measure (134, 135). Abdominal obesity can be assessed using WC-based measurements (128, ), and is recommended as a means of both estimating the prevalence of abdominal obesity for epidemiological purposes and as a means of following these trends among children (7, 139). Using BMI and WC in the classification of childhood overweight and obesity is complicated by the numerous available systems, the existence of which hampers the comparison of epidemiological studies. Classification systems are largely based on the distribution of adult BMI and therefore correlated to relevant adult risks (122). The adult cut-off points; BMI of 25 kg/m 2 for overweight and 30 kg/m 2 for obesity are related to risk of comorbidities and mortality (7). However, obesity-related morbidity is not as pronounced in children as it is among adults. There is still no consensus on whether a classification system for paediatric obesity should be linked to fatness rather than to BMI and the prediction of obesity-related diseases and/or health consequences (122). Measuring fat tissue is complicated in epidemiological studies. The European Childhood Obesity Group (ECOG) has recently published recommendations for the use of classification systems and terms, with the intention of clarifying definitions, reduce confusion and allowing greater comparison between studies (140). The usage of international systems in national contexts - to ease international comparison - is controversial since maturation patterns differ between countries and thereby impact upon body composition (122). 16
21 In the year 2000 the IOTF provided cut-off points for childhood BMI (2-18 years) based on representative cross-sectional data from six countries and linked to adult cut-offs corresponding to centiles that match 25 kg/m 2 and 30 kg/m 2 at 18 years of age (141). In this sense, cut-offs were constructed in reference to WHO health related cut-off for adult obesity. The impetus behind IOTF s cut-off values was based on the need for coherence between childhood and adult indices of obesity. In 2007, the WHO developed BMI-for-age reference values for school-aged children and adolescents (5-19 years) (142), referring to standard deviation scores (SDS). In 2006, the WHO released growth standards for pre-school children; the WHO Child Growth Standards (0-5 years); based on samples of breastfed children from six countries worldwide (143). The CDC presented revised age- and sexspecific growth charts for the United States in 2000, which also serve as reference values (144). Table 1 shows the various classification systems (IOTF, WHO and CDC) and different terminology, demonstrating the challenges involved when comparing estimates. Table 1: Various classification systems (IOTF, WHO and CDC) and different terminology and cut-off values/references demonstrate the challenges involved when comparing estimates. Classification system IOTF a Terminology Overweight excluding obesity Obesity Overweight (including obesity) Cut-off values 25 BMI < 30* BMI 30* BMI 25* WHO b Terminology Overweight excluding obesity Obesity Overweight (including obesity) References +1SDS BMI < +2SDS** BMI +2SDS** BMI +1SDS** CDC c Terminology Overweight Obesity Overweight and obesity References 85 th BMI < 95 th centile BMI 95 th centile BMI 85 th centile *) BMI 25 corresponds to centiles that match BMI of 25 and 30 at the age of 18 years (adults). **) SDS (standard deviation scores) a) IOTF (International Obesity Task Force) b) WHO (World Health Organization) c) CDC (The Center for Disease Control and Prevention) 17
22 The figure below illustrates the diverging results of these classification systems, with three different definitions used to evaluate one data set (figure 5). The graph stems from the Portuguese WHO COSIstudy (145). Figure 5: Portuguese children's nutritional status defined by International Obesity Task Force, Center for Disease Control and Prevention, and World Health Organization criteria. (Rito et al 2012, reproduced with permission.) As already mentioned there are no universal criteria or cut-offs for either WC or WHtR. Several countries, including Norway, have developed age- and gender-specific reference values for WC and WHtR (37, ). WHtR 0.5 has been suggested as a simple measure of abdominal obesity, though it has not been validated (131, 132). It is claimed that WHtR 0.5 identifies youths with a higher likelihood of having cardio metabolic risks ( ). The advantage of using a cut-point of 0.5 is that there is no need for population- and/or age- and gender-specific cut-off values. It also suggests an easily understood public-health message: keep your waist circumference to less than half your height (132). 18
23 2. Aims of the study The main aim of the thesis was to identify groups of Norwegian children at increased risk of being overweight and obese. The more specific aims were: Paper I Paper II Paper III To evaluate the validity of data collected by the School Health Service using uncalibrated instruments; whether instrument error will have an impact on the estimates of childhood overweight and obesity in population-based surveys. To investigate the urban-rural gradient of childhood overweight and obesity and whether it differs according to level of maternal education. To investigate the associations between parental marital status and general overweight and obesity, and abdominal obesity and whether these associations differ in terms of gender. 19
24 3. Materials and methods The study data are from the nationally representative Norwegian Child Growth Study (NCG); a collaboration between the Norwegian Directorate of Health, the Norwegian Institute of Public Health and the School Health Service. NCG followed the protocol from the WHO European Childhood Obesity Surveillance Initiative (COSI) described in the introduction (1.1.2). Corresponding studies have been carried out in 25 European countries (151). 3.1 Study design, study population and sampling methodology In the NCG, third graders were examined at the same schools in 2008, 2010 and This thesis is based on data from the 2008 (paper I) and 2010 surveys (paper II and III). A nationally representative sample of 3474 children from 127 schools (in 2008) and 3166 children (1629 boys and 1537 girls) from 125 schools (in 2010) with complete anthropometric measurements, participated in the NCG. Mean age in 2010 was 8.3 years (SD=0.3 years). To limit the sample size and yet still ensure national representativity a stratified two-stage sampling design was used (figure 6). The primary sampling unit was county. Ten (10) of nineteen (19) counties were selected (Akershus, Oslo, Vestfold, Vest-Agder, Rogaland, Hordaland, Møre og Romsdal, Sør- Tøndelag, Nordland and Troms) by simple random sampling among all four geographical strata (ie. the administrative Health Regions) in order to ensure nationwide coverage and the possibility of reporting on all parts of the country. The secondary sampling unit was school. Initially, 130 of 3920 public primary schools were selected randomly, and the sample was intended to be proportional to population size in each county. Schools with only one or two pupils in the relevant grade were excluded from the NCG, which in 2008 resulted in 127 schools participating. In 2010, another two schools were excluded due to their having too few third graders, resulting in the participation of 125 schools. 3.2 Data collection Data collection was conducted in October and first week of November by the school health nurse/s at each school. Prior to data collection school nurses participated in a workshop in each county (2008) or region (2010 and 2012) where they were given training on how to perform the necessary measuring procedures and collect the necessary correction values, all according to a standardised protocol (appendix II). 20
25 Figure 6: Two-stage sampling of children in the Norwegian Child Growth study. (Illustration by Martin Asbjørnsen.) 21
26 Body weight and height were measured while the children were wearing light indoor clothing without shoes and were recorded to the nearest 0.1 kg and 0.1 cm respectively (152, 153). BMI was calculated as weight/height x height (kg/m 2 ) and children were classified as overweight or obese based on age- and gender specific cut-off values of BMI for children developed by the IOTF (141) and the WHO definitions for children aged 5-19 (142, 154). Additionally, the school nurse completed the ELEV-skjema (PUPIL-form, appendix III) and measures were corrected if the child wore items other than light indoor clothing: 100 grams were added for some additional light clothing or plus 500 grams for heavier clothing. Waist circumference (WC) was measured to the nearest 0.1 cm with arms hanging relaxed along the body. WC was measured with a measuring tape midway between the lower rib margin and the iliac crest (153). Marks were made on the skin of each child with a felt-tip pen in order to ensure the correct level of measurement. Waist-to-height ratio (WHtR) was calculated as WC/height (cm/cm), with a ratio equal to or higher than 0.5 classified as waist-to-height ratio 0.5 (WHtR 0.5). Measurements were taken only once and were recorded on the ELEV-skjema (PUPIL form). Data entry was done manually. Height, weight and WC were entered twice, and any punching errors were then corrected. Furthermore, correction values were collected at the same time as the anthropometric data of the children in 2008 and 2010 (procedure explained below). The intention was to obtain information on the accuracy of measurements, i.e. how close the measure was to its true value. Cases of inaccuracy were referred to as instrument error. Thus, the instrument error was equivalent to the correction value and corresponds to the difference between the true value and the uncorrected value measured by a (uncalibrated) instrument. Each school received a reference weight and length which were about the weight and length of third graders; 28 kg and 120 cm. The procedures were thoroughly explained and illustrated in the Method booklet (appendix II) and in paper I, p. 2. On the basis of the corrections values reported in the SKOLE-skjema (School form, appendix IV) the anthropometric measures of the children were corrected post-hoc. Thus, the corrected measures corresponded (in theory) to measures taken by calibrated instruments, even though the instruments themselves were not calibrated. Components of measurement error associated with measurement technique were not considered in this study. 22
27 3.3 Ethics and approvals NCG was evaluated by the Regional Committee for Medical Research Ethics (reference nr: 2010/938a) and approved by the Norwegian Data Inspectorate (reference nr: 08/ /IUR). Detailed information about the study and consent forms (appendix V) were sent to the parents or guardians via the school nurse beforehand. Written informed consent was obtained from a parent or legal guardians via the school nurse prior to participation in the study. 23
28 4. Summary of papers Paper I Impact of instrument error on the estimated prevalence of overweight and obesity in populationbased surveys. The fact that instrument error increases the variance of the distribution of BMI is the basis for this study. Combined with a defined cut-off value this may impact upon the estimated prevalence of overweight and obesity. To ensure high quality surveillance data, we wanted to assess the impact instrument error might have on prevalence estimates of overweight and obesity, due to uncalibrated scales and stadiometers. Anthropometric measurements from a nationally representative sample (the 2008 NCG) were used. Each of the 127 participating schools received a reference weight and a reference length to determine the correction value. Correction value corresponds to instrument error and is the difference between the true value and the measured, uncorrected weight and height at local scales and stadiometers. Simulations were used to determine the expected implications of instrument errors. To systematically investigate this, the coefficient of variation (CV) of instrument error was used in the simulations and was increased successively. Simulations showed that the estimated prevalence of overweight and obesity increased systematically with the size of instrument error when the mean instrument error was zero. The estimated prevalence was 16.4% with no instrument error and was, on average, overestimated by 0.5 percentage points based on observed variance of instrument error from the NCG. Further, the estimated prevalence was 16.7% with 1% CV of instrument error, and increased to 17.8%, 19.5% and 21.6% with 2%, 3% and 4% CV of instrument error, respectively. In conclusion, failure to calibrate measuring instruments might lead to overestimation of the prevalence of overweight and obesity in population-based surveys. Paper II Adiposity among children in Norway by urbanity and maternal education: a nationally representative study. In this cross-sectional study we wanted to investigate the urban-rural gradient in adiposity and whether the association differed by maternal education. Height, weight and waist circumference (WC) were measured in 3166 eight-year-olds participating in the 2010 NCG. Risk estimates for overweight (including obesity) and abdominal obesity (WHtR 0.5) were calculated by log-binomial regression. Mean BMI and WC and risk estimates of overweight 24
29 (including obesity) and WHtR 0.5 were inversely associated with both urbanity and maternal education. These associations were robust after mutual adjustment for each other. Furthermore, there was an indication of interaction between urbanity and maternal education, as trends of mean BMI and WC increased from urban to rural residence among children of low-educated mothers (p = 0.01 for both BMI and WC), whereas corresponding trends for children from higher educational backgrounds were non-significant (p > 0.30). However, formal tests of the interaction term urbanity by maternal education were non-significant (p-value for interaction= 0.29 for BMI and = 0.31 for WC). In conclusion, both children living rurally and children of low-educated mothers had higher mean BMI and WC than children living in more urban areas and children of mothers with higher levels of education. Paper III Parental marital status and childhood overweight and obesity: A nationally representative study. On the basis of the 2010 NCG (see paper II) we aimed to examine whether parental marital status was associated with general overweight and obesity, and abdominal obesity among children. We also sought to explore whether the associations differed according to gender. The main outcome measures were general overweight (including obesity) (BMI 25kg/m2) using IOTF cut-offs and abdominal obesity (waist-to-height ratio 0.5). Prevalence ratios, adjusted for possible confounders, were calculated by log-binomial regression. General overweight (including obesity) was 1.54 (95 % confidence interval (CI): ) times more prevalent among children of divorced parents compared to children of married parents, and the corresponding prevalence ratio for abdominal obesity was 1.89 (95 % CI: ). Formal tests of the interaction term parental marital status by gender were not statistically significant. However, in gender-specific analyses the association between parental marital status and adiposity measures was only statistically significant in boys (p=0.04 for general overweight and obesity, and p=0.01 for abdominal obesity). The estimates were robust against adjustment for maternal education, family country background and current area of residence. In conclusion; general overweight and obesity, and abdominal obesity were more prevalent among children of divorced parents, with the study providing valuable information by focusing on societal changes in order to identify vulnerable groups. 25
30 5. General discussion 5.1 Methodological considerations The degree to which methodological issues might have influenced the above results is discussed in what follows Internal validity There are two main types of error in epidemiological studies: random error and systematic error (or bias). Random errors are largely related to sample size and the variability of the sample. High variability due to small samples results in reduced precision of the estimates and thus influences the width of confidence intervals. Random error could be reduced towards zero if the sample size were infinitely large (155). Random errors in an observational study such as ours could also be random typing errors, e.g. when the nurses registered measurements or when data were entered into the database. However, these errors were minimized by entering the main variables (height, weight and WC) twice, whilst typing errors were corrected. Additionally, data were cleaned, in the sense that cases with missing or obviously erroneous height or weight were removed. A scatter plot of the anthropometric measures was used to identify potentially erroneous height and weight measures. In the second phase, which of the three variables was more likely to contain an error was assessed. If WC was the only likely error then the value rather than the entire record was deleted. If an error in weight or height was likely, then the entire record was deleted. Geographical groups were stratified in terms of maternal education (figures 3 & 4 in paper II), which resulted in subgroups containing relatively few individuals, especially in rural areas. In addition, using gender stratified analyses when studying differences between parental marital status categories in paper III (figures 1 and 2) resulted in limited statistical power and imprecise estimates with wide confidence intervals. Despite the fact that the NCG was carefully designed (confer 3.1), the potential for selection bias has to be addressed. First, the school nurses took the measurements. This was probably an advantage and might partly explain the high attendance rate of 89 % in The Regional Committee for Medical Research Ethics gave permission for the school nurses to remind the parents once about returning the consent form. The NCG-study requested the school nurses to register whether the parents/guardians did not want their child/ren to participate. Only 1 % of the parents were actively opposed to allowing their child to participate in the study. We have no information about the remaining 10 % and the reasons why they did not participate, although we can surmise that children are absent from school as a result of natural causes such as colds and other illnesses. Secondly, all children attending private and municipal schools were invited to participate, omitting only those 26
31 private schools not accredited by the Private Education Act (and therefore without access to municipal School Health Service). Thirdly, as was described earlier (confer 3.1), sampling was designed so as to obtain samples proportional to population size based on an assumption of school size in each county. Significant deviations from proportionality were observed in the final sample and analyses were weighted in order to correct for significantly over- or under-represented geographical strata and counties, where analytical tools that took into account the two-stage sampling procedure were required. To sum up, given the high attendance rate, sampling methodology, appropriate analytic tools being used and including both public and private schools, selection bias is probably not a major concern in the NCG. As described in 3.2.1, we envisaged the risk of information bias on the basis that the instruments (scales and stadiometers) used in the NCG were pre-existing at each school with no requirement for calibration or maintenance, which could potentially introduce bias at school-level. We therefore collected information on instrument error and corrected all measurements. Data on correction values were also used in paper I, which is further discussed later (confer 5.2 Instrument error). Moreover, information bias due to clothing was minimised by correcting for additional clothing, as described earlier in and in paper II. The exposure variables were obtained from the Norwegian population register and are considered high quality data; maternal education, area of residence and parental marital status. Immigrant education data might be less precise than for people educated in Norway due to delays in registration and self-reported data errors in some cases. The national education level of Norwegian mothers (women years old) was reflected in our sample. The total numbers of inhabitants in each municipality constituted the urbanity variable in paper II and III, as in several other Norwegian epidemiological studies (74, 156, 157). However, the validity of this variable can be questioned; to what degree does the population size of a municipality reflect urban-rural difference? Population size is a fairly crude measure and one cannot exclude that it may be inaccurate and not precise means of distinguishing between urban and rural characteristics. On the other hand, several studies have drawn similar conclusions to those we drew in paper II. The crude measure might lead to some misclassification of exposure and underestimation of real associations. A more precise definition of urbanity and an alternative measure could possibly have shown a stronger gradient. Finally, in paper III, data on marital status were confined to a snapshot of current status, which implies that we did not have information on how long the parents had been married, or divorced. Nor was it clear whether the married couple with whom a child lived was made up of both its 27
32 biological parents. Furthermore, the never-married category, including cohabiting, single and separated parents, was probably the most heterogeneous, containing both intact and dissolved relationships as well as single parents. The aim of the study was to investigate the association between parental marital status and child weight status. It was based on an assumption that marital conflict and/or dissolution might impact upon a child s weight status. Taking into account the low age of the children, the married parents were likely to be the biological parents, and thus the married category is most probably a valid measure. Likewise, the divorced category is unambiguous. A confounder is a risk factor that must be associated both with the outcome and the exposure variable. Confounding is common in observational epidemiological studies, with age and gender as common potential confounders. All children included in this study were third graders and mean age was evenly distributed in the subgroups in paper II and III, and varied a maximum of ten days between the groups. Age was therefore not considered a confounder in our study. In paper II, gender differences in adiposity were observed in the descriptive statistics. That was the rationale for adjusting for gender in further analyses. In paper III the analyses were stratified for gender. In our studies we hypothesised that overweight/obesity would vary by area of residence, level of maternal education and parental marital status. To take into account potential confounders, DAGs (directed acyclic graphs) were drawn to investigate causal pathways. Despite few variables and simple DAGs, it could be challenging to decide whether a factor was a confounder or a mediator. Regarding paper II, maternal education could impact the association between area of residence and adiposity. On the other hand, it is equally natural to assume the impact is opposite (figure 7 and 8). maternal education area of residence adiposity Figure 7: Maternal education impacts the association between area of residence and adiposity. area of residence maternal education adiposity Figure 8: Area of residence impacts the association between maternal education and adiposity. 28
33 Whether education (or area of residence) should be considered a mediator or a confounder in the aforementioned example is not crucial, because the estimates were essentially unchanged when adjusting the factors mutually (confer table 3 in paper II). The same applied for the associations in paper III, where country background could be a potential confounding factor. Regardless, the association did essentially not change after adjusting for country background. However, we cannot exclude that a measure that better captures the differences in the family's total SEP resources could help explain urban-rural differences in adiposity among children. On the other hand, our results show that education on its own explains differences in adiposity, as stated above. Secondly, analyses based on paternal education were also run with mainly the same results as those based on maternal education. However, we did not have data on family income. Since we had no information on whether the parents had a shared economy, neither maternal nor paternal income (separately) was considered a valid indicator in this study. All nurses that carried out measurements had attended an NCG-course and training (described in section 3.2). Measuring the children was recommended to be undertaken by two nurses (observers). In some cases nurses from two NCG-schools in the same municipality cooperated the day measurements were taken, or the school nurse and the senior municipal health nurse carried out the measurements together. Considering the large number of observers in the study reliability ought to have been assessed, though due to limited resources this was not done. Previous studies have reported that weight and height are precise measures ( ). The inter-observer reliability of WC is fairly low (159), while the intra- observer reliability has been reported to be highly reproducible (161). 29
34 5.2 Main findings The cross-sectional design does not allow conclusions to be drawn about causal relationships. Whether any of the predictors are causally related is a complex matter, as are many other relations studied in health research Our study confirmed previous findings on the socio-economic differences in adiposity, where children of high-educated mothers had the lowest prevalence of adiposity (paper II). This is in accordance with previous studies in Norway (29, 30, 69, 162) and Europe (68, 71, 163). Whereas we found that the risk of being abdominally obese almost doubled among children with low-educated mothers compared to those with high-educated mothers, the risk of the same children being generally overweight and obese was only about 30 % higher (paper II). Longitudinal changes of altered body composition have been reported in both Norwegian adults and children (26, 164). A study of 9 year olds from Oslo did not find changes in BMI between the study periods in 1999/2000 and 2005, while WC increased significantly. Interestingly, analysis of interaction (SEP by study period) was borderline significant in girls, which implies that mean WC tended to increase in girls from low-sep groups compared to high-sep-groups over a 5-year- period. Despite cross-sectional data, our findings are in line with this and may indicate ongoing changes of the fat distribution related to socio-economic background - that should be further investigated in future studies. It would have been desirable to have information on lifestyle variables in the NCG in order to further explore to what extent physical activity and diet can explain SEP differences in adiposity. This also applies to the other exposure variables urbanity and marital status. However, we did not collect data on lifestyle factors given that a high attendance rate was given priority in the NCG and parents were as such not expected to fill out time consuming questionnaires. In a Norwegian nationwide sample, a clear social gradient in objectively measured physical activity in children was not found (33), which might be due to weaknesses in study design; self-reported data on parental social position and/or small samples size when stratified according to both age groups and gender. However, Swedish studies, based on self-reported data on physical activity have revealed that a greater proportion of children of less educated parents were inactive for more than 4 hours per day and participated to a lesser extent in organised sport (71, 165). Based on these findings, no conclusions can be drawn regarding the impact of lifestyle factors on SEP differences in 30
35 adiposity. Nonetheless, there are indications that children of low-educated parents have a less healthy lifestyle compared to children with parents having a high educational background, which probably is a factor of significance in childhood adiposity. Height growth may be of interest and have implications for the development of adiposity. We found that the gradient for height was the inverse of the gradient for adiposity and increased significantly from low- to high education category in accordance with previous studies of children ( ) and adults (169, 170). High-educated mothers have been shown to give birth to taller boys and girls (166, 171). Findings in paper II cannot confirm that socio-economic differences in height have been reduced or disappeared among more recently born children, as was reported of 1975s school children from Oslo (18, 19). This is noteworthy since differences in living conditions in Norway have improved considerably since Brundtland et al. reported height differences between low- and high income areas in Oslo in the 1940s (18). Cavelaars et al. investigated educational height differences among adults in Europe and speculated as to whether improvements in living conditions in lower socio-economic groups have been replaced by other unfavourable conditions such as maternal smoking and an unbalanced diet, e.g. easily available unhealthy food (170). This reasoning is similar to that exploring socio-economic differences in weight and height in Scottish children aged 4-10 between 1974 and 2004 (172). They found that overweight and obese children were taller, regardless of parental income group, which points towards the view that observed inequalities (higher prevalence of overweight and obesity in lower-income groups) were not due to short stature per se. However, the relative height growth in the low-income group was significantly lower compared to that of the highincome group, whereas z-weight was similar in the two groups. This indicates that the reported increase in overweight and obesity in the lower socio-economic group was largely due to the relative limitation of height growth. Their suggested explanation was increasing intake of inexpensive, easily available, energy-dense and low-nutrient food in lower socio-economic groups and is in line with the speculations of Cavelaars et al. above. We do not know to what extent this pertains to Scandinavian children growing up in more equal societies. In Norway there are no longitudinal data that could reveal such inequalities in growth among children and adolescents. 31
36 Our study of urban rural differences showed that children in rural areas had on average higher weight, BMI and WC, with a significant trend of increase in these measures from urban to semi-urban to rural areas (paper II). After adjustment for maternal education the outcomes were practically unchanged. This indicates that the geographical differences remain independent of maternal education. As described in paper II, formal tests of the interaction terms urbanity by maternal education were non-significant. However, when BMI and WC were plotted separately, according to maternal education, different patterns were suggested across urbanity (confer paper II, figure 3 and 4). Only children of mothers with primary education showed a significant trend of increasing BMI and WC from urban to rural areas, whereas the association was not statistically significant in children with secondary and tertiary educated mothers. These patterns should be confirmed in future studies. It is not clear which indicators should be used to identify geographical inequalities or urban-rural differences, as previously discussed in Although the common purpose of previous studies mentioned in was clear, i.e. to explore the urban-rural gradient of childhood adiposity, various indicators have been used (such as population size in a certain area, population density, parental questionnaire characterising the neighbourhood in addition to national classification systems). For that reason it might be surprising that all the studies found urban-rural differences. What characterises urban and rural areas and what mechanisms underlie the urban-rural differences being captured in such diverse indicators? Sund et al. have suggested that geographical inequalities in health in Scandinavian countries are probably largely the result of a spatial aggregation of health inequalities that exist on an individual level (173). The development of theoretical models has resulted in an increasing interest in the possible health effects of group-level factors (174). Until recently (the 1990s), the presumed explanation for differences in health and disease in populations was thought to be the characteristics of individuals (compositional effect). However, studies at an individual level might have limitations because processes that take place at group or community level may be ignored (contextual effect) (175). Multi-level analysis enables studying disease causation which extends across macro- and individual levels, explaining in turn how group/community- and individual-level variables interact (174). There is some evidence that contextual effect has an influence on health-outcomes beyond the individual level ( ). By complementing our study with a SEP indicator on area-level, e.g. municipality characteristics like average income among local inhabitants, it would have allowed comparison with previous findings, where Heyerdahl et al. found that the effect of urbanity was attenuated after adjustment of arealevel SEP (91). However, it was out of the scope of the current study to conduct multi-level analyses. 32
37 Data on physical activity and diet by urbanity are scarce, or at least of samples comparable to Norwegian school children. Self-reported data on physical activity and diet from a Swedish study indicated that rural children played more outside than urban children while they also were inactive to a greater extent and participated less in organised sport activities than urban children (71). Moreover, consumption of sugar-sweetened beverages among children in rural areas was higher, although not significantly so. Lifestyle factors do not seem able to explain the observed urban-rural differences. On the other hand, the validity self-reported data on diet and physical activity can be questioned; e.g. it is cognitively demanding for young children to assess whether, for example, playing with friends should count as physical activity (179, 180). We need to explore further why overweight and obesity is more common rurally. To further develop indicators would improve the basis upon which conclusions about underlying mechanisms for urbanrural differences can be drawn. Additionally, data on physical activity would also have been helpful. In paper III, studying parental marital status, we found that general overweight and obesity was more prevalent among children of divorced parents, consistent with previous studies of parental divorce from Greece (104), Australia (106) and the US (107). Similar studies have found that children whose parents lived separately had a higher risk of being overweight or obese, i.e. comparison of one-parent and two-parent families (72, 105, 111), yet another group of studies showed that the association was strongly attenuated and no longer statistically significant after adjusting for SEP (108, 110). As described in (Confounding) neither maternal education, area of residence or country background explained the difference in adiposity between children of married and divorced parents. We also showed that children of divorced parents had increased prevalence of abdominal obesity. We are not aware of previous studies that have investigated the association between parental marital status and abdominal obesity. In stratified analyses we found that boys might be at especially high risk of being abdominal obese. However, as discussed in 5.1.1, the gender-specific analyses had reduced statistical power. The formal test of interaction (gender by marital status) of the continuous variable WC was borderline significant (p=0.06). A larger sample is needed in order to confirm these findings. This can be done by combining the samples of the NCGs in future research. 33
38 Our study aimed to investigate whether family disruption was associated with general- and abdominal obesity among children, based on the assumption that marital conflict and dissolution could impact upon children s health and well-being (181) and thus contribute to weight problems (101). However, due to the cross-sectional nature of our data we could not conclude that the higher prevalence of adiposity in children with divorced parents was caused by the divorce itself. The conceivable explanations for the observed differences have been further discussed in paper III. To expand upon the current limited understanding of the effect of family structure on adiposity longitudinal data, more detailed marital status information and the opportunity to trace the reciprocal marital status of biological parents are all needed (as problematized in section 5.1.1). This would enable future research to differentiate between families of intact and dissolved relationships regardless of form (marriage or cohabitation). A US study based on longitudinal data made it possible to look into time periods of increased risk of adiposity related to the moment of family disruption. They found a significantly increased risk of obesity two years in advance of the family disruption, and years after the disruption (107). To ensure valid anthropometric measures we collected information about instrument errors at each school, described in These data were also used in a methodological study (paper I). The background for this study was the discovery of a stadiometer at a school nurse office that had remained mounted on the wall while the floor-covering had been removed a few years earlier, resulting in biased height-measurements In paper I, we assumed that instrument error would increase the variance, and we hypothesised that increased variance would lead to overestimation of the prevalence of overweight and obesity (confer figure 1 in paper I, p.2). The mean of the instrument error (correction value) was set to zero to enable us to assess the impact of increased variance. We found that instrument error systematically increased the estimated prevalence of overweight and obesity (analogous to underweight, at the other end of the distribution), based on simulation of the coefficient of variation of instrument error from the 2008 NCG. As described in paper I, the scales measured on average 0.14 kg too little and the stadiometers measured 0.07 cm too little. Findings in paper I have no further implications for paper II and III, as all weight and height measurements were corrected according to the corrections values collected in the 2010 NCG (confer 3.2.1). 34
39 5.2.4 External validity In terms of paper I, the outlined principle of inaccurate instruments could be applied to measurement error in general, and specifically for weight and height measuring instruments, regardless of country. The results of paper II and III are generalisable to the Norwegian 8 year old population. The development of child growth and the increase in adiposity might limit the temporal validity of the findings. Generalising the results of NCG outside of Norway should be done with caution. However, results are probably externally valid for an extended Scandinavian child population, based on the fact that the overall distribution of anthropometric values is similar among young children in Denmark, Sweden and Finland. The SEP gradient is corresponding in Scandinavian countries as is the pattern of family structure. However, deviating conditions regarding ethnicity and the extent of immigration may mitigate the extent to which the results are generalisable. 5.3 Ethical considerations In Norway, the systematic measuring of height and weight in schools declined during the 1980 s (19) and in 1998 systematic measurements were replaced by measurements on medical indication only. In the 2011 national guidelines, the Norwegian Directorate of Health again recommends routine measurements of height and weight among children by the School Health Services (182). Unlike in 1920, where the great concern was whether children were sufficiently nourished, the reason now is quite the opposite. It is important to emphasise that obese individuals should not be seen as undesirable in any context. At the same time, obese people are subject to enormous social stigma and discrimination (41). To the best of our knowledge, there is no consensus on whether to consider childhood obesity a disease or not, because there is a lack of a clear and specific definition of disease. However, childhood obesity could have lifelong health consequences, such as type 2 diabetes and cardiovascular disease and is as such a big challenge from a public health perspective. As I have suggested earlier in this thesis, it is crucial that we broaden our understanding of how overweight and obesity are distributed in the population; in subgroups and in geographical regions etc. The measure of interest is on a population level, but in order to get these data we need information on individuals, optimally every single one. Some groups in Norway oppose the measuring of school children s height and weight. It is claimed that a focus on the body and body weight by regular weighing and measuring contributes to stigmatisation (183). This resistance and a public opinion, though limited, against measuring school children might be a response to a decade long focus on body (weight) and obesity. The opposing groups wish to emphasise the rights of the individual and do not necessarily see that in public 35
40 health, the individual must be seen as a part of the whole population. This issue was carefully considered in the planning phase of the NCG-study and discussed with experienced school health nurses. One great advantage was that the measurements were undertaken by the local school nurse, a professional health worker skilled in communicating with and relating to children. To ensure privacy, the school nurse saw only one child at a time, with children not told the results of the measurements. There is no one simple solution here, but the point is that as citizens and societies we have shared and common responsibility regarding health threats. This principle may also apply in this context, since a lack of knowledge about children s growth patterns will have profound implications for preventive health work (184). 36
41 6. Conclusions and future directions By studying predictors of overweight and obesity, we have found vulnerable subgroups in the Norwegian child population. General- and abdominal obesity were more prevalent among children living rurally compared to urban areas and children with divorced parents compared to children of married parents. Children of low-educated mothers were also at higher risk than children of higheducated mothers and especially those children living rurally. We also found educational height differences; children of low-educated mothers were on average lower. Furthermore, in a methodological study we found that failure to calibrate measuring instruments is likely to lead to increased variance of the BMI distribution, which in turn might impact the estimated prevalence of overweight and obesity in population-based surveys. Prevention of overweight and obesity in the child-population (as well among adults) is challenging. It has been claimed that Like cholera, obesity may be a problem that cannot be solved by individual persons but that requires community action. (185). The educational inequalities in adiposity and height that we have observed may be critical because the enduring socio-economic disparity in children will undoubtedly contribute to maintaining socio-economic differences in health. Structural measures aiming at giving the children equal preconditions for good health; ensuring that the good choices are easier to make for the families and for the children, are important. Preventive strategies should target risk groups as well as at the entire child-population so as to maximise health gain. A White Paper (St.meld ) specifies that the municipalities are required to have an overview of population health, and emphasises their particular responsibility for child and adolescent health. Future practise should therefore accentuate a sustained effort of periodically monitoring comparable anthropometric measurements of representative samples of children and adolescents. Regardless of chosen policies, monitoring will enable effective evaluation of any interventions and surveillance of future developments. Future research Obtaining longitudinal data would help us to study the development of children's height and weight, which is significant in itself to reveal the development of socio-economic inequalities. It will provide information on how general- and abdominal obesity is distributed; over time and in subgroups. Moreover, longitudinal data will increase our understanding of how family structure might impact on the development of overweight and obesity. Further research should be aimed at increasing knowledge of why rural children are more overweight and obese and developing indicators to better understand the mechanisms behind the observed urban rural differences. Geographic Information Systems (GIS) could be developed for this purpose; the physical environment of the community, e.g. 37
42 where the schools and their catchment areas are situated, could be analysed and the degree of urbanity be determined. Finally, to broaden the spectrum of indicators, at a minimum we should study how adiposity is distributed by ethnicity in a nationally representative sample. 38
43 7. References 1. Haslam DW, James WPT. Obesity. Lancet. 2005;366(9492): WHO. Global strategy on diet, physical activity and health: childhood overweight and obesity [cited 18 Dec 2013] Available from: 3. Singh AS, Mulder C, Twisk JW, van MW, Chinapaw MJ. Tracking of childhood overweight into adulthood: a systematic review of the literature. Obes Rev. 2008;9(5): Ebbeling CB, Pawlak DB, Ludwig DS. Childhood obesity: public-health crisis, common sense cure. Lancet. 2002;360(9331): The NS, Suchindran C, North KE, Popkin BM, Gordon-Larsen P. Association of adolescent obesity with risk of severe obesity in adulthood. JAMA. 2010;304(18): Nowicka P, Hoglund P, Birgerstam P, Lissau I, Pietrobelli A, Flodmark CE. Self-esteem in a clinical sample of morbidly obese children and adolescents. Acta Paediatr. 2009;98(1): WHO. Obesity: preventing and managing the global epidemic; report of a WHO consultation. Geneva: World Health Organization, WHO technical Report Series No WHO. Population-based prevention strategies for childhood obesity. Geneva: 2010 Report of the WHO forum and technical meeting MacMahon B, Trichopoulos D. Epidemiology: principles and methods. 2nd ed. Boston: Little Brown; Porta M, Greenland S, Last JM. A Dictionary of epidemiology. 5th ed. Oxford: Oxford University Press; Flegal KM, Troiano RP. Changes in the distribution of body mass index of adults and children in the US population. Int J Obes Relat Metab Disord. 2000;24(7): Olds T, Maher C, Zumin S, Peneau S, Lioret S, Castetbon K, et al. Evidence that the prevalence of childhood overweight is plateauing: data from nine countries. Int J Pediatr Obes. 2011;6 (5-6): Stamatakis E, Wardle J, Cole TJ. Childhood obesity and overweight prevalence trends in England: evidence for growing socioeconomic disparities. Int J Obes (Lond). 2010;34(1): Morgen CS, Rokholm B, Brixval CS, Andersen CS, Andersen LG, Rasmussen M, et al. Trends in Prevalence of Overweight and Obesity in Danish Infants, Children and Adolescents Are We Still on a Plateau? PLoS ONE. 2013;8(7):e Kapoor SK, Anand K. Nutritional transition: a public health challenge in developing countries. J Epidemiol Community Health. 2002;56(11):
44 16. Popkin BM. The Nutrition Transition: An Overview of World Patterns of Change. Nutr Rev. 2004;62:S140-S Wang Y, Lobstein T. Worldwide trends in childhood overweight and obesity. Int J Pediatr Obes. 2006;1(1): Brundtland GH, Liestol K, Walloe L. Height, weight and menarcheal age of Oslo schoolchildren during the last 60 years. Ann Hum Biol. 1980;7(4): Liestøl K, Rosenberg M. Height, weight and menarcheal age of schoolgirls in Oslo an update. Ann Hum Biol. 1995;22(3): Sundal A. The norms for height (length) and weight in healthy Norwegian children from birth to 15 years of age. Bergen: Norwegian Universities Press; Waaler PE. Anthropometric studies in Norwegian children. Acta Paediatr Scand Suppl. 1983;308: Krokstad S, Knudtsen MS, editors. Folkehelse i endring: Helseundersøkelsen Nord-Trøndelag : HUNT 1 ( ) - HUNT 2 ( ) - HUNT 3 ( ). Levanger: HUNT forskningssenter; [Norwegian] 23. Bjornelv S, Lydersen S, Holmen J, Lund Nilsen TI, Holmen TL. Sex differences in time trends for overweight and obesity in adolescents: the Young-HUNT study. Scand J Public Health. 2009;37(8): Juliusson PB, Roelants M, Eide GE, Hauspie R, Waaler PE, Bjerknes R. Overweight and obesity in Norwegian children: Secular trends in weight-for-height and skinfolds. Acta Paediatr. 2007;96(9): Helsedirektoratet. Fysisk aktivitet blant barn og unge i Norge. En kartlegging av aktivitetsnivå og fysisk form hos 9- og 15-åringer. Oslo: Helsedirektoratet, [Norwegian] 26. Kolle E, Steene-Johannessen J, Holme I, Andersen LB, Anderssen SA. Secular trends in adiposity in Norwegian 9-year-olds from to BMC Public Health. 2009;9: Klasson-Heggebo L, Anderssen SA. Gender and age differences in relation to the recommendations of physical activity among Norwegian children and youth. Scand J Med Sci Sports. 2003;13(5): Andersen LF, Lillegaard IT, Overby N, Lytle L, Klepp KI, Johansson L. Overweight and obesity among Norwegian schoolchildren: changes from 1993 to Scand J Public Health. 2005;33(2): Groholt EK, Stigum H, Nordhagen R. Overweight and obesity among adolescents in Norway: cultural and socio-economic differences. J Public Health. 2008;30(3): Júlíusson PB, Eide GE, Roelants M, Waaler PE, Hauspie R, Bjerknes R. Overweight and obesity in Norwegian children: prevalence and socio-demographic risk factors. Acta Paediatr. 2010;99(6):
45 31. Bjelland M, Lien N, Bergh IH, Grydeland M, Anderssen SA, Klepp KI, et al. Overweight and waist circumference among Norwegian 11-year-olds and associations with reported parental overweight and waist circumference: The HEIA study. Scand J Public Health. 2010;38 (Suppl 5): Vilimas K, Glavin K, Donovan ML. Overvekt hos åtte- og 12-åringer i Oslo i Tidsskr Nor Laegeforen. 2005;125(22): Helsedirektoratet. Fysisk aktivitet blant 6-, 9- og 15-åringer i Norge. Resultater fra en kartlegging i Oslo: Helsedirektoratet, [Norwegian] 34. Juliusson PB, Roelants M, Eide GE, Moster D, Juul A, Hauspie R, et al. Vekstkurver for norske barn - Growth references for Norwegian children. Tidsskr Nor Laegeforen. 2009;129(4): Norwegian Directorate of Health. Physical activity among children and young people in Norway. Oslo: Norwegian Directorate of Health, Norwegian Institue of Public Health. The Child Growth Study, Norwegian Institute of Public Health, [cited 18 Dec 2013] Available from: Brannsether B, Roelants M, Bjerknes R, Juliusson PB. Waist circumference and waist-toheight ratio in Norwegian children 4-18 years of age: reference values and cut-off levels. Acta Paediatr. 2011;100(12): Branca F, Nikogosian H, Lobstein T, editors. The Challenge of obesity in the WHO European Region and the strategies for response. Copenhagen: World Health Organization, Europe; Lien N, Henriksen HB, Nymoen LL, Wind M, Klepp KI. Availability of data assessing the prevalence and trends of overweight and obesity among European adolescents. Public Health Nutr. 2010;13(10A): WHO. European Childhood Obesity Surveillance Initiative (COSI) Copenhagen, Denmark: World Health Organization; [cited 18 Dec 2013] Available from: Allison DB, Downey M, Atkinson RL, Billington CJ, Bray GA, Eckel RH, et al. Obesity as a Disease: A White Paper on Evidence and Arguments Commissioned by the Council of The Obesity Society. Obesity. 2008;16(6): Kopelman PG. Obesity as a medical problem. Nature. 2000;404(6778): Liu Y, Chen HJ, Liang L, Wang Y. Parent-child resemblance in weight status and its correlates in the United States. PLoS One. 2013;8(6):e Lake JK, Power C, Cole TJ. Child to adult body mass index in the 1958 British birth cohort: associations with parental obesity. Arch Dis Child. 1997;77(5): Whitaker RC, Wright JA, Pepe MS, Seidel KD, Dietz WH. Predicting obesity in young adulthood from childhood and parental obesity. N Engl J Med. 1997;337(13):
46 46. Maes HH, Neale MC, Eaves LJ. Genetic and environmental factors in relative body weight and human adiposity. Behav Genet. 1997;27(4): Stunkard AJ, Harris JR, Pedersen NL, McClearn GE. The body-mass index of twins who have been reared apart. N Engl J Med. 1990;322(21): Farooqi IS, O Rahilly S. Genetics of Obesity in Humans. Endocr Rev. 2006;27(7): Lyon HN, Hirschhorn JN. Genetics of common forms of obesity: a brief overview. Am J Clin Nutr. 2005;82(1):215S-7S. 50. Willer CJS, Elizabeth K; Loos,Ruth J F; Li, Shengxu; Lindgren,Cecilia M; et al. Six new loci associated with body mass index highlight a neuronal influence on body weight regulation. Nat Genet. 2009;41(1): Han JC, Lawlor DA, Kimm SYS. Childhood obesity. Lancet. 2010;375(9727): Story M, Evans M, Fabsitz RR, Clay TE, Rock BH, Broussard B. The epidemic of obesity in American Indian communities and the need for childhood obesity-prevention programs. Am J Clin Nutr. 1999;69(4):747S-54S. 53. Malik VS, Schulze MB, Hu FB. Intake of sugar-sweetened beverages and weight gain: a systematic review. Am J Clin Nutr. 2006;84(2): Mitchell JA, Rodriguez D, Schmitz KH, Audrain-McGovern J. Greater screen time is associated with adolescent obesity: a longitudinal study of the BMI distribution from Ages 14 to 18. Obesity (Silver Spring). 2013;21(3): Kristiansen H, Juliusson PB, Eide GE, Roelants M, Bjerknes R. TV viewing and obesity among Norwegian children: the importance of parental education. Acta Paediatr. 2013;102(2): Lawlor DA, Fraser A, Lindsay RS, Ness A, Dabelea D, Catalano P, et al. Association of existing diabetes, gestational diabetes and glycosuria in pregnancy with macrosomia and offspring body mass index, waist and fat mass in later childhood: findings from a prospective pregnancy cohort. Diabetologia. 2010;53(1): Catalano PM, Thomas A, Huston-Presley L, Amini SB. Increased fetal adiposity: a very sensitive marker of abnormal in utero development. Am J Obstet Gynecol. 2003;189(6): Owen CG, Martin RM, Whincup PH, Davey-Smith G, Gillman MW, Cook DG. The effect of breastfeeding on mean body mass index throughout life: a quantitative review of published and unpublished observational evidence. Am J Clin Nutr. 2005;82(6): Toschke AM, Martin RM, von Kries R, Wells J, Smith GD, Ness AR. Infant feeding method and obesity: body mass index and dual-energy X-ray absorptiometry measurements at 9-10 y of age from the Avon Longitudinal Study of Parents and Children (ALSPAC). Am J Clin Nutr. 2007;85(6):
47 60. Ong KKL, Ahmed ML, Emmett PM, Preece MA, Dunger DB. Association between postnatal catch-up growth and obesity in childhood: prospective cohort study. BMJ. 2000;320(7240): Baird J, Fisher D, Lucas P, Kleijnen J, Roberts H, Law C. Being big or growing fast: systematic review of size and growth in infancy and later obesity. BMJ. 2005;331(7522): Glavin K, Roelants M, Strand BH, Juliusson PB, Lie KK, Helseth S, et al. Important periods of weight development in childhood: a population based longitudinal study. [submitted 2013]. 63. Norwegian Institute of Public Health. Andelen tunge fortsetter å gå ned [The proportion of heavy newborns continue to decrease] [cited 18 Dec 2013] Available from: Ebbing M.;Klungsøyr K. Årstabeller for Medisinsk fødselsregister Fødsler i Norge [Annual statistics from the Medical Birth Registry of Norway Births in Norway ]. Norwegian Institute of Public Health, [Norwegian] 65. Galobardes B, Shaw M, Lawlor DA, Lynch JW, Davey Smith G. Indicators of socioeconomic position (part 1). J Epidemiol Community Health. 2006;60(1): Wang Y. Cross-national comparison of childhood obesity: the epidemic and the relationship between obesity and socioeconomic status. Int J Epidemiol. 2001;30(5): Bammann K, Gwozdz W, Lanfer A, Barba G, De Henauw S, Eiben G, et al. Socioeconomic factors and childhood overweight in Europe: results from the multi-centre IDEFICS study. Pediatr Obes. 2013;8(1): Shrewsbury V, Wardle J. Socioeconomic status and adiposity in childhood: a systematic review of cross-sectional studies Obesity (Silver Spring). 2008;16: Lien N, Kumar BN, Holmboe-Ottesen G, Klepp KI, Wandel M. Assessing social differences in overweight among 15- to 16-year-old ethnic Norwegians from Oslo by register data and adolescent self-reported measures of socio-economic status. Int J Obes. 2007;31(1): Morgen CS, Mortensen LH, Rasmussen M, Andersen AM, Sorensen TI, Due P. Parental socioeconomic position and development of overweight in adolescence: longitudinal study of Danish adolescents. BMC Public Health. 2010;10: Moraeus L, Lissner L, Yngve A, Poortvliet E, Al-Ansari U, Sjoberg A. Multi-level influences on childhood obesity in Sweden: societal factors, parental determinants and child's lifestyle. Int J Obes. 2012;36(7): Kautiainen S, Koivisto A-M, Koivusilta L, Lintonen T, Virtanen SM, Rimpelä A. Sociodemographic factors and a secular trend of adolescent overweight in Finland. Int J Pediatr Obes. 2009;4(4): Befort CA, Nazir N, Perri MG. Prevalence of obesity among adults from rural and urban areas of the United States: findings from NHANES ( ). J Rural Health. 2012;28(4):
48 74. Omsland TK, Ahmed LA, Grønskag A, Schei B, Emaus N, Langhammer A, et al. More forearm fractures among urban than rural women: The NOREPOS study based on the Tromsø study and the HUNT study. J Bone Miner Res. 2011;26(4): Krokstad S, Ernstsen L, Sund ER, Bjorngaard JH, Langhammer A, Midthjell K, et al. Social and spatial patterns of obesity diffusion over three decades in a Norwegian county population: the HUNT Study. BMC Public Health. 2013;13(1): Zeller MH, Reiter-Purtill J, Modi AC, Gutzwiller J, Vannatta K, Davies WH. Controlled study of critical parent and family factors in the obesigenic environment. Obesity (Silver Spring). 2007;15(1): Paciorek CJ, Stevens GA, Finucane MM, Ezzati M. Children's height and weight in rural and urban populations in low-income and middle-income countries: a systematic analysis of population-representative data. Lancet Global Health. 2013;1(5):e300-e Sjoberg A, Moraeus L, Yngve A, Poortvliet E, Al-Ansari U, Lissner L. Overweight and obesity in a representative sample of schoolchildren - exploring the urban-rural gradient in Sweden. Obes Rev. 2011;12(5): Rasmussen F, Johansson M, Hansen HO. Trends in overweight and obesity among 18-year-old males in Sweden between 1971 and Acta Paediatr. 1999;88(4): Neovius M, Janson A, Rossner S. Prevalence of obesity in Sweden. Obes Rev. 2006;7(1): Vuorela N, Saha M-T, Salo M. Prevalence of overweight and obesity in 5- and 12-year-old Finnish children in 1986 and Acta Paediatr. 2009;98(3): Bertoncello C, Cazzaro R, Ferraresso A, Mazzer R, Moretti G. Prevalence of overweight and obesity among school-aged children in urban, rural and mountain areas of the Veneto Region, Italy. Public Health Nutr. 2008;11(9): Lutfiyya MN, Lipsky MS, Wisdom-Behounek J, Inpanbutr-Martinkus M. Is rural residency a risk factor for overweight and obesity for U.S. children? Obesity. 2007;15(9): Liu J, Bennett KJ, Harun N, Probst JC. Urban-rural differences in overweight status and physical inactivity among US children aged years. J Rural Health. 2008;24(4): Bailey-Davis L, Horst M, Hillemeier MM, Lauter A. Obesity Disparities Among Elementary- Aged Children: Data From School-Based BMI Surveillance. Pediatrics. 2012;130(6): Bruner MW, Lawson J, Pickett W, Boyce W, Janssen I. Rural Canadian adolescents are more likely to be obese compared with urban adolescents. Int J Pediatr Obes. 2008;3(4): Ismailov RM, Leatherdale ST. Rural-urban differences in overweight and obesity among a large sample of adolescents in Ontario. Int J Pediatr Obes. 2010;5(4): Simen-Kapeu A, Kuhle S, Veugelers PJ. Geographic differences in childhood overweight, physical activity, nutrition and neighbourhood facilities: implications for prevention. Can J Public Health. 2010;101(2):
49 89. Thornorisdottir IE, Kristjansson AL, Sigfusdottir ID, Allegrante JP. The landscape of overweight and obesity in icelandic adolescents: geographic variation in body-mass index between 2000 and J Community Health. 2012;37(1): Hodgkin E, Hamlin MJ, Ross JJ, Peters F. Obesity, energy intake and physical activity in rural and urban New Zealand children. Rural Remote Health. 2010;10(2): Heyerdahl N, Aamodt G, Nordhagen R, Hovengen R. Overvekt hos barn - hvilken betydning har bosted? [Overweight children - how important is the urban/rural factor?] Tidsskr Nor Laegeforen. 2012;132(9): [Norwegian] 92. Antecol H, Bedard K. Unhealthy assimilation: Why do immigrants converge to American health status levels? Demography. 2006;43(2): Renzaho AMN, Swinburn B, Burns C. Maintenance of traditional cultural orientation is associated with lower rates of obesity and sedentary behaviours among African migrant children to Australia. Int J Obes. 2008;32(4): van der Horst K, Oenema A, te Velde SJ, Brug J. Gender, ethnic and school type differences in overweight and energy balance-related behaviours among Dutch adolescents. Int J Pediatr Obes. 2009;4(4): Brug J, van Stralen MM, Chinapaw MJ, De Bourdeaudhuij I, Lien N, Bere E, et al. Differences in weight status and energy-balance related behaviours according to ethnic background among adolescents in seven countries in Europe: the ENERGY-project. Pediatr Obes. 2012;7(5): Bhopal RS. Ethnicity, race, and health in multicultural societies : foundations for better epidemiology, public health and health care. Oxford: Oxford University Press; Iversen T, Ma C-t, A., Meyer HE. Immigrants' acculturation and changes in Body Mass Index. Econ Hum Biol. 2013;11(1): Kumar BN, Meyer HE, Wandel M, Dalen I, Holmboe-Ottesen G. Ethnic differences in obesity among immigrants from developing countries, in Oslo, Norway. Int J Obes. 2005;30(4): Kumar BN, Holmboe-Ottesen G, Lien N, Wandel M. Ethnic differences in body mass index and associated factors of adolescents from minorities in Oslo, Norway: a cross-sectional study. Public Health Nutr. 2004;7(08): Texmon I. Samliv i Norge mot slutten av 1900-tallet, pp I: NOU (1999:25). Samboerne og samfunnet. Oslo, Statens forvaltningstjeneste [Norwegian] 101. Stenhammar C, Olsson G, Bahmanyar S, Hulting AL, Wettergren B, Edlund B, et al. Family stress and BMI in young children. Acta Paediatr. 2010;99(8): Størksen I, Røysamb E, Holmen TL, Tambs K. Adolescent adjustment and well-being: Effects of parental divorce and distress. Scand J Psychol. 2006;47(1): Augustine JM, Kimbro Rt. Family structure and obesity among U.S. children. J Applied Research on Children. 2013;4(1):
50 104. Yannakoulia M, Papanikolaou K, Hatzopoulou I, Efstathiou E, Papoutsakis C, Dedoussis GV. Association Between Family Divorce and Children's BMI and Meal Patterns: The GENDAI Study. Obesity. 2008;16(6): Chen AY, Escarce JJ. Family structure and childhood obesity, Early Childhood Longitudinal Study - Kindergarten Cohort. Prev Chronic Dis. 2010;7(3):A Hesketh K, Crawford D, Salmon J, Jackson M, Campbell K. Associations between family circumstance and weight status of Australian children. Int J Pediatr Obes. 2007;2(2): Arkes J. Longitudinal association between marital disruption and child BMI and obesity. Obesity (Silver Spring). 2012;20(8): Gray VB, Byrd SH, Cossman JS, Chromiak J, Cheek WK, Jackson GB. Family characteristics have limited ability to predict weight status of young children. J Am Diet Assoc. 2007;107(7): Eidsdottir S, Kristjansson A, Sigfusdottir ID, Garber CE, Allegrante JP. Secular trends in overweight and obesity among Icelandic adolescents: do parental education levels and family structure play a part? Scand J Public Health. 2013;41(4): Strauss RS, Knight J. Influence of the Home Environment on the Development of Obesity in Children. Pediatrics. 1999;103(6):e Huffman FG, Kanikireddy S, Patel M. Parenthood--a contributing factor to childhood obesity. Int J Environ Res Public Health. 2010;7(7): Rooney BL, Mathiason MA, Schauberger CW. Predictors of Obesity in Childhood, Adolescence, and Adulthood in a Birth Cohort. Matern Child Health J. 2011;15(8): Dubois L, Girard M. Early determinants of overweight at 4.5 years in a population-based longitudinal study. Int J Obes. 2006;30(4): Al Mamun A, Lawlor DA, Cramb S, O'Callaghan M, Williams G, Najman J. Do Childhood Sleeping Problems Predict Obesity in Young Adulthood? Evidence from a Prospective Birth Cohort Study. Am J Epidemiol. 2007;166(12): Reilly JJ, Armstrong J, Dorosty AR, Emmett PM, Ness A, Rogers I, et al. Early life risk factors for obesity in childhood: cohort study. BMJ. 2005;330: Turnbaugh PJ, Hamady M, Yatsunenko T, Cantarel BL, Duncan A, Ley RE, et al. A core gut microbiome in obese and lean twins. Nature. 2009;457(7228): Garrow JS. Obesity and related diseases. Edinburgh: Churchill Livingstone; Burniat W, Cole TJ, Lissau I, Poskitt EME, editors. Child and adolescent obesity: causes and consequences, prevention and management. Cambridge: Cambridge University Press; Lobstein T, Baur L, Uauy R, TaskForce IIO. Obesity in children and young people: a crisis in public health. Obes Rev. 2004;5(1 suppl):
51 120. Reilly JJ, Dorosty AR, Emmett PM, Team ALSoPaCS. Identification of the obese child: adequacy of the body mass index for clinical practice and epidemiology. Int J Obes Relat Metab Disord. 2000;24(12): Dietz WH, Bellizzi MC. Introduction: the use of body mass index to assess obesity in children. Am J Clin Nutr. 1999;70(1):123S-5S Neovius M, Linne Y, Barkeling B, Rossner S. Discrepancies between classification systems of childhood obesity. Obes Rev. 2004;5(2): Freedman DS, Ogden CL, Berenson GS, Horlick M. Body mass index and body fatness in childhood. Curr Opin Clinical Nutr Metab Care. 2005;8(6): Maynard LM, Wisemandle W, Roche AF, Chumlea WC, Guo SS, Siervogel RM. Childhood body composition in relation to body mass index. Pediatrics. 2001;107(2): Neovius MG, Linne YM, Barkeling BS, Rossner SO. Sensitivity and specificity of classification systems for fatness in adolescents. Am J Clin Nutr. 2004;80(3): Freedman DS, Sherry B. The validity of BMI as an indicator of body fatness and risk among children. Pediatrics. 2009;124:Suppl Moreno LA, Pineda I, Rodriguez G, Fleta J, Sarria A, Bueno M. Waist circumference for the screening of the metabolic syndrome in children. Acta Paediatr. 2002;91(12): Mokha J, Srinivasan S, DasMahapatra P, Fernandez C, Chen W, Xu J, et al. Utility of waist-toheight ratio in assessing the status of central obesity and related cardiometabolic risk profile among normal weight and overweight/obese children: The Bogalusa Heart Study. BMC Pediatrics. 2010;10(1): Maffeis C, Banzato C, Talamini G. Waist-to-Height Ratio, a Useful Index to Identify High Metabolic Risk in Overweight Children. J Pediatr. 2008;152(2): Kahn HS, Imperatore G, Cheng YJ. A population-based comparison of BMI percentiles and waist-to-height ratio for identifying cardiovascular risk in youth. J Pediatr. 2005;146(4): Garnett SP, Baur LA, Cowell CT. Waist-to-height ratio: a simple option for determining excess central adiposity in young people. Intl J Obes. 2008;32(6): McCarthy HD, Ashwell M. A study of central fatness using waist-to-height ratios in UK children and adolescents over two decades supports the simple message - /`keep your waist circumference to less than half your height/'. Int J Obes. 2006;30(6): McCarthy HD, Jarrett KV, Emmett PM, Rogers I. Trends in waist circumferences in young British children: a comparative study. Int J Obes (Lond). 2004;29(2): McCarthy HD, Ellis SM, Cole TJ. Central overweight and obesity in British youth aged years: cross sectional surveys of waist circumference. BMJ. 2003;326(7390): Dollman J, Olds TS. Secular changes in fatness and fat distribution in Australian children matched for body size. Int J Pediatr Obes. 2006;1(2):
52 136. Daniels SR, Khoury PR, Morrison JA. Utility of different measures of body fat distribution in children and adolescents. Am J Epidemiol. 2000;152(12): Taylor RW, Williams SM, Grant AM, Ferguson E, Taylor BJ, Goulding A. Waist circumference as a measure of trunk fat mass in children aged 3 to 5 years. Int J Pediatr Obes. 2008;3(4): Brambilla P, Bedogni G, Moreno LA, Goran MI, Gutin B, Fox KR, et al. Crossvalidation of anthropometry against magnetic resonance imaging for the assessment of visceral and subcutaneous adipose tissue in children. Int J Obes (Lond). 2006;30(1): McCarthy HD. Body fat measurements in children as predictors for the metabolic syndrome: focus on waist circumference. Proc Nutr Soc. 2006;65(4): Rolland-Cachera MF. Childhood obesity: current definitions and recommendations for their use. Int J Pediatr Obes. 2011;6(5-6): Cole TJ, Bellizzini MC, Flegal KM, Dietz WH. Establishing a standard definition for child overweight and obesity worldwide: international survey. BMJ. 2000;320(7244): de Onis M, Onyango AW, Borghi E, Siyam A, Nishida C, Siekmann J. Development of a WHO growth reference for school-aged children and adolescents. Bull World Health Organ. 2007;85(9): WHO Multicenter Growth Reference Study Group. WHO Child Growth Standards based on length/height, weight and age. Acta Paediatr Suppl. 2006;450(1): Kuczmarski RJ, Ogden CL, Grummer-Strawn LM, Flegal KM, Guo SS, Wei R, et al. CDC growth charts: United States. Adv Data. 2000(314): Rito A, Wijnhoven TMA, Rutter H, Carvalho MA, Paixão E, Ramos C, et al. Prevalence of obesity among Portuguese children (6-8 years old) using three definition criteria: COSI Portugal, Pediatric Obesity. 2012;7(6): McCarthy HD, Jarrett KV, Crawley HF. The development of waist circumference percentiles in British children aged y. Eur J Clin Nutr. 2001;55(10): Schwandt P, Kelishadi R, Haas GM. First reference curves of waist circumference for German children in comparison to international values: the PEP Family Heart Study. World J Pediatr. 2008;4(4): Sung RY, So HK, Choi KC, Nelson EA, Li AM, Yin JA, et al. Waist circumference and waist-toheight ratio of Hong Kong Chinese children. BMC Public Health. 2008;8: Roswall J, Bergman S, Almqvist-Tangen G, Alm B, Niklasson A, Nierop AFM, et al. Populationbased waist circumference and waist-to-height ratio reference values in preschool children. Acta Paediatr. 2009;98(10): Ortega FB, Ruiz JR, Vicente-Rodriguez G, Sjöström M. Central adiposity in 9- and 15-year-old Swedish children from the European Youth Heart Study. Int J Pediatr Obes. 2008;3(4):
53 151. Wijnhoven TMA, van Raaij JMA, Spinelli A, Rito AI, Hovengen R, Kunesova M, et al. WHO European Childhood Obesity Surveillance Initiative 2008: weight, height and body mass index in 6 9-year-old children. Pediatr Obes. 2013;8(2): Norton K, Olds T, editors. Anthropometrica. Sydney: University of New South Wales Press; WHO. Physical status: the use and interpretation of anthropometry: report of a WHO Expert Committee. Geneva: World Health Organization, WHO technical Report Series No WHO. The WHO Reference Growth reference data 5-19 years. [cited 18 Dec 2013]. Available from: Rothman KJ. Epidemiology: an introduction. Oxford: Oxford University Press; Søgaard AJ, Gustad T, Bjertness E, Tell G, Schei B, Emaus N, et al. Urban-rural differences in distal forearm fractures: Cohort Norway. Osteoporos Int. 2007;18(8): Meyer HE, Berntsen GKR, Søgaard AJ, Langhammer A, Schei B, Fønnebø V, et al. Higher Bone Mineral Density in Rural Compared with Urban Dwellers: The NOREPOS Study. Am J Epidemiol. 2004;160(11): Ahmed ML, Yudkin PL, Macfarlane JA, McPherson K, Dunger DB. Are measurements of height made by health visitors sufficiently accurate for routine screening of growth? Arch Dis Child. 1990;65(12): Ulijaszek SJ, Kerr DA. Anthropometric measurement error and the assessment of nutritional status. Br J Nutr. 1999;82(3): Stoddard SA, Kubik MY, Skay C. Is school-based height and weight screening of elementary students private and reliable? J Sch Nurs. 2008;24(1): Wang J, Thornton JC, Bari S, Williamson B, Gallagher D, Heymsfield SB, et al. Comparisons of waist circumferences measured at 4 sites. Am J Clin Nutr. 2003;77(2): Grydeland M, Bergh IH, Bjelland M, Lien N, Andersen LF, Ommundsen Y, et al. Correlates of weight status among Norwegian 11-year-olds: The HEIA study. BMC Public Health. 2012;12: Binkin N, Fontana G, Lamberti A, Cattaneo C, Baglio G, Perra A, et al. A national survey of the prevalence of childhood overweight and obesity in Italy. Obes Rev. 2010;11(1): Midthjell K, Lee CMY, Langhammer A, Krokstad S, Holmen TL, Hveem K, et al. Trends in overweight and obesity over 22 years in a large adult population: the HUNT Study, Norway. Clinical Obesity. 2013;3(1-2): Magnusson MB, Sjöberg A, Kjellgren KI, Lissner L. Childhood obesity and prevention in different socio-economic contexts. Prev Med. 2011;53(6): Galobardes B, McCormack VA, McCarron P, Howe LD, Lynch J, Lawlor DA, et al. Social inequalities in height: persisting differences today depend upon height of the parents. PLoS One. 2012;7(1):e
54 167. Samani-Radia D, McCarthy HD. Comparison of children's body fatness between two contrasting income groups: contribution of height difference. Int J Obes. 2011;35(1): Howe LD, Tilling K, Galobardes B, Smith GD, Gunnell D, Lawlor DA. Socioeconomic differences in childhood growth trajectories: at what age do height inequalities emerge? J Epidemiol Community Health. 2010;66: Meyer HE, Selmer R. Income, educational level and body height. Ann Hum Biol. 1999;26(3): Cavelaars AEJM, Kunst AE, Geurts JJM, Crialesi R, Grøtvedt L, Helmert U, et al. Persistent variations in average height between countries and between socio-economic groups: an overview of 10 European countries. Ann Hum Biol. 2000;27(4): Howe LD, Tilling K, Galobardes B, Smith GD, Ness AR, Lawlor DA. Socioeconomic disparities in trajectories of adiposity across childhood. Int J Pediatric Obesity. 2010;6(2-2):e144-e Cecil JE, Watt P, Murrie IS, Wrieden W, Wallis DJ, Hetherington MM, et al. Childhood obesity and socioeconomic status: a novel role for height growth limitation. Int J Obes. 2005;29(10): Mæland JG, Westin S, Elstad JI, Næss Ø. Sosial epidemiologi: sosiale årsaker til sykdom og helsesvikt. Oslo: Gyldendal akademisk; [Norwegian] 174. Diez Roux AV. The study of group-level factors in epidemiology: rethinking variables, study designs, and analytical approaches. Epidemiol Rev. 2004;26: Diez-Roux AV. Bringing context back into epidemiology: variables and fallacies in multilevel analysis. Am J Public Health. 1998;88(2): Sundquist J, Malmstrom M, Johansson SE. Cardiovascular risk factors and the neighbourhood environment: a multilevel analysis. Int J Epidemiol. 1999;28(5): Pickett KE, Pearl M. Multilevel analyses of neighbourhood socioeconomic context and health outcomes: a critical review. J EpidemiolCommunity Health. 2001;55(2): Diez Roux AV. Invited Commentary: Places, People, and Health. Am J Epidemiol. 2002;155(6): Shephard RJ. Limits to the measurement of habitual physical activity by questionnaires. Br J Sports Med. 2003;37(3): Sirard JR, Pate RR. Physical activity assessment in children and adolescents. Sports Med. 2001;31(6): Troxel WM, Matthews KA. What are the costs of marital conflict and dissolution to children's physical health? Clin Child Fam Psychol Rev. 2004;7(1): Helsedirektoratet. Nasjonale faglige retningslinjer for veiing og måling i helsestasjons- og skolehelsetjenesten. Oslo: Helsedirektoratet,
55 183. Rugseth G. Overvekt som livserfaring Et empirisk - teoretisk kunnskapsbidrag [PhD thesis]. Institute of Health and Society, University of Oslo; [Norwegian] 184. Rose G. The strategy of preventive medicine. Oxford: Oxford University Press; Katan MB. Weight-Loss Diets for the Prevention and Treatment of Obesity. N Engl J Med. 2009;360(9):
56 52
57 Appendix I - Overview table 53
58 54

59 An overview of Norwegian studies - the prevalence of overweight and obesity, from 1995 onwards. Studies not considered being representative other than regarding a very limited subpopulation or geographical area are excluded in this overview. 55
60 56
61 II - Metodebok for skolehelsetjenesten (Method booklet) 57
62 58
63 59
64 60

65 61
66 62
67 63
68 64
69 65
70 66
71 III - ELEV-skjema (Pupil-form) 67
72 68
73 69
74 70
75 IV - SKOLE-skjema (School form) 71
76 72
77 73
78 74
79 V- Samtykke (Consent form) 75
80 76
81 77
82 78
83 Papers 79
84
85 I
86

87

88

89
90

91

92
93 II
94
95

96

97
98
99
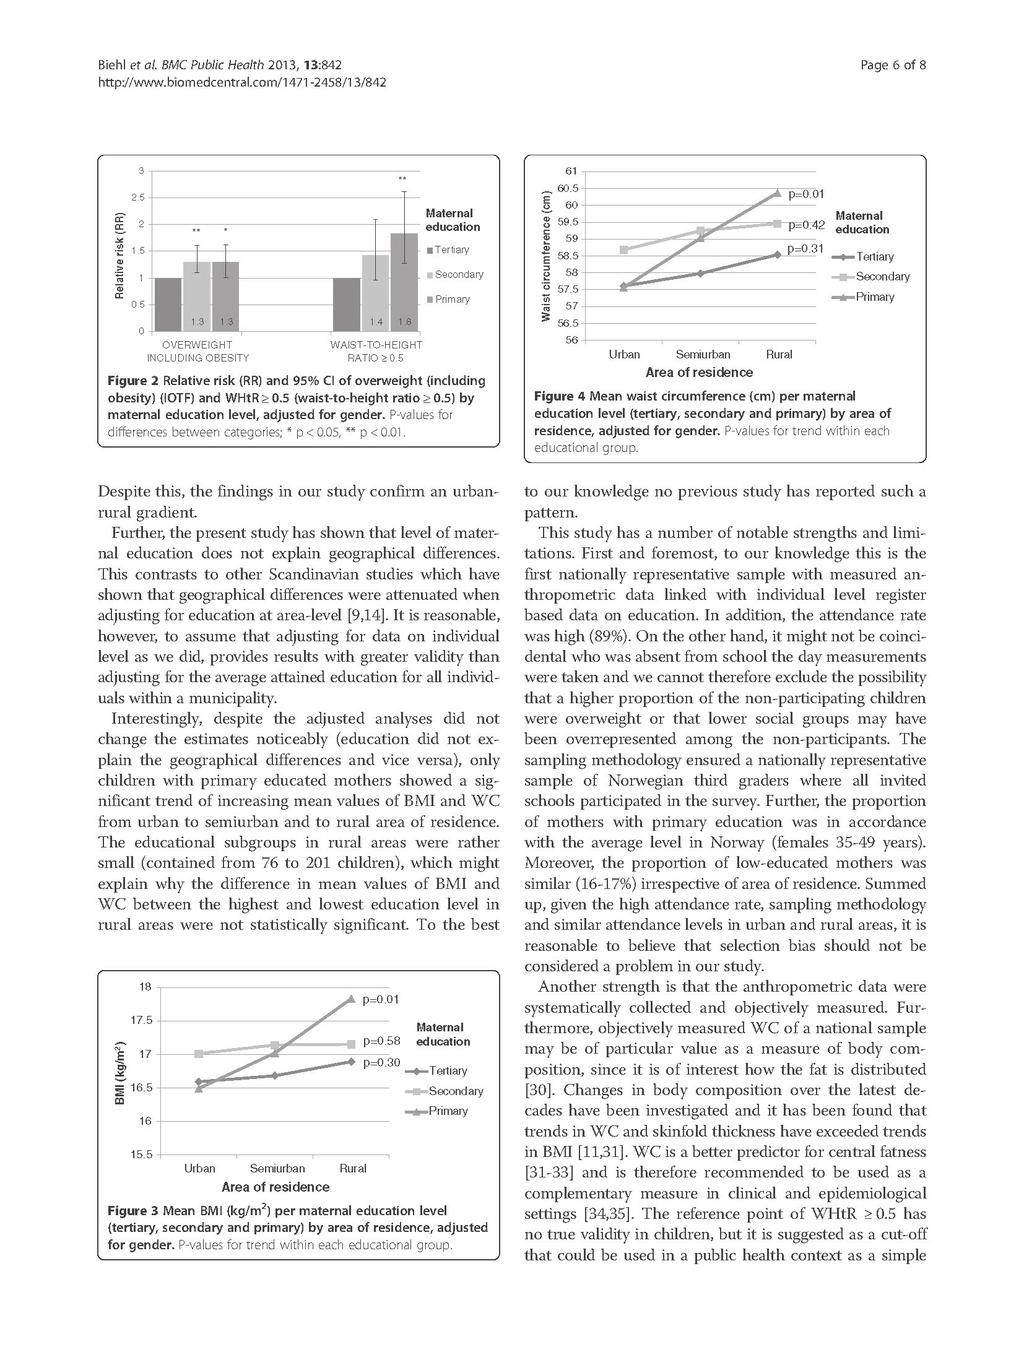
100

101
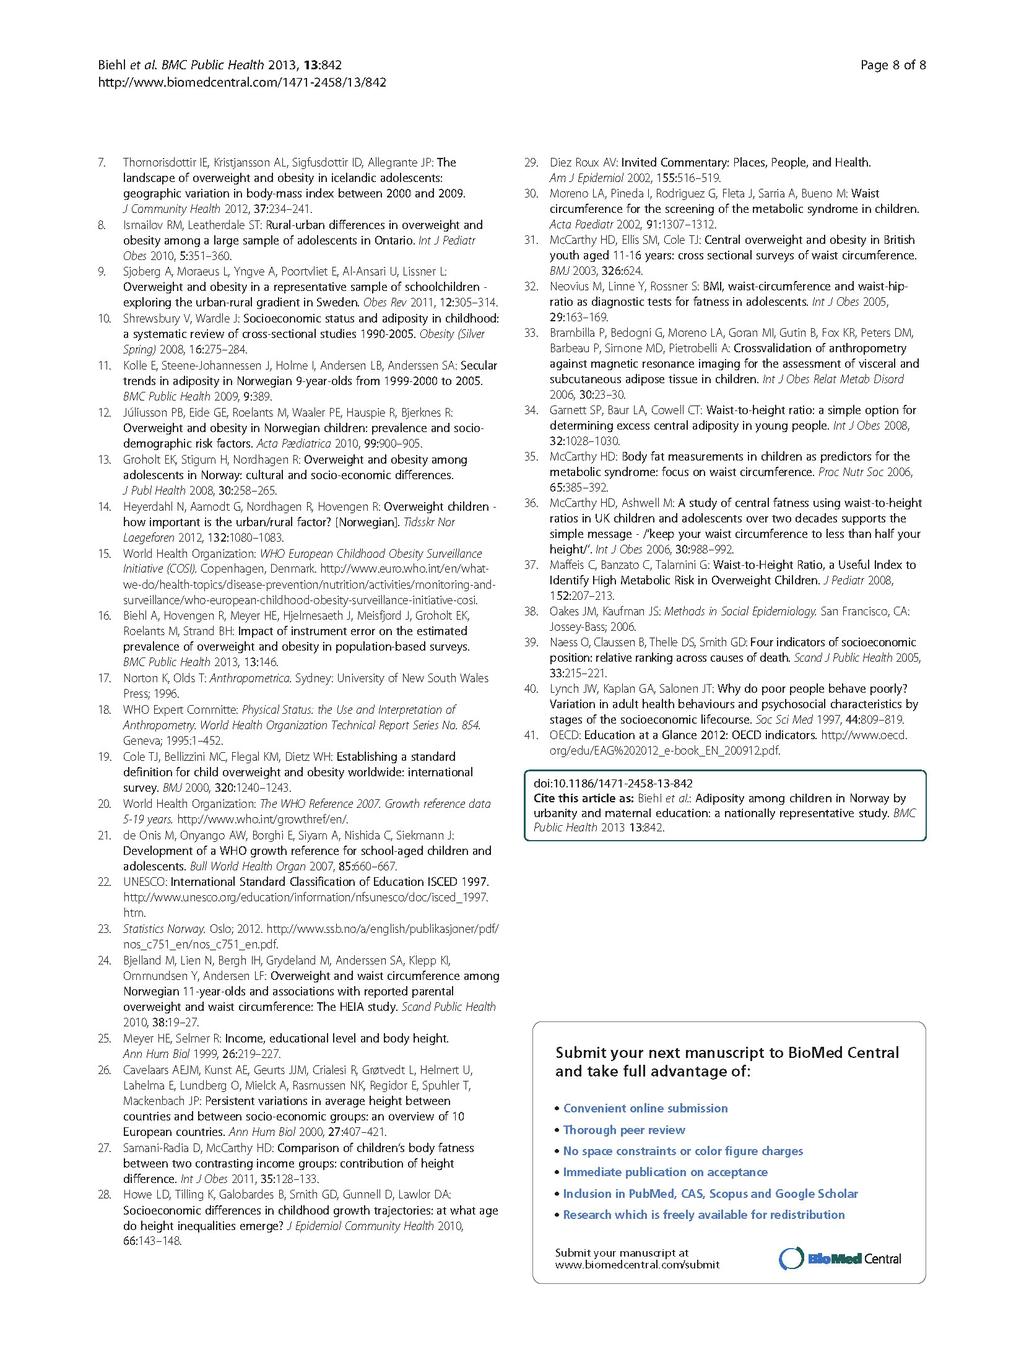
102
103 III
104
105
106
107
108
109
110
111

112
113

114
International Registries: The Government-Driven Model
 International Registries: The Government-Driven Model Pål Surén Norwegian Institute of Public Health Presentation outline Overview of Norwegian health registries The Norwegian Mother and Child Cohort Study
Downloaded from:
 Ridler, C; Townsend, N; Dinsdale, H; Mulhall, C; Rutter, H (2009) National child measurement programme: detailed analysis of the 2007/08 national dataset. National Obesity Observatory, London. p. 41. Downloaded
University Journal of Medicine and Medical Specialities
 ISSN 2455-2852 2019, Vol. 5(1) A STUDY ON PREVALENCE OF OVERWEIGHT AND OBESITY AND FACTORS INFLUENCING OBESITY AMONG SCHOOL GOING ADOLESCENTS IN CHENNAI, 2016 Author :KARTHICK B Department of PUBLIC HEALTH,MADRAS
BMI may underestimate the socioeconomic gradient in true obesity
 8 BMI may underestimate the socioeconomic gradient in true obesity Gerrit van den Berg, Manon van Eijsden, Tanja G.M. Vrijkotte, Reinoud J.B.J. Gemke Pediatric Obesity 2013; 8(3): e37-40 102 Chapter 8
ATTENTION-DEFICIT/HYPERACTIVITY DISORDER, PHYSICAL HEALTH, AND LIFESTYLE IN OLDER ADULTS
 CHAPTER 5 ATTENTION-DEFICIT/HYPERACTIVITY DISORDER, PHYSICAL HEALTH, AND LIFESTYLE IN OLDER ADULTS J. AM. GERIATR. SOC. 2013;61(6):882 887 DOI: 10.1111/JGS.12261 61 ATTENTION-DEFICIT/HYPERACTIVITY DISORDER,
Body Mass Index and Waist Hip Ratio among Youth of India
 Body Mass Index and Waist Hip Ratio among Youth of India 1 Dr. Anju Pathak and 2 Prof. A. K. Datta 1 Assistant Professor Dept. of Physical Education- TEL&R, PGGC, Sector-11, Chandigarh 2 Ex-Head, Department
COMMITTEE FOR MEDICINAL PRODUCTS FOR HUMAN USE (CHMP)
") European Medicines Agency London, 15 November 2007 Doc. Ref. EMEA/CHMP/EWP/517497/2007 COMMITTEE FOR MEDICINAL PRODUCTS FOR HUMAN USE (CHMP) GUIDELINE ON CLINICAL EVALUATION OF MEDICINAL PRODUCTS USED
European Medicines Agency London, 15 November 2007 Doc. Ref. EMEA/CHMP/EWP/517497/2007 COMMITTEE FOR MEDICINAL PRODUCTS FOR HUMAN USE (CHMP) GUIDELINE ON CLINICAL EVALUATION OF MEDICINAL PRODUCTS USED
Karri Silventoinen University of Helsinki and Osaka University
 Karri Silventoinen University of Helsinki and Osaka University Childhood is an important phase of life and creates the base for all further life Childhood is the time of rapid physiological development
How Early Health Affects Children s Life Chances
 How Early Health Affects Children s Life Chances David Figlio* Director, Institute for Policy Research Northwestern University Sulzberger Lecture, Duke University, January 13, 2015 *Collaborative research
CHAPTER 9 ADOLESCENT HEALTH
 CHAPTER 9 ADOLESCENT HEALTH 9.1 Introduction Adolescence constitutes a special phase of human development as it represents the transition between childhood and adulthood. It is a phase marked by substantial
Childhood Obesity in Dutchess County 2004 Dutchess County Department of Health & Dutchess County Children s Services Council
 Childhood Obesity in Dutchess County 2004 Dutchess County Department of Health & Dutchess County Children s Services Council Prepared by: Saberi Rana Ali, MBBS, MS, MPH Dutchess County Department of Health
Tracking the Obesity Epidemic: New Zealand Public Health Intelligence Occasional Bulletin No 24
 Tracking the Obesity Epidemic: New Zealand 1977 2003 Public Health Intelligence Occasional Bulletin No 24 Citation: Ministry of Health. 2004. Tracking the Obesity Epidemic: New Zealand 1977 2003. Wellington:
Master of Science. Obesity and Weight Management
 Department of Clinical Sciences and Nutrition Master of Science in Obesity and Weight Management Full-Time and Part-Time Taught Modular Masters Programme Module Descriptor Outlines XN7201 The Obesity Epidemic
Identifying best practice in actions on tobacco smoking to reduce health inequalities
 Identifying best practice in actions on tobacco smoking to reduce health inequalities An Matrix Knowledge Report to the Consumers, Health and Food Executive Agency, funded by the Health Programme of the
Broadening Course YPHY0001 Practical Session II (October 11, 2006) Assessment of Body Fat
 Assessment of Body Fat") Sheng HP - 1 Broadening Course YPHY0001 Practical Session II (October 11, 2006) Assessment of Body Fat REQUIRED FOR THIS PRACTICAL SESSION: 1. Please wear short-sleeve shirts / blouses for skin-fold measurements.
Sheng HP - 1 Broadening Course YPHY0001 Practical Session II (October 11, 2006) Assessment of Body Fat REQUIRED FOR THIS PRACTICAL SESSION: 1. Please wear short-sleeve shirts / blouses for skin-fold measurements.
PROJECT Ntshembo: Improving adolescent health and interrupting mother-infant transfer of health risk in Africa. INDEPTH Network
 PROJECT Ntshembo: Improving adolescent health and interrupting mother-infant transfer of health risk in Africa INDEPTH Network Overview Transitions across countries Transitions within countries - South
Our Healthy Community Partnership. and the Brown/Black Coalition are. pleased to release the Douglas County Health and
 Our Healthy Community Partnership and the Brown/Black Coalition are pleased to release the 2007 Douglas County Health and Disparities Report Card. This report provides a snapshot of local disparities in
Overview of the FITNESSGRAM Body Composition Standards
 body composition Body composition refers to the division of total body weight (mass) into components, most commonly fat mass and fat-free mass. The proportion of total body weight that is fat (referred
The effects of Aerobic Exercise vs. Progressive Resisted Exercise on body composition in obese children Dr.U.Ganapathy Sankar, Ph.
 The effects of Aerobic Exercise vs. Progressive Resisted Exercise on body composition in obese children Dr.U.Ganapathy Sankar, Ph.D Dean I/C, SRM College of Occupational Therapy, SRMUniversity, Kattankulathur,
World Health Organization Growth Standards. First Nations and Inuit Health Alberta Region: Training Module May 2011
 World Health Organization Growth Standards First Nations and Inuit Health Alberta Region: Training Module May 2011 Acknowledgements First Nation and Inuit Health Alberta Region would like to thank the
Executive Summary: Toi Te Ora s Childhood Obesity Prevention Strategy ( )
") Executive Summary: Toi Te Ora s Childhood Obesity Prevention Strategy (2013 2023) This briefing paper has been developed by Toi Te Ora Public Health Service (Toi Te Ora) to provide an evidence-based strategic
Executive Summary: Toi Te Ora s Childhood Obesity Prevention Strategy (2013 2023) This briefing paper has been developed by Toi Te Ora Public Health Service (Toi Te Ora) to provide an evidence-based strategic
RESEARCH. Dagfinn Aune, 1,2 Abhijit Sen, 1 Manya Prasad, 3 Teresa Norat, 2 Imre Janszky, 1 Serena Tonstad, 3 Pål Romundstad, 1 Lars J Vatten 1
 open access BMI and all cause mortality: systematic review and non-linear dose-response meta-analysis of 230 cohort studies with 3.74 million deaths among 30.3 million participants Dagfinn Aune, 1,2 Abhijit
Broadening Course YPHY0001 Practical Session III (March 19, 2008) Assessment of Body Fat
 Assessment of Body Fat") Sheng HP - 1 Broadening Course YPHY0001 Practical Session III (March 19, 2008) Assessment of Body Fat REQUIRED FOR THIS PRACTICAL SESSION: 1. Please wear short-sleeve shirts / blouses. Shirts / blouses
Sheng HP - 1 Broadening Course YPHY0001 Practical Session III (March 19, 2008) Assessment of Body Fat REQUIRED FOR THIS PRACTICAL SESSION: 1. Please wear short-sleeve shirts / blouses. Shirts / blouses
An important obstacle to the assessment of the prevalence of overweight and obesity in
 According to the World Health Organization (WHO), adolescents comprise about 19% of the world s population (approximately 1.2 billion people), yet adolescents remain a largely neglected, difficult-to-measure,
Surveillance report Published: 9 January 2017 nice.org.uk
 Surveillance report 2017 Caesarean section (2011) NICE guideline CG132 Surveillance report Published: 9 January 2017 nice.org.uk NICE 2017. All rights reserved. Contents Surveillance decision... 3 Reason
Socioeconomic Differentials in Misclassification of Height, Weight and Body Mass Index Based on Questionnaire Data
 International Journal of Epidemiology International Epidemiological Association 1997 Vol. 26, No. 4 Printed in Great Britain Socioeconomic Differentials in Misclassification of Height, Weight and Body
From the Center for Human Nutrition, Department of International Health, Johns Hopkins Bloomberg School of Public Health, Baltimore, MD.
 Epidemiologic Reviews Copyright ª 2007 by the Johns Hopkins Bloomberg School of Public Health All rights reserved; printed in U.S.A. Vol. 29, 2007 DOI: 10.1093/epirev/mxm007 Advance Access publication
Health Inequalities. Additional tables to accompany the 2016 Director of Public Health Annual Report
 Health Inequalities Additional tables to accompany the 2016 Director of Public Health Annual Report June 2017 Director of Public Health, Annual Report 2016 Supplementary Data Table no. OVERVIEW 1.1 Life
Records identified through database searching (n = 548): CINAHL (135), PubMed (39), Medline (190), ProQuest Nursing (39), PsyInFo (145)
: CINAHL (135), PubMed (39), Medline (190), ProQuest Nursing (39), PsyInFo (145)") Included Eligibility Screening Identification Figure S1: PRISMA 2009 flow diagram* Records identified through database searching (n = 548): CINAHL (135), PubMed (39), Medline (190), ProQuest Nursing (39),
Included Eligibility Screening Identification Figure S1: PRISMA 2009 flow diagram* Records identified through database searching (n = 548): CINAHL (135), PubMed (39), Medline (190), ProQuest Nursing (39),
Socioeconomic inequalities in lipid and glucose metabolism in early childhood
 10 Socioeconomic inequalities in lipid and glucose metabolism in early childhood Gerrit van den Berg, Manon van Eijsden, Francisca Galindo-Garre, Tanja G.M. Vrijkotte, Reinoud J.B.J. Gemke BMC Public Health
Statistics on Drug Misuse: England, 2007
 Statistics on Drug Misuse: England, 2007 Summary For the first time, this annual statistical bulletin presents information on drug misuse among both adults and children. The topics covered include: Prevalence
NEW WHO GROWTH CURVES Why in QATAR? Ashraf T Soliman MD PhD FRCP
 NEW WHO GROWTH CURVES Why in QATAR? Ashraf T Soliman MD PhD FRCP Qatar CIA World Factbook demographic statistics. Population : 928,635 (July 2008 est.) Age structure : 0-14 years: 23.7% (male 104,453;
Prevalence of Overweight Among Anchorage Children: A Study of Anchorage School District Data:
 Department of Health and Social Services Division of Public Health Section of Epidemiology Joel Gilbertson, Commissioner Richard Mandsager, MD, Director Beth Funk, MD, MPH, Editor 36 C Street, Suite 54,
EFFECT OF SMOKING ON BODY MASS INDEX: A COMMUNITY-BASED STUDY
 ORIGINAL ARTICLE. EFFECT OF SMOKING ON BODY MASS INDEX: A COMMUNITY-BASED STUDY Pragti Chhabra 1, Sunil K Chhabra 2 1 Professor, Department of Community Medicine, University College of Medical Sciences,
Reading and maths skills at age 10 and earnings in later life: a brief analysis using the British Cohort Study
 Reading and maths skills at age 10 and earnings in later life: a brief analysis using the British Cohort Study CAYT Impact Study: REP03 Claire Crawford Jonathan Cribb The Centre for Analysis of Youth Transitions
World Health Organization Growth Standards. BC Training Module PowerPoint Speaking Notes
 World Health Organization Growth Standards BC Training Module PowerPoint Speaking Notes May 30, 2011 British Columbia WHO Growth Chart Training June 2011 Page 1 PowerPoint Speaking Notes Slide 1 Title
Author's response to reviews
 Author's response to reviews Title:Mental health problems in the 10th grade and non-completion of upper secondary school: the mediating role of grades in a population-based longitudinal study Authors:
SELECTED FACTORS LEADING TO THE TRANSMISSION OF FEMALE GENITAL MUTILATION ACROSS GENERATIONS: QUANTITATIVE ANALYSIS FOR SIX AFRICAN COUNTRIES
 Public Disclosure Authorized Public Disclosure Authorized Public Disclosure Authorized Public Disclosure Authorized ENDING VIOLENCE AGAINST WOMEN AND GIRLS SELECTED FACTORS LEADING TO THE TRANSMISSION
8/10/2012. Education level and diabetes risk: The EPIC-InterAct study AIM. Background. Case-cohort design. Int J Epidemiol 2012 (in press)
") Education level and diabetes risk: The EPIC-InterAct study 50 authors from European countries Int J Epidemiol 2012 (in press) Background Type 2 diabetes mellitus (T2DM) is one of the most common chronic
Education level and diabetes risk: The EPIC-InterAct study 50 authors from European countries Int J Epidemiol 2012 (in press) Background Type 2 diabetes mellitus (T2DM) is one of the most common chronic
FORESIGHT Tackling Obesities: Future Choices Project Report Government Office for Science
 1. Introduction FORESIGHT Tackling Obesities: Future Choices Project Report Government Office for Science The UK Government s Foresight Programme creates challenging visions of the future to help inform
Using longitudinal studies to examine changes in health inequality: Cross-cohort differences in body mass index inequality.
 Using longitudinal studies to examine changes in health inequality: Cross-cohort differences in body mass index inequality David Bann Cross-cohort analyses prevalence and/or association changes Consortia:
Savannah :: Chatham. August rd Edition COMMUNITY INDICATORS DATABASE COUNTY CHATHAM. produced by the Armstrong Public Service Center
 photo: GA Dept. of Economic Development Savannah :: Chatham COMMUNITY INDICATORS DATABASE August 2013 3rd Edition produced by the Armstrong Public Service Center CHATHAM COUNTY www.savannah-chatham-indicators.org
Health Status Disparities in New Mexico Identifying and Prioritizing Disparities
 Health Status Disparities in New Mexico Identifying and Prioritizing Disparities Public Health Division March 23 Health Status Disparities in New Mexico Identifying and Prioritizing Disparities New Mexico
Lack of documentation on overweight & obese status in patients admitted to the coronary care unit: Results from the CCU study
 Lack of documentation on overweight & obese status in patients admitted to the coronary care unit: Results from the CCU study Meriam F. Caboral,, RN, MSN, NP-C Clinical Coordinator Heart Failure Components
Cervical screening. Cytology-based screening programmes
 HPV-FASTER: broadening the scope for prevention of HPV-related cancer Combining the complementary approaches of HPV vaccination and screening could accelerate declines in the burden of cervical cancer
PUBLIC AWARENESS SURVEY Evaluation report December 2017
 Ref. Ares(2017)6163019-15/12/2017 EUROPEAN CODE AGAINST CANCER PUBLIC AWARENESS SURVEY Evaluation report December 2017 Elisa Macellari This report is the result of an activity that has received funding
Australian Longitudinal Study on Women's Health TRENDS IN WOMEN S HEALTH 2006 FOREWORD
 Australian Longitudinal Study on Women's Health TRENDS IN WOMEN S HEALTH 2006 FOREWORD The Longitudinal Study on Women's Health, funded by the Commonwealth Government, is the most comprehensive study ever
Lecture Outline. Biost 517 Applied Biostatistics I. Purpose of Descriptive Statistics. Purpose of Descriptive Statistics
 Biost 517 Applied Biostatistics I Scott S. Emerson, M.D., Ph.D. Professor of Biostatistics University of Washington Lecture 3: Overview of Descriptive Statistics October 3, 2005 Lecture Outline Purpose
Appendix 1. Evidence summary
 Appendix 1. Evidence summary NG7 01. Recommendation 1 Encourage people to make changes in line with existing advice ES 1.17, 1.31, 1.32, 1.33, 1.37, 1.40, 1.50, 2.7, 2.8, 2.10; IDE New evidence related
Optimal Child Growth and critical periods for the prevention of childhood obesity
 Life Skills Workshop Friday, 17 February 2006 Optimal Child Growth and critical periods for the prevention of childhood obesity Margherita Caroli MD Ph D Nutrition Unit Dept. Prevention and Public Health
Community Health Profile: Minnesota, Wisconsin, & Michigan Tribal Communities 2006
 Community Health Profile: Minnesota, Wisconsin, & Michigan Tribal Communities 26 This report is produced by: The Great Lakes EpiCenter If you would like to reproduce any of the information contained in
Workshop on Understanding the Relationship Between Food Insecurity and Obesity Sentinel Populations November 16, 2010
 Workshop on Understanding the Relationship Between Food Insecurity and Obesity Sentinel Populations November 16, 2010 Rural Populations Christine M. Olson, Cornell University Definitions of Rural Rural
Expert Committee Recommendations Regarding the Prevention, Assessment, and Treatment of Child and Adolescent Overweight and Obesity: Summary Report
 Expert Committee s Regarding the Prevention, Assessment, and Treatment of Child and Adolescent Overweight and Obesity: Summary Report (1) Overview material Release Date December 2007 Status Available in
Higher Fruit Consumption Linked With Lower Body Mass Index
 Higher Fruit Consumption Linked With Lower Body Mass Index Biing-Hwan Lin and Rosanna Mentzer Morrison Healthy weight children, both girls and boys, consumed significantly more fruits than overweight children.
Does Body Mass Index Adequately Capture the Relation of Body Composition and Body Size to Health Outcomes?
 American Journal of Epidemiology Copyright 1998 by The Johns Hopkins University School of Hygiene and Public Health All rights reserved Vol. 147, No. 2 Printed in U.S.A A BRIEF ORIGINAL CONTRIBUTION Does
2014 Healthy Community Study Executive Summary
 2014 Healthy Community Study Executive Summary BACKGROUND The Rockford Health Council (RHC) exists to build and improve community health in the region. To address this mission, RHC conducts a Healthy Community
4.0 Product Testing. 4.1 Routine Testing
 4.0 Product Testing The MCIR program has established methods for testing new features prior to dissemination. Section 4.1 describes the routine testing processes. The defects identified through this process
Assessment of Nutritional Status in Sri Lankan Children: Validity of Anthropometry Cutoffs?
 Assessment of Nutritional Status in Sri Lankan Children: Validity of Anthropometry Cutoffs? Pujitha Wickramasinghe MBBS (Col), DCH, MD (Paed), PhD (Col) Professor in Paediatrics Faculty of Medicine University
Prevalence of Obesity among High School Children in Chennai Using Discriminant Analysis
 IOSR Journal of Mathematics (IOSR-JM) e-issn: 2278-5728, p-issn: 2319-765X. Volume 13, Issue 4 Ver. III (Jul. Aug. 2017), PP 50-56 www.iosrjournals.org Prevalence of Obesity among High School Children
OBESITY IN PRIMARY CARE
 OBESITY IN PRIMARY CARE Obesity- definition Is a chronic disease In ICD 10 E66 Overweight and obesity are defined as abnormal or excessive fat accumulation that may impair health. Obesity is a leading
UNIT 4 ASSESSMENT OF NUTRITIONAL STATUS
 UNIT 4 ASSESSMENT OF NUTRITIONAL STATUS COMMUNITY HEALTH NUTRITION BSPH 314 CHITUNDU KASASE BACHELOR OF SCIENCE IN PUBLIC HEALTH UNIVERSITY OF LUSAKA 1. Measurement of dietary intake 2. Anthropometry 3.
Certifications and training for mammography screening services and professionals in Norway
 Certifications and training for mammography screening services and professionals in Norway Solveig Hofvind Cancer Registry of Norway Thursday May 31, 2018, 15:40-16:00 Rome, Italy Health costs per inhabitants,
EFFECTIVENESS OF PHONE AND LIFE- STYLE COUNSELING FOR LONG TERM WEIGHT CONTROL AMONG OVERWEIGHT EMPLOYEES
 CHAPTER 5: EFFECTIVENESS OF PHONE AND E-MAIL LIFE- STYLE COUNSELING FOR LONG TERM WEIGHT CONTROL AMONG OVERWEIGHT EMPLOYEES Marieke F. van Wier, J. Caroline Dekkers, Ingrid J.M. Hendriksen, Martijn W.
PEER REVIEW HISTORY ARTICLE DETAILS VERSION 1 - REVIEW. Randi Selmer Senior Researcher Norwegian Institute of Public Health Norway
 PEER REVIEW HISTORY BMJ Open publishes all reviews undertaken for accepted manuscripts. Reviewers are asked to complete a checklist review form (see an example) and are provided with free text boxes to
Propensity Score Methods for Estimating Causality in the Absence of Random Assignment: Applications for Child Care Policy Research
 2012 CCPRC Meeting Methodology Presession Workshop October 23, 2012, 2:00-5:00 p.m. Propensity Score Methods for Estimating Causality in the Absence of Random Assignment: Applications for Child Care Policy
Childhood Obesity in Hays CISD: Changes from
 Childhood Obesity in Hays CISD: Changes from 2010 2017 Leigh Ann Ganzar, MPH Susan Millea, PhD Presentation to HCISD School Health Advisory Committee August 14, 2018 smillea@cohtx.org Partnership to Promote
DIETARY RISK ASSESSMENT IN THE WIC PROGRAM
 DIETARY RISK ASSESSMENT IN THE WIC PROGRAM Office of Research and Analysis June 2002 Background Dietary intake patterns of individuals are complex in nature. However, assessing these complex patterns has
Does prenatal alcohol exposure affect neurodevelopment? Attempts to give causal answers
 Does prenatal alcohol exposure affect neurodevelopment? Attempts to give causal answers Luisa Zuccolo l.zuccolo@bristol.ac.uk MRC IEU, School of Social and Community Medicine Background Prenatal alcohol
Eastern Mediterranean Health Journal, Vol. 10, No. 6,
 Eastern Mediterranean Health Journal, Vol. 10, No. 6, 2004 789 Invited paper Overweight and obesity in the Eastern Mediterranean Region: can we control it? A.O. Musaiger 1 SUMMARY Obesity has become an
THE RELATIONSHIP BETWEEN FITNESS AND BODY COMPOSITION WITH GENERAL HEALTH OF NON-ATHLETE HIGH SCHOOL STUDENTS IN MIANDOAB
 European Journal of Physical Education and Sport Science ISSN: 2501-1235 ISSN-L: 2501-1235 Available on-line at: www.oapub.org/edu 10.5281/zenodo.56387 Volume 2 Issue 1 2016 THE RELATIONSHIP BETWEEN FITNESS
Staff Quiz. 1. Serial measurements are necessary for identification of growth trends in children. TRUE / FALSE
 Staff Quiz 1. Serial measurements are necessary for identification of growth trends in children. TRUE / FALSE 2. The WHO Child Growth Standards illustrate how healthy children should grow, whereas the
LIFESTYLE DISEASES IN KERALA : AN ANALYSIS OF SOCIO-ECONOMIC STATUS, CONSUMPTION PATTERN AND ADOLESCENT OBESITY IN KOTTAYAM DISTRICT
 SYNOPSIS OF THE THESIS ENTITLED LIFESTYLE DISEASES IN KERALA : AN ANALYSIS OF SOCIO-ECONOMIC STATUS, CONSUMPTION PATTERN AND ADOLESCENT OBESITY IN KOTTAYAM DISTRICT INTRODUCTION Kerala enjoys a unique
INTERNATIONAL JOURNAL OF PEDIATRIC NURSING CORRELATION BETWEEN NUTRITIONAL STATUS AND MEMORY AMONG SCHOOL CHILDREN
 26 INTERNATIONAL JOURNAL OF PEDIATRIC NURSING e - ISSN XXXX-XXXX Print ISSN - XXXX-XXXX Journal homepage: www.mcmed.us/journal/ijpn CORRELATION BETWEEN NUTRITIONAL STATUS AND MEMORY AMONG SCHOOL CHILDREN
EXECUTIVE SUMMARY THIS EXECUTIVE SUMMARY WAS ADAPTED BY THE MOVEMBER FOUNDATION FROM THE INITIAL REPORT DELIVERED TO MOVEMBER IN JULY 2016
 THIS EXECUTIVE SUMMARY WAS ADAPTED BY THE MOVEMBER FOUNDATION FROM THE INITIAL REPORT DELIVERED TO MOVEMBER IN JULY 2016 EXECUTIVE SUMMARY On average, men die five years younger than women, live with worse
Gambling and gambling problems in Sweden Results from a one-year follow-up
 Gambling and gambling problems in Sweden 2009-2010 Results from a one-year follow-up Summary Results from a one-year follow-up Since the end of the 1990s, prevalence studies have become increasingly common.
Copyright is owned by the Author of the thesis. Permission is given for a copy to be downloaded by an individual for the purpose of research and
 Copyright is owned by the Author of the thesis. Permission is given for a copy to be downloaded by an individual for the purpose of research and private study only. The thesis may not be reproduced elsewhere
Aggregation of psychopathology in a clinical sample of children and their parents
 Aggregation of psychopathology in a clinical sample of children and their parents PA R E N T S O F C H I LD R E N W I T H PSYC H O PAT H O LO G Y : PSYC H I AT R I C P R O B LEMS A N D T H E A S SO C I
DATA GATHERING METHOD
 DATA GATHERING METHOD Dr. Sevil Hakimi Msm. PhD. THE NECESSITY OF INSTRUMENTS DEVELOPMENT Good researches in health sciences depends on good measurement. The foundation of all rigorous research designs
RISK FACTORS FOR HYPERTENSION IN INDIA AND CHINA: A COMPARATIVE STUDY
 Health and Population - Perspectives and Issues 37 (1 & 2), 40-49, 2014 RISK FACTORS FOR HYPERTENSION IN INDIA AND CHINA: A COMPARATIVE STUDY FuJun Wang*, V. K. Tiwari** and Hao Wang*** ABSTRACT To identify
HEAD CIRCUMFERENCE OF INFANTS RELATED TO BODY WEIGHT
 Arch Dis Childh 1965 40 672 HEAD CRCUMFERENCE OF NFANTS RELATED TO BODY WEGHT BY R S LLNGWORTH and W LUTZ From the Department of Child Health and the Department of Statistics the University of Sheffield
Application of the WHO Growth Reference (2007) to Assess the Nutritional Status of Children in China
 to Assess the Nutritional Status of Children in China") BIOMEDICAL AND ENVIRONMENTAL SCIENCES 22, 130-135 (2009) www.besjournal.com Application of the WHO Growth Reference (2007) to Assess the Nutritional Status of Children in China YAN-PING LI, XIAO-QI HU,
BIOMEDICAL AND ENVIRONMENTAL SCIENCES 22, 130-135 (2009) www.besjournal.com Application of the WHO Growth Reference (2007) to Assess the Nutritional Status of Children in China YAN-PING LI, XIAO-QI HU,
SCRIPT: Module 3. Interpreting the WHO Growth Charts for Canada SLIDE NUMBER SLIDE SCRIPT
 SCRIPT: Module 3 Interpreting the WHO Growth Charts for Canada 1 Welcome Welcome to Module 3 - Interpreting the WHO Growth Charts for Canada. Each of the modules in this training package has been designed
Chronic conditions, physical function and health care use:
 Chronic conditions, physical function and health care use: Findings from the Australian Longitudinal Study on Women s Health Authors: Julie Byles Richard Hockey Deirdre McLaughlin Annette Dobson Wendy
Factors influencing smoking among secondary school pupils in Ilala Municipality Dar es Salaam March 2007 By: Sadru Green (B.Sc.
 tamsa Volume 15.qxd:Layout 1 6/9/08 3:51 PM Page 14 Factors influencing smoking among secondary school pupils in Ilala Municipality Dar es Salaam March 2007 By: Sadru Green (B.Sc. EHS3 2006/2007) ABSTRACT
Body Size Technical Report Measurements and classifications in the 2006/07 New Zealand Health Survey
 Body Size Technical Report Measurements and classifications in the 2006/07 New Zealand Health Survey The author of this report was Maria Turley (Principal Technical Specialist, Nutritional Epidemiology),
Journal of Research in Obesity
 Journal of Research in Obesity Vol. 2016 (2016), Article ID 216173, 20 minipages. DOI:10.5171/2016.216173 www.ibimapublishing.com Copyright 2016. Asma Sultana, Sujan Banik, Mohammad Salim Hossain, Mustahsan
Diabetes in Manitoba: Trends among Adults
 Diabetes Among Adults in Manitoba (1989-2013) Diabetes in Manitoba: Trends among Adults 1989-2013 1989-2013 Epidemiology & Surveillance Active Living, Population and Public Health Branch Manitoba Health,
Supplementary Appendix
 Supplementary Appendix This appendix has been provided by the authors to give readers additional information about their work. Supplement to: Bjerregaard LG, Jensen BW, Ängquist L, Osler M, Sørensen TIA,
WHO Growth Grids/ 2012 Risk Changes. Diane Traver Joyce Bryant
 WHO Growth Grids/ 2012 Risk Changes Diane Traver Joyce Bryant Overview CDC vs WHO Growth Charts- Why Change? Transition from
Results. NeuRA Motor dysfunction April 2016
 Introduction Subtle deviations in various developmental trajectories during childhood and adolescence may foreshadow the later development of schizophrenia. Studies exploring these deviations (antecedents)
Factors associated with soft drink consumption among adolescents in the age group of 16-18
 2017; 3(1): 336-340 ISSN: 2395-7476 IJHS 2017; 3(1): 336-340 2017 IJHS www.homesciencejournal.com Received: 21-11-2016 Accepted: 22-12-2016 Somichon KSV M.Sc., Department of Home Dr. Sheila John Supervisor
Procedures for taking physical measurements
 Procedures for taking physical measurements Dr Diane Cooper PhD Exercise physiology and metabolism Partner in True Fitness Coordinator & lecturer on BSc Sports Science, AIT Metabolic researcher on European
SPARTANBURG COUNTY BODY MASS INDEX (BMI) REPORT
 REPORT") SPARTANBURG COUNTY BODY MASS INDEX (BMI) REPORT 1 st, 3 rd, and 5 th GRADE STUDENTS SCHOOL YEAR 2013-2014 2 CHILDHOOD OBESITY TASK FORCE ADVISORY COMMITTEE PARTNERS 3 4 TABLE OF CONTENTS Preface.. 4 Project
SPARTANBURG COUNTY BODY MASS INDEX (BMI) REPORT 1 st, 3 rd, and 5 th GRADE STUDENTS SCHOOL YEAR 2013-2014 2 CHILDHOOD OBESITY TASK FORCE ADVISORY COMMITTEE PARTNERS 3 4 TABLE OF CONTENTS Preface.. 4 Project
At the change of government, South Africa faced important health challenges. The country was bearing
 Health Challenges Past and Future Cally Ardington and Anne Case Chapter 41 in The Oxford Companion to the Economics of South Africa, Haroon Bhorat, Alan Hirsch, Ravi Kanbur and Mthuli Ncube (eds.), Oxford
SUMMARY AND DISCUSSION
 Risk factors for the development and outcome of childhood psychopathology SUMMARY AND DISCUSSION Chapter 147 In this chapter I present a summary of the results of the studies described in this thesis followed
Dear Sir/Madam Please attached find our response to the issues raised in the GREEN PAPER :
 13 March 2006 HKL European Commission Directorate-General Health and Consumer Protection Unit C4 Health Determinants L-2920 Luxembourg Dear Sir/Madam Please attached find our response to the issues raised
Rapid decline of female genital circumcision in Egypt: An exploration of pathways. Jenny X. Liu 1 RAND Corporation. Sepideh Modrek Stanford University
 Rapid decline of female genital circumcision in Egypt: An exploration of pathways Jenny X. Liu 1 RAND Corporation Sepideh Modrek Stanford University This version: February 3, 2010 Abstract Egypt is currently
Academic achievement and its relation to family background and locus of control
 University of Wollongong Research Online University of Wollongong Thesis Collection 1954-2016 University of Wollongong Thesis Collections 1994 Academic achievement and its relation to family background
Maldives and Family Planning: An overview
 Maldives and Family Planning: An overview Background The Republic of Maldives is an archipelago in the Indian Ocean, located 600 kilometres south of the Indian subcontinent. It consists of 92 tiny islands
Snack Food and Beverage Interventions in Schools
 Snack Food and Beverage Interventions in Schools Summary Evidence Table Abbreviations Used in This Document: Outcomes: o SSB: sugar sweetened beverage Measurement terms o BMI: body mass index o CI: confidence