NEW WHO GROWTH CURVES Why in QATAR? Ashraf T Soliman MD PhD FRCP
|
|
|
- Noreen Fitzgerald
- 6 years ago
- Views:
Transcription
1 NEW WHO GROWTH CURVES Why in QATAR? Ashraf T Soliman MD PhD FRCP

 15-64 years: 72.")
 (2005 est.")
 Death rate 4.")
2 Qatar CIA World Factbook demographic statistics. Population : 928,635 (July 2008 est.) Age structure : 0-14 years: 23.7% (male 104,453; female 100,295) years: 72.9% (male 427,118; female 191,830) 65 years and over: 3.4% (male 21,599; female 7,756) (2005 est.) Population growth rate 2.50% (2006 est.) Birth rate births/1,000 population (2005 est.) Death rate 4.61 deaths/1,000 population (2005 est.) Infant mortality rate deaths/1,000 live births (2005 est.) Total fertility rate 2.87 children born/woman (2005 est.)
3 What are the Nutritional Problems In Qatar?
4 Obesity & Underweight in Qatar The prevalence of obesity was highest at 12 years of age among boys (11.7%) and at 13 years among girls (6.4%). The prevalence of underweight was highest at 16 years of age among boys (10.5%) and at 17 years among girls (8.9%). Food and nutrition bulletin Reference: 2006-Mar; vol 27 (issue 1) : pp 39-45
5 Prevalence of obesity among primary school-age children in Qatar (April 2003) Conducted by : Dr Fauzia Al-Khalaf Consultant Pediatric Endocrinology Reviewed by : Prof Ashraf T soliman Professor of Ped Endocrinology Funded by: The High supreme Family council
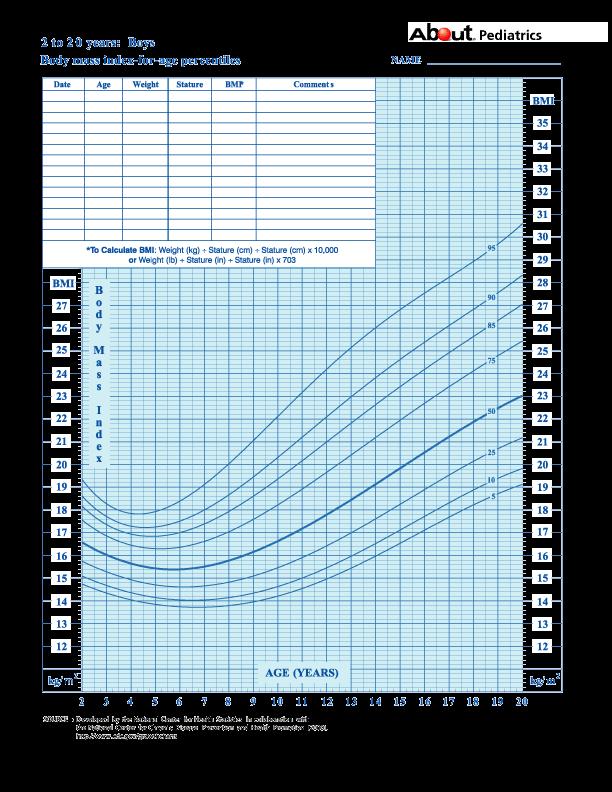
6 Subjects & methods Tools of the study: 1- Anthropometrics measures (Wt & Ht) 2- BMI = wt(kg)/ht(m2) 3- Sex & age specific BMI percentile of CDC growth chart 4- Used cutoff points: * overweight BMI for age 85 th 95 th percentile * Obesity BMI for age > 95 th percentile
7 Table (1) Sociodemographic characteristic of children under the study (n=4291) Nationality Sex Qatari Variable No % Non Qatar Male Female
8 Relationship between BMI percentile and gender Overweight Obese Boys Girls 9.7% 13.5% 14.3 % 15.2% In Australia 15% of boys & 15.8% of girls overweight, 4.5% of boys, 5.3% of girls obese
9 Obesity in Qatar
10 The prevalence of iron deficiency anaemia in the Arab Gulf Preschool children ranged from 20% to 67%, School children ranged from 12.6% to 50%. Pregnant women 22.7% to 54%. Infant feeding practices, food habits, parasitic infection, parity, early age at marriage, and geographical location are among the most important factors associated with iron deficiency anaemia in this region. Programmes to prevent and control this anaemia, are urgently needed. Nutrition and health vol. 16, n o 3, pp , 2002
11 Vitamin D Deficiency in Qatar 85% of adolescents have VDD Acta Diabetol Oct 10. The study revealed that vitamin D deficiency was highly prevalent in Qatari adolescents (11-16 years old; 61.6%), In the 5-10 year olds (28.9%) and In those below 5 years old (9.5%). Int J Food Sci Nutr Oct 22:1-11
12 CAN THESE GROWTH DISORDERS BE DETECTED EARLY YES By-- GROWTH CHARTS
13 Existing Problems in Use of Growth Cards Growth Curves National/ Regional standards not defined Low awareness among community on importance of growth monitoring Data from public hospitals not available Private health sector not involved Low counselling skills in health care providers Weak training and supervision Non-availability of suitable weighing scale for community health workers Source: PIHS, PSLSM
14 Growth Charts used in Qatar. Weight for Age.
15
16
17
18
19
20 WHO Child Growth Standards 0-5 years Innovative aspects Prescriptive approach recognizing need for standards 1. Breastfed infant as normative model 2. International sample 3. Reference data for assessing childhood obesity
21 CDC Vs WHO The WHO standards are based on a sample of healthy breastfed infants with high-quality complementary diets and provide a better tool than the CDC 2000 growth charts for monitoring the growth of breast-fed infants
22 CDC Vs WHO The CDC curves probably fail to capture the rapid and changing rate of weight gain in early infancy. In contrast, the infancy portion of the WHO standard is based on a much larger sample size (428 boys and 454 girls) and shorter measurement intervals [at birth, d 7, d 14, and then every 2 wk up to 2 mo and monthly thereafter These design characteristics allowed the WHO curves to capture the rapidly changing pattern of growth in early infancy, including the physiological weight loss that takes place in the first few days of life
23 Mean weight-for-age Z-scores of healthy breast-fed infants relative to the WHO standard and the CDC chart.
24 DIFFERENCES WHO Vs CDC J. Nutr. 137: , January 2007 There are important differences between the WHO standards and the CDC charts that vary by age group, growth indicator, and specific Z-score curve. For weight-for-age, differences are particularly important during infancy. The establishment of the breast-fed child as the norm for growth brings coherence between the tools used to assess growth and U.S. national infant feeding guidelines that recommend breast-feeding as the optimal source of nutrition during infancy
25 CDC Vs WHO The comparison of the weight-for-length and weight-forheight charts shows that the U.S. children are generally heavier than those included in the WHO sample
26 CDC Vs WHO The WHO's weight-for-length curves extend to a greater length than the CDC curves (110 cm vs. 103 cm) to facilitate assessment of tall 2-y olds and older children who, for whatever reason (e.g., malnutrition or agitation), are unable to stand. Similarly, the WHO weight-for-height curves start earlier (65 cm) than the CDC curves (78 cm) to facilitate assessment of populations with high rates of stunting


27 Weighing Scale usually used in Health Facilities Salter Scale ( LHW ) Infant Clinical Scale Weight-height scale Uniscale (Mother-child electronic scale)
28 Longitudinal growth of infants in Qatar: comparison with WHO and CDC growth standards. Soliman A, Eldabbagh M, Khalafallah H, Alali M, Elalaily RK. Indian Pediatr Oct;48(10): Epub 2011 May 30.
29 STATURE GROWTH
30 Length (cm) Growth in length Boys in Qatar vs WHO data Q-Boys Mean length Mean + 2SD Mean - 2SD WHO-Mean WHO-Mean+ 2SD WHO-Mean-2SD Age (months)
31 Length (cm) Growth in length girls in qatar vs WHO Q-Girls Mean length Mean + 2SD Mean - 2SD WHO-Mean WHO-Mean+ 2SD WHO-Mean-2SD Age (mon)
32 Length (cm) Growth in length boys in Qatar Vs CDC data Q-Boys Mean length Mean + 2SD Mean - 2SD CDC- Mean Mean + 2SD Mean - 2SD Age (mon)
33 Weight (kg) Growth in length Girls in Qatar vs CDC data Q-Girls Mean length Mean + 2SD Mean - 2SD CDC Mean Mean + 2SD Mean - 2SD Age (mon)
34 Weight Growth
35 Longitudinal growth data for infants in Qatar were compared to growth standards published by the CDC and WHO. 300 randomly selected full-term normal infants (150 males, 150 females) in Qatar were followed-up and weight and length were sequentially recorded at 2 months, 4 months, 6 months, 12 months and 18 months age.
36 The mean length for age of girls was higher than those published by the CDC and WHO at 12 and 18 months of age. Using the CDC standard for weight for length detected more wasted infants (9.0% and 6.5%) compared to using WHO standards (6.27% and 6.0%) for males and females, respectively.
37 Weight (kg) Growth in weight boys in Qatar vs WHO standards Boys Mean Wt Mean + 2SD Mean - 2SD WHO boys mean Mean + 2SD Mean - 2SD age (mon)
38 Weight (kg) Growth in weight girls in Qatar vs WHO Girls Mean wt Mean + 2SD Mean - 2SD Girls WHO Wt Mean + 2SD Mean - 2SD Age (mon)
39 Weight (kg) Growth in weight infants in Qatar vs CDC data Boys Mean Wt Mean + 2SD Mean - 2SD CDC Mean Wt Mean + 2SD Mean - 2SD Age (mon)
40 Weight (kg) Growth in weight Girls in Qatar vs CDC Girls Mean wt Mean + 2SD Mean - 2SD CDC Mean wt Mean + 2SD Mean - 2SD Age (mon)
41 Conclusion When WHO and CDC standards are compared, more infants were identified as overweight when the former were used. The WHO standards are preferable because they are based on a leaner breastfed reference and because overweight is likely to be a greater problem in Qatar in the future The WHO standards are preferable if the setting of health education is offered every visit.


42
Comparison of the WHO Child Growth Standards and the CDC 2000 Growth Charts 1
 The Journal of Nutrition Symposium: A New 21st-Century International Growth Standard for Infants and Young Children Comparison of the WHO Child Growth Standards and the CDC 2000 Growth Charts 1 Mercedes
Nauru Food and Nutrition Security Profiles
 Key Indicators Nauru Food and Nutrition Security Profiles Nauru has remained stationary in health and child survival outcomes and will not achieve the Millennium Development Goal (MDG) on child mortality.
WHO Child Growth Standards
 WHO Child Growth Standards Implications for everyday practice Dr Mercedes de Onis Department of Nutrition World Health Organization Geneva, Switzerland 1 year 2 years 3 years 4 years 5 years WHO Child
Study of Serum Hepcidin as a Potential Mediator of the Disrupted Iron Metabolism in Obese Adolescents
 Study of Serum Hepcidin as a Potential Mediator of the Disrupted Iron Metabolism in Obese Adolescents Prof. Azza Abdel Shaheed Prof. of Child Health NRC National Research Centre Egypt Prevalence of childhood
Assessment of Nutritional Status among Children less than 5 years old in Hilla City
 International Journal of Scientific and Research Publications, Volume 6, Issue 8, August 2016 276 Assessment of Nutritional Status among Children less than 5 years old in Hilla City * Ismael Hasan Jawad,
Training Course on Child Growth Assessment. WHO Child Growth Standards. Answer Sheets. Department of Nutrition for Health and Development
 Training Course on Child Growth Assessment WHO Child Growth Standards F Answer Sheets Department of Nutrition for Health and Development Answers for Module B: Measuring a Child s Growth 1 B: Measuring
OBJECTIVES OVERVIEW 5/30/2012. IL WIC Program Risk Factor Changes July 1, 2012
 IL WIC Program Risk Factor Changes July 1, 2012 AUTOPLOT OBJECTIVES State the Center for Disease Control (CDC) new growth chart recommendations for birth to 24 months incorporating the WHO growth standards.
Nutritional Status of Children Attending First Year Primary School in Derna, Libya in 2007
 Nutritional Status of Children Attending First Year Primary School in Derna, Libya in 2007 Foad Al Magri*, Samia S. Aziz,** and Omar El Shourbagy,* Abstract: Background: School-age children attempt to
Optimal Child Growth and critical periods for the prevention of childhood obesity
 Life Skills Workshop Friday, 17 February 2006 Optimal Child Growth and critical periods for the prevention of childhood obesity Margherita Caroli MD Ph D Nutrition Unit Dept. Prevention and Public Health
WHO Child Growth Standards. Training Course on Child Growth Assessment. Answer Sheets
 WHO Child Growth Standards Training Course on Child Growth Assessment BB F Answer Sheets WHO Child Growth Standards Training Course on Child Growth Assessment F Answer Sheets Version 1 November 006 Department
Methodological issues in the use of anthropometry for evaluation of nutritional status
 Methodological issues in the use of anthropometry for evaluation of nutritional status Monika Blössner WHO Department of Nutrition for Health and Development Methodological issues in the use of anthropometry?
Undernutrition & risk of infections in preschool children
 Indian J Med Res 130, November 2009, pp 579-583 Undernutrition & risk of infections in preschool children Prema Ramachandran & Hema S. Gopalan Nutrition Foundation of India, New Delhi, India Received April
WHO Growth Grids/ 2012 Risk Changes. Diane Traver Joyce Bryant
 WHO Growth Grids/ 2012 Risk Changes Diane Traver Joyce Bryant Overview CDC vs WHO Growth Charts- Why Change? Transition from
The Utility of Infancy Weight Curves for the Prediction of Linear. Growth Retardation in Preschool Children
 Acta Pœdiatr Scand 80: 1-6, 199 1 The Utility of Infancy Weight Curves for the Prediction of Linear. Growth Retardation in Preschool Children K. B. SIMONDON, F. SIMONDON, A. CORNU2 and F. DELPEUCH3 From
Pediatric Nutrition Care as a strategy to prevent hospital malnutrition. Div Pediatric Nutrition and Metabolic Diseases Dept of Child Health
 Pediatric Nutrition Care as a strategy to prevent hospital malnutrition Div Pediatric Nutrition and Metabolic Diseases Dept of Child Health Child is not a miniature adult Specific for child growth and
The prevalence of malnutrition among 2-6 year old children in Kerman rural kindergartens, Kerman, Iran, 2012
 JKMU Journal of Kerman University of Medical Sciences, 2017; 24(5): 406413 The prevalence of malnutrition among 26 year old children in Kerman rural kindergartens, Kerman, Iran, 2012 Farideh Doostan, Ph.D.
Child and Adult Nutrition
 Children in Egypt 2015 A STATISTICAL DIGEST Chapter 5 Child and Adult Nutrition Children in Egypt 2015 Children in Egypt 2015 is a statistical digest produced by UNICEF Egypt to present updated and quality
Tuvalu Food and Nutrition Security Profiles
 Key Indicators Tuvalu Food and Nutrition Security Profiles Tuvalu has experienced a decreasing trend in infant mortality rates, but the country will not meet the Millennium Development Goal (MDG) target.
Global database on the Implementation of Nutrition Action (GINA)
") Global database on the Implementation of Nutrition Action (GINA) National Nutrition Policy of Sri Lanka Published by: Ministry of Healthcare and Nutrition Is the policy document adopted?: Yes Adopted by:
Global database on the Implementation of Nutrition Action (GINA) National Nutrition Policy of Sri Lanka Published by: Ministry of Healthcare and Nutrition Is the policy document adopted?: Yes Adopted by:
World Health Organization Growth Standards. BC Training Module PowerPoint Speaking Notes
 World Health Organization Growth Standards BC Training Module PowerPoint Speaking Notes May 30, 2011 British Columbia WHO Growth Chart Training June 2011 Page 1 PowerPoint Speaking Notes Slide 1 Title
Karnataka Comprehensive Nutrition Mission
 Karnataka Comprehensive Nutrition Mission Karnataka Multi-Sectoral Nutrition Pilot Project Project Background The Karnataka Comprehensive Nutrition Mission (KCNM), through the Karnataka State Rural Livelihoods
World Health Organization Growth Standards. First Nations and Inuit Health Alberta Region: Training Module May 2011
 World Health Organization Growth Standards First Nations and Inuit Health Alberta Region: Training Module May 2011 Acknowledgements First Nation and Inuit Health Alberta Region would like to thank the
A study on nutritional status of lactating mothers attending the immunization clinic of a Medical College Hospital of Kolkata, West Bengal
 IOSR Journal of Dental and Medical Sciences (IOSR-JDMS) e-issn: 2279-0853, p-issn: 2279-0861.Volume 16, Issue 7 Ver. IX (July. 2017), PP 30-34 www.iosrjournals.org A study on nutritional status of lactating
Global database on the Implementation of Nutrition Action (GINA)
") Global database on the Implementation of Nutrition Action (GINA) Strategic Plan for Nutrition 2011?2015 Published by: MOHSS Country(ies): Namibia Fecha: 2011 Fecha final: 2015 Published year: 2011 Type
Global database on the Implementation of Nutrition Action (GINA) Strategic Plan for Nutrition 2011?2015 Published by: MOHSS Country(ies): Namibia Fecha: 2011 Fecha final: 2015 Published year: 2011 Type
Actions Sub-actions Evidence Category * 2e. Nutrition-related illness and disease prevention and management among pregnant and postpartum women
 ANNEX 3 HEALTH: SUMMARY LIST OF ACTIONS AND SUB-ACTIONS Nutrition Interventions Delivered through Reproductive and Paediatric Health Services Evidence Category * 1. Family planning support for optimal
Growth Faltering: Stunting and Severe Acute Malnutrition. Child Growth Is Assessed by Comparing to a Reference Curve
 Growth Faltering Growth Faltering: Stunting and Severe Acute Malnutrition Rebecca Stoltzfus, PhD Professor Division of Nutritional Sciences Cornell University Growth failure can involve linear growth retardation
Rapid nutritional assessment of under five years old children in internally displaced families in Al-Anbar Governorate may 29 th June 2 nd 2016
 Rapid nutritional assessment of under five years old children in internally displaced families in Al-Anbar Governorate may 29 th June 2 nd 2016 NRI/2016 Introduction Child nutrition is a sensitive indicator
Clinical Practice Guideline for Preventive Health Care - Pediatrics
 Clinical Practice Guideline for Preventive Health Care - Pediatrics The following guidelines are based on national standards and, therefore, should be utilized at the practitioner s discretion based on
Nutritional Assessment & Monitoring of Hospitalized Children
 Nutritional Assessment & Monitoring of Hospitalized Children Kehkashan Zehra, Clinical Dietitian Sindh Institute of Urology & Transplantation, Karachi In Pakistan 42% of children aged < 5 years are stunted
Global database on the Implementation of Nutrition Action (GINA)
") Global database on the Implementation of Nutrition Action (GINA) National Nutrition Action Plan 2012-2017 Published by: Ministry of Public Health and Sanitation Is the policy document adopted?: Yes Adopted
Global database on the Implementation of Nutrition Action (GINA) National Nutrition Action Plan 2012-2017 Published by: Ministry of Public Health and Sanitation Is the policy document adopted?: Yes Adopted
Staff Quiz. 1. Serial measurements are necessary for identification of growth trends in children. TRUE / FALSE
 Staff Quiz 1. Serial measurements are necessary for identification of growth trends in children. TRUE / FALSE 2. The WHO Child Growth Standards illustrate how healthy children should grow, whereas the
Strategy for Stunting Reduction & Prevention: Clean and Healthy Lifestyle
 Strategy for Stunting Reduction & Prevention: Clean and Healthy Lifestyle Indonesia: 5 th highest number of stunted children What is stunting? Children s failure to achieve their growth and development
Everyday!!! Childhood Obesity
 Childhood Obesity S O U T H W E S T C O M M U N I T Y H E A L T H C E N T E R S E A R C H P R O J E C T L A C Y B I R D S E Y E R N, B S N ( F N P S T U D E N T ) F A I R F I E L D U N I V E R S I T Y
Maternal and Infant Nutrition Briefs
 Maternal and Infant Nutrition Briefs A research-based newsletter prepared by the University of California for professionals interested in maternal and infant nutrition March/April 2003 New Guidelines on
GROWTH-AND-OBESITY CALCULATIONS OF U. FAMILY
 SGPP-KHI-20080104-02 Table 1. Parents Fractional Ages, Heights and Weights Date Format Father Mother Year-Month-Day (valid if A > 21 years) (valid if A > 19 years) Date of Birth (YYYY-MM-DD) 1974-08-08
Central African Republic
 Monitoring, Evaluation, Accountability, Learning (MEAL) 2016 2020 COUNTRY DASHBOARD The MEAL Results Framework identifies a wide range of desired results and associated indicators of progress across various
Marshall Islands Food and Nutrition Security Profiles
 Key Indicators Marshall Islands Food and Nutrition Security Profiles Marshall Islands has made significant improvements in health and child survival; nevertheless, it will not achieve the Millennium Development
TAHAMAS for a better future
 17-19 November 2016 Dubai, Unit ed Arab Emirates TAHAMAS for a better future Detecting weight and weight related health problems at early ages in order to prevent complications Dubai Nutrition Conference
Fig. 64 Framework describing causes and consequences of maternal and child undernutriton
 9.0 PREVALENCE OF MALNUTRITION 118 This chapter presents the prevalence of the three types of malnutrition (wasting, stunting and underweight) by background characteristic and livelihood zones in children
Assessing Child Growth Using Body Mass Index (BMI)- for- Age Growth Charts
- for- Age Growth Charts") Assessing Child Growth Using Body Mass Index (BMI)- for- Age Growth Charts Adapted by the State of California CHDP Nutri8on Subcommi;ee from materials developed by California Department of Health Care
Assessing Child Growth Using Body Mass Index (BMI)- for- Age Growth Charts Adapted by the State of California CHDP Nutri8on Subcommi;ee from materials developed by California Department of Health Care
Madagascar. Monitoring, Evaluation, Accountability, Learning (MEAL) COUNTRY DASHBOARD MADAGASCAR
 COUNTRY DASHBOARD MADAGASCAR") Monitoring, Evaluation, Accountability, Learning (MEAL) 2016 2020 COUNTRY DASHBOARD Madagascar The MEAL Results Framework identifies a wide range of desired results and associated indicators of progress
Monitoring, Evaluation, Accountability, Learning (MEAL) 2016 2020 COUNTRY DASHBOARD Madagascar The MEAL Results Framework identifies a wide range of desired results and associated indicators of progress
Reducing Malnutrition in Zambia: Summary of Estimates to Support Nutrition Advocacy ZAMBIA NUTRITION PROFILES 2017
 Reducing Malnutrition in Zambia: Summary of Estimates to Support Nutrition Advocacy ZAMBIA NUTRITION PROFILES 2017 This report is made possible by the generous support of the American people through the
Myanmar Food and Nutrition Security Profiles
 Key Indicators Myanmar Food and Nutrition Security Profiles Myanmar has experienced growth in Dietary Energy Supply (DES). Dietary quality remains poor, low on protein and vitamins and with high carbohydrates.
Democratic Republic of Congo
 Monitoring, Evaluation, Accountability, Learning (MEAL) 2016 2020 COUNTRY DASHBOARD Democratic Republic of Congo The MEAL Results Framework identifies a wide range of desired results and associated indicators
Myanmar - Food and Nutrition Security Profiles
 Key Indicators Myanmar - Food and Nutrition Security Profiles Myanmar has experienced growth in Dietary Energy Supply (DES). Dietary quality remains poor, low on protein and vitamins and with high carbohydrates.
Childhood Obesity in Dutchess County 2004 Dutchess County Department of Health & Dutchess County Children s Services Council
 Childhood Obesity in Dutchess County 2004 Dutchess County Department of Health & Dutchess County Children s Services Council Prepared by: Saberi Rana Ali, MBBS, MS, MPH Dutchess County Department of Health
D.K.M.COLLEGE FOR WOMEN (AUTONOMOUS),VELLORE
,VELLORE") D.K.M.COLLEGE FOR WOMEN (AUTONOMOUS),VELLORE DEPARTMENT OF FOODS AND NUTRITION QUESTION BANK FOR EVEN SEMESTER NUTRITION THROUGH LIFE CYCLE SUB CODE: 15CNF4A UNIT-I SECTION-A 2 MARKS 1. Define RDA. 2.
D.K.M.COLLEGE FOR WOMEN (AUTONOMOUS),VELLORE DEPARTMENT OF FOODS AND NUTRITION QUESTION BANK FOR EVEN SEMESTER NUTRITION THROUGH LIFE CYCLE SUB CODE: 15CNF4A UNIT-I SECTION-A 2 MARKS 1. Define RDA. 2.
Chapter 2 Use of Percentiles and Z-Scores in Anthropometry
 Chapter 2 Use of Percentiles and Z-Scores in Anthropometry Youfa Wang and Hsin-Jen Chen Abstract Percentiles and Z -scores are often used to assess anthropometric measures to help evaluate children s growth
Nutrition & Physical Activity Profile Worksheets
 Nutrition & Physical Activity Profile Worksheets In these worksheets you will consider nutrition-related and physical activity-related health indicators for your community. If you cannot find local-level
Papua New Guinea. Monitoring, Evaluation, Accountability, Learning (MEAL) COUNTRY DASHBOARD PAPUA NEW GUINEA
 COUNTRY DASHBOARD PAPUA NEW GUINEA") Monitoring, Evaluation, Accountability, Learning (MEAL) 2016 2020 COUNTRY DASHBOARD The MEAL Results Framework identifies a wide range of desired results and associated indicators of progress across various
Monitoring, Evaluation, Accountability, Learning (MEAL) 2016 2020 COUNTRY DASHBOARD The MEAL Results Framework identifies a wide range of desired results and associated indicators of progress across various
Uganda. Monitoring, Evaluation, Accountability, Learning (MEAL) COUNTRY DASHBOARD UGANDA
 COUNTRY DASHBOARD UGANDA") Monitoring, Evaluation, Accountability, Learning (MEAL) 2016 2020 COUNTRY DASHBOARD Uganda The MEAL Results Framework identifies a wide range of desired results and associated indicators of progress across
Monitoring, Evaluation, Accountability, Learning (MEAL) 2016 2020 COUNTRY DASHBOARD Uganda The MEAL Results Framework identifies a wide range of desired results and associated indicators of progress across
ASSESSMENT OF BODY MASS INDEX AND NUTRITIONAL MEASUREMENTS OF ADOLESCENT GIRLS
 ASSESSMENT OF BODY MASS INDEX AND NUTRITIONAL MEASUREMENTS OF ADOLESCENT GIRLS ANJNA NEMA DEPARTMENT OF HOME SCIENCE, GOVT. AUTO GIRLS P.G. COLLEGE OF EXCELLENCE SAGAR (M.P.), INDIA. ABSTRACT Girls are
Eastern Mediterranean Health Journal, Vol. 10, No. 6,
 Eastern Mediterranean Health Journal, Vol. 10, No. 6, 2004 789 Invited paper Overweight and obesity in the Eastern Mediterranean Region: can we control it? A.O. Musaiger 1 SUMMARY Obesity has become an
Content. The double burden of disease in México
 Can we and Prevent Malnutrition while Addressing the Challenge of NRCD s? Experiences from Mexico Content The double burden of disease in México What is currently being done in México for preventing and
Laos - Food and Nutrition Security Profiles
 Key Indicators Laos - Food and Nutrition Security Profiles In Lao PDR, GDP per capita has increased consistently during recent years, as has Dietary Energy Supply (DES) per person. Nevertheless, undernutrition
Childhood Undernutrition: a biological perspective
 Childhood Undernutrition: a biological perspective Vinod Paul MD, PhD, FIAP, FNNF, FAMS ALL INDIA INSTITUTE OF MEDICAL SCIENCES, NEW DELHI WHO Collaborating Centre for Training an Research in Newborn Care
Stop stunting: situation and way forward to improve maternal, child and adolescent nutrition in Afghanistan 1
 Commentary DOI: 10.1111/mcn.12288 Stop stunting: situation and way forward to improve maternal, child and adolescent nutrition in Afghanistan 1 Ariel Higgins-Steele *, Piyali Mustaphi *, Sherin Varkey
Solomon Islands Food and Nutrition Security Profiles
 Key Indicators Solomon Islands Food and Nutrition Security Profiles Solomon Islands has experienced stagnation in percapita GDP and undernourishment in recent years. Dietary Energy Supply (DES) has continued
Prevalence of Malnutrition among Preschool Children in Northeast of Iran, A Result of a Population Based Study
 Global Journal of Health Science; Vol. 5, No. 2; 2013 ISSN 1916-9736 E-ISSN 1916-9744 Published by Canadian Center of Science and Education Prevalence of Malnutrition among Preschool Children in Northeast
Impact of infant feeding on growth trajectory patterns in childhood and body composition in young adulthood
 Impact of infant feeding on growth trajectory patterns in childhood and body composition in young adulthood WP10 working group of the Early Nutrition Project Peter Rzehak*, Wendy H. Oddy,* Maria Luisa
Monitoring, Evaluation, Accountability, Learning (MEAL) Enabling Environment Finance for. Nutrition
 Enabling Environment Finance for. Nutrition") Monitoring, Evaluation, Accountability, Learning (MEAL) 2016 2020 COUNTRY DASHBOARD Country A COUNTRY A The Country Dashboard provides an overview on the progress using a standard set of indicators that
Monitoring, Evaluation, Accountability, Learning (MEAL) 2016 2020 COUNTRY DASHBOARD Country A COUNTRY A The Country Dashboard provides an overview on the progress using a standard set of indicators that
Monitoring, Evaluation, Accountability, Learning (MEAL) Enabling Environment Finance for. Nutrition
 Enabling Environment Finance for. Nutrition") Monitoring, Evaluation, Accountability, Learning (MEAL) 2016 2020 COUNTRY DASHBOARD Philippines The MEAL Results Framework identifies a wide range of desired results and associated indicators of progress
Monitoring, Evaluation, Accountability, Learning (MEAL) 2016 2020 COUNTRY DASHBOARD Philippines The MEAL Results Framework identifies a wide range of desired results and associated indicators of progress
Malnutrition Experience in Sultanate of Oman. Dr Salima almamary Family physician Nutrition Department
 Malnutrition Experience in Sultanate of Oman Dr Salima almamary Family physician Nutrition Department Outline Country profile Malnutrition prevalence in Oman and interventions done to reduce it Fortification
Monitoring, Evaluation, Accountability, Learning (MEAL) Enabling Environment Finance for. Nutrition
 Enabling Environment Finance for. Nutrition") Monitoring, Evaluation, Accountability, Learning (MEAL) 2016 2020 COUNTRY DASHBOARD Togo The MEAL Results Framework identifies a wide range of desired results and associated indicators of progress across
Monitoring, Evaluation, Accountability, Learning (MEAL) 2016 2020 COUNTRY DASHBOARD Togo The MEAL Results Framework identifies a wide range of desired results and associated indicators of progress across
Invest in Nutrition Now A Smart Start for Our Children, Our Future
 Invest in Nutrition Now A Smart Start for Our Children, Our Future For more information, contact: Dr Kavita Sethuraman, USAID FANTA Project, FHI 360 at ksethuraman@fhi360.org A Fact Sheet on Agriculture
Cook Islands Food and Nutrition Security Profiles
 Key Indicators Cook Islands Food and Nutrition Security Profiles Mortality in children has shown a constant reduction over the years, but unless further acceleration, Cook Islands will not achieve the
Meeting the challenge of a new era for achieving healthy diet and nutrition
 Meeting the challenge of a new era for achieving healthy diet and nutrition Nutrition policies and actions in Malaysia to address all forms of malnutrition Zalma Abdul Razak, Director, Nutrition Division,
NUTRITION SURVEY REPORT TO CCSDPT HEALTH AGENCIES 2012
 NUTRITION SURVEY REPORT TO CCSDPT HEALTH AGENCIES 2012 Thailand Burma Border Consortium American Refugee Committee, International Malteser, International International Rescue Committee Première Urgence
Cambodia Food and Nutrition Security Profiles
 Key Indicators Although Cambodia has an integrated framework for food and nutrition security, it has not yet achieved the desired nutritional outcomes. Cambodia has experienced rapid growth in per capita
Malnutrition is an issue of public health concern in Sri Lanka s estate sector
 1 Public Disclosure Authorized Public Disclosure Authorized Public Disclosure Authorized Public Disclosure Authorized Malnutrition is an issue of public health concern in Sri Lanka s estate sector CHILDREN
Key Results November, 2016
 Child Well-Being Survey in Urban s of Bangladesh Key Results November, 2016 Government of the People s Republic of Bangladesh Bangladesh Bureau of Statistics (BBS) Statistics and Informatics (SID) Ministry
National Nutrition Policy Statement. Operational Plan of Action for Nutrition
 8/6/2008 National Nutrition Policy Statement Operational Plan of Action for Nutrition 2008 2010 Palestinian National Authority Ministry of Health Nutrition Department With technical support from the Nutrition
Obesity prevalence, disparities, trends and persistence among US children <5 y
 Obesity prevalence, disparities, trends and persistence among US children
From malnutrition to nutrition security
 From malnutrition to nutrition security Martin W. Bloem, MD, PhD Senior Nutrition Advisor/WFP Global Coordinator UNAIDS World Food Program Nurturing development: Improving human nutrition with animal-source
BREASTFEEDING TO PREVENT DOUBLE BURDEN OF MALNUTRITION
 BREASTFEEDING TO PREVENT DOUBLE BURDEN OF MALNUTRITION Sirinuch Chomtho Department of Pediatrics, Chulalongkorn University, Bangkok, Thailand The double burden of malnutrition means under- and over-nutrition
Monitoring, Evaluation, Accountability, Learning (MEAL) Enabling Environment Finance for. Nutrition
 Enabling Environment Finance for. Nutrition") Monitoring, Evaluation, Accountability, Learning (MEAL) 2016 2020 COUNTRY DASHBOARD El Salvador The MEAL Results Framework identifies a wide range of desired results and associated indicators of progress
Monitoring, Evaluation, Accountability, Learning (MEAL) 2016 2020 COUNTRY DASHBOARD El Salvador The MEAL Results Framework identifies a wide range of desired results and associated indicators of progress
Monitoring, Evaluation, Accountability, Learning (MEAL) Enabling Environment Finance for. Nutrition
 Enabling Environment Finance for. Nutrition") Monitoring, Evaluation, Accountability, Learning (MEAL) 2016 2020 COUNTRY DASHBOARD Kyrgyzstan The MEAL Results Framework identifies a wide range of desired results and associated indicators of progress
Monitoring, Evaluation, Accountability, Learning (MEAL) 2016 2020 COUNTRY DASHBOARD Kyrgyzstan The MEAL Results Framework identifies a wide range of desired results and associated indicators of progress
Records identified through database searching (n = 548): CINAHL (135), PubMed (39), Medline (190), ProQuest Nursing (39), PsyInFo (145)
: CINAHL (135), PubMed (39), Medline (190), ProQuest Nursing (39), PsyInFo (145)") Included Eligibility Screening Identification Figure S1: PRISMA 2009 flow diagram* Records identified through database searching (n = 548): CINAHL (135), PubMed (39), Medline (190), ProQuest Nursing (39),
Included Eligibility Screening Identification Figure S1: PRISMA 2009 flow diagram* Records identified through database searching (n = 548): CINAHL (135), PubMed (39), Medline (190), ProQuest Nursing (39),
Happy Holidays. Below are the highlights of the articles summarized in this issue of Maternal and Infant Nutrition Briefs. Best Wishes, Lucia Kaiser
 Dear colleagues, Happy Holidays. Below are the highlights of the articles summarized in this issue of Maternal and Infant Nutrition Briefs. Best Wishes, Lucia Kaiser Do pregnant teens need to get their
Nutritional Assessment of patients in hospital
 Nutritional Assessment of patients in hospital Geoffrey Axiak M.Sc. Nursing (Manchester), B.Sc. Nursing, P.G. Dip. Nutrition & Dietetics Definition of malnutrition Undernutrition can occur as a result
Prevalence of Vitamin A Deficiency among 6 months to 5 years old Children
 Prevalence of Vitamin A Deficiency among 6 months to 5 years old Children Htin Lin, May Khin Than, Khaing Mar Zaw, Theingi Thwin, Moh Moh Hlaing I. Introduction Myanmar, likewise other South-East Asian
Lao PDR. Maternal and Child Health and Nutrition status in Lao PDR. Outline
 Maternal and Child Health and Nutrition status in Lao PDR Outline Brief overview of maternal and child health and Nutrition Key interventions Challenges Priorities Dr. Kopkeo Souphanthong Deputy Director
Outline of a comprehensive implementation plan on infant and young. child nutrition as a critical component of a global multisectoral
 Outline of a comprehensive implementation plan on infant and young child nutrition as a critical component of a global multisectoral nutrition framework 1. The comprehensive implementation plan comprises
SCRIPT: Module 3. Interpreting the WHO Growth Charts for Canada SLIDE NUMBER SLIDE SCRIPT
 SCRIPT: Module 3 Interpreting the WHO Growth Charts for Canada 1 Welcome Welcome to Module 3 - Interpreting the WHO Growth Charts for Canada. Each of the modules in this training package has been designed
MODULE 2. Children from Birth to Five Years of Age GUIDE TO ANTHROPOMETRY: A PRACTICAL TOOL FOR PROGRAM PLANNERS, MANAGERS, AND IMPLEMENTERS 28
 MODULE 2 from Birth to Five Years of Age 28 INTRODUCTION What Does this Module Cover? Module 2 focuses on anthropometry of children from birth to years of age (0 60 completed months). It is broken into
Case Study #1: Pediatrics, Amy Torget
 Case Study #1: Pediatrics, Amy Torget Assessment Food/Nutrition Related History Per chart: pt has a very good appetite with consumption of a wide variety of foods 24 hour recall: excessive caloric and
Nutrition Department
 Ref.: S001.docx National Nutrition Policy, Strategies & Action Plan (NNPSAP) 2011-2013 Palestinian National Authority Ministry of Health Primary Health Care Public Health general directorate Nutrition
FACT SHEET N.1/SURVIE/NOVEMBRE 2009
 FACT SHEET N.1/SURVIE/NOVEMBRE 2009 COTE D IVOIRE NUTRITION SURVEY JULY 2009 BACKGROUND UNICEF is continuously assessing the evolving nutritional status of children in Côte d Ivoire to inform programmers
Prevalence of malnutrition and proportion of anaemia among the malnourished children aged 1-5 years in a rural tertiary care centre, South India
 International Journal of Contemporary Pediatrics Shibily RM et al. Int J Contemp Pediatr. 216 May;3(2):362-366 http://www.ijpediatrics.com pissn 2349-3283 eissn 2349-3291 Research Article DOI: http://dx.doi.org/1.1823/2349-3291.ijcp216838
UNIT 4 ASSESSMENT OF NUTRITIONAL STATUS
 UNIT 4 ASSESSMENT OF NUTRITIONAL STATUS COMMUNITY HEALTH NUTRITION BSPH 314 CHITUNDU KASASE BACHELOR OF SCIENCE IN PUBLIC HEALTH UNIVERSITY OF LUSAKA 1. Measurement of dietary intake 2. Anthropometry 3.
Ma. Erlinda Tarrayo, Imelda Agdeppa, Ph.D., Carmina DD. Cuarteros
 The Interplay of Immunization, Low Birth Weight, Feeding Practices and Food Intake On The Nutritional Status and Anemia Prevalence Among Young Children 6-23 Months old Ma. Erlinda Tarrayo, Imelda Agdeppa,
Prevalence and associations of overweight among adult women in Sri Lanka: a national survey
 Prevalence and associations of overweight among adult women in Sri Lanka Prevalence and associations of overweight among adult women in Sri Lanka: a national survey Renuka Jayatissa 1, S M Moazzem Hossain
Kenya Nutrition and Health Program plus Brian Njoroge, Kenya Nutrition and Health Program plus
 Kenya Nutrition and Health Program plus Brian Njoroge, Kenya Nutrition and Health Program plus Introduction Kenya Demographics Of the 43 millions Kenyans, 32% live in urban areas implying that majority
Exclusive breastfeeding duration and cardiorespiratory fitness in children and adolescents
 THE POWER OF PROGRAMMING 2014 International Conference on Developmental Origins of Adiposity and Long-Term Health March 13-15, Munich, Germany Exclusive breastfeeding duration and cardiorespiratory fitness
National Nutrition Policy 2015
 National Nutrition Policy 2015 Nutrition Is the Foundation for Development 1. Introduction Nutrition is an important determinant of physical growth, mental development and good health for every human.
Abstract. Nutritional status and Health implication of ongoing Nutrition Transition in India
 Abstract Nutritional status and Health implication of ongoing Nutrition Transition in India Vandana Bhattacharya Research Officer Department of social science, National Institute of Health and Family Welfare,
DIETARY REFERENCE INTAKES (DRIS) FOR MONGOLIANS
 FOR MONGOLIANS") DIETARY REFERENCE INTAKES (DRIS) FOR MONGOLIANS Tuyatsetseg Jambal, Ph.D School of Industrial Technology, Mongolian University of Science & Technology, Outline Background Mongolian DRIs Briefly report
DIETARY REFERENCE INTAKES (DRIS) FOR MONGOLIANS Tuyatsetseg Jambal, Ph.D School of Industrial Technology, Mongolian University of Science & Technology, Outline Background Mongolian DRIs Briefly report
POSHAN Abhiyan: Focus on the first 1000 days of life
 POSHAN Abhiyan: Focus on the first 1000 days of life Vinod Paul MD, PhD, FAMS, FNASc, FASc, FNA Member, NITI Aayog NATIONAL INSTITUTION FOR TRANSFORMING INDIA NORMAL WASTED (Thin) STUNTED (Short) Normal
Brunei Darussalam - Food and Nutrition Security Profiles
 Key Indicators Brunei Darussalam Food and Nutrition Security Profiles Brunei Darussalam has one of the highest rates of GDP per capita and of Dietary Energy Supply (DES) per person in the region. For decades,
Update on the nutrition situation in the Asia Pacific region
 Update on the nutrition situation in the Asia Pacific region Mike Toole 13 th National Rural Health Conference, Darwin, 24-27 May 2015 Source: DFAT, Port Moresby, Papua New Guinea Conceptual framework