Satisfying Giant Appetites
|
|
|
- Angelica Harris
- 5 years ago
- Views:
Transcription
1 Satisfying Giant Appetites Mechanisms of small scale foraging by large African herbivores Yolanda Pretorius
2 Promotores Prof. Dr. H.H.T. Prins Professor of Resource Ecology Prof. Dr. R. Slotow Professor of Biological Sciences, University of Kwa-Zulu Natal (South Africa) Co-promotor Dr. W.F. de Boer Lecturer at the Resource Ecology Group Thesis committee Dr.A.D. Rijnsdorp Wageningen University (Netherlands) Prof.Dr. S. Verhulst University of Groningen (Netherlands) Prof.Dr. H. Udo de Haes Leiden University (Netherlands) Dr. A.G. Toxopeus International Institute for Geo-information Science and Earth Observation Enschede (Netherlands) This research was conducted under the auspices of the C.T. de Wit Graduate School for Production Ecology and Resource Conservation
3 Satisfying Giant Appetites Mechanisms of small scale foraging by large African herbivores Yolanda Pretorius Thesis submitted in partial fulfillment of the requirements for the degree of doctor at Wageningen University by the authority of the Rector Magnificus Prof. Dr. M.J. Kropff in the presence of the Thesis Committee appointed by the Doctorate Board to be defended in public on Monday 23 November 2009 at 11 AM in the Aula.
4 Yolanda Pretorius Satisfying giant appetites: mechanisms of small scale foraging by large African herbivores, 141 pages. PhD-thesis, Wageningen University, Wageningen, the Netherlands (2009) with summaries in English, Dutch and Afrikaans. ISBN

5 Preface The true meaning of the phrase you are what you eat only became clear to me during the course of this study, except that for herbivores I think it should be you are what you are constrained to eat. This study started off rather broadly with the aim of determining the mechanisms behind small scale foraging by large herbivores. With guidance, trial and error I soon realized that a holistic approach leads to confusion and increases the chances of misinterpretation of results as it is impossible to account for all of the variability present, even at small scales. Eventually, after adopting a reductionist approach and using field experimentation as a tool to reduce variability, the study evolved to focus on how body mass differences determine mouth morphology, patch selection and daily diets of large African herbivores. I dedicate this thesis to my parents, Danie and Jorina and to the four mentors who have guided and inspired me throughout my academic career including my grandmother Drienie Smal, Jock McMillan, Paul Hendrik and Herbert Prins. This PhD journey has truly been an enriching experience both personally and in terms of my career. I hope you enjoy reading this work as much as I, despite occasional hardships, enjoyed creating it.
6 Contents CHAPTER 1 General introduction. 1 CHAPTER 2 Why elephant have trunks, giraffe have long tongues & rhino have broad lips: mechanisms for how plants shape large herbivore mouth morphology.. 9 Y. Pretorius, K. Kortekaas, M. van Wijngaarden, W.F. de Boer, R. Slotow, & H.H.T. Prins CHAPTER 3 Soil nutrient status determines how elephant utilize trees and shape environments Y. Pretorius, W.F. de Boer, R. Slotow, C. van der Waal & H.H.T. Prins CHAPTER 4 Large herbivore responses to nutrient heterogeneity in an African savanna 39 Y. Pretorius, W.F. de Boer, M.B. Coughenour, H.J. de Knegt, H. de Kroon, C.C. Grant, I. Heitkonig, E. Kohi, E. Mwakiwa, M.J.S. Peel, A.K. Skidmore, R. Slotow, C. van der Waal, F. van Langevelde, S.E. van Wieren & H.H.T. Prins CHAPTER 5 Diet selection of African elephant over time shows changing optimization currency Y. Pretorius, J.D. Stigter, W. F. de Boer, S.E. van Wieren, C.B. de Jong, H.J. de Knegt, C.C. Grant, I. Heitkönig, N. Knox, E. Kohi, E. Mwakiwa, M.J.S. Peel, A.K. Skidmore, R. Slotow, C. van der Waal, F. van Langevelde, H.H.T. Prins CHAPTER 6 Synthesis: why size matters at small scales Y. Pretorius
7 References Summary Samenvatting Dutch Summary Samevatting Afrikaans Summary 130 Affiliation of coauthors Acknowledgements Curriculum Vitae PE&RC PhD Education Certificate
8
9 Abstract Pretorius Y., Satisfying giant appetites: mechanisms of small scale foraging by large African herbivores Variation in body mass allows for resource partitioning and co-existence of different species. Body mass is also seen as the main factor governing nutrient requirements in herbivores as metabolic rate and requirements have often been found to scale to ¾ power of body mass. Although the consequences of body mass on foraging behaviour of herbivores has been extensively studied, the mechanism behind how body mass differences determines the small scale foraging patterns of especially larger herbivores, has up to now been unclear. In this study, I looked at how body mass and small scale vegetation characteristics shaped the mouth morphology of herbivores and how body mass of a herbivore affects the scale at which intake is maximized. More over, I looked at what spatial scales a mega-herbivore can select nutrient rich patches, and at the trade-offs between quality and quantity of plant species as forage to be included in the diet of different size herbivores. The results indicate that the dilution of plant mass and more specifically leaf mass in space requires that mega-herbivores have enlarged soft mouth parts to compensate for this dilution. In the analysis of patch selection by herbivores, I introduce the novel concept of nutrient load, which provides a way of expressing the total available nutrients to a herbivore per grain of a specific spatial scale. I show that solitary animals and/or animals with extreme mouth sizes are able to select the aggregation of patches with either the largest patch sizes or highest local nutrient concentrations which together yield the highest total nutrient loads at a spatial scale of 2500m 2. Finally, I demonstrate, using linear programming techniques with multiple nutrients as constraints, how a mega-herbivore s daily diet choice is determined by forage abundance whereas a small herbivore is more constrained by fibre. Keywords: patch selection, allometry, spatial scaling, body mass, mouth morphology, linear programming
10

11 CHAPTER 1 GENERAL INTRODUCTION 1
12 Changes in abiotic environmental factors such as atmospheric temperature and moisture levels have been present since the origin of life. These changes occur at both a macro and micro scale leading to spatial and temporal heterogeneity in the occurrence of biotic elements. Organisms either go extinct or adapt to environmental changes through the process of natural selection, which is the basis of speciation and the principle by which variation in a trait that enhances survival and reproduction is preserved (Darwin 1859). Millions of years of evolution have selected the fitness maximization strategies that extant species possess. However, over a much shorter time, humans have heavily impacted on and artificially changed environmental conditions (Prins & Gordon 2008) so that extant species ability to adapt has been challenged to the extreme. For example, during the last two centuries Africa s large herbivores were first threatened by extinction from uncontrolled hunting activities and poaching (Pringle 1982), followed by unprecedented habitat conversion for agricultural practices (Olff et al. 2002) only to be left with a future where the effects of global warming might present an even bigger challenge to survival. Grazing ecosystems are among the earth s most endangered terrestrial habitats (Frank et al. 1998) and with increasing CO 2 levels, C 4 grasses, which dominate savannas, are expected to decrease (Bond et al. 2003) with concomitant effects on wild grazing species (Prins & Gordon 2008). Although predictions on the possible effects of global warming have received much attention during the last decade (Root et al Google, cited 1038 times), the immediate threat of habitat loss through land-use change by humans is often neglected (Brooks et al Google, cited 284 times). Nearly half the world s vascular plant species and one third of terrestrial vertebrates are endemic to 25 biodiversity hotspots, which historically covered 12 % of the land s surface but today less than 1.4 % of intact habitat remains (Brooks et al. 2002). The inevitable question is, with increasing human impact, will large herbivores be able to adapt and survive or will they face another mass extinction? To prevent such an extreme event we need to know how large herbivores satisfy their daily nutrient requirements and how they are adapted to do so. More over, prediction of the distribution of large herbivore species, either for the purpose of conservation or management, requires an understanding of the mechanisms behind resource use by these species. Historically, studies often focused on large scale habitat use and distribution of large African herbivores using a descriptive approach (McNaughton & Georgiadis 1986). However, small scale foraging processes can significantly affect these large scale distribution patterns (Shipley 2007). In this study, I have used an experimental approach to determine the mechanisms behind small scale foraging by large African herbivores. 2
13 Contribution to foraging ecology Optimal foraging theory, which states that organisms forage in such a way as to maximize their energy intake per unit time, developed from the late 1960 s (MacArthur & Pianka 1966, Stephens & Krebs 1986) and has been central to foraging ecology ever since (Belovsky 1997, Illius et al. 2002, Prins & van Langevelde 2008). Nevertheless, classical optimal foraging theory has some shortcomings. First, it assumes that fitness is maximized by maximizing daily food intake, subject to physical and physiological constraints. This assumption lacks support because fitness is more likely to be maximized by balancing benefit and costs over the organism s lifetime (Illius et al. 2002). Secondly, energy has been used as the exclusive currency to model optimal foraging whereas in reality animals have to satisfy requirements of multiple nutrients. Although more recent studies have recognized this fact, little support of theoretical models are available from field studies and some disparity still exists on whether animals aim to only satisfy daily nutrient requirements or whether the intake of particular nutrients is maximized (Raubenheimer & Simpson 1999, Voeten & Prins 1999, Prins & van Langevelde 2008, Treydte et al. 2009, Felton et al. 2009, Hengeveld et al. 2009). Finally, classical optimal foraging theory has neglected the issue of scale (Prins & van Langevelde 2008). Nonetheless, it is well recognized that animals select forage resources at a range of temporal and spatial scales (Spalinger & Hobbs 1992, Ball et al. 2000). In 1987 Senft and co-workers proposed a spatial hierarchy of foraging components with selection units ranging in scale from individual plants through communities to entire landscapes embedded within regions. Since then, other studies have developed theoretical frameworks to explain the spatial scaling of foraging (Bailey et al. 1996, Ritchie & Olff 1999) but support from field research in the natural systems is scarce (Cromsigt & Olff 2006). In this study, I aimed to contribute to the larger body of knowledge on optimal foraging theory by conducting field experiments incorporating the spatial scaling of foraging as well as the foraging strategies adopted by large herbivores at small spatial scales including satisficing and maximization of the intake of multiple nutrients. Study subjects All animals included in this study are commonly referred to as large herbivores, defined as terrestrial mammals heavier than 5 kg in weight, which obtain most of their food resources from vegetative plant parts (Prins & Olff 1998, van Langevelde & Prins 2008). More specifically, the study focused on large African herbivore species including: steenbok (Raphicerus campestris), duiker (Sylvicapra grimmia), bushbuck (Tragelaphus scriptus), impala (Aepyceros melampus), warthog (Phacochoerus aethiopicus), blesbok (Damaliscus dorcas phillipsi), nyala (Tragelaphus angasii), oryx (Oryx gazelle), red hartebeest (Alcelaphus caama), kudu (Tragelaphus strepsiceros), wildebeest (Connochaetes taurinus), 3
14 waterbuck (Kobus ellipsiprymnus), zebra (Equus burchellii), eland (Taurotragus oryx), buffalo (Syncerus caffer), giraffe (Giraffa camelopardalis), white rhinoceros (Cerathorium simum) and elephant (Loxodonta africana). For comparison, species were distinguished from each other according to their body mass, type of digestive system, forage type, mouth size and herd size (Figure 1.1). Body mass Herbivores included covered a body mass range of more than three orders magnitude (10 kg 4850 kg). The most renowned implications of body mass differences are that basal metabolic rate is proportional to ¾ power of body mass (Kleiber 1932, Prins & van Langevelde 2008). The metabolic requirements of a large animal like an elephant will thus be lower in relation to body mass compared to a small animal like an impala. From the Bell-Jarman principle it follows that because body mass and gut size increase isometrically, larger animals with their lower metabolic energy requirements, can tolerate lower quality diets and can therefore afford to be less selective (Bell 1971 and Jarman 1974). Hence, because patch selection at small scales by the largest terrestrial mammal will provide strong support for the ability of large herbivores to select nutrient rich patches in general, the elephant was used as a model animal for a large part of the study (Chapter 3, 5 & 6). More over, vigilance behaviour, which is often difficult to assess, could to a large extent be ignored because elephant, due to their enormous size, are less prone to predation. Finally, the characteristic signs of foraging by elephant on trees, which even when old are easy to detect, were thought to enhance the quality of data collected. Digestive system type Herbivores were further distinguished according to the digestive system type of the suborder Ruminantia versus other herbivores (Figure 1.1). Ruminants typically re-chew their food and have specialized compartments to host micro organisms that aid in the digestion of plant cell walls, which mammalian digestive juices generally cannot (Foose 1982, van Soest 1994). Although, monogastric herbivores of other suborders can also host micro organisms for fermentation of plant cell walls in their hind guts, the efficiency of this type of digestion is not as good as in ruminants (Foose 1982). Plant cell walls consist of hemi-cellulose, cellulose and lignin, often cumulatively referred to as fibre (McDonald et al. 1995). However, irrespective of digestive system type, digestibility is strongly correlated with the fibre content of plants (van Soest 1994) and is a good indicator of the metabolizable energy value of a plant to an animal (McDonald et al. 1995). Hence, unless analyzed for multiple nutrients, the fibre content of forage in this study served as a proxy of its nutrient value and quality to an animal. As a measure of fibre, forage was analysed for its Acid Detergent Fibre (ADF) content that included the cellulose and lignin fraction and not hemi-cellulose, which can be digested much easier. 4
15 Forage type Various authors have categorized herbivores as browsers, grazers or mixed feeders depending on the amount of dicot and monocot plant species in their diets (Hofman & Stewart 1972, van Soest 1994, Gagnon & Chew 2000, Gordon & Prins 2008). Similarly, herbivores included in the current study were categorized as depicted in Figure 1.1. Grasses, unlike browse plants, form a continuous layer with small differences in the leaf and stem fibre content within a plant. The fibre fraction of grasses is higher than in browse species but consist mostly of cellulose that can be digested by micro organisms in the gut whereas browse contain more indigestible lignin (Searle & Shipley 2008). Implications of these forage type differences is that herbivores foraging on browse have developed narrow muzzles to better select leaves in between browse stems whereas grazers developed broader muzzles and adopted a strategy involving higher bite rates than browsers (Gordon & Illius 1988, Drescher 2003, Searle & Shipley 2008). Larger animals, which tend to be grazers, have a proportionately larger gastrointestinal tract than do small animals, which tend to be browsers (Van Soest 1994). Because small animals require more energy per unit weight to fuel a higher mass-specific metabolism, they must obtain a high rate of energy return per gram of food ingested. Large herbivores are thus better suited to extract energy from high-fiber grasses while small animals from the cell contents of browse (Demment and Van Soest 1985). Study area All data were collected between June 2005 and June 2008 in the north-eastern parts of South Africa. This area falls within the savanna biome as described by Rutherford and Westfall (1986). Foraging observations on herbivores, reported on in Chapter 2, were collected at four sites as all herbivores included for this part of the study were not common at all sites. White rhinoceros and some blue wildebeest measurements were collected at Mabula Private Game Reserve (MGR) in the Limpopo Province (latitudes: to S, longitudes: to E) which has a mean annual rainfall of about 600 mm and is classified as a sour- and mixed bushveld dominated by tree species such as Combretum apiculatum, Terminalia sericea, Burkea africana and Acacia caffra (Low & Rebelo 1996). Measurements on nyala, bushbuck and some kudu were collected in the north of Kruger National Park (KNP) (latitudes: to S, longitudes: to E), whereas most zebra, buffalo, waterbuck and wildebeest measurements were collected in the centre of the park around the Satara rest camp. Annual rainfall in KNP ranges between mm and whereas the north is especially dominated by Colophospermum mopane woodlands and shrubveld, the centre is characterized more by open savannas dominated by Acacia and Combretum species (Venter et al. 2003). 5

16 Figure 1.1: Classification of the large African herbivores used in this thesis along an axis of body mass (a, steenbok; b, duiker; c, bushbuck; d, impala; e, warthog; f, blesbok; g, nyala; h, oryx; i, red hartebeest; j, kudu; k, blue wildebeest; l, warthog; m, zebra; n, eland; o, buffalo; p, giraffe; q, white rhinoceros; r, elephant). Figures surrounded by dark grey indicate animals that pre-dominantly browse whereas light grey indicate mixed feeding and white, grazing. Numbers beside letters indicate the chapters in which data of each species were used. All observations on elephant, steenbok, warthog and impala and some observations on giraffe, waterbuck and kudu were conducted along the eastern border of KNP within the Associated Private Nature Reserves (APNR), which included Timbavati, Umbabat, Klaserie and Balule reserves. Fences between the APNR and the Kruger National Park were removed in 1995, thus allowing free movement of animals between these areas. These reserves, as with the KNP and MGR, are characterized by a dry season stretching from April to November (winter) and a wet season from October to March (summer). Annual precipitation within the APNR ranges between 200 and 1100 mm and vegetation is dominated by mixed Combretum/ 6
17 Terminalia sericea woodland, Combretum/ Colophospermum mopane woodland and some thornveld on gabbro (Greyling 2004, Peel et al. 2007). To address the research questions in Chapter 3 and 4, a large scale field fertilization experiment, consisting of thirty 50 m x 50 m plots were set-up in December 2004 in the Timbavati (24 14'11"S; 31 22'32"E) (*see also van der Waal in prep). The area was re-fertilized two years later. The experimental study site and the area from which the data were collected for Chapter 5 was dominated by a homogeneous layer of C. mopane shrub veld, with a herbaceous layer dominated by Urochloa mosambisencis and Bothriochloa spp. on granitic soils. Thesis outline The thesis focused mainly on how animal characteristics such as mouth size, digestion type, forage type and herd size in relation to a herbivore s body mass determines the scaling of foraging mechanisms which range from the bite to the daily foraging range (Figure 1.2). Spatial scale is characterized by grain size, which is the smallest measurement unit used at a specific scale and area. This includes the entire area of interest (Kotliar & Wiens 1990). Patches are localities that are more or less homogenous in their plant species composition, biomass and quality (Prins & van Langevelde 2008). Patches may also vary in size and number within or beyond the specified grain size of a chosen scale. Chapter2 begins at the bite-size scale to investigate whether instantaneous intake rate scales to body mass (BM) in a similar fashion as metabolic rate as BM 0.75 (Kleiber 1932, Prins & van Langevelde 2008). However, because allometric mass-space relationships in plants indicate that leaf:stem ratios of plants decrease as volume increase and that the average number of plants per unit area decrease as the average plant mass increases (Enquist et al. 1998, Niklas 2004), I further investigated how mega-herbivores in particular are adapted to cope with the dilution of forage resources in space thus enabling them to achieve their required intake rates. I hypothesize that intra-dental mouth volume, determined as the product of incisor width, muzzle width and jaw length, should scale linearly with body mass and that the volume added by soft mouth parts such as lips and tongue, should cause the total bite volume to scale larger than one using body mass. In Chapter 3, I scale up from bite-size, to determine within the daily foraging range, at a pre-determined scale, whether herbivores as large as elephant are able to select grains with the highest concentration of nutrients irrespective of the heterogeneity of patches within the grains. I further tested whether elephant were able to select nutrient rich patches at even smaller scales and whether the level of impact on trees differed between nutrient rich and poor patches. *C. van der Waal, Ph.D. candidate. Resource Ecology Group, Wageningen University, the Netherlands 7

18 Figure 1.2: Outline of thesis showing how animal characteristics such as mouth size are used in relation to body mass to determine the scaling of mechanisms of foraging ranging from bites to daily foraging ranges. Body mass is the most well studied animal characteristic and a reliable universal predictor of foraging behaviour in herbivores (West & Brown 2005). Other foraging characteristics, which are essentially functions of body mass that have been recognised to significantly influence large herbivore foraging, include mouth size, herd size and digestive system type (van Soest 1996). Although the functions of these characteristics are well understood, the way in which they affect a herbivore s response to spatial heterogeneity in forage resource distribution is less clear. In Chapter 4, I analysed how body mass, mouth size, digestive system type and herd size affect the selection of the spatial scale at which herbivores select nutrient rich patches to ensure maximum intake. I hypothesized that smaller animals, animals occurring in large herds, and ruminant species will select areas of high nutrient concentration at small spatial scales whereas small-mouthed animals will select areas with high nutrient content at larger spatial scales. In Chapter 5, using linear programming techniques I tested which strategies best explain the daily diets of African elephant. I used daily requirements of the macro-nutrients nitrogen, phosphorous, potassium, sodium, calcium, magnesium and metabolizible energy from literature as constraints in the model. Further, I expressed the availability of each potential forage species in the study area as the amount of nutrients and metabolizable energy available per plant that could be gained after energy required finding each species has been accounted for. In Chapter 6, I synthesize the results from this study by looking at the implications of body mass differences in large herbivores when foraging at scales ranging from bites to daily foraging range. 8


19 CHAPTER 2 WHY ELEPHANT HAVE TRUNKS, GIRAFFE HAVE LONG TONGUES & RHINO HAVE BROAD LIPS: MECHANISMS FOR HOW PLANTS SHAPE LARGE HERBIVORE MOUTH MORPHOLOGY Y. Pretorius, K. Kortekaas, M. van Wijngaarden, W.F. de Boer, R. Slotow, & H.H.T. Prins 9
20 Abstract From universal scaling laws, plant mass has been shown to dilute in space as volume 0.75, as does leaf mass to stem mass Even though metabolic requirements of herbivores scale to body mass (BM) as BM 0.75, which means that larger herbivores can tolerate lower quality foods, these animals still have high absolute food requirements for which the dilution of plant resources in space will some how have to be compensated for. We investigate whether mass and morphological spatial patterns in plants possibly induced the development of enlarged soft mouth parts in especially mega-herbivores. We used power functions and geometric principles to explore allometric relationships of both morphological and foraging characteristics of mammalian herbivores from the savannas of South Africa, covering a body mass range of more than three orders magnitude. Our results show that, although intra-dental mouth volume scaled to a power slightly less than one to body mass, actual bite volume, as measured in the field, scaled to body mass with a factor closer to However, when including the volume added to intra-dental mouth volume by soft mouth parts, such as tongue and lips (or trunks in elephant), mouth volume scaled linearly with actual bite volume and in a similar fashion as actual bite volume to body mass. Bite mass and bite leaf mass scaled linearly with body mass. We conclude that these scaling relationships indicate that large herbivores use their enlarged soft mouth parts to not only increase bite volume and thereby bite mass, but also to select soft plant parts, and thereby increase the leaf mass fraction per bite. This argument is strengthened by our findings of instantaneous intake rate, expressed as forage mass ingested per unit of time, scaling linearly to body mass, and of instantaneous intake rate of digestible cell mass ingested per unit of time scaling to BM 0.75, which is in accordance to Kleiber s allometry. We conclude by hypothesizing that past extinctions of mega-herbivores occurred because these herbivores did not have suitable mouth morphologies to cope with the dilution of food resources in space. Keywords: large African herbivores, soft mouth parts, allometry, bite mass, instantaneous intake rate, feeding station 10
21 Introduction Allometry describes the disproportionate changes in shape, size or function observed when comparing separated isolated features in animals (or plants) spanning across a range of body mass (Lindstedt & Schaeffer 2002). In both plant and animal ecology, fractal geometry and basic physical laws are used to develop principles for allometric scaling. For example, the surface area of an animal s body scales to 2/3 power of its body volume whereas linear measurements of body parts scale to 1/3 of body mass (Hutchinson 1959, Schmidt-Nielson 1984). As these allometric scaling laws provides strong predictions based on logic geometric principles, the quest to find universal scaling laws of body mass with biological characteristics of foraging is ongoing (West & Brown 2004, 2005). In this paper, we first investigate how foraging characteristics such as bite mass, bite rate and subsequently instantaneous intake rate scale with herbivore body mass. We then focus on the mechanisms behind these scaling relationships by looking at how the small scale distribution of forage resources affect the allometry between herbivore body mass and mouth morphology. Body mass influences habitat selection and facilitates species coexistence because a wider food quality tolerance by larger herbivores, as predicted by Kleiber s allometry (Kleiber 1932), will allow them to use a higher diversity of habitat types (Prins & Olff 1998). Conversely, small scale foraging characteristics such as bite, feeding station and patch size, can also shape large scale distribution patterns of herbivores (Bailey et al.1996, Shipley 2007). Hence, it is reasonable to expect small scale requirements and intake rates to scale to body mass in a similar fashion as larger scale requirements and intake rates. The relationship of instantaneous intake rate with available plant biomass is generally used to describe the functional response of an animal (Solomon 1949, Holling 1959), where intake is the result of bite mass, bite rate and feeding time (Spedding et al. 1966, Hodgson 1985). Bite mass has been proposed to scale linearly with body mass (Clutton-Brock & Harvey 1983, Owen-Smith 1985), which is an assumption that can also be derived from the fact that gut capacity scales linearly with body mass (Demment and van Soest 1985). In contrast, support for the existence of a scaling relationship between bite rate and body mass is rare and studies that have investigated this relationship have found none (Shipley et al. 1994). Therefore, as bite rate is depressed by bite mass through competition (Spalinger et al. 1988, Spalinger & Hobbs 1992) and bite mass is believed to have a larger influence on instantaneous intake rate than bite rate (Spalinger & Hobbs 1992, Shrader et al. 2006), it can be expected that intake rate like bite mass should scale linearly with body mass. However, in the functional response, herbivores may trade-off between biomass against forage digestibility because of digestive constraints (Beekman & Prins 1989, Wilmhurst et al. 1995, Iason & van Wieren 1999). Fibre is the main determinant of digestibility of forage as it affects the throughput rate of food (Demment & van Soest 1985). A frequently used measure of the fibre 11
22 content of forage is Acid Detergent Fibre (ADF), which includes the cellulose and lignin fractions of a cell (McDonald et al.1995). As trees are generally higher in lignin and grasses higher in cellulose (Searle & Shipley 2008), ADF should be a good indicator of digestible cell mass across herbivore species of different feeding types. Bite rate (Spalinger et al. 1988) and chewing time (Beauchemin 1991) are both affected by the fibre content of bite forage (Beekman & Prins 1989). More over, as chewing rate scales negatively as BM (Fortelius 1985) and chewing rate is linearly correlated to bite rate (Demment & Greenwood 1988), bite rate might be expected to scale as BM Therefore, alternatively, when including digestibility (or ADF as its proxy) in the calculation of instantaneous intake rate as the product of the percentage digestible cell content (100 ADF %), bite rate (BM ) and bite mass (BM 1 ), we expect intake rate to scale to BM 0.75 as predicted by Kleiber s allometry (Kleiber 1932, Prins & van Langevelde 2008). The mechanisms behind the scaling relationships between body mass and the before mentioned forage characteristics should be affected by the spatial distribution of forage resources. Thus, the laws governing the availability of these forage resources first have to be investigated. According to the plant thinning law the number of plants per unit space will decrease at a rate of ¾ power as average plant mass increase (Enquist et al. 1998). Similar to this, standing leaf biomass has been found to scale to ¾ power of standing stem biomass (Niklas 2004) whilst maximum plant height is proportional to 2/3 power of trunk diameter (buckling height: McManhon 1973). These scaling relationships in plants have consequences for herbivores because even though larger herbivores can tolerate food of lower quality, they still have high absolute food requirements for which the dilution of plant resources in space will some how have to be compensated for. Therefore, we further investigate the adaptations that especially mega-herbivores have evolved to adapt to spatial patterns in plants. At the bite scale, forage intake behaviour basically represents a compromise between mastication, which increases passage rate, and taking a new bite, which increases intake. However, both these processes depend on the herbivore s mouth morphology (Demment & Greenwood 1988). Generally, grazers have larger incisor widths and muzzles than browsers which allow the forager to obtain large bite sizes from the surface of uniformly distributed grass swards (Gordon & Illius 1988). However, browsers, with their smaller muzzles and prehensile lips, can obtain large bites by stripping many leaves from one stem in a sideways motion (Searle & Shipley 2008). Hence, we included both grazers and browsers in our study and reason that differences in the dimensions of mouth parts and methods of feeding between these animals will be compensated for, which will result in similar scaling of foraging characteristics such as bite volume and bite mass across species of different body mass. Bite mass is not only regulated by plant characteristics such as sward height, presence of stems, bulk density or biomass (Stobbs 1973, Black & Kennedy 1984, Prins 1996, 12
23 WallisdeVries et al.1998, Benvenutti et al. 2006, Heuermann 2007), but also by the morphology of the animal s mouth (Illius & Gordon 1987, Shipley et al. 1994). Previous studies on mouth morphology and its relation to body mass, focused on skull measurements such as incisor width, jaw length and cheek teeth surface. From these studies, we know that most of these parameters do indeed scale allometrically to body mass (e.g. linear dimensions as BM 0.33 and surface dimensions as BM 0.67 ) (Fortelius 1985, Illius & Gordon 1987, Gordon & Illius 1988, Wilson & Kerley 2003). However, even though the function of the tongue and lips (e.g., trunk of elephant) have been widely recognised as foraging extensions that increase the bite area (Ungar et al. 1991, Shipley et al. 1994, Drescher 2003, Hongo & Akimoto 2003, Griffiths 2006), no study has included measurement of these soft mouth parts and related them to body mass and foraging efficiency. The spatial characteristics of foraging are determined by volume of the available forage and the resource mass contained within that volume. For example, at the bite scale, bite mass is determined by bite volume and the bulk density of the herbage in that volume (Ungar et al. 2001). According to Clutton-Brock and Harvey (1983) and Owen-Smith (1985), bite mass should scale linearly with intra-dental mouth volume. However, in Canadian geese, where soft mouth parts outside the bill are absent, bill length increase much faster with body mass than expected from the general allometric relationship of BM 0.33 (Heuermann 2007). We reason that intra-dental mouth volume, calculated as the product of jaw length (BM 0.33 ), incisor width (BM 0.33 ) and muzzle diameter (BM 0.33 ) should scale linearly with body mass, but that when including soft mouth parts in the equation, bite volume should increase much faster with body mass than expected in order for larger herbivores to compensate for the dilution of plant mass in space. Bite volume refers to the effective volume of the plant from which forage is removed, which consists of three dimensions: bite depth and bite surface area (Ungar et al. 1991, Gordon & Lascano 1993). The bite area covered can be summarized as the extension of the tongue (or lips) together with the gape area of an open mouth, which defines the total area swept (Ungar et al.1991). In our study, mouth volume is calculated as the sum of intra-dental mouth volume and the volume covered by the soft mouth parts, which are assumed to be the length of the longest mouth part raised to the power of three. We expect bite volumes as measured from locations where herbivores actually fed in the wild to scale linearly with mouth volume and in a similar linear fashion as mouth volume with body mass. Generally, leaves have higher quality than stems as their fibre content is less (Demment & van Soest 1985). Therefore, although larger herbivores might have larger bites in the bitten off food mass, bite quality will decrease because the fraction of leaf biomass is expected to decrease with increasing bite size according to plant mass-space laws (Niklas 2004). As the function of tongue and lips have also been implicated to facilitate the selection 13
24 of soft plant parts like leaves (Hongo & Akimoto 2003, Searle & Shipley 2008), we further predict that bite leaf mass will scale higher than ¾ powers and closer to one with body mass. Methods All data were collected in the northern parts of South Africa, northeast of Pretoria and included six morphological characteristics, most commonly associated with feeding, from both carcasses and skulls of dead or immobilized animals (Table 2.1). Herbivore species included covered more than three orders magnitude of body mass ( kg) (Table 2.2). Direct observations on herbivore foraging Field observations on the foraging behaviour of herbivores were conducted at two spatial scales: the bite and the feeding station (Bailey & Provenza 2008). Direct observations typically involved locating foraging herbivores, picking a focal animal not more than 50 m from the observer of which the head and front part of the body was clearly visible and recording feeding activity of this individual using a digital camcorder. We only included observations where the animal had to have been feeding for more than 60 sec and needed to have visited at least two feeding stations. If the animal had not left within 5 min, it was chased off to prevent consumption of all the forage. A bite was defined as the amount of forage removed from a plant in a single cropping motion (Searle et al. 2005), and a feeding station as the array of plants available to a herbivore from which bites could be taken without moving its front legs (Novellie 1978). Video recordings were analysed to determine the number of bites per feeding station and the bite rate. At one of the actual feeding stations, fresh bite marks were identified and counted and video material aided in finding back all bites within the feeding station. Further measurements included the size of one of the bite marks the animal left behind, measured in three dimensions to obtain the bite volume. Based on these bite measurements, a similar place was located within the foraged plant, and a simulated bite with the same dimensions and at the same feeding height was removed by hand. Simulated bite samples were stored in paper bags and dried at 70 C for 24 h after which leaf and stems were separated and weighed. Following this, the bite samples were grounded through a 1mm sieve for further chemical analysis at the laboratory of the Resource Ecology Group, Wageningen University (Netherlands). Dry matter (DM) and organic matter (OM) contents were determined first by drying samples at 105 C overnight (for DM content) and afterward ashing the same samples at 505 C for 3 h (for OM content). ADF was measured using the ANKOM 200 filter bag technique (ANKOM Technology, Macedon, NY, USA). The Acid Detergent Solution was prepared following Goering and van Soest (1970). 14
25 Data analysis From observations on foraging, we tested whether bite biomass and bite leaf mass scaled linearly with body mass and whether bite rate scaled as BM : Bite rate (bites/s) = number bites per feeding station / time between stepping between two feeding stations where feeding station was defined as the array of plants available to a herbivore from which bites could be taken without moving its front legs (Novellie 1978). Instantaneous intake rates were calculated in two ways. First, we used the conventional method where intake is calculated as: Intake rate (g forage ingested /s) = Bite mass (g) x Bite rate (bites/s) Next, we included the effects of ADF and calculated instantaneous intake rate as: Digestible cell mass (g) = Bite mass (g) x ((100 - %ADF) /100) Intake rate (g digestible cell mass ingested /s) = Digestible cell mass (g) x Bite rate (bites/s) Finally, both intake rates were scaled against body mass. To test whether larger herbivores had relatively bigger mouth sizes, and longer lips (or trunks), tongues and necks, we used power functions of body mass scaled against the different body parts associated with feeding, as geometric principles predict that all linear measurements should scale to BM Following this, at the bite scale, we tested whether intra-dental mouth volume, mouth volume and actual bite volume, as measured in the field, scaled linearly with body mass according to the same geometric principles. Volumes from morphological measurements were calculated as follows: Intra-dental mouth volume (cm 3 ) = Incisor width (cm) x Jaw length (cm) x Muzzle diameter (cm) Mouth volume (cm 3 ) = Intra-dental mouth volume (cm 3 ) + Maximum soft mouth part length (lip or tongue) (cm) 3 15
26 All power law equations used for scaling were calculated as follows: Y = a BM b where Y is expressed as a dependent function of body mass BM, a is a constant (a = 1 when BM = 1) and b is the scaling factor (slope of the regression line). For statistical analysis, curve estimations using power functions were used in SPSS followed by an ANOVA analysis to test the significance of the fitted curves. To prevent bias because of uneven sampling, mean values for each sex of each species were used in all analysis. Table 2.1 Morphological forage characteristics of herbivores measured in this study Characteristic Incisor width (cm) Muzzle circumference (cm) Tongue protrusion length (cm) Upper inner lip length (cm) Jaw length (cm) Description/method of measurement Linear width of the incisor arc in the lower jaw. For animals without incisors such as elephant the width of the gums were measured Circumference of the muzzle measured form just above the nasal cavity and around the lower jaw (Muzzle diameter = Muzzle circumference/ (2π)) The length the tongue protruded outside the mouth, measured from the incisors/lower gum to the tongue tip, without too much resistance when pulling the tongue out for measurement The length of the upper lip measured from the tip of the upper inner lip to the edge of the gum (for elephants this was measured as the length of the trunk) The distance between the gonial angle in the lower jaw and the mental protuberance Results Most linear morphological measurements associated with feeding such as jaw length, neck length and muzzle diameter scaled as predicted close to BM 0.33, except for neck length which scaled closer to 0.25, and maximum soft mouth part length with a scaling factor of 0.66 (Table 2.3, Figure 2.1). 16
27 Table 2.2 Large African herbivore data collected and used for analysis Sample sizes used in analysis Adult body from Herbivore Species Sex mass (kg) Direct Carcass Skull observed Steenbok (Raphicerus campestris) Duiker (Sylvicapra grimmia) Impala (Aepyceros melampus) Warthog (Phacochoerus africanus) Bushbuck (Tragelaphus scriptus) Blesbok (Damaliscus dorcas phillipsi) Nyala (Tragelaphus angasii) Oryx (Oryx gazelle) Red Hartebeest (Alcelaphus caama) Kudu (Tragelaphus strepsiceros) Wildebeest (Connochaetes taurinus) Waterbuck (Kobus ellipsiprymnus) Zebra (Equus burchelli) Eland (Taurotragus oryx) Buffalo (Syncerus caffer) Giraffe (Giraffe camelopardis) White Rhinoceros (Ceratotherium simum) Elephant (Loxodonta africana) At the bite scale, intra-dental mouth volume scaled to body mass with a factor slightly less than 1, whereas both mouth volume and actual bite volume as measured in the field scaled to BM 1.75 (Table 2.3, Figure 2.2). 17
28 Table 2.3 Results on the allometric scaling of morphological features and forage observations from large herbivores One dimensional morphological features Bite scale characteristics Feeding station scale characteristics Instantaneous intake rate Dependent Independent Scaling Constant variable variable factor b a R 2 Df F P Incisor Body mass , <0.01 width 24 Jaw length Body mass , < Muzzle diameter Body mass , <0.01 Maximum Body mass , <0.01 soft mouth 18 part length Intra-dental mouth volume Body mass , 16 Mouth volume Body mass , 17 Actual bite Body mass , volume 20 Bite mass Body mass , 22 Bite leaf Body mass , mass 22 Actual bite Mouth , volume volume 13 Bite rate Body mass , 20 Intake rate (g / s) Intake rate (digestible cell (g / s) Body mass , 20 Body mass , < < < < < < < <0.01 As expected bite mass and bite leaf mass scaled linearly with body mass. In accordance with predictions, conventional instantaneous intake rate scaled linearly to body mass, whereas instantaneous intake rates, including the effects of ADF, scaled as BM 0.75 (Table 2.3, Figure 2.3). 18
29 (a) 14 (b) 80 (c) In c is o r w id th (c m ) M u z z le d ia m e te r (c m ) y = x R 2 = Body mass (kg) 14 Jaw length (cm) (d) Maximum soft mouth part length (cm) y = x R 2 = Body mass (kg) y = x y = x R 2 = R 2 = Body mass (kg) Body mass (kg) 200 Figure 2.1: The scaling of body mass with linear morphological foraging characteristics of large African herbivores including, incisor width (a), jaw length (b), muzzle diameter (c) and maximum soft mouth part length (d). 19
30 (a) Mouth volume (cm 3 ) y = 6.889x R 2 = (b) Predicted bite volume (cm 3 ) (c) Bite Volume (cm 3 ) y = x Body mass (kg) R 2 = Body mass (kg) y = x R 2 = Body mass (kg) Figure 2.2: The scaling of body mass of large African herbivores with intra-dental mouth volume (a) and mouth volume (b) as calculated from animal morphology, and with mean bite volume as measured in the field (c). 20
31 (a) Intake rate (g DM / second) y = x R 2 = (b) Intake rate (g digestible cell /second) Body mass (kg) y = 0.001x R 2 = Body mass (kg) Figure 2.3: The scaling of body mass (kg) with intake rate expressed as dry matter mass (g/s) (a) and intake rate expressed as digestible cell mass (g)/sec; (b). 21
32 Discussion Although most mouth morphological features scaled geometrically as BM 0.33, maximum soft mouth part length scaled higher, closer to BM 0.66 in contrast to what we believed on basis of, for example, Hutchinson (1959). As a consequence of this and as predicted by Clutton-Brock and Harvey (1983) and Owen-Smith (1985), bite mass scaled linearly with body mass. Other studies conducted in the past on this type of scaling contradict our findings. For example, Shipley and co-workers (1994) found bite mass to scale to BM 0.72, whereas Fortin (2006) found a scaling factor of However, these studies were conducted in zoos, which did not allow for animals to make choices between plants occurring in their natural habitats. Bite rate did not scale with body mass possibly because larger animals such as white rhinoceros do not move their heads when feeding but instead use their lips to increase bite rates (Owen-Smith 1988) probably because muscle movement required to move the head for such a large animal would require too much energy resulting in decreased bite rates. We found intra-dental mouth volume to scale to body mass with a factor slightly less than one, but because mouth volume and actual bite volume both scaled as BM 1.75 and bite volumes of elephant were even higher than the predicted curves, we reason that the increase in bite volume in larger animals is a result of elongated soft mouth parts. The linear scaling of bite leaf mass with body mass at first sight seems to defy logic. To understand this relationship we have to first understand what happens with plant mass in space. According to scaling laws found in plant ecology, average plant mass scales as plant density 0.75 and standing leaf biomass as standing stem biomass 0.75 (Enquist et al. 1998, Niklas 2004). Similarly, in South African savannas Drescher (2003) found the proportion of leaves and average nitrogen content in plants to decrease with increasing plant mass. Large bites usually encompass more fibrous plant parts, which reduces digestibility (Shipley & Spalinger 1995), because structural tissues of plants increase from the distal to the proximal parts of the plant (Hjeljord 1987, Hubbert 1987) and nutritional quality of twigs decrease with increasing diameter (Palo et al. 1992, Jia et al. 1995). Bite diameter cropped by African thicket browsers scales with body mass in the same allometric manner as incisor breadth, as BM 0.3 (Wilson & Kerley 2003). The implications of these findings and scaling relationships for herbivores, is that larger herbivores will not only have less plant biomass available to them in relation to their body mass but will also take in forage of a lower quality as the fraction of stem material will be larger and the leaf mass fraction will be lower. We reason that to compensate for the dilution of plant mass and quality in space, enlarged soft mouth parts not only allows larger animals to be more selective but also to cover a bigger area in one bite, which increase both leaf mass and total bite mass. As expected, instantaneous intake rate, calculated in the conventional way as the product of bite rate and bite mass, scaled linearly with body mass. In disagreement, and closer to what 22
33 we expected when using digestible cell mass per bite to calculate instantaneous intake rate, Shipley and co-workers (1994) found maximum instantaneous intake rate to scale as BM However, this might be explained by the fact that digestibility was already artificially corrected for in Shipley s zoo experiment as all animals were fed alfalfa plants of the same quality. In the wild, herbivores of different body mass are presented with a wide variety of plants with different leaf to stem ratios, and a different spatial structure of the forage biomass. Stems have been found to serve as both vertical (Ginnett et al. 1999) and horizontal (Drescher et al. 2006) barriers reducing bite depth, bite mass and therefore instantaneous intake rate. As stems contain more structural compounds, such as lignin and cellulose than leaves, they decrease bite quality (Searle & Shipley 2008). Recently, van Langevelde and co-workers (2008) developed a model that for the first time included quality as a factor affecting the functional response of animals. Our results for instantaneous intake rate as obtained from the inclusion of ADF to calculate the digestible cell mass available to a herbivore, supports this notion of including quality in the calculation of instantaneous intake rate. ADF is frequently used as a proxy for fibre and fibre is the most common variable used to predict energy content of feeds (Weiss 1993). Hence, the scaling of digestible cell mass intake to BM 0.75 is in accordance with the scaling of metabolizable energy requirements to BM 0.75 (Kleiber 1932). The spatial distribution of a herbivore s habitat, and food resources can be described well with fractal geometry as this distribution is often self-similar across ecologically relevant ranges of scales (3-4 orders magnitude) (Ritchie & Olff 1999). In both plants and animals, species richness versus organism size follows a left-skewed, unimodal distribution because larger species are limited by the maximum patch size in the environment (Ritchie & Olff 1999). Although some plants have adapted to herbivory, it is generally accepted that the evolution of plants preceded mammals (Janis 1993), meaning that the same chemical and mass characteristics and patterns in plants should also be apparent in the animals feeding on them. Evidence of these similarities exists in the universal allometric scaling of resource use and metabolic rate in both animals and plants to BM 0.75 (West et al. 1997, Enquist et al. 1998). Development of morphological features such as trunks takes millions of years (Shoshani 1993). More over, sudden climate changes such as those that occurred around the end of the Eocene and the beginning of the Oligocene, which have been implicated to have caused changes in plant abundance and greater differentiation of fibre content between plant leaf and stem, coincide with extinctions of mega-herbivores (Janis 2008). We hypothesize that these extinctions occurred because large herbivores did not have suitable mouth morphologies to cope with the dilution of food resources in space. We conclude that mega-herbivores of today such as giraffe, white rhinoceros and elephant have extreme mouth morphologies and sizes as a result of natural selection to adapt to the spatial mass and quality distribution patterns of plants. 23
34 24


35 CHAPTER 3 SOIL NUTRIENT STATUS DETERMINES HOW ELEPHANT UTILIZE TREES AND SHAPE ENVIRONMENTS Y. Pretorius, W.F. de Boer, R. Slotow, C. van der Waal & H.H.T. Prins 25
36 Abstract Establishment of the mechanism determining the spatial scale of patch selection by herbivores have been complicated by the way in which resource availability at a specific scale is expressed and by vigilance behaviour of the herbivores themselves. To reduce these complications we chose to study patch selection by an animal with negligible predation risk, the African elephant. Further, we introduce the concept of nutrient load as the product of patch size, number of patches and local patch nutrient concentration, which offers a novel way to express the total available nutrients a herbivore can select from per grain of a specific scale. We hypothesized that elephant will be able to select nutrient rich patches based on the nutrient load per 2500 m 2 down to the individual plant scale and that this selection will depend on the nitrogen and phosphorous content of plants. Further, we predicted that elephant will cause more injurious impact to trees of lower value to them in order to reach plant parts with higher nutrient concentrations such as bark and root but will maintain nutrient rich trees by inducing coppicing of trees through re-utilization of leaves. Elephant patch selection was measured in a homogenous tree species stand by manipulating the spatial distribution of soil nutrients in a large field experiment using NPK fertilizer. Our results showed that elephant were able to select nutrient rich patches and utilized Colophospermum mopane trees inside these patches more than outside, at scales ranging from 2500 m 2 down to 100 m 2. Although both nitrogen and phosphorus content of leaves from C. mopane trees were higher in fertilized and selected patches, nitrogen had the strongest correlation with patch choice. As for the impact of elephant on trees, stripping of leaves occurred more in nutrient rich patches, whereas injurious impact such as uprooting of trees occurred more in nutrient poor areas. Our results shed some light on how future studies should interpret patch selection by herbivores at different scales and how elephant foraging behaviour can be used as indicators of changes in the availability of nutrients. Keywords: patch selection, Colophospermum mopane, nitrogen, nutrient load, spatial scale, re-use 26
37 Introduction An herbivore that is selective and able to discriminate between food of good and bad quality should have a selective advantage (Fryxell 2008). However, food selection is complicated in that, unlike with a carnivore, a large herbivore s food is much less concentrated and is distributed as a nested hierarchy of aggregated resources, which vary widely in nutrient composition and mass (Senft 1987, Kotliar & Wiens 1990, Bailey et al. 1996, Searle et al. 2005, Fryxell 2008). These aggregated resources can be defined as patches that are discrete spatial units differing from their surroundings in nature and/or appearance and that cause changes in a herbivores foraging behaviour (Kotliar & Wiens 1990, Searle et al. 2005). Patch selection by herbivores further depends on the spatial scales at which the environment is perceived, where grain is the smallest scale at which a herbivore responds to patch structure and extent the largest scale of heterogeneity to which a herbivore responds (Kotliar & Wines 1990). In this study, we will test whether a large herbivore is able to select nutrient rich patches at multiple scales as boundaries between the sub-units within different hierarchical scales should be defined by the animals perceptions and foraging responses (Senft et al. 1987). However, within a specific spatial scale, patches are not simply distributed uniformly but vary in size, number and local nutrient concentration (Bailey & Provenza 2008). Therefore, at each scale, the resource value per grain should be expressed as the total nutrient load, whether it be areas with large nutrient rich patches, areas with many small nutrient rich patches or areas with patches with very high local nutrient concentrations. In our study spatial scales will range from 2500 m 2, where a herbivore select between areas with different total nutrient loads, to selection between individual neighbouring plants of the same size and species (Figure 3.1). Studying the mechanisms behind patch use is complicated by the effects of predation risk. For example, the Marginal Value Theorem (MVT) predicts that foragers will depart from a single patch when their instantaneous intake rate drops below the average rate of intake attainable in all patches (Charnov 1976). However, increased predation risk should affect MVT in that giving up densities should increase (Brown 1999). Therefore, as a study animal, we chose the largest terrestrial herbivore, the African elephant, for which predation risk in our study area is negligible. Studies on patch selection of herbivores in relation to its nutrient status have shown that herbivores are not only able to select nutrient rich patches but are also able to do so at different scales (Wallis devries 1999, Ball et al. 2000, Cromsigt & Olff 2006, Chapter 2). Elephant in particular have been found to be able to select vegetation growing on termite mounds at very small scales (Holdo & McDowell 2004). Therefore we predict that 27
38 elephant will be able to select nutrient rich areas at scales ranging from 2500 m 2 down to the individual plant scale. Figure 3.1: A schematic representation of the study set-up illustrating the spatial scales at which experiments were conducted. Many studies show that savannas are either limited by N or P or co-limited by both (du Toit et al. 1940, Weir 1969, Ludwig et al. 2001, Snyman 2002, Augustine et al. 2003, Cech et al. 2008). Because non-ruminants such as the elephant cannot make use of microbial protein and have high food passage rates, they can be expected to incur higher losses of N in the faeces (Foose 1982). Selection for N and P by elephant have been described by Jachmann & Bell (1985) and from diet studies on elephant at our study site in South Africa, we know that elephant maximize N and P intake depending on the time of the year (Chapter 4). Hence, we expect elephant to select patches and plants of the same species depending on their N and P content. 28
39 The impact African elephant have on trees have been a topic of great controversy (Wiseman et al. 2004, de Beer et al. 2006, Lawes & Chapman 2006, O Connor et al. 2007, Chafota & Owen-Smith 2009, Scholes & Mennell 2008). Elephant have been implicated as one of the key factors maintaining low tree-grass ratios in savannas (van de Koppel & Prins 1998). However, few studies have investigated the causal mechanisms of elephant impact, especially the interactions with nutrient availability and distribution (Skarpe et al. 2004). Injurious impact on trees when bark and roots are consumed is not unique to elephant and has been described in voles (Microtus spp.) (e.g., Sullivan et al. 2004), Sika deer (Cervus nippon) (e.g., Yokoyama et al. 2001) or red deer (Cervus elaphus) (e.g., Verheyden et al. 2006). However, consumption of bark and roots has mostly been attributed to the lack of good quality alternative food sources, especially during winter, rather than to the high nutritional quality of these plant parts (Servello 1984, Bucyanayandi et al. 1992, Verheyden et al. 2006). Similarly, elephant impact on trees also is especially prevalent during the dry season when elephant switch from a diet dominated by grass to browse because grass quality decrease to below the animal s maintenance requirements during this time (Barnes 1982, Beekman & Prins 1989, Kos et al. 2008). Hence, according to O Connor and co-workers (2007), an increased consumption of woody material indicates nutritional stress. We predict that elephant will have a larger impact on trees that represent low quality food through, for example, increased utilization of roots, whereas impact on trees growing in nutrient rich patches will be less, with leaves being utilized more. Maintenance of nutrient rich patches (so called grazing lawns: Vesey-FitzGerald 1969) is especially common among grazing animals like hippopotamus (Hippopotamus amphibious) and white rhinoceros (Ceratotherium simum) (Verweij et al. 2006, Waldram et al. 2008) and consumption of fresh re-growth along with short re-visitation intervals have also been observed during spring time for grazers such as Brent geese (Branta bernicla) (Prins et al. 1980) and buffalo (Syncerus caffer) (Prins 1996). Elephant have been shown to prefer previously browsed trees (Anderson & Walker 1974; Jachmann & Bell 1985; Lewis 1991) and forage quality and quantity have been shown to increase with repeated herbivory (du Toit et al. 1990, Rooke et al. 2004, Fornara & du Toit 2007). For Colophospermum mopane trees, Smallie and O Connor (2000) found that elephant prefer previously hedged trees and induce coppicing of these trees. We thus predict that elephant maintain nutrient rich patches of C. mopane trees and expect coppiced trees, occurring as a result of previous hedging by elephant, to occur more in nutrient rich areas and to have more fresh signs of leaf utilization than in nutrient poor areas. To test these predictions, we experimentally manipulated the spatial distribution of nutrients in a homogenous stand of plant species dominated by C. mopane trees. 29
40 Methods In December 2004 we fertilized thirty 50 m x 50 m plots in the Timbavati Private Nature Reserve (TPNR), South Africa (24 14'11"S; 31 22'32"E) with NPK (3:2:1) fertilizer. The area was re-fertilized two years later at the same fashion. The experimental study site was dominated by a homogeneous layer of C. mopane shrub veld on granitic soils. The herbaceous layer was dominated by Urochloa mosambisencis and Bothriochloa spp. (for a full description of the vegetation see van der Waal, in prep). The warm, rainy season stretched from October to March and during the study period the mean annual rainfall was 420 mm. Data were collected from October 2005 to March Surface water was not constraining plot use, as it was available within 0.5 km north and south from the closest experimental plot. The experimental layout followed a randomized block design including three replicates of seven different treatments and nine controls. One control was allotted to each scale treatment and replicated three times. The fertilizer was applied at each 50 x 50 m plot at either one of three different spatial configurations: one large 50 x 50 m patch, five 10 x 10 m patches, or 25 patches of 2 x 2 m, using either one of three different nitrogen concentrations (30.0 g/m 2, 6.0 g/m 2, 1.2 g/m 2 ). This resulted in seven combinations and one of three different total nutrient loads per 50 x 50 m plot (0.6 kg N, 3 kg N, 15 kg N), as the lightest and heaviest fertilizer concentrations were excluded, as these were expected to generate too faint signals or toxic effects. Data collection on the type of nutrients selected by elephant and the scale of nutrient selection consisted of annual measurements during the wet seasons from 2006 to 2008 on the leaf nutrient content and accumulated signs of elephant utilization on 600 marked C. mopane trees and direct observations on elephant selecting between two C. mopane trees of the same size within areas surrounding the experiment, which were also dominated by C. mopane. Data on the way elephant utilized trees and the occurrence and utilization of coppiced C. mopane trees in and outside fertilized patches were obtained from an elephant utilization assessment on all trees larger than 1.5m within the experimental plots at the end of the study. Annual mopane tree measurements Tree responses were monitored in 600 marked (with aluminium tags) C. mopane trees. In controls and in whole-plot fertilizer treatments, C. mopane trees (> 1m height) closest to twenty randomly picked points were selected throughout each plot. In heterogeneous treatments (patch size either 10 x 10 m or 2 x 2 m), ten trees with stems within 2 m distance of fertilized patches were randomly selected, together with ten trees throughout the unfertilized plot area (> 2m distance from fertilized patches). Leaf samples from C. mopane trees were collected during the growing seasons of 2006, 2007 and Five fully expanded leaves were randomly collected from the canopies of the marked trees. In homogeneous treatments, two pooled samples were analysed per plot. In heterogeneous treatments, samples 30
41 were pooled for leaves collected from the plants in and outside fertilized patches. This resulted in sixty samples per year. Prior to milling (through a 1 mm sieve), C. mopane leaves were dried to constant weight at 60 0 C and weighed. All marked C. mopane trees were assessed for elephant impact (percentage canopy volume reduction) using the scale of Anderson & Walker (1974). In 2006 the height and diameter of marked trees were calculated from digital photographs. At the end of the experiment in 2008, a selection of trees was remeasured to determine tree height changes in relation to visual elephant impact scores. For analysis, as ten trees were measured per patch, elephant utilization was also expressed as the proportion of trees utilized per patch. Direct observations All elephant observations conducted in areas dominated by C. mopane surrounding the experiment were of randomly encountered adult solitary bulls or bulls in small bachelor groups. All data were collected during the wet season of 2006 and were spatially and temporally independent as only one paired sample were collected at each sighting of a particular elephant or group of elephant on a particular day. Each elephant was located using the extensive road network on the reserve and observed from a vehicle for between 5 and 10 min (or until the animal moved out of site) using binoculars. For an observation to be accepted, an elephant had to be foraging in a homogeneous area of C. mopane trees. Only once an elephant moved from the tree it was first observed feeding on, to feed on the next tree, was the next tree used for measurement. Measured trees were all C. mopane, between 3-6m, and the elephant had to have taken at least five bites from the canopy, before the tree was considered a appropriate tree to be sampled. For each of the measured trees eaten from, a discarded paired control tree was selected. This discarded tree had to be a C. mopane of similar height and canopy size, which the elephant had to have walked past (within 2 m) and not selected while moving towards the tree eaten from. About 50 g of leaf material was collected from various branches on each tree at the same height range at which the elephant fed from. Leaves from both the tree eaten from and the discarded tree were stored in separate paper bags, dried at 60 ºC for 24 h and ground through a 1mm sieve and stored for further analysis. Chemical analysis of leaf samples All dried leaf samples were analyzed for dry matter, ash, neutral detergent fibre, calcium, sodium, potassium, magnesium, nitrogen and phosphorus content at the laboratory of the Resource Ecology Group, Wageningen University (the Netherlands). Total Ca, Na, Mg, K, N and P content were measured with a Skalar San-plus auto analyzer, after destruction with a mixture of H 2 SO 4, Selenium and salicylic acid. (Novozamsky et al. 1983). Neutral detergent fibre of dry leaf was determined using the ANKOM filter bag procedure (ANKOM Technology Macedon. NY, USA) with omission of the sodium sulphite and the heat resistant 31
42 α-amylase. A neutral Detergent Solution was prepared following Goering & van Soest (1970). Condensed tannins were measured with the Proanthocyanidin method and total polyphenol with the Folin-Ciocalteu method (Waterman et al. 1994). Elephant impact assessment All trees higher than 1.5 m in 50 x 50 m plots containing five fertilized patches of 10 x 10 m each were assessed during March 2008: at each tree the position of the tree in the 50 x 50 m plot was recorded within a 2 x 2 m grid. Fertilized patches were marked at the beginning of the study with iron stakes, to indicate whether a tree occurred within a fertilized patch or not. The tree species, type of treatment within the 50 x 50 m plot, tree height and canopy width, the occurrence of coppicing as a result of visible previous impact by elephant, percentage of each type of utilization, total percentage impact and estimation of the age of impact were recorded. The area on a branch impacted on by elephant becomes grey after a year through a rainy season (Ben-Shahar 2002). Therefore, the age of impact on a tree was classified as fresh when scars had not yet turned grey and old, when it had. The type of utilization was categorized into five classes: leaf stripping, bark stripping, impact on branches, uprooting, or breaking of the main tree trunk. The percentage leaf stripping, bark stripping and impact on branches were estimated in relation to the availability of the plant part across the entire tree. Uprooting and breaking of the main tree trunk were recorded as 100% impact. Data analysis All data were first tested for normality using the Kolmogorov-Smirnov test and where proportions were used data were first arcsine transformed. Two types of analysis were used to test elephant selection for specific nutrients. First, we used a one-way ANOVA to test whether N, P, K, Mg, Ca and Na were higher in leaves from trees in fertilized patches compared to unfertilized patches and whether elephant utilized these trees in fertilized patches more than unfertilized patches. Second, we conducted a multiple linear regression analysis to test for correlations between the concentrations of different nutrients as independent variables and the proportion of trees utilized by elephant per patch as dependent variable. Annual elephant utilization measurements on marked C. mopane trees were used in an ANOVA to test whether elephant were able to select fertilized patches at a 50 x 50 m scale and at a 10 x 10 m scale. For analysis at the plant scale between neighbouring trees, paired sample t-tests were used to compare nutrient levels in leaves between eaten and uneaten trees. Because leaf stripping (%) and signs of elephant utilization on branches (%) were not normally distributed, the non-parametric Mann-Whitney test was used to detect differences between fertilized and unfertilized patches. As the number of coppiced trees and trees killed by elephant are rare events with many zero values, a generalized linear model with a negative binomial error distribution was used to test for differences of these variables inside and outside fertilized patches. 32
43 Results The application of the NPK fertilizer significantly changed the chemical composition of leaves from mopane trees at our experimental site. Both nitrogen (F 1,58 = , p < 0.001) and phosphorus (F 1,58 = , p < 0.001) content of tree leaves were significantly higher in fertilized patches compared with unfertilized patches, whereas the opposite was true for the tannin content of leaves (F 1,58 = , p < 0.001). However, no significant difference could be found for K (even though the fertilizer contained K), or Ca, Mg, Na or NDF concentration in leaves. Irrespective of patch size, the proportion of mopane trees utilized by elephant per patch was significantly higher in fertilized patches as compared to unfertilized patches (F 1,58 = 10.95, p < 0.05) although the proportion of trees utilized by elephant per patch was only positively correlated to the nitrogen concentration in leaves and not with the other nutrients (linear regression model: R 2 = 0.462, F 7,52 = 6.368, p < 0.001) (Figure 3.2). Proportion trees utilized/patch 1.00 A A 0.80 A A 0.60 A A A A A A 0.40 A A AA A A A A A A A A A A 0.20 A A A A A A A A A A A A A A Percent nitrogen (DM) Figure 3.2: The relationship between the proportion Colophospermum mopane trees utilized by elephant per patch and the percentage nitrogen (on a dry matter basis) in tree leaves (n = 60). At both the 2500 m 2 (F 3,56 = 4.564, p < 0.05) and 100 m 2 (F 1,22 = 9.743, p < 0.05) scales elephant were able select the plots with the highest nutrient loads as utilization of mopane trees were significantly higher at these plots (Figure 3.3). At plant scale, although N and P content from leaves of eaten trees were higher than leaves from neighbouring trees of the same species that were not eaten, these differences were not significant (N: t 14 = , p = 0.235, P: t 14 = -1.61, p = 0.13). For the elephant utilization assessment at the 100 m 2 scale, utilization of tree leaves via leaf stripping occurred more inside fertilized patches than outside (Z = , n = 786, p < 33
44 0.001), whereas total impact on branches did not differ between patches (Z = , n = 786, p = 0.344) (Figure 3.4a & 3.4b). Tree killing, through uprooting of trees or breaking main tree trunks, occurred more outside fertilized patches than inside (Wald chi-square = 3.818, df = 1, p < 0.05) (Figure 3.4c). Tree coppicing occurred equally frequent inside fertilized patches as in the surrounding areas (Wald chi-square= 3.181, df=1, p=0.075). As expected, coppiced trees had significantly more signs of fresh leaf stripping than non-coppiced trees (Wald chi-square=5.398, df=1, p<0.05) (Figure 3.5). (a) Proportion trees utilized/patch n = 15 n = 9 (b) Proportion trees utilized/patch b ] ] n= a ] ab ab ] ] ] 0.0 n= Absent Present NPK Fertilizer NPK fertilizer in 10 x 10 m concentrationgrams Nutrient load (g N / 10 x 10 m) (c) Proportion trees utilized/patch n = 18 n = 42 (d) Proportion trees utilized/patch 0.6 b 0.4 ] ab ab ] a ] ] 0.2 ] 0.2 ] Absent Present fertilizerscale NPK Fertilizer in 50 x 50 m Nutrient load (g N /2500m2) / x m) Figure 3.3: Proportion of Colophospermum mopane trees used by elephant in fertilized and unfertilized patches (panels a and c) and in patches with increasing nitrogen loads (panels b and d) at 100m2 (panels a and b) and 2500 m 2 (panels c and d) scale (error bars show 95% confidence interval of the mean and different letters in the figures denote significant difference). 34
45 (a) 2.5 (b) (c) Proportion trees killed Percentage branch impact Percentage leaf strip Percentage trees killed Percentage branch impact Percentage leaf strip ] ] Absent 0.00 Present 1.00 Fertilizer ] ] Absent 0.00 Present 1.00 Fertilizer ] ] Absent 0.00 Present 1.00 Fertilizer Figure 3.4: Differences in elephant utilization at a 100 m 2 scale between fertilized (n=176) and unfertilized (n=610) patches, distinguishing different use-categories: (a) leaf stripping, (b) impact on branches and (c) killing of trees respectively (error bars show 95% confidence interval of the mean). 35
46 (a) 0.15 (b) 1.5 Proportion coppicing trees Percentage coppicing trees ] n=610 ] n=176 Proportion leaf strip Percentage leaf strip ] ] n=757 n=29 Absent 0.00 Present 1.00 Fertilizer 0.00 No 1.00 Yes Coppicing Coppicing tree tree Figure 3.5: Differences in the percentage coppicing trees in the presence or absence of fertilizer (a) and signs of fresh leaf stripping on coppiced and non-coppiced trees (b) (error bars show 95% confidence interval of the mean). Discussion Two decades ago, Senft and co-workers (1987) introduced a hierarchy theory into herbivore foraging ecology to integrate foraging decisions at different spatio-temporal scales as the application of traditional optimal foraging theory were problematic. Since then, many studies have illustrated how herbivores of various body mass are able to select nutrient rich patches at a range of spatial scales (WallisdeVries 1999, Durant et al. 2004, Cromsigt & Olff 2006). In deed, in this study we also found that elephant are able to select nutrient rich patches at scales ranging from 2500 m 2 to 100 m 2. Contradictory to the theoretical predictions of Ritchie and Olff (1999) that larger species will not be able to detect food patches at fine scales, we found that even the largest terrestrial mammal are able to select nutrient rich plant parts at fine scales within a homogeneous tree species stand. To our knowledge this has never been shown for elephant. At a regional scale (100 km), in a study conducted in C. mopane woodlands in Botswana, no relationship could be found between elephant impact on C. mopane trees and leaf N content even though soil N levels and leaf N were related and leaf N differed significantly between sampling sites (Ben- Shahar & McDonald 2002). However, this latter study was conducted at larger scales than our study, no analysis was done on the relationship between the type of elephant impact and the nutrient status of the plants and soil and leaf samples were collected in the dry season when elephant are more limited by energy (Chapter 4) and thus less selective of other nutrients such as N and P. 36
47 Selection of plant species high in N have been described for elephant within their daily foraging ranges (Jachmann & Bell 1985), for barnacle geese (Branta leucopsis) in fertilizer experiments at 250 m 2 scale (Ydenberg & Prins 1981) and at even smaller scales black colobus monkeys (Colobus satanas) in the rain forests of Cameroon have been found to select plant parts in relation to their nitrogen content (McKey et al. 1981). Some authors reason that switching between plant species or plant parts is a behavioural adaptation to cope with declines in N content (Mattson 1980) and that elephant in particular switch between plant species and plant parts to sequester the greatest amount of digestible protein per unit time (O Connor et al. 2007). For example, cambium in the bark and roots of plants contain relatively high levels of N (Mattson 1980) and Hiscocks (1999) found that cambium samples from bark and root that elephant utilized were higher in N than cambium from unutilized trees. Therefore, uprooting of trees in nutrient poor areas, such as was found in our study, could be a result of low leaf N levels, which encourages elephant to utilize other plant parts with higher N content. Irrefutably, our study s biggest contribution to the current body of knowledge on optimal foraging theory is the concept of patch selection by a herbivore based on the total nutrient load within the grain size of a specific scale. In the real world patch size do not simply increase uniformly but patches vary in size and can be scattered or aggregated depending on the scale of observation. More over, the local nutrient concentration between patches can also vary widely (Fryxell 2008). Thus when studying patch selection by a herbivore at a particular scale, the available nutrients must be expressed as total nutrient load per grain size, which is a product of the number of patches, local nutrient concentration of patches and patch sizes. We found that at a scale of 2500 m 2, elephant are able to select the patch combinations resulting in the highest total nutrient loads, whether it was many small patches of high local nutrient concentration per 2500 m 2 or few large patches of lower local nutrient concentration per 2500 m 2. These findings may not only have implications for the way patch selection by herbivores are interpreted at different scales, but also offers a possible explanation why some studies find, contrary to the Marginal Value Theorem, that herbivores select sub-optimal patches or leave patches when there is still much food left (Schaefer & Meissier 1995).This dependence of Marginal Value Theorem predictions on the scale at which a herbivore perceives patches, which is very difficult to determine, has also been noted by Kotliar and Wiens (1990) and Searle and co-workers (2005). Finally, our study illustrate how elephant can possibly facilitate other species by maintaining tree islands of fertility (Ludwig et al. 2008, Treydte et al. 2009) through re-use of trees and dung deposition, which may potentially initiate positive feedbacks into the abiotic environment (van der Waal, in prep). Jachmann and Bell (1985) and subsequently Smallie and O Connor (2000) hypothesized that by continuously hedging C. mopane trees elephants 37
48 can maintain a supply of preferred coppice growth through time. The increased proportion of coppiced mopane trees due to previous breaking of branches by elephant inside fertilized plots and the higher occurrence of leaf stripping on these trees indicate that the fertilizer in our experiment might have triggered a positive feedback response that may persist through time. In a fenced off clipping experiment conducted in northern Botswana elephant broke into the experimental site three years after initiation. Assessment of elephant impact one month after the break-in revealed higher utilization of trees subjected to simulated browsing three years before compared to control trees (Makhabu 2006). Often, the problem with studying keystone species in the wild is that their effects on other organisms only become prevalent once the keystone species are removed as was demonstrated by the removal of impala by disease followed by a subsequent increase in woodland cover in East Africa (Prins & van der Jeugd 1993). The advantage of an experimental approach is that the mechanisms behind these effects become clearer without removal of keystone species. Both soil fertility and elephant have been identified as major determinants of tree-grass ratios in savannas (Scholes 1990, Fritz et al. 2002, O Connor et al. 2007, Sankaran et al. 2008). However, the interaction between these two factors and more specifically how soil nutrient status affect the way in which elephant utilize their environments were until recently unclear (Olff et al. 2002, Skarpe et al. 2004). We aimed to better understand this mechanism but more importantly our results shed some light on how future studies should interpret patch selection by herbivores at different scales. By concentrating limiting resources, patchiness may play a critical role in maintaining ecosystem productivity (Aguiar & Sala 1999) and herbivory have been shown to create spatial heterogeneity and induce vegetation patterning through the process of self facilitation (Groen 2007). We conclude that more emphasis should be placed on the nutrient status of soils when trying to understand the impact elephant have on trees (Fritz et al. 2002) as changes in elephant foraging behaviour can be used as indicators of changes in the availability of nutrients. 38


49 CHAPTER 4 LARGE HERBIVORE RESPONSES TO NUTRIENT HETEROGENEITY IN AN AFRICAN SAVANNA Y. Pretorius, W. F. de Boer, M.B. Coughenour, H.J. de Knegt, H. de Kroon, C.C. Grant, I. Heitkonig, E. Kohi, E. Mwakiwa, M.J.S. Peel, A.K. Skidmore, R. Slotow, C. van der Waal, F. van Langevelde, S.E. van Wieren, H.H.T. Prins 39
50 Abstract Understanding how animals respond to spatial heterogeneity in resource distribution is central to animal ecology. In this paper, we present a study to analyse at what spatial scale herbivores select nutrient rich patches to maximize intake, and how an animal s digestive system, body mass, mouth size and herd size affects this selection. We tested whether the selection of areas with the highest nutrient content occurs at different spatial scales for different herbivore species. We hypothesized that smaller animals, animals occurring in large herds and ruminant species will select areas of high nutrient concentration at small spatial scales whereas smallmouthed animals will select areas with high nutrient content at larger spatial scales. Using fertilizer to manipulate soil nutrient levels, we tested our hypotheses. Nutrients were applied in 2500 m 2 plots at three different patch sizes and three different nutrient concentrations. This resulted in differences in nutrient concentrations at the local scale and at the 2500 m 2 plot scale. Dung and spoor counts served as measures of animal abundance and indicators for patch selection. Consistent with our hypotheses, large animals selected areas of high nutrient concentration at larger spatial scales, whereas the abundance of ruminants decreased as nutrient concentrations at large scales increased. As for individual species, duiker, warthog and elephant selected for high nutrient concentrations at large scales while buffalo, zebra and impala did so at the local point scale. Beyond selection of nutrient rich areas at small scales, buffalo and zebra were the only species to increase in abundance with increasing patch size. We explain the reaction of species to nutrient spatial heterogeneity using a conceptual model that divides herbivores into two groups of animals based on their mouth to body mass ratios and the total metabolic weight of a herd. The model shows that herd animals, with their medium sized mouths, select for higher nutrient concentrations at small scales whereas animals with extreme mouth to body mass ratios select for higher nutrient concentrations at larger scales. We reason that due to competition and the risk of resource depletion, herd animals may be forced to select areas of high nutrient concentration at the local point scale. Keywords: herd size, metabolic weight, mouth size, patch selection, spatial scale 40
51 Introduction Understanding foraging strategies that herbivores adopt at different spatial and temporal scales is central to animal ecology (Fryxell, Wilmshurst & Sinclair 2004; Prins & Van Langevelde 2008). However, these scaling effects have often been neglected in the past (Owen-Smith 1994, van Wieren 1996; Illius et al. 1999). One of the first studies in the wild on maximization of energy at different temporal scales, showed that wood bison (Bison bison athabascae) maximize their energy intake in the short-term but not over longer time scales (Bergman et al. 2001). More recent studies have attempted to understand the effects of spatial scale on herbivore forage selection (Cromsigt & Olff) but some disparity still exist. In this paper, we assessed how herbivores respond to changes in nutrient heterogeneity and at what spatial scale a herbivore with a particular mouth, herd and body mass, will select areas with higher nutrient concentrations. Spatial scaling depends on the extent (range that study covers) and grain size (unit size area are divided into) selected to study an area (Wiens 1989). Various spatial scales of forage selection have been described ranging from bites, feeding stations and patches at small scales to feeding sites at larger scales (Novellie 1978; Jiang & Hudson 1993; Laca, Ungar & Demment 1994; Bailey et al. 1996). It has been shown that abiotic factors such as soil nutrient content (Seagle & McNaughton 1992) and biotic factors such as forage quality and quantity (Bailey et al. 1996) regulate the distribution and abundance of large herbivores (Augustine, McNaughton & Frank 2003). The spatial distribution of nutrients is heterogeneous and varies with both the size of nutrient patches and the concentration in these patches. An increase in patch size could occur as result of redistribution of nutrients, for example by latrines of large herbivores (Moe & Wegge 2008, van der Waal et al. 2009) and termite activity (Loverigde & Moe 2004), which could lead to an increase in the area of plants with both higher biomass and quality. An increase in nutrients at very small spatial scales results only in a local increase in plant quality and biomass (Cromsigt & Olff 2006). The relative effects of patch size and nutrient concentration on the selection of forage by herbivores are difficult to disentangle (Cromsigt 2006). Different combinations of patch size and local nutrient concentrations will result in different total nutrient loads at larger scales. For example, a high local nutrient concentration will not necessarily result in a high nutrient concentration at larger scales because the total nutrients at larger scales also depend on the number and sizes of nutrient rich patches. We reason, similar to Schoener (1969) that animals can only choose one of two foraging strategies. Firstly, an animal selects the combination of patch sizes and local nutrient concentrations at small spatial scales that will yield the highest nutrient concentrations at larger scales. Under these conditions, the animal may need more time foraging because the local small scale nutrient concentration may be low, but at larger scales, there will be more 41
52 nutrients available in total. Bison and elk, for example, have been found to feed randomly within patches but select feeding sites based upon forage abundance at broader, landscape scales (Wallace et al. 1995). Alternatively, an animal selects, at a small scale, for the highest local nutrient concentration that may not necessarily yield the highest nutrient concentrations at larger spatial scales. Because the animal will meet its nutrient requirements faster with high small scale nutrient concentrations, it may prefer to spend more time on other activities at larger spatial scales. We expect that body mass determine which foraging strategy herbivores will follow. Along with body mass, the most widely recognized animal characteristics influencing foraging include gastro-intestinal tract type, feeding type and mouth size (Van Soest 1996). To our knowledge, the relationship between these foraging traits and how they shape an animal s perception of spatial heterogeneity have not been studied before. Because body mass and gut size increase allometrically and metabolic requirements scale with body mass to the power 0.75 (Kleiber 1932, Prins & van Langevelde 2008), it is commonly accepted that where forage quantity is limiting small animals outperform larger ones, but larger species do better on low quality feeding sites (Bell 1971, Jarman 1974). Ritchie and Olff (1999) predicted that larger species perceive and use less spatial detail of heterogeneously distributed resources than do smaller animals. We therefore expect that smaller animals will select areas of high nutrient concentration at smaller spatial scales than larger animals. We further predict that body mass will be positively related to the size of selected patches, so that large animals will occur more frequently at larger patches than small ones. The influence of differences in gastro-intestinal tract type on foraging behaviour has been well-studied (Bell 1971; Foose 1982; Demment & Van Soest 1985; Gordon & Illius 1988; Illius & Gordon 1992 & 1994). Most of these studies suggest that forage quality is more important than quantity to the ruminant digestive system as the throughput rate in ruminants is limited by the digestive process. In contrast, animals with monogastric digestive systems can increase their intake to compensate for the low nutrient content as long as the quantity of the forage is sufficient. Because ruminants need higher quality with every bite, we expect them to select areas of high nutrient concentration at a small spatial scale. Monogastric animals can get more nutrients by consuming more food and we thus expect them to choose areas with high total nutrient content at larger spatial scales even though local nutrient concentration at these scales might be low. According to Clutton-Brock and Harvey (1983) intake rate is controlled by bite rate, incisor morphology and mouth dimensions. Although some studies suggest that animals with very large mouths can sustain their nutrient requirements by taking large bites in spots with low biomass but high quality (Owen-Smith 1988), it is generally accepted that animals with small mouths are capable of feeding more selectively than animals with larger mouths 42
53 (Jarman 1974). Small-mouthed animals do not have to increase bite quality as much as large mouthed animals, because small-mouthed animals are able to select high quality bites. Therefore, we predict that small-mouthed animals, in order to obtain more nutrients over time, will select areas with high nutrient content at larger spatial scales. In contrast, large-mouthed animals with an equal body mass will be forced to select areas with high nutrient content at small scales to increase the quality of their bites. We also expect that the size of the herd in which the herbivores forage determine their response to the spatial scale at which nutrients are distributed. From studies up to date, the general understanding is that herd size tends to increase with habitat openness, although the underlying mechanisms for this selection are still unclear (Estes 1974, Pays et al. 2007). Beauchamp (2005) found that group foragers obtained food at a lower rate than solitary foragers, because of the increased cost associated with searching for new food patches. Living in a herd can also increase the costs associated with exploitative or interference competition (Smallegange et al. 2006), but this could be compensated for by the benefits derived from reduced individual vigilance behaviour and information sharing of high quality patches (Prins 1989). Because of interference competition and the increased resource depletion risk for individuals within a herd, we predict that animals occurring in large herds will select areas of high nutrient concentration at a small spatial scale, whereas solitary animals can afford to sacrifice selecting high nutrient areas at small scales in order to obtain higher total nutrient loads at larger scales. We further predict that herd size will be positively related to patch size so that animals living in large herds will occur more at larger patches than small ones. To test these predictions, we experimentally manipulated the spatial distribution of nutrients in a large fertilization experiment (30 ha) under open field conditions. This is a rare but powerful approach, which allows for the manipulation of one environmental variable (e.g., soil nutrients) at a variety of spatial scales (Ball, Danell & Sunesson 2000). We used fertilizers to increase forage quality and quantity and measured differences in visitation frequency and grass utilization by the various herbivore species at our study site. Methods In December 2004 and 2006 we fertilized thirty 50 m x 50 m plots in the Timbavati Private Nature Reserve (TPNR), South Africa ( ,760 S; ,184 E) with NPK (3:2:1) fertilizer. The study area was dominated by Colosphermum mopane shrub veld but also included trees such as Combretum apiculatum. The herbaceous layer was dominated by Urochloa mosambisencis and Bothriochloa spp. (for a full description of the vegetation see Van der Waal 2008, unpublished). The rainy and warm season stretched from October to March. Data was collected from October 2005 to January During the study period the mean annual rainfall was 420 mm. 43

54 At the study site, surface water was available within half a kilometre north and south from the closest experimental plot. The experimental layout followed a randomized block design including three replicates of seven different treatments and nine controls. One control was allotted to each scale treatment and replicated three times. The fertilizer was applied at each 50 m x 50 m plot across either one of three different surface areas (50 x 50 m; N = 1), (10 x 10 m ; N = 10), (2 x 2 m ; N = 25) and at either one of three different nitrogen concentrations (30.0 g/m 2, 6.0 g/m 2, 1.2 g/m 2 ). This resulted in seven combinations (Figure 4.1), as the lightest fertilizer concentrations with a signal too faint to pickup, and heaviest fertilizer concentrations with a risk of a toxic effect were excluded. Figure 4.1: Experimental plot layout and NPK fertilizer treatment. The values in the white cells represent the local nitrogen concentration, calculated from the total nitrogen per experimental plot divided by the product of fertilized patch size and number of patches per plot. 44
55 Fences between the TPNR and the Kruger National Park were removed in 1995, allowing free movement of animals across borders. Large herbivore species commonly found in the area include elephant (Loxodonta africana), buffalo (Syncerus caffer), impala (Aepyceros melampus), warthog (Phacochoerus aethiopicus), duiker (Sylvicapra grimmia), zebra (Equus burchellii) and steenbok (Raphicerus campestris), whilst predators include lion (Panthera leo), spotted hyena, (Crocuta crocuta) and leopard (Panthera pardus). Due to their low abundance at the experimental plots, data for kudu (Tragelaphus strepsiceros) and giraffe (Giraffa camelopardalis) was not used for individual species analysis. Sporadic visitors such as, waterbuck (Kobus ellipsiprymnus), wildebeest (Connochaetes taurinus) and white rhinoceros (Cerathorium simum) were excluded from all analysis. Spoor counts A total of eight 1 m x 10 m spoor plots were laid out around each experimental plot (two plots 10 m apart along each of the four sides of the 50 m x 50 m experimental plot). Two replicates of spoor counts were conducted consecutively every three months at all plots. Because spoors of elephant and small animals like duikers were found to become unrecognizable after two weeks, a ten-day interval was used between raking plots and counting spoor. Dung counts Total dung counts were conducted in each experimental plot every three months. Dung was marked at each repetitive count with different coloured stones (2 4 cm in diameter) to determine the degradation rate and spotting accuracy. The probability of dung detection was calculated by dividing the number of previously marked dung piles re-spotted at the current count with the number of dung piles known to be marked during the previous count. Stones used for marking dung were picked up and dung counted as degraded if there was no dung left at a stone dung marker. The dung degradation over time was calculated by dividing the number of degraded dung piles by the total number of marked dung piles of the same age. Ten sets of spoor and eight sets of dung counts were conducted between October 2005 and January For the analysis, each dung and spoor count at each plot represented the abundance of each animal species per 50 m x 50 m plot. Grass utilization and herbaceous above ground biomass Herbaceous above ground biomass was measured using a calibrated disc pasture meter (Zambatis et al. 2006). Nine parallel transects were laid out in each 50 m x 50 m plot. The biomass, utilization and dominant species were recorded at 11 points along each transect in a 0.5 m x 0.5 m quadrate for both the wet and dry seasons of 2006 and Utilization was indexed according to the eight-point Walker scale, where a score of zero represented no utilization and seven removals of 100% of the standing crop (Walker 1976). Herd sizes for each species in the analysis were obtained from aerial game counts conducted by the TPNR in 2003 and 2004, as well as from road censuses conducted around 45
56 the experimental area in Because elephant and rhinos do not have lower incisors we used muzzle circumference as measure of mouth size. Muzzle circumferences were measured from fresh carcasses of hunts conducted in the northern parts of South Africa between 2006 and Muzzle circumference of elephants was measured in the same way as for other species. This measurement is probably an overestimate because elephants feed more with the tips of their trunks, which has a smaller circumference. Body mass for each species was calculated as the average value between adult male and female weights obtained from literature (Skinner & Smithers 1990; Estes 1991; Nowak 1991 and Kingdon 1997). Metabolic weight was calculated as BM Data analysis As spoor and dung were only measured at the entire 50 m x 50 m extent of an experimental plot the only scales that could be analysed was nutrient concentrations at the smallest local scale and total nutrient concentration at the 50m x 50m scale. For this reason and because nutrient concentrations were heterogeneous within a plot when using a 10m x10m grain size, analysis at scales with 10m x 10m grain size were not possible (Figure 4.2). Therefore, patch size was seen as an emerging property which allowed animals to select for larger nutrient rich areas beyond the effects of local small scale nutrient concentration. Local nutrient concentration was calculated as the amount of nitrogen that was applied per m 2 of fertilized area. An increase in this resulted in an increase in both local forage quality and quantity. Local nutrient concentration multiplied by the accumulated size of all sub-plots fertilized within an experimental plot equalled the total nutrient load. Therefore, total nutrient load (kg N) is calculated from the total amount of fertilizer that was applied per 50 m x 50 m experimental plot. For example, in figure 1, total nutrient load and local nutrient concentration increase vertically along the table if patch size is kept constant, whereas if total nutrient load is kept constant, local nutrient concentration decreases as patch size increases, moving horizontally across the table. When animal abundance increased with total nutrient load, it was interpreted as selection of areas with high nutrient concentration at a large spatial scale (50 m x 50 m). When animal abundance increased as local nutrient concentrations increased, it was interpreted as selection of areas with high nutrient concentrations at a small spatial scale. For analyzing dung degradation and detection probability, data were tested for normality using the Kolmogorov-Smirnov test. If data were not normally distributed after transformation, non-parametric tests were used. Because non-parametric tests showed that dung detection probability was significantly different between the months in which dung was counted, we could not use survival analysis for analyzing dung degradation (Kruskal-Wallis: chi-square=21.253, d=6, p=0.002). In stead, only dung piles with an age 1 year were used in a univariate analysis to test for differences in the rate of dung degradation between species. 46


57 Figure 4.2: An illustration of the effect of spatial scale at three different grain sizes on nutrient concentration as could be perceived by a herbivore at each of the seven plot treatments. 47
58 We found that differences between dung degradation rates of animal species were small, and no significant difference could be found between species (Tukey: p=0.272, df=9). Therefore, we did not have to correct for the number of dung piles for further interspecies comparisons. Our hypothesis testing was carried out in R with dung or spoor density as dependent variables. A generalized linear model (GLM) with a negative binomial error distribution was used, as over dispersion of the data was detected under the assumption of a Poisson distribution (White 1996). Independent treatment factors in this GLM were local nutrient concentration, patch size and total nutrient load. For analysis of animal characteristics, gastrointestinal tract type, body-, mouth- and herd size were added independently. All interactions between and within independent treatment factors and independent animal characteristics were included in the model. In the analysis, we corrected for distance from the closest water point, grass biomass and plot distance from the mid point of the experiment. The selection between the different candidate models was carried out by comparing their AIC values. Results Dung and spoor counts both increased with increasing grass utilization, showing that the abundance of dung and spoor served as good indicators for actual vegetation consumption (GLM dung: Z=2.094, p=0.036; GLM spoor: Z=3.93, p<0.001). Duiker, warthog and elephant abundance increased significantly as total nutrients/ 2500 m 2 plot increased (Figure 4.3, Table 4.1) indicating that these animals select areas of high nutrient concentration at the largest spatial scales. Buffalo, zebra and impala abundance increased significantly with local nutrient concentration and buffalo numbers further increased with increasing patch size (Figure 4.3, Table 4.1). Steenbok did not show any preference for any of the treatments possibly because both males and females are territorial causing dung and spoor to occur equally throughout all plots. 48
59 Table 4.1 Significant results from generalized linear models on the abundance of herbivores as indicated by dung and spoor in response to changes in local nutrient concentration, patch size and total nutrient loads Animal Species Body Mass (kg) Metabolic Weight (kg) Herd Size Mouth Size (circumference, cm) Type Feeder Gastro-intestinal Tract Type Local Nutrient Total Patch Size Concentration Nutrients/ (m 2 ) (g/m 2 ) 2500m 2 plot Dung Spoor Dung Spoor Dung Spoor Steenbok Browser Ruminant Duiker Browser Ruminant + Impala Mixed Ruminant + Warthog Grazer Monogastric _ ++ Kudu Browser Ruminant Zebra Grazer Monogastric Buffalo Grazer Ruminant Giraffe Browser Ruminant Elephant Mixed Monogastric ++ ( + indicates a positive relationship at 95% significance, ++ positive at 99% and - negative at 95%; empty cells had either no prediction or no significant relationship; N=24) 49

60 Figure 4.3: Responses of elephant, buffalo, warthog and impala to different fertilizer treatments as measured from dung and spoor counts (N=66). 50
61 Larger animals occurred more at plots with higher total nutrient loads and smaller animals more at low total nutrient loads (Z=2.360, p=0.018; Table 4.2) supporting our hypothesis that larger animals select areas with high nutrient content at larger scales. Ruminant animal numbers decreased as total nutrient loads increased, but increased as local nutrient concentrations increased, indicating that these animals select areas of high nutrient concentration at the smallest spatial scales (Z=-3.920, p<0.001). Contrary to expectations large-mouthed animals selected areas with high nutrient concentrations at larger spatial scales than small-mouthed animals (Z=2.384, p=0.017). Herd size increased with increasing local nutrient concentration (Z=3.134, p=0.002) and patch size (Z=2.290, p=0.022) but decreased with increasing total nutrient loads (Z=-4.036, p<0.001). Table 4.2 Predicted and observed significant results from generalized linear models on dung counts showing how species characteristics such as digestive system type, metabolic weight, mouth size and herd size determine selection of experimental plots with different patch sizes, local nutrient concentrations and total nutrient loads Local Nutrient Concentration (g/m 2 ) Patch Size (m 2 ) Total Nutrients/ 2500m 2 plot Animal Characteristic Predicted Observed Predicted Observed Predicted Observed Metabolic Weight Ruminants Mouth Size Herd Size ( + indicates a positive relationship at 95% significance, ++ positive at 99%, +++ significance above 99% and - negative significance; empty cells had either no prediction or no significant relationship; N=24) 51
62 Discussion We assessed how herbivores respond to changes in nutrient heterogeneity and at what spatial scale a herbivore with a particular mouth, herd and body mass, will select areas with higher nutrient concentrations. Our results showed that larger animals selected areas of high nutrient concentration at larger spatial scales by selecting plots with higher total nutrient loads than smaller animals. Body mass has been linked with the spatial scale of resources to explain the co-existence of species by predicting that larger species perceive and use less spatial detail of heterogeneously distributed resources (Ritchie & Olff 1999). Field experiments, however, contradicted this hypothesis and found that smaller species, such as warthog and impala, selected for larger patches (Cromsigt & Olff 2006). Although we could not find any relationship of body mass with patch size for the total herbivore assemblage at our experimental plots, buffalo and zebra selected for larger patches compared to warthog, which is in agreement with Ritchie and Olff s (1999) original hypothesis. It is possible that Cromsigt and Olff (2006) could not detect selection of larger patches by buffalo, because the patch sizes in their study only ranged from 1-64 m 2 compared to m 2 in our study. In a patch selection experiment with steers, WallisDeVries, Laca and Demment (1999) found that in a fine-grained environment (2 x 2 m), where patch size is equivalent to an animal s body length, the cost of frequently turning to find the most profitable patch becomes too high. They concluded that large herbivores would avoid small patches and concentrate on the larger ones where foraging costs are low, such as found for buffalo and zebra in our study. Large-mouthed animals, as like large-bodied animals, selected areas of high nutrient concentration at large scales. This contradicted what we predicted. Although mouth size has been found to be highly correlated with body mass (Hanley 1982), large extremes exists in mouth to body mass ratios (Pretorius 2008, unpublished). Arsenault and Owen-Smith (2008) found that the scaling of mouth width relative to body mass might be the main factor governing grass height selection, rather than body mass alone. When looking at the mouth to body mass ratios of individual species in our experiment we found that both extremes, i.e., small animals with large relative mouth sizes, like duiker and warthog, and large animals with small relative mouth sizes, like elephant, selected areas of high nutrient concentration at larger spatial scales. A large mouth to body mass ratio together with high metabolic requirements of a small animal will make it very difficult to select foods at a small scale that will deliver a bite that is rich enough in energy. The best option would thus be to select to have more bites and more nutrients available at larger spatial scales, even though the nutrients may be more diluted, rather than to have less bites of higher quality at the small local scale. All the larger, herd living animals in our experiment had intermediate mouth to body mass ratios and intermediate absolute mouth sizes. Under these conditions, selection of high nutrient areas at larger scales 52
63 becomes difficult. The larger number of animals in a herd forces an individual to select the patch that satisfy its most important immediate requirements before the food gets depleted by other herd members. Thus, every bite counts and as expected we found herd animals to select areas of high nutrient concentration at a small local scale. On top of this scale selection, herds further preferred larger patches. This is in agreement with a study conducted by Hester et al. (1999) who found that solitary sheep selected smaller patches than red deer that foraged in small groups, possibly due to the increased absolute forage requirements of a larger number of animals. Following the results of the individual species analysis, we developed a conceptual model from our data. The model (Figure 4.4) illustrates how mouth to body mass ratios can divide herbivores into two groups: (a) animals with extreme mouth to body mass ratios (either small, such as elephant or large such as duikers) that select high nutrient areas at large scales, and (b) herd animals with intermediate mouth to body mass ratios that select high nutrient areas at small scales. An animal with a small mouth to body mass ratio that do not have to increase bite quality but has a large absolute forage intake requirement will be better of maximizing the total amount of nutrients gained at large scales. Although animals like elephant also live in herds, their small mouth to body ratios may override the herd effect, allowing them to select areas of high nutrient concentration at larger scales. Stokke (1999) found elephant family units to discriminate between patches in their surroundings, and to select patches offering the highest density of palatable species. Small animals, like duiker, on the other hand will not be able to herd together in great numbers, as a small absolute mouth size with increased absolute forage requirements for the herd, will force individuals to select high nutrient areas at a small local scale. This will mean that individuals will not be able to meet their relatively high metabolic requirements with a large mouth to body mass ratio. In a snow melting experiment using 2 x 2 m plots, Svalbard reindeer (Rangifer tarandus platyrhynchus) was found to select plots of highest plant biomass rather than of highest plant quality, and thereby maximized both the total amount of nitrogen and energy uptake simultaneously (Van der Wal et al. 2000). These results are consistent with our findings of small animals with large mouth to body mass ratios selecting combinations of patch sizes and local nutrient concentrations that yielded the highest total nutrients at larger scales. The Svalbard reindeer has an average group size of 2.2 (Alendal, de Bie & van Wieren 1979), weighs 5.8 kg with an incisor width of 2.41 cm (Mathiesen et al. 2000) which, compared to the duiker weighing 16 kg (Skinner & Smithers 1990) with an incisor width of 2 cm, yields an even larger mouth to body mass ratio. Soay sheep (Ovis aries) have been found to be more efficient at exploiting clustered patches with a high energy reward than a matrix of homogeneously distributed patches of lower local energy reward, consistent with our findings for impala (Pérez-Barbería, Walker & Marion 2007). 53
64 Soay sheep weighs 23 kg on average and has a muzzle width of 6 cm similar to the 5.7 cm mouth width of impala (Pérez-Barbería et al. 2007). Although the body mass of Soay sheep is closer to a 16 kg duiker than to a 49 kg impala, sheep, like impala tend to herd together in larger numbers, which increases the total metabolic weight and absolute nutrient requirements of the herd. Figure 4.4: A conceptual model demonstrating how the relationship between mouth to body mass ratio and total metabolic weight of the herd determines the scale at which nutrient rich areas is selected. Circles indicate small scale nutrient maximizers and diamonds, large scale nutrient maximizers. Black dots represent animals with significant results in our analysis; grey, individuals with small sample sizes and white, rare visitors to the experiment (1=steenbok, 2=duiker, 3=warthog, 4=impala, 5=kudu, 6=wildebeest, 7=waterbuck, 8=zebra, 9=giraffe, 10=white rhinoceros, 11=elephant, 12=buffalo). 54
65 Between white rhinoceros, zebra, warthog and impala, Cromsigt and Olff (2006) found only warthog to respond significantly to both fertilizer and mowing induced increases in nutrient availability and patch size. This combination of mowing, fertilizing and increasing patch size yielded the maximum total nutrient load per plot and supports our finding for warthog selecting areas with the highest nutrient concentration at larger scales, whereas zebra and impala do so at smaller scales. Warthog has an extreme mouth to body mass ratio compared to herd species like impala and zebra, which have medium mouth to body mass. Although white rhinoceros only visited our plots sporadically and could not be included in the analysis, we predict that with a body mass of 1600 kg and a muzzle circumference of 96 cm, a white rhinoceros will maximize nutrient intake at the same scale as a warthog (Figure 4). In accordance with our hypothesis, ruminant animals selected nutrient rich areas at small scales, although non-ruminants varied in their response. When looking at our results of individual species however, no clear pattern emerges for predicting the scale at which animals with different digestive systems select areas of high nutrient concentration. Duiker, warthog and elephant, which all selected areas at larger scales, have different digestive systems and feed on different food types. What these animals have in common is their extreme mouth to body mass ratios. Small-scale selectors like buffalo, impala and zebra on the other hand also differ in their digestive systems and type of food they eat, but tend to herd together and have medium mouth to body mass ratios. Evidence on the spatial scales at which nutrient intake is being maximized for different animal species is rare. We suggest that, at the scale we measured, large mammalian herbivores select areas with the highest nutrient concentrations at either the local scale or at the larger 2500 m 2 plot scale depending on a combination of their body, mouth and herd sizes. Our results provide valuable foraging selection criteria for large herbivores, which can be incorporated into models that predict species distribution at larger scales. 55
66 56


67 CHAPTER 5 DIET SELECTION OF AFRICAN ELEPHANT OVER TIME SHOWS CHANGING OPTIMIZATION CURRENCY Y. Pretorius, J.D. Stigter, W. F. de Boer, S.E. van Wieren, C.B. de Jong, H.J. de Knegt, C.C. Grant, I. Heitkönig, N. Knox, E. Kohi, E. Mwakiwa, M.J.S. Peel, A.K. Skidmore, R. Slotow, C. van der Waal, F. van Langevelde, H.H.T. Prins. 57
68 Abstract Multiple factors determine diet selection of herbivores. However, in many diet studies selection of single nutrients is studied or optimization models are developed using only one currency. In this paper, we use linear programming to explain diet selection by African elephant based on plant availability and chemical composition over time. Our results indicate that elephant at our study area maximized intake of phosphorus throughout the year, possibly in response to the deficiency of this nutrient in the region. After adjusting the model to incorporate the effects of this deficiency, elephant were found to maximize nitrogen intake during the wet season and energy during the dry season. We reason that the increased energy requirements during the dry season can be explained by the changes in water availability and forage abundance in the environment. As forage abundance decrease into the dry season, elephant struggle to satisfy their large absolute food requirements. Adding to this restriction is the simultaneous decrease in plant and surface water availability, which force the elephant to seek out scarce surface water sources at high energy costs. During the wet season when food becomes more abundant and energy requirements are satisfied easier, elephant aim to maximize nitrogen intake for growth and reproduction. Keywords: linear programming, elephant diets, nitrogen maximization, phosphorous deficiency 58
69 Introduction How abundant does a plant species need to be and what nutrient content does it have to have in order to be included in a free ranging herbivore s diet? Theoretically, this depends on the physiological and morphological forage adaptations and nutrient requirements of the animal, which in turn depend on the animal s body mass, life history stage and current nutritional status (Hanley 1997, Shipley et al.1999, Brown et al. 2004). However, due to the difficulty in determining these parameters, the theoretical considerations are hardly supported by field data. Scientific knowledge on nutrition of large herbivores mostly comes from studies on livestock under controlled conditions (Robbins 1993). Whereas the animal s ideal diet is in the hands of the nutritionist in agriculture, what wild herbivores eat is a result of natural selection and adaption to the environment. The challenge is not only to determine the nutrient requirements of wild animals but also to understand how animals compile their own ideal diets. From studies in biochemistry and physiology, we know that some macro minerals such as, sodium (Na), phosphorous (P), nitrogen (N), potassium (K), magnesium (Mg), calcium (Ca) and carbon (C) are essential to animals (McDonald et al. 1995). Phosphorous, Mg and Ca can readily be stored in bone whereas K and Na are not stored to a great extent in animal tissue. Although K is generally readily available from plants (Robbins 1993), Na, like P and N, often occurs at low levels in plants in southern Africa (du Toit et al. 1940, Weir 1969, Snyman 2002). Carbon based energy rich compounds can be stored as fat, but energy constantly needs to be replenished to sustain metabolic demands (Brown et al. 2004). Nitrogen forms the building blocks of muscle, it has a high turn-over rate leading to endogenous losses that need to be replenished on a daily basis and it can also serve as a less efficient source of energy (McDonald et al. 1995). Adding to the complexity of the multiple nutrients that need to be selected for in the wild is the presence of chemical deterrents such as condensed tannins in plants that negatively affect the ability of an animal to digest nutrients (Robbins et al. 1987). In this paper, we aim to provide a mechanistic framework for plant selection by a wild animal based on plant availability, nutrient and deterrent content. Nutrients are assumed to be selected for based on their availability in the environment in relation to the animal s nutrient requirements (Hengeveld et al. 2009). To emphasize the trade-offs between plant quality and quantity we chose to study the largest terrestrial mammalian herbivore, the African elephant (Loxodonta africana). Some experimental studies on elephant nutrition have been conducted in zoos (Clauss et al. 2003a & 2005). However, most conventional studies in the wild are descriptive and case sensitive as nutrient selection is determined using consumption rates of plant species high in a specific nutrient in relation to its availability in the environment. From these studies elephant have been shown to select for calcium (Greyling 2004, Stokke 1999), sodium and nitrogen (Jachmann & Bell 1985). Because no clear evidence exists for the 59
70 selection of only one currency by elephant, we will test several postulated hypotheses to see which nutrient selection strategies best fit the observed diets. Due to the enormous size of an elephant, its absolute forage requirements are very high. Since the Pleistocene, the morphological and behavioural forage adaptations of the elephant s ancestors have closely followed changes in the abundance of forage on earth (Hofmann & Stewart 1972, Ehleringer et al. 1997, Cerling 1998). As elephant are sometimes classified as non-selective bulk feeders (van Soest 1981) and have the largest daily intake of all terrestrial herbivores, the best null model would be to expect that modern day elephant randomly include plant species in their diet, i.e., according to availability. Alternatively, we can argue that an elephants high absolute energy requirements will hamper the animal from not only consuming too many rare plants that will cost more energy to find, but will also force the animal to select plants of higher quality and digestibility so that energy intake can be maximized. If this is the case, we can expect elephant to maximize energy intake by including the most abundant plant species with the highest metabolizable energy value in their diet. Besides energy maximization being used as the ultimate model for explaining plant selection, there is growing support for models satisfying requirements of multiple nutrients (Yearsley et al. 2001). Raubenheimer and Simpson (1993, 1997 & 1999) found that insects could adjust the amounts of food ingested from different food sources in order to keep the balance between different nutrients, and consistently reach the same target, i.e. their daily nutrient requirements. In the wild, animals also need to aim to reach targets of nutrient requirements for maintenance, growth, mobility and reproduction. As an alternative foraging strategy, we expect elephant to select the combination of plants in the diet that will yield nutrients that is as close to the minimum requirement for each macronutrient as possible. Recently, Ludwig et al. (2008) and Treydte et al. (2009) demonstrated, using linear programming models, how grazing ungulates can meet their daily nutrient requirements by consuming the right combinations of grass from under tree canopies and in open grasslands before reaching their maximum intake as determined by grass fibre concentrations. Even though these studies took a multi-nutrient objective approach to understand how an animal satisfies its requirements, they did not consider variation in availability of different plant species. Although linear programming models have been used in foraging ecology for a long time (Westoby 1974, Belovsky 1978), they stand under criticism because of the sensitivity of the model s parameters (Huggard 1994; Yearsley et al. 2001). In calculating diets for the current study, we not only specified dietary constraints but also included goal functions to define foraging strategies. The foraging strategies used included before mentioned predictions as well as alternative strategies such as maximization of N, P, Ca and Na intake, and minimization of condensed tannin intake. The deviation between the nutrient content of 60
71 observed and predicted diets, calculated from linear programming models, is used as a relative measurement to test the hypotheses on diet choices. Methods The study was conducted in the northern parts of the Timbavati- and the Umbabat Private Nature Reserves, South Africa ( ,760 S; ,184 E) between December 2005 and A homogeneous layer of Colophospermum mopane shrubveld on granite soils dominates the area. The rainfall season normally extends from October to March and during the wet season of 2005/2006 it rained 427 mm and of 2006/ mm. At the beginning of the study, thirteen plant species were selected and their leaf biomass and chemical composition measured over a period of two years. These species represented forage available for elephant to choose a daily diet from and their selection was based on their abundance within the study area and on preliminary forage observations on herbivores in the field and from literature (Stokke 1999; Greyling 2004). Tree species selected for measurement consisted of the six most common and frequently utilized browse species including, Colophospermum mopane, Grewia monticola, Acacia nigrescens, Combretum apiculatum, Lannea schweinfurthii, and Dichrostachys cinerea and the rare but well utilized browse species Maerua parvifolia. Herbaceous species selected for measurement consisted of the three most common and frequently utilized grass species Panicum maximum, Digitaria eriantha and Urochloa mosambicensis, the rare but well utilized annual grass species Brachiaria deflexa, a common herb (Indigofera spp.) and a rare and frequently utilized herb (Cyperaceae spp.). The study was divided into five periods at three-month intervals stretching over a wet-, late wet/early dry- and dry season and two late dry/early wet seasons. The total nutrient content of observed and predicted diets, compiled from the available thirteen plant species, were calculated for each period using the following variables: Plant structural characteristics Nine monitoring sites were randomly selected throughout the study area in vegetation typically representative of the dominant Colophospermum mopane shrubveld. At each site, the area used for sampling was about 10 ha in size. Leaf cover and biomass measurements of the thirteen selected plant species were conducted every month at all nine sites and the data pooled at three-month intervals. For trees, intra-plant species distance, height, canopy height, maximum canopy diameter and perpendicular canopy diameter of each species were determined at the beginning of the study using the Point Centre Quadrate (PCQ) method (Mueller-Dombois & Ellenberg 1974). This entailed recording the distance to the closest species and to the selected tree species in each of the four quadrates at 20m intervals along a 100m transect at each of the nine study sites. For each of the seven selected tree species at these PCQ transects, we calculated available browse volume per tree according to the 61
72 Biomass Estimates from Canopy VOLume (BECVOL) method (Smit 1996). To determine the intra-plant species distance and ground biomass of herbaceous species the Dry-weight-rank (Dekker et al. 2001) and Comparative Yield methods (Haydack & Shaw 1975) were used and repeated at monthly intervals along the transects at each of the nine study sites. Along with herbaceous biomass estimations in 0.5 m x 0.5 m x 0.5 m metal frames at each site each month, a representative sample of each selected browse, herb and grass species was cut in the same size frame resulting in nine frame cut samples per species per month. These samples were dried at 70 C for 24h, the leaf material separated from the stem and weighed. For each grass and herb species, the average leaf mass per frame for each period was weighted. For each browse species, the average leaf mass determined for each species per frame was used along with the available browse volume estimates from BECVOL to calculate the total available leaf mass per tree per period. Leaf nutrient and deterrent content of plant species The dried leaf samples collected each month per frame for each of the thirteen plant species were pooled per species at a three monthly interval and milled through a 1 mm sieve. Quality of the leaf samples were determined at the laboratory of the Resource Ecology Group (Wageningen University, the Netherlands) through analysis of the macronutrients N, P, Ca, Na, K, Mg and deterrents including acid detergent fibre (ADF), acid detergent lignin (ADL) and condensed tannins. Dry matter content was determined by drying the samples for 8h at 70 C. Total N, Ca, Mg, Na, K and P content were measured with a Skalar San-plus auto analyzer, after destruction with a mixture of H 2 SO 4, Selenium and salicylic acid (Novozamsky et al. 1983). Condensed tannins content were measured using the Proanthocyanidin method (Waterman & Mole 1994) and ADF content by using an ANKOM Fibre Analyzer followed by treatment with 72 % H 2 SO 4 and ignition at 525 C for 3h to determine ADL. Metabolizable energy content of forage Intake of elephant on a dry matter basis has been estimated by Owen-Smith (1988) to be between 1 and 2 % of body weight. We assumed 1.5 % intake of body mass for a 3500 kg elephant, which equates to 53 kg dry matter per day. Metabolizable energy values of plant species were calculated from gross energy values from literature, taking into account forage digestibility and estimated methane and urine energy loss. Digestibility of food measured in zoos range from 22 % to 36 % (Rees 1982, Pendlebury 2005) and in the wild from 30 % to 45 % (Owen-Smith 1988, Meissner et al. 1990). To determine digestible energy values of individual plant species from their ADF content, a regression equation was calculated for digestibility of ADF from the ADF content of food (Digested ADF = 6.665e (ADF diet), R 2 =0.87, N=8) and of digestible energy from digested ADF (Digested energy = 64.85*Digested ADF , R 2 =0.6, N=8) using data from feeding trials of elephant in zoos 62
73 conducted by Benedict (1936), Ulrey et al. (1979), Tomat (1999), Foose (1982), Rees (1982) and Clauss (2003a). Gross energy values for plants do not vary much and generally range between 16.8 kj/g and 21 kj/g (Robbins 1993). Values for Panicum and Brachiaria species, for example, have been estimated at 16.8 kj/g in (Tiemann 2008, Adu & Adamu 1982) and for Colosphermum mopane between 18.5 kj/g to 20.4 kj/g (Styles & Skinner 1997, 2000). We used an 18 kj/g gross energy content for grass species and 20 kj/g for browse and herb species. Dry matter digestibility was calculated from digested energy values as explained above (Digested energy = 0.984*DM digestibility , R 2 =0.92, N=8). These dry matter digestibility values for each plant species were then compared with values presented by Meissner et al. (1990) to estimate urine and methane energy loss. Metabolizable energy content of each plant species (ME) was calculated as follows: ME = Gross Energy x Digestible Energy Methane & Urinary Energy Loss (MJ/kg) (MJ/kg) (%) (MJ/kg) Nutrient requirement estimation Most research on animal s nutritional requirements has been undertaken using animals in the agriculture industry such as cattle and pigs. Consequently, extrapolated values from feeding trails on these livestock species under controlled environments were applied to wild species. The problem with this method is that little is known about the scaling of requirements for different nutrients in relation to body mass. For example, a linear extrapolation of requirements for an element like copper, which is the technique most commonly used, from a horse to an elephant, have led to fatalities (Rucker 2007). We used a combination of extrapolations from values stipulated by the Agriculture Research Council (ARC 1989) for horses, zoo studies and studies in the wild on elephant to compile a set of minimum and average daily nutrient requirements for an adult elephant (Table 5.1). It is generally accepted that energy scales with a factor of 0.75 to body mass (Kleiber 1932, Prins & van Langevelde). Daily energy requirements were calculated from equations obtained from Taylor et al. (1982), Robbins (1993) and Prins & van Langevelde (2008) so that daily basal metabolic energy requirements (Ebmr) equals: Ebmr (kj /day) = 293 x BW 0.75 For a 3500 kg elephant this would be kj/day. Energy expenditure for foraging (Ef) is: Ef = 0.54 x Ebmr, which for an elephant equals kj. Energy for standing (Es) is: Es = 0.2 x Ebmr, which for an elephant equals kj. Thus requirements for basal metabolic rate, standing and foraging for a 3500 kg elephant equal 232 MJ/day. This amount excludes energy required 63
74 for walking to find food, which will vary depending on the availability of food. The energy expenditure per km of walking per unit mass (Ew) is: Ew =10.75 x BW The energy expenditure per day (Ebw) including moving over a certain distance (D) and feeding is: Ebw = Ebmr + (Ew x D x BW) + Ef + Es Where D is the distance travelled in km (adjusted from Prins & van Langevelde 2007). The average distance walked per day over a two-year period for 30 different collared elephants at our study area was 8.3 km. Therefore, the energy expenditure for an elephant of 3500 kg per day for walking, standing and feeding is estimated at 258 MJ. However, this value excludes energy required for digestion and assumes that the elephant is moving across a flat landscape. Alternatively Robbins (1993) suggests that free-ranging terrestrial eutherians that are not actively breeding have daily energy expenditures of 2.3 times basal metabolic rate, which amounts to 307 MJ for the elephant. From field studies on elephant, Meissner (1982) calculated the metabolizable energy requirements of a fifty year old bull of 3700 kg to be 310 MJ, close to our calculated value, while Owen-Smith (1988) estimated energy requirements of a female elephant at 259 MJ. As energy requirements estimated for elephant vary in literature, we replicated calculation of predicted diets three times using the following energy values: 258 MJ, 280 MJ and 307 MJ Plant species composition of observed diets Leaves from the thirteen measured plant species were sampled for an epidermis reference collection. Plant parts were cleared in household bleach for 24 h and washed out in water. Leaf epidermis fragments were stripped off and mounted in glycerol on slides. Photographs of these slides were used to identify the epidermis and cuticle fragments present in the faeces (De Jong et al. 2004). Every month ten fresh (less than 12 h old) adult elephant faecal samples were collected throughout the study area. Samples were pooled together at three month intervals. Each pooled sample was analysed individually. Samples were heated in a pressure cooker from C in water for at least 2 h and left to soak overnight. In order to separate inner tissue from epidermis and cuticle, a 5 g subsample was washed in a blender with tap water, strained first over a 1.5 mm sieve to eliminate course fibre, then over a plankton sieve (0.01 mm), and stored in 70 % ethanol (De Jong et al. 2004). The subsample was transferred into a Petri dish and allowed to settle. Ten random grab samples of the residue were taken with a Pasteur pipette. Each droplet was put on a glass slide, spread out evenly and covered with a cover slip. On each slide, ten epidermis fragments were identified using the reference material and their surface areas measured through a grid of 0.01 mm 2 squares in the microscopic eyepiece (De Jong et al. 2004). 64
75 The results of the ten grab samples were pooled for every faecal sample. Plant epidermal fragments that could not be identified down to species, genus or family level were categorized as either monocotyledon unidentified or dicotyledon unidentified. The abundance of each forage type and species was represented as a percentage of the total measured fragment area (De Jong et al. 2004). The proportion of each plant species in the observed elephant diets was assumed to be equal to the proportion of fragments of each plant species in the faeces (Stewart 1967). Because >50 % of fragments consisted of the thirteen plant species selected, the percentage of fragments for each of these selected species were extrapolated to calculate a total observed daily diet of 53 kg for each period. Diet calculations For comparison with the observed diets, seven possible foraging strategies were used to calculate predicted diets in MATLAB (Version 6, The MathWorks, Inc.) using linear programming. These strategies included random foraging, energy maximization, nutrient satisficing, nitrogen maximization, phosphorous maximization, calcium maximization, sodium maximization and condensed tannin minimization. The proportions of each plant species that needed to be included in the random diet were equal to the relative abundance of each plant species in the study area. The maximum energy diet was calculated as a 100 % consumption of the most abundant plant species in the environment with the highest metabolizable energy value, which would therefore require the least amount of energy to find. Each of the remaining strategies was defined as the goal function in the linear models and the diets calculated under the constraints that minimum energy, or P, K, Mg, N, Ca and Na requirements, or only energy requirements had to be satisfied. After preliminary tests of the model we realised that predicted diets for the wet season deviated greatly from the observed diets for most nutrients, possibly because animals replenish stores of many of the nutrients during these times of abundance. Because the model calculated only one optimal solution, small changes in some of the specified constraints resulted in completely different diets. We used the deviation of species composition of predicted diets from observed diets to indicate which nutrient constraints were most sensitive. For example, if Colophospermum mopane had high levels of Ca but low levels of P and Ca levels were lower in most of the other species, a small increase in the constraints specified for P would not only increase the chances of mopane being excluded from a diet but also decrease the total Ca gained in a diet. Through sensitivity analysis we determined changes in energy constraints to be the most sensitive. As the exact nutrient requirements of an adult elephant were unknown and to avoid the pitfall of generating constraints from the data, all seven theoretical diets, excluding the random diet, were calculated six times using three different energy values (257 MJ, 280 MJ, 307 MJ) and one of two sets of dietary requirements that were in agreement with literature (Table 5.1: minimum and average). This resulted in 43 65
76 predicted diets in total for each of the observed diets in each of the five periods. Because elephant are known to satisfice their Na requirements from other sources such as soil and water (Holdø et al. 2002), constraints for Na were set to zero. The linear programming technique only allowed one goal function to be specified at any run. As phosphorous was deficient in the area, requirements for P, as specified in the constraints, could not be reached for most of the diets. Therefore, we assumed maximization of P first by setting the constraints to the maximum value of P that could be reached in the study area for a specific period. This value was determined by removing all other nutrient constraints, except minimum energy requirements, and then calculating a diet that maximized P intake. For each diet the nutrient content for each food type (plant species) was multiplied by the proportion of the food type in the diet and summed over all species to yield the total content for each nutrient in the whole diet. The energy gain of each diet was calculated by subtracting the energy spent walking to find each of the plant species in the diet with the metabolizable energy content of each species at the proportions that they occurred in the diet. The energy expenditure for each km of walking per unit mass (Ew) was calculated as: Ew = x BW x Distance to find plant species (km) x BW (adapted from Taylor et al. 1982). Data analysis Plant species and nutrient composition of each predicted diet were viewed as co-ordinates in a species or nutrient space respectively. Therefore, the differences between each predicted diet and the observed diets were calculated as absolute distances, as follows: Diet X i where i = 1,2,3, 37 Nutrients N j where j = 1,2,3, 7 N j But X i = [ N j ] Dev ( X i ) = N P Ca = Na K Mg Energy N j Pr edicted N Observed j 2 j= 1 N Re j quirement N j Requirement = for a 53 kg DM diet
77 The predicted diet with the smallest nutrient deviation from the observed diet was considered to be the strategy followed by the elephant. The same approach was used to determine deviation between species composition of predicted and observed diets by replacing nutrients in the above equation with plant species. Diet X i where i = 1,2,3, 37 Plant species S j where j = 1,2,3, 7 But X i = [ S j ] Dev S j Colophsope rmum Combretum Grewia Acacia Lannea Dichrostac hys = Maerua Urochloa Panicum Digitaria Brachiaria Indigofera Cyperaceae ( X i ) = ( S j Pr edicted S jobserved ) j= 1 Results Predicted diets for the elephant show that at the beginning of the wet season, a diet aimed at maximizing energy intake would force an elephant to only feed on Combretum apiculatum, thereby leading to a deficiency in Na. However, a diet minimizing condensed tannin would mainly consist of grass species like Urochloa mosambiscensis, resulting in a very high Na content but Ca levels below the average requirements (Figure 5.1a). For this period, the predicted diet with the smallest deviation in nutrient composition from the observed diet had a composition where maximum P could be gained under a 280 MJ energy constraint, N was maximized, and average requirements for Mg, K, Na and Ca were satisfied. Towards the end of the wet season the best fit with the observed diet was the same as for the beginning of the wet season but at a lower energy constraint of 257 MJ. 67
78 During the dry season, most of the diets that best fitted the observed diet included more than 75 % Colophospermum mopane. The diet with the smallest deviation included 100 % Colophospermum mopane and maximized energy intake. However, the N content of this diet was below the minimum requirement. The second closest diet maximized energy and P under a 307 MJ energy constraint whilst satisfying minimum requirements for N, Ca, Na, Mg and K (Figure 5.1b). The strategy followed by elephant at the switch between the dry and wet season appeared to be affected by the quantity of the first rains. Between September and October 2006, it had only rained 50 mm whereas 120 mm of rain was recorded for the same period in For the drier period during 2006, elephant appeared to maximize P intake at high energy constraints (307 MJ) whilst satisficing minimum requirements of N, Mg, Na, K and Ca. However, in 2007 during the same period elephant followed a similar strategy as they did for the early wet season by maximizing N intake at energy constraints of 280 MJ. For each period, predicted diets with the smallest deviation from observed diets in terms of nutrient composition also had the smallest deviation in species composition (Figure 5.2). Discussion In this study, we aim to understand the strategy by which elephant compile their daily diets. Our approach is novel in that we considered both the satisficing of multiple nutrients as well as the possibility of maximization of particular nutrients and avoidance of deterrents. We found that elephant at our study area did not feed at random or exclusively maximized intake of a single nutrient. Instead, elephant used a combination of satisfying requirements of some nutrients whilst maximizing intake of others depending on the availability of resources in the environment. As nutrient availability changed over the seasons, the foraging strategy of the elephant also changed to maintain their metabolic requirements. Metabolic rate in heterotrophs equals the rate of respiration, which is the main process that sources energy (Brown et al. 2004). Therefore, when determining the value of a plant species to an animal, not only does the energy content of the plant need to be considered but also the increased respiration and energy cost to find it. This becomes especially important for a large animal with high absolute energy demands, like the elephant. During the dry season, both surface water availability and plant water content decrease. Buffalo have been found to obtain all their water requirements from the plants they eat in the wet season whereas they become more dependent on surface water in the dry season as the water content in plants decrease (Prins 1987). Therefore, during the dry season, the elephant does not only need to reduce searching costs for food so that its net energy gain is still positive, but also to find water. This was clearly illustrated at our study site when elephant increased their energy 68
79 intake in the dry season by consuming more of the most abundant food species Colophospermum mopane. Using surface water demands as an explanation for higher energy demands in the dry season can further be supported by the sodium content of the diet during this time. Elephant have been known to select soils and water sources with high sodium content (Weir 1969, Holdo 2002). As the elephant becomes more dependent on surface water sources to fulfil its water requirements its sodium requirements can simultaneously be satisfied in the same way. In Kruger National Park sodium levels in water averages 280 ppm (Leyland & Witthüser 2008). If an elephant consumes 160 litres of water a day (Guy 1975) it will gain 4.5 % Na, which is much higher than the estimated average requirement of 0.2%. Therefore, the sodium obtained through foraging does not have to be high, which is reflected in our results of the dry season diet. In the wet season, as surface water availability and plant water content and abundance increase, energy restrictions and demands of elephant also decrease. During this period, nutrient reserves are replenished causing requirements for all nutrients to be higher (Parker et al. 2009). Throughout the wet season elephant maximized their nitrogen intake. Nitrogen is the building blocks for structural proteins in an animal s body whereas plants consist more of carbohydrates (Mattson 1980). For this reason, herbivores need to spend a great deal of time eating and processing food to correct for the low ratio of nitrogen to fibre and carbohydrate in their food (White 1978, Mattson 1980). Because utilization of the microbes in the herbivores gut requires digestion by acidic juices in the stomach, pregastric fermenters, like ruminants, can utilize this source of N efficiently, whereas post-gastric fermenters tend to lose this microbial resource in the faeces (Foose 1982). Through digestive processes, great amounts of protein are lost because of erosion of cells from the gut and residues of digestive juices. The amount of endogenous losses will be proportional to the amount of plant material passed through the gut (Foose 1982). Illius and Gordon (1992) quantified the influence of body weight and gut capacity on time available for digestion of food for hindgut fermenters as: Mean Retention Time (MRT) = 9.4 Body Weight According to this the MRT of a 3 ton elephant should be around 72 h although in reality it varies between h (Owen-Smith 1988). Because non-ruminants cannot make use of microbial protein and have high food passage rates, they can be expected to incur higher losses of protein in the faeces (Foose 1982). This might explain why nitrogen intake of elephant was maximized during the wet season at our study site. The metabolic rate of an animal is determined by the accumulation rate of nutrients required for the biochemical reactions that drives metabolism (Brown et al. 2004). 69

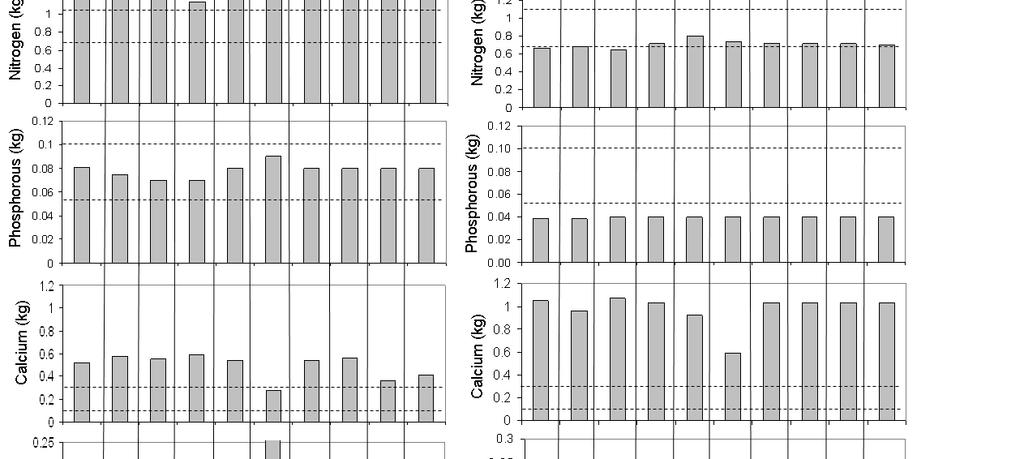
80 (a) (b) 70
81 Figure 5.1: (a) Plant species (top graph) and nutrient composition, expressed as part of a 53 kg daily dry matter intake, for observed (left most column) and each of nine predicted diets of elephant during the wet season: random food selection, energy maximization, energy maximization with minimum nutrient requirement constraints, satisficing of minimum nutrient requirements under energy constraints of at least 257 MJ, minimization of condensed tannin with constraints satisfying minimum nutrient requirements and at least 257 MJ energy, maximization of N with constraints satisfying average nutrient requirements and at least 280 MJ energy, maximization of Ca with constraints satisfying average nutrient requirements and at least 280 MJ energy, maximization of Na with constraints satisfying average nutrient requirements and at least 280 MJ energy, and maximization of P with constraints satisfying average nutrient requirements and at least 280 MJ energy. (b) Plant species (top graph) and nutrient composition, expressed as part of a 53 kg daily dry matter intake, for observed and each of nine predicted diets of elephant during the dry season: random, energy maximization, energy maximization with minimum nutrient requirement constraints, satisficing of minimum nutrient requirements under energy constraints of at least 257 MJ, minimization of condensed tannin with constraints satisfying minimum nutrient requirements and at least 257 MJ energy, maximization of P with constraints satisfying minimum nutrient requirements and at least 307 MJ energy, maximization of N with constraints satisfying minimum nutrient requirements and at least 307 MJ energy, maximization of Ca with constraints satisfying minimum nutrient requirements and at least 307 MJ energy and maximization of Na with constraints satisfying minimum nutrient requirements and 307 MJ energy. Lower and upper dotted lines represent minimum and average nutrient requirements for elephant respectively, as derived from literature (see Table 5.1). 71
82 Figure 5.2: Deviation in nutrient (top graph) and species (lower graph) composition between observed and predicted diets (random, energy maximization, energy maximization with minimum nutrient requirement constraints, satisficing of minimum nutrient requirements at energy constraints of at least 257 MJ, minimization of condensed tannin with constraints satisfying minimum nutrient requirements and at least 257 MJ energy, maximization of N with constraints satisfying minimum nutrient requirements and at least 257 MJ energy, maximization of Ca with constraints satisfying minimum nutrient requirements and at least 257 MJ energy, maximization of Na with constraints satisfying minimum nutrient requirements and at least 257 MJ energy, maximization of P with constraints satisfying minimum nutrient requirements and at least 257 MJ energy, maximization of N with constraints satisfying minimum nutrient requirements and at least 307 MJ energy, maximization of P with constraints satisfying minimum nutrient requirements and at least 307 MJ energy, maximization of N with constraints satisfying average nutrient requirements and at least 257 MJ energy, maximization of N with constraints satisfying average nutrient requirements and at least 280 MJ energy, maximization of P with constraints satisfying average nutrient requirements and at least 280 MJ energy. Arrows indicate predicted diet with the smallest deviation from the observed diets. 72
83 These nutrients are required in fixed amounts and ratios, and according to Elser (2000) the growth of herbivore populations can be limited directly by minerals such as P, Ca and N. N and P have also been shown to co-limit vegetation productivity on nutrient poor bushland sites (Augustine et al. 2003). Therefore, a deficiency in one of the essential nutrients will necessitate selection for that nutrient. When investigating nutrient selection of herbivores in a particular area, the nutrient contents of plants in the area are seldomly placed in context of nutrient availability at larger scales. Phosphorous can be regarded as deficient in our study area as can be seen from comparisons of P levels of plant species at our study site with minimum P requirements of large herbivores and similar plant species elsewhere in Africa (Figure 5.3). Responding to this deficiency, the elephant at our study area maximized phosphorous intake for all observed diets throughout the year. We suggest that a general deficiency in a particular nutrient, like P, can be used as a predictor of what plant species elephant are most likely to consume. Condensed tannin content of the elephant s diet in our study area were always much higher than predicted from the theoretical diet where minimization of tannin content was used as a foraging strategy. Tannin binds to protein and renders it unavailable for digestion. Thus, in a pregastric fermenter the N from protein cannot be incorporated into microbial protein, which negatively effects digestion. However, in monogastric animals, food first enters the stomach where extreme acidic conditions cause for the tannin-protein complexes to dissociate and the protein to become available for digestion (McArthur et al. 1991). Therefore, monogastric animals could be less sensitive to high tannins levels in their diet, and as such explain the large deviation between predicted diets with low tannin contents and the observed diets with unexpected high tannin concentrations. 73
84 (a) (b) Figure 5.3: A comparison of (a) phosphorous and (b) nitrogen content of plant species in the current study with the same species in other parts of Africa (from the database of the Resource Ecology Group, Wageningen University, the Netherlands). Dotted lines represent minimum and average nutrient requirements for elephant as derived from literature. 74
85 During the last decade there has been growing support in nutritional ecology to not only consider single nutrients or deterrents as the determining forces behind forage selection but to look at the satisficing of multiple nutrients (Raubenheimer & Simpson 1999, Ludwig et al. 2008, Prins & van Langevelde 2008, Raubenheimer et al. 2009). Developments using a geometric framework by Simpson & Raubenheimer (1999) have proved to be very useful in understanding foraging of insects and more recently primates (Felton et al. 2009). However, the limitation of this approach is that a foraging strategy aimed towards reaching a target intake is assumed, limiting the ability to explore selection of specific nutrients beyond this target when restrictions on daily food intake is also taken into consideration. Linear programming resembles the geometric framework approach in that it too considers selection of food types based on the content of multiple nutrients. However, the big advantage of linear programming is that on top of satisficng requirements of multiple nutrients, different strategies of maximization of specific nutrients can also be explored. In this study, by using linear programming models we have identified possible mechanisms by which elephant compile their daily diets. We recognize that linear programming should be used with caution as each outcome is highly dependent on the specified constraints. As the exact nutrient requirements of an elephant are unknown, we reason that the constraints can be fine-tuned as long as the nutrient requirements used as constraints can be justified from literature and are not derived from field data. 75
86 Table

87 CHAPTER 6 SYNTHESIS: WHY SIZE MATTERS AT SMALL SCALES Y. Pretorius 77
88 The saying size matters elegantly summarizes the theme of this chapter in that the focus is on the implications of body mass differences in herbivores as determined by environmental constraints and how a herbivore of a particular size is able to satisfy its nutrient requirements at small scales. As a contribution to the field of large herbivore foraging ecology, I start of by explaining some important aspects on the evolution of body mass in herbivores, the trends and patterns in the distribution and abundance of their forage resources and how this may be used to explain the upper limits of body mass. Next, I demonstrate the implications of the results at each spatial scale by comparing the foraging strategies of impala and elephant, which are both mixed feeders but with large differences in morphology and body mass. Finally, using a conceptual model I expalin the implications of forage selection by a large herbivore on other species as a possible example of bottom-up and top-down effects cascading through different trophic levels. In conclusion I propose how different foraging mechanisms act at spatial scales ranging from bites to daily foraging ranges. Evolution of being big The first question of interest when looking at animals of different body mass, is what are the advantages of becoming bigger/larger?? Various explanations for increases in body mass have been proposed and a growing number of studies indicate that fecundity selection in females and sexual selection in males are the major evolutionary forces that select for larger body mass in many organisms (Blanckenhorn 2000). Other advantages of being large include greater physiological homeostasis, reduced predation risk and the ability to utilize resources out of reach of other herbivores (Owen-Smith 1988, Brown & Sibly 2006). But if bigger is better the next question that I ask is why aren t there any terrestrial mammals larger than an African elephant? Constraints to the upper limit in body mass of terrestrial mammals have been attributed to surface-to-volume ratios (Alexander 1989) and the metabolic cost of gravity (Economos 1981). This upper limit has been calculated as 20 tons (Economos 1981), which is similar to the weight of the largest terrestrial mammal ever thought to be alive, Indricotherium transouralicum (Fortelius & Kappelman 1993). Clauss and co-workers (2003) formulated an interesting hypothesis explaining the physiological upper limits of fermentation which results in the largest ruminant grazer being smaller than the largest ruminant browser and the largest ruminants that ever existed not being significantly larger than extant ones. The lower quality food consumed by larger herbivores and especially grazers requires shorter retention times. This is more easily achieved in hindgut fermenters but this requires an increase in the size of the reticulo-rumen in foregut fermenters with further limits the space for other organs (van Soest 1994, Clauss et al. 2003). However, these physiological explanations for the upper 78
89 limits of body mass still do not explain why the largest extant terrestrial mammal today weighs around 4000 kg. The fibre and food trap A further clue to the reason for an upper limit in body mass might be found in the major extinctions of mega-herbivores during the history of life on earth. Although some relate these extinctions to climate change (Prins 1998, Janis 2008) and others to the extirpation of predators by humans, which precipitate population booms in herbivores and subsequent ecosystem crashes (Whitney-Smith 2008), most postulated explanations agree that a change in the quality and abundance of forage resources ultimately leads to these extinctions (Prins & van Langevelde 2008). As examples I will look at the extinction of mega-herbivores during the Cretaceous and Tertiary as well as the status of extant herbivores. Cretaceous Period ( Mya) During the early Cretaceous period precipitation was high and the productivity of the earth was nearly double that of today (Beerling et al. 1994). The globe was dominated by Jurassic ferns and gymnosperms (Ehleringer et al. 2005). Dinosaurs represented the main herbivore assemblage of which sauropods made up a significant part. Sauropods were the largest animals ever to occur on earth and typically had wide mouth openings and no cheek muscles for mastication which facilitated a high intake capacity without the need to chew their food. Their diets consisted mostly of gymnosperms and soft-tissued plants such as ferns and ginkgoes (Hummel et al. 2008). As CO 2 levels and precipitation started to decline during the mid-cretaceous period angiosperms appeared and expanded in conjunction with a decline in sauropod diversity (Coria & Salgado 2005). It is believed that CO 2 starvation during the Cretaceous contributed to the taxonomic diversification of angiosperms (McElwain et al. 2005). At lower CO 2 concentrations plants have to keep their stomata open for longer periods, the consequence of which is greater water losses through transpiration. Unlike with gymnosperms that have softwood and no vessels in their xylem, angiosperms developed vessels for the more efficient transport of water. These vessels consisted of elongated perforate cells with lignified secondary walls and no protoplasm (Logan & Thomas 1987). Although it was previously thought that there was a co-evolution between dinosaurs and angiosperms Butler (2009) who tested this hypothesis extensively, found more evidence for the opposite being true in that dinosaurs started to decline when angiosperms increased. Therefore, I reason that an increase in the structural tissue of plants, which translates to an increase in fibre, and a decline in the abundance of plant biomass of especially gymnosperms could have lead to the decline in sauropod diversity as their wide mouths and inability to select nutrient rich plant parts would have forced them to consume plants and plant parts with a higher fibre content. 79
90 Tertiary Period ( Mya) The Cenozoic era (65 Mya today) is commonly referred to as the age of mammals as this period marked the major evolution and diversification of mammals (Janis 1993). The vegetation of the Tertiary was dominated by angiosperms with their smaller leaves and higher fibre content than the angiosperms from the mid-cretaceous (McTwain et al. 2000). This may have stimulated the appearance of the first ruminants during the Eocene. These small browsers would have had an advantage over monogastric animals in coping with the more fibrous forage of lower biomass by using their specialized compartments to host micro organisms which could digest fibrous plant cell walls (Janis 1989). Mega-herbivores such as Brontotheres went extinct at the end of the Eocene as the earth cooled down and became even drier during the Oligocene period ( Ma) (Janis 2008). Plant biomass decreased further and tropical forests turned into sub-tropical forests (Pearson & Palmer 2000). More over, seasonality increased and this led to a greater differentiation of fibre content between plant leaves and stems (Janis 2008). Mega-herbivores such as browsing Indricotherium species roamed the earth during this time but disappeared towards the beginning of the Miocene (Lucas & Sobus 1989) just as CO 2 levels declined again and the first plants using a C 4 photosynthetic pathway appeared (Pearson & Palmer 2000, Christin et al. 2008, Bouchenak-Khelladi et al. 2009). Only the most advanced families of angiosperms, which mostly consist of grasses and some sedges, evolved C 4 photosynthetic pathways to cope with climate change (Sage 2004). Significantly, the appearance of C 4 grass and ungulate adaptations to C 4 dominated habitats occurred at a similar time (Bouchenak-Khelladi et al. 2009). C 3 grasses have higher levels of protein and lower levels of structural carbohydrates than C 4 grasses (Barbehenn et al. 2004) but by the late-miocene C 4 grasses contributed significantly to vegetation globally resulting in a diversification of ruminant grazers with superior fibre digestive efficiencies (Janis 1989). During the late Miocene browse quality decreased progressively again causing another decline in large bodied browsers (Janis et al. 2000). Ruminants, although restricted by a physiological upper limit in size (van Soest 1994, Clauss et al. 2003), had an advantage over other animals by hosting micro organisms specialized to digest cellulose which are especially high in C 4 grasses. As with dinosaurs during the Cretaceous I reason that most of the extinctions of mega-herbivores during the Tertiary were caused by a decline in plant biomass and an increase in the structural components of plants. Present day A significant part of the earth s vegetation biomass currently consists of C 4 plant species, which are all angiosperms that mostly include monocotyledonous grasses. Unsurprisingly therefore, global diversity and the biomass of extant large herbivore species are dominated by 80
91 ruminant grazers (van Soest 1994, Fritz & Loison 2006, Prins & Fritz 2008). When looking at global species density over body mass, the species distribution curve for mammals is left skewed with a slight under abundance of animals around 1 kg and an over abundance of animals around 300 kg (Clauset & Erwin 2008). Similar patterns have also been found at regional scales for large herbivores as well as for plants (Richie & Olff 1999). It has long been known that larger herbivores can tolerate lower quality food but need a higher biomass than smaller herbivores because the metabolic rate scales to ¾ powers of body mass (Kleiber 1932) whereas gut capacity scales isometrically with body mass (Bell-Jarman principle: Bell 1971 & Jarman 1974). Therefore, as plant available moisture reduces the nutrient content of plants but increases productivity, and plant available nutrients increase both these factors, the highest herbivore diversities should and does occur in locations with intermediate moisture and high nutrients, which benefits both small and large animals (Olff et al. 2002). These findings suggest that forage resource abundance and quality somehow regulate body mass distributions. Results from this thesis re-confirm that larger animals are restricted more by food availability while smaller animals need higher quality forage (Chapter 5). I also provide an alternative explanation for the upper limits of body mass in terms of the challenges faced by herbivores due to the dilution of forage resources in space and how they have adapted by changing their mouth morphologies (Chapter 2). Past and present climate trends and habitat types may explain herbivore body mass distributions and morphologies (Janis 1993). I conclude that increased CO 2 levels, declines in precipitation and more prominent seasonality will lead to a decreases in plant biomass, larger differences between the quality of plant parts and an increase in structural compounds such as fibre. The latter are strongly linked to the diversity of large herbivore taxa as well as the upper limits of herbivore body mass (Prins & Gordon 2008). In the following sections I demonstrate how abundance and fibre content of forage constrain the intake of mega-herbivores in particular. The mouth size paradox Compared to sauropods, mammalian herbivores have molars and cheek muscles to allow mastication of food. Even though the largest sauropod, Brontotheres which was the size of extant elephant, had unique upper molars with W-shaped ectolophs to help with shearing of food, they did not have extreme sized soft mouth parts such as trunks (Mihlbachler 2008). Indricotheriums, which diversified mainly when Bronthotheres went extinct, had tusk-like, elongated incisors of which the upper pair pointed straight down and the lower pair pointed outward (Lucas & Sobus 1989). This type of dentition along with a long neck allowed these animals to strip leaves from trees at levels that were out of reach of other animals. Therefore, as the vegetation deteriorated through time it seems that mega-herbivores adapted their mouth 81
92 morphologies in particular on order to grow to the sizes they did. However, sudden changes in climate may have caused extinctions as there was no time to adapt their mouth morphologies. The ancestors of extant elephant, Moeritherium, which occurred during the same time as Brontotheres in the Eocene, were small pig-like animals without trunks but with elongated tusk-like incisors in both jaws (Palmer 1999). These animals would not have been affected as badly as larger herbivores by the decline in forage biomass, and due to their small size would have been able to select more nutrient rich plant parts even if the structural components increased. Further, as with extant wild boars, the tusk-like incisors would have allowed the animal to dig up the otherwise out of reach roots and tubers below the ground. Following the Eocene, body mass and trunk development of proboscideans gradually increased and the development of high-crowned molars indicated a diet which included increasing amounts of grass (Cerling et al. 1999). Although more recent studies caution against the assumption that the development of hypsodonty is an evolutionary response to diets including more grass, this assumption is accepted for the time being as many extant grazers have high-crowned teeth and there is little evidence that this is in fact not the case (Strömberg 2006). Unsurprisingly, the Miocene diversification of the proboscidean taxa correlates well with the appearance and expansion of especially C 4 grasses (Shoshani 1998). Due to increasing atmospheric CO 2 levels at the end of the Pleistocene period, C 4 grasslands started to decline again (Ehleringer et al. 1997, Cerling et al. 1998), which may explain why most extant African elephant browse more than graze. To illustrate the importance of mouth size and morphology for satisfying nutrient requirements of different size herbivores, I modeled and compared the forage intake of impala, elephant and Indricotherium on grass and browse. Further, for each animal I compared nutrient gains per intra-dental mouth volume and per total mouth volume (see Chapter 2) to illustrate how elongated soft mouth parts of mega-herbivores are necessary for survival. Model calculations For each of the herbivores, intra-dental mouth volume (IMV) and total mouth volume (TMV) were calculated from their body masses according to the scaling equations derived in Chapter 2 (IMV = 6.89 (BM 0.89 ), TMV = 0.26 (BM 1.72 )). Because the plant thinning law predicts that the number of plants per unit space scales to 0.75 power of average plant mass (Enquist et al. 1998) and similarly that standing leaf biomass scales to 0.75 power of standing stem biomass (Niklas 2004), I assumed that stem mass scales to volume to the power 0.75 which means that leaf mass should scale with volume to 0.56 (as the product of 0.75 x 0.75). However, these relationships should only hold true when an animal takes a bite using its intra-dental mouth volume but not any soft mouth parts. This is because soft mouth parts are used to increase the leaf mass per bite so that the stem mass included in the mouth volume, when the volume covered by soft mouth parts are also included, should have a ratio with leaf mass of higher 82
93 than 0.75 and closer to one. Thus for total mouth volume, stem mass should, as with leaf mass, scale to volume to the power of Indeed, data from Chapter 2 on the bite mass to bite volume relationships/ratio? reveal a similar scaling factor. Because stem mass per unit volume is heavier than leaf mass for the same size volume and even more so for trees than for grasses, mass gain per bite volume was calculated for browse and grass for each animal species using the equations in Figure 6.1. Compensated stem mass indicated that stem mass included in a bite when soft mouth parts were added to the intra-dental mouth volume. Acid Detergent Fibre (ADF) were used as a proxy for calculating the digestible cell mass, and average ADF values for browse and grass were obtained from chemical analysis conducted on leaf and stem material throughout the study (Chapter 2, 4, & 5). Digestible cell mass per bite was calculated from stem and leaf mass derived from Figure 6.1 as: Browse Stem Mass / bite (g) = Intra-dental mouth volume 0.75 Browse Leaf Mass / bite (g) = Intra-dental mouth volume 0.56 Digestible cell mass / bite = [Browse leaf mass / bite x (100 % browse leaf ADF)] + [Browse stem mass / bite x (100 - % browse stem ADF)] Digestible cell mass per bite for grass and for mouth volumes including soft mouth parts were calculated in the same way. A bite rate of 0.8 bites per second was used as a baseline for the maximum bite rate achieved by a 10 kg animal. Because bite rates on grass were consistently higher than on browse, the maximum bite rate for a 10 kg animal on browse was estimated at half that of grass (0.4 bites/s). Because chewing rate scales negatively as BM (Fortelius 1985) and chewing rate is linearly correlated to bite rate (Demment & Greenwood 1988), bite rate might be expected to scale as BM Hence, bite rates on browse were calculated as: Bite rate = (BM ) and on grass as: Bite rate = 1.43 (BM ) Finally, instantaneous intake rate was calculated as the product of digestible cell mass per bite and bite rate. Because the equation derived for instantaneous intake rate (IR) from Chapter 2 (IR = (BM 0.75 )) represented 0.1 % of daily metabolic requirements (MJ) (MJ = BM 0.75 )), I assumed that any percentage less than that calculated for the current model would mean that the animal would not be able to satisfy its daily metabolic requirements. Model results and implications According to the model, Indricotherium would have only been able to satisfy its daily nutrient requirements if it had elongated soft mouth parts and fed on grass (Table 6.1). However, when using the equation from Chapter 2 for the scaling relationship between soft mouth part length 83
94 (SL) and body mass to calculate the mouth size required by Intricotherium to cover the predicted bite volume used in the model, lip and/or tongue length would have had to be 1.69 m long (SL = (BM 0.63 )). This might have put too much strain on the already compensated for long neck (Seymour 2009). More over, the model shows that an elephant will not be able to survive and satisfy its daily nutrient requirements without a trunk. Although I realize that the comparison between nutrient gain from grass and browse rests heavily on the assumptions of mass-space relationships and differences in bite rates between the two forage types, the model adequately illustrates that nutrient gains for these different forage types are comparable and that browsers and grazers do not have to be kept separately when comparing animals of different body mass. Hummel and co-workers (2008) recently used chemical analysis to demonstrate how a sauropod could have survived on these plants using extant gymnosperms. However they only used leaf material in their analysis of scaling relationships thus ignoring the dilution of plant mass in space as well as the difficulty that such a big animal would have had to select leaves among stems. Although it seems to have taken longer to evolve, enlarged soft mouth parts allow mega-herbivores greater flexibility in coping with a decline in plant abundance and quality. Therefore, at the relatively deteriorated state of extant forage, compared to the Cretaceous and Tertiary, mega-herbivores such as the African elephant are still able to survive Browse Stem Mass = 0.002V Mass (g) Grass Stem Mass = 0.001V 0.75 Compensated Browse Stem Mass = 0.005V 0.56 ( ) Compensated Grass Stem Mass = 0.003V 0.56 ( ) Browse Leaf Mass = 0.002V 0.56 Grass Leaf Mass = 0.001V E+06 2E+06 3E+06 4E+06 5E+06 6E+06 7E+06 Volume (cm 3 ) Figure 6.1: Proposed mass-space scaling relationships for leaves and stems of grass and browse plants in the South African savanna. Compensated stem mass indicated the stem mass included in a bite when soft mouth parts were added to the intra-dental mouth volume. 84
95 Herding In the previous section I discussed how mouth morphology of especially mega-herbivores is an adaptation to past and current environmental conditions through the process of evolution. However, body mass as a function of resource availability is not only restricted to the individual, as a herd of animals also possesses a total mass with metabolic requirements that need to be satisfied. Ecologists have proposed many explanations for herbivores grouping together including reducing predation risk (Jarman 1974, Molvar & Bowyer 1994), sharing information about resources (Prins 1989, Dall et al. 2005) and maintaining high quality food resources (e.g., grazing lawns, Vesey-FitzGerald 1960, McNaughton 1984, Fryxell 1991). However, herding also has its disadvantages as intra-specific competition increases (Shrader et al. 2006, Smallegange et al. 2006). Cromsigt and Olff (2006) suggested that group size differences among species might be very important in testing allometric hypotheses such as patch selection but to my knowledge no study has illustrated how group size affects the scale at which herbivores select nutrient rich patches. In the following model I explore how herd living animals benefit more from maximizing instantaneous intake rate rather than selecting nutrient rich areas at larger scales. Model calculations For the model, 50 bites each by steenbok and impala antelope in three plot types were used for comparison as in the experiment in Chapter 4 and 5 (Table 6.2). The first plot consisted of 25 small 4 m 2 patches (100 m 2 fertilized area in total) per 2500 m 2 plot with a high local nutrient concentration per patch, resulting in a medium total nutrient load per plot. The second plot consisted of 5 patches of 10 m 2 each (500 m 2 fertilized area in total) with a medium local nutrient concentration per patch, resulting in a medium total nutrient load per plot and in the last plot the whole 2500 m 2 area was fertilized with a medium local nutrient concentration that resulted in a high total nutrient load. The percentage digestible material in high local nutrient concentration patches was assumed to be 70 %, in medium local nutrient patches 55 % and in unfertilized patches 50 %. Bites were divided among patches according to the total area fertilized per plot and for herd animals it was assumed that half of the bite locations had already been visited by another animal. Therefore, at these previously visited locations, bite mass was assumed to be 10 % less and nutrient concentration 50 % less due to selection for nutrient rich plant parts by the previous animal. Bite mass was calculated according to the equation derived from Chapter 2 (0.002BM). The digestible cell mass per patch was calculated as the product of bite mass, the number of bites per patch and the percentage digestible cell mass. Next, all the patch gains for each plot were added to obtain the total digestible cell mass gained with 50 bites from a plot. For comparison, gain per bite was calculated. 85
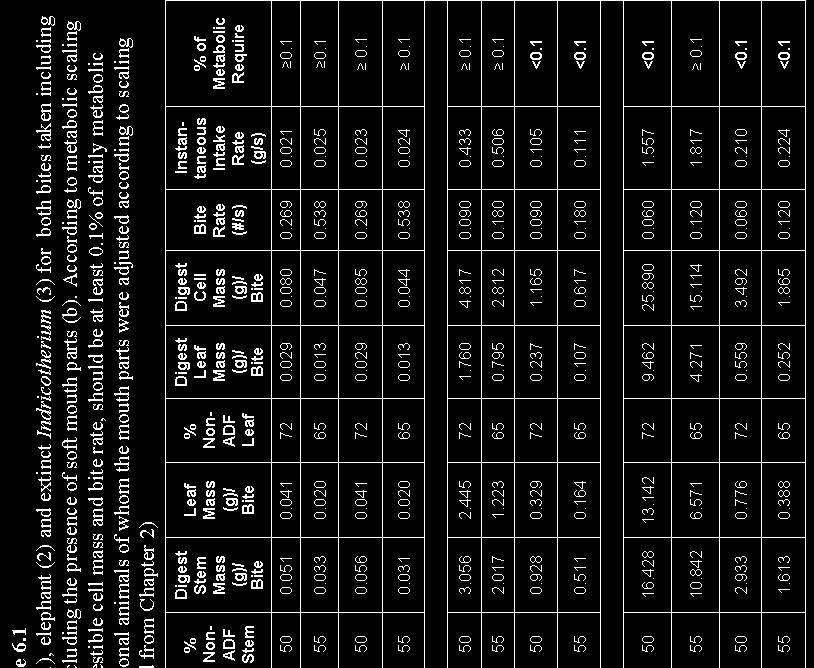
96 86
97 As digestibility was assumed to scale similarly to body mass as metabolic rate (BM 0.75 ), I back transformed the digestible cell mass per bite by using the bite mass equation (0.002BM) in combination with the scaling of metabolic rate to see if all body mass requirements would be met (Digestible cell mass = 0.002BM > BM = (Digestible cell mass/0.002) 1.33 ). Model results and implications From this model it is first of all clear that small antelope such as steenbok would not be able to satisfy the metabolic requirements for their body mass when living in a herd (Table 6.2). Secondly, solitary animals seem to gain more by selecting plots with the highest total nutrient loads whereas herd living animals have to select plots where the local nutrient concentration per patch is highest. From this I conclude that the phenomenon of herbivores aggregating together in large numbers would be more common in larger animals that forces these animals to maximize their instantaneous intake rates to overcome the effects of intra-specific competition. Nutritional trade-offs of being big versus being small After demonstrating how large herbivores have adapted either physically, through their mouth morphologies, or behaviourally by being able to select nutrient-rich patches at small scales, I focused on the environmental constraints that force an animal of a particular body mass to eat what it eats. Metabolic rate in heterotrophs equals the rate of respiration, which is the main process that sources energy (Brown et al. 2004). Therefore, when determining the value of a plant species to an herbivore, not only does the energy content of the plant need to be considered but also the increased respiration and energy expended to find it. This becomes especially important for a large animal with high absolute energy demands like the elephant. To better illustrate the trade-offs between forage abundance and quality for different size animals, I compared the diets of elephant and impala as calculated using the linear programming model developed in Chapter 5. An impala of 50 kg requiring a daily dry matter intake of 2.5 % of body weight consumes 1.3 kg of food per day (Pieterson et al. 1993). When using acid detergent lignin (ADL) content of plant species from our study, the in vitro digestibility of forage organic matter (IVDOM) can be calculated and these values used to estimate metabolizable energy value of plant species for impala (Pieterson et al. 1993). When using the model to calculate energy gain under the assumption that both elephant and impala eat 100 % of a rare, low fibre plant, like Panicum maximum, elephant turn out to be deficient in energy whereas impala easily satisfy their minimum requirements for energy (Table 6.3). However, if both elephant and impala eat 100 % of an abundant, high fibre plant, like Combretum apiculatum, impala become deficient in energy whilst elephant gain sufficient energy to satisfy minimum energy requirements. 87
98 Table 6.2 An example of the nutrients gained from 50 bites in one of three 2500 m2 plots by steenbok when living alone (a) or in a herd (b) and by impala when living in a herd (c). When calculating the amount of body mass requirements satisfied (last column) from the average digestible cell mass gained per bite using scaling relationships of bite mass with body mass, this value should be equal to or more than actual body mass (fourth column). Animal Species a Steenbok b Steenbok c Impala Bite Digestible Patch Body % Plot Mass # Cell Mass Size Mass Patch Non- Nr (m 2 (0.002* Bites (g) / Patch ) (kg) ADF BM) Type Digestible Cell Mass Body Digestible (g) / 50 Mass Cell Mass bites in Satisfied 2500m 2 (g) / bite (kg) Plot In fresh In fresh Out fresh Out fresh In fresh In fresh In eaten Out fresh Out eaten In fresh In eaten Out fresh Out eaten In fresh In eaten In fresh In eaten Out fresh Out eaten In fresh In eaten Out fresh Out eaten In fresh In eaten * Plot 1 consist of 25 x 4 m 2 patches with high local nutrient concentration per patch resulting in a medium total nutrient load for the plot, plot 2 consist of 5 x 100 m 2 patches with medium local nutrient concentrations resulting in a medium total nutrient load for the plot and in plot 3 the whole 2500 m 2 have medium local nutrient concentration resulting in a high total nutrient load (see Chapter 3 &4 for detail). 88
99 Recently, Prins and van Langevelde (2008) re-introduced the use of linear programming to explain how large herbivores assemble their diets from different places. They generated a hypothesis that predicts that animals that are dependent on surface water during the dry season will better be able to assemble a diet during the wet season when resources are more available compared to the dry season. Indeed, from the findings in Chapter 5 of this thesis the 89
100 maximization of energy intake and the constraints of forage abundance during the dry season on elephant seem to support this idea. The inclusion of grain size in Prins and van Langevelde s (2008) model reveals that inter-patch distance affects smaller animals more than larger ones. However, even though the landscape seem homogenous at larger scales, much heterogeneity in quality of plant species still exists at small scales so that smaller animals do not need to travel as far as large herbivores because they are not as constrained by forage biomass as large herbivores are. Secondly, the various plant species used in the model from Chapter 5 can be seen as patches because the abundance of each species was expressed in distance together with the amount of energy required to obtain each species. However, the model of Prins and van Langevelde (2008) included the energy required to cover the distance between two patches in the total energy requirements of the animal and not explicitly as the value of each patch to the animal. This means that their model could not account for more than two patches of the same kind or of different qualities and biomass. Hence, contrary to the model of Prins and van Langevelde (2008), the model from Chapter 5 illustrates that a small herbivore is able to live solely off a rare plant with large inter-patch distances whereas animals as large as an elephant cannot. The fact that very large animals are more restricted by biomass and small animals by quality not only re-confirms the Bell-Jarman principle (Bell 1971 & Jarman 1974) but also provides an explanation for mega-herbivores being less common in areas of low resource abundance and why the greatest diversity of herbivores occurs in areas of intermediate resource quality and quantity (Olff et al. 2002). A tribute to Hutchinson s homage to Santa Rosalia Half a century ago, Hutchinson (1959) wrote a seminal paper proposing an explanation for animal diversity. Through many examples he illustrated that within a trophic guild and in one habitat no two species of animals have the same body mass and morphology. Since then the debate on co-existence of species and niche separation through resource partitioning has been ongoing (Brown 1981, Prins & Olff 1998, Ritchie & Olff 1999, Prins & van Langevelde 2008). In a recent study on grazing ungulates in South Africa, resource partitioning by grass height could not be explained by body mass alone but indicated the importance of the scaling of mouth width relative to body mass and hence metabolic demands (Arsenault & Owen- Smith 2008). Bite size may contribute to habitat segregation among species because small differences in available bite sizes can generate larger differences in intake rates among herbivores of different sizes (Shipley 2007). As a tribute to Hutchinson and a contribution to the general body of knowledge on this subject I will illustrate the conditions necessary for herbivores of different body mass to survive under the constraints of their mouth morphologies. 90
101 If bite mass increases linearly with body mass (Chapter 2) and quality per bite required by small animals is higher than for large animals, the trade-offs between quality and quantity can be depicted as in Figure 6.2 (a). This also follows from Kleiber s allometry (Kleiber 1932, Prins & van Langevelde 2008) and from the Bell-Jarman principle that states that as body mass and gut size increase isometrically, larger animals with their lower metabolic energy requirements can tolerate lower quality diets and can therefore afford to be less selective (Bell 1971, Jarman 1974, van Soest 1996). Further, according to plant mass distribution patterns in space (Enquist et al. 1998, Niklas 2004), plant mass can be plotted to increase with volume at a decreasing rate whereas plant quality is plotted to decrease with volume because leaf to stem ratios decline resulting in similar patterns as was previously explained for animal requirements in relation to their body mass (Figure 6.2 (b)). When the forage availability and herbivore requirement graphs are combined an indication is obtained of whether a particular habitat is able to adequately provide the metabolic requirements of a herbivore (Figure 6.2 (c) & (d)). More specifically, if we assume that browse is heavier than grass per unit space and that browse quality decreases more quickly in space, because the stem of the browse plant comprises an increasing amount of the plant with higher quality differences between browse stem and leaf, than grass stem to leaf, another interesting property emerges. The shaded areas in Figure 6.2 (c) and (d) where the distance between the animal s requirements and forage availability is greatest is larger with grass than with browse. I hypothesize that the greater biomass and quality of food available in these regions, allows animals within the body mass range covered by this shaded area to herd. Therefore, because this region is bigger for grass it might explain why grazers tend to aggregate together in larger numbers than browsers. However, simply combining the forage availability and animal requirement graphs reveals that larger animals cannot satisfy their forage requirements. By combining the animal requirement and forage abundance graphs with a graph on the relationship of volume with the body mass of animals (Chapter 2), a three dimensional model can be derived that includes the compensation of larger bite volumes by mega-herbivores. This model further illustrates that if forage biomass is low, larger animals cannot satisfy their metabolic requirements (Figure 6.3 (a)), whereas if forage quality is low small herbivores cannot satisfy their metabolic requirements (Figure 6.3 (b)). 91
102 Figure 6.2: Illustration of the trade-offs between quality and quantity of forage requirements for different sized animals (a) and the distribution of forage mass and quality in space (b). When a forage resource distribution graph of browse or grass (b) is combined with the forage requirement graph of animals (a), two better explanatory graphs for browse (c) and grass (d) emerges. The grey regions in these graphs (c & d) where the availability of either browse or grass in relation to requirements is greatest may allow animals within the body mass range covered by this region to group together. 92
103 (a) (b) Figure 6.3: A three dimensional conceptual model on the relationship between metabolic requirements of a herbivore, forage availability and space. Because of the addition of bite volume against body mass (compared to Figure 6.2), the compensation of bite volume by mega-herbivores allow them to gather enough forage resources (elephant in b). However, when forage biomass in the environment is limiting (a) large animals such as elephant are not able to satisfy their requirements whereas where forage quality is limiting (b) small animals such as impala cannot satisfy their metabolic requirements. The little animal figures indicate the corresponding points on the axis of the graphs; the grey figures indicate when requirements are not met and the grey lines serve as guidelines. 93
104 In a synthesis of the progress in the field of resource ecology up to date, Prins and van Langevelde (2008) hypothesized that the relative abundance of large animals (in contrast to small) in assemblages increases with spatial variation and sudden fluctuations in resource availability that result in longer time periods between foraging events. I partially agree but reason that within the constraints of metabolic requirements for a specific body mass a herbivore s perception of spatial scale is first of all as small as its mouth morphology allows it to be and secondly as large as the variability in the abundance and quality of its forage resources allows it to be. As all living organisms have to abide by the same physical laws (Gould 1970) and evidence exist for the universal scaling of biological rates (West et al. 1997, Enquist et al. 1998) across plant and animal species, species-coexistence and diversity within a trophic level is simply a product of evolution to adapt to bottom-up effects from changes in the spatial distribution of resources at lower trophic levels. In the next section, I demonstrate how these bottom-up effects determine a large herbivores foraging pattnerns and how foraging behaviour can feedback through top-down effects to lower trophic levels. The bigger picture To provide context, I developed a conceptual model on the implications of large herbivores forage selection. Herbivores select forage resources of high quality and abundance at multiple scales. In the past much controversy existed on whether primary control throughout trophic levels is due to resources (bottom-up control) or predators (top-down control) (Power 1992). Instead of exclusive top-down or bottom-up control more recent studies indicate shifting control, with resource limitations dominating in dry years and biotic interactions dominating in wet years (Meserve et al. 2003) or where top-down factors such as herbivory shape vegetation patterns although bottom-up factors such as rainfall still sets the upper bound of what productivity is attainable in a system (Groen 2007). To better understand primary control throughout trophic levels, the dynamic feedbacks between adjacent and non-adjacent trophic levels have to be addressed (Power 1992). Cascading effects are especially prevalent for ecosystem engineers, which are organisms such as elephant that directly or indirectly modulate the availability of resources to other species by causing changes in the physical state of biotic and/or aboitic components (Jones et al. 1994). The impact that African elephant have on trees has been a topic of great controversy (Wiseman et al. 2004, de Beer et al. 2006, Lawes & Chapman 2006, O Connor et al. 2007, Chafota & Owen-Smith 2009, Scholes & Mennel 2008) and some studies speculate that the occurrence of high, detrimental impact on trees might be related to the availability of surface water (de Beer 2006) or sudden changes in the availability of preferred forage species (Chafota & Owen-Smith 2008). 94
105 In Chapter 3, I used an experimental approach to demonstrate the possible consequences of very large animals being able to select nutrient rich patches and even plant parts at very fine scales. I now expand on this using a conceptual model of the possible bottom-up and topdown effects of elephant foraging cascading up and down through trophic levels and feeding back into the abiotic environment (Figure 6.4). I reason that under nutrient poor conditions elephant will impact on trees randomly with the predominant impact being uprooting and pollarding. As there are few nutrients available in this scenario, tree seedlings will outcompete grasses (van der Waal et al. 2009) and replace the killed trees (Figure 6.4). The phenomenon of elephant re-utilizing trees and inducing coppicing might lead to some heterogeneity in the vertical structure of the tree layer. At high elephant densities most trees will be killed leading to large bare areas with low cover of nutrient poor herbaceous plants that establish under reduced competition from trees. Evidence of such a scenario has been described on the sandy nutrient poor soils of Etosha (Strohbach 2000) by de Beer (2006) who found that areas that were heavily utilised by elephant also experienced lower rates of woody plant survival and that, coupled with low rainfall and high elephant impact, decreased tree recruitment even further. In a woodland where there is a patchy distribution of nutrients, elephant will select nutrient rich patches particularly where patches are aggregated, larger or have higher nutrient concentrations. Because elephant re-utilize these nutrient rich patches more and mostly consume leaves, leaf density will increase (Smallie & O Connor 2000) and more nutrients will be added, for example from dung deposition, which can potentially initiate a positive feedback loop (van der Waal, unpublished). The increased presence of elephant in areas of high nutrient concentration also means that neighbouring nutrient poor trees have a higher chance of being killed. Under a scenario with a patchy nutrient distribution and high elephant densities, small patches might become over utilized and nutrients depleted, which may lead to the complete removal of woody patches and replacement by palatable grass species. High quality grass establish particularly in the vicinity of trees due to the trees ability to enhance nutrient availability as nutrient pumps (Ludwig et al. 2008, Treydte et al. 2009). Under uniform nutrient rich conditions, elephant will utilize trees at random but because of preference for previously browsed nutrient rich trees, utilization will become more pronounced at these spots. This might lead to a re-distribution and concentration of nutrients. Under high elephant densities, the trees that have become less nutrient rich will be killed and replaced by nutrient rich grasses. Elephant are renowned for being ecosystem engineers (Jones et al. 1994) and are implicated as one of the main biotic factors determining the tree grass ratios of savannas (van de Koppel & Prins 1998). By concentrating limiting resources, patchiness may play a critical role in maintaining ecosystem productivity (Aguiar & Sala 1999). 95
106 Figure 6.4: Conceptual model on the predicted effects elephant will have on woodlands depending on the nutrient status of the soil. 96
107 Although elephant may contribute to homogenization of the landscape under nutrient poor conditions, in nutrient rich areas the opposite is more likely with elephant enhancing landscape heterogeneity. As this study shows, elephant are able to select nutrient rich areas at a range of spatial scales and thus provides some insight as to why spatial vegetation patterns in savannas are so large and difficult to predict. Thus future research in this field should take the spatial scaling effects of elephant foraging into consideration. Scaling conclusions To conclude this synthesis I look at the spatial scales at which the mechanisms that operate to allow an animal of a particular body mass to survive in a particular area. Ritchie and Olff (1999, 2004) developed a theory with a novel approach to explain the diversity and coexistence of species using fractal geometry. They showed that co-existence through resource partitioning is possible as larger herbivores perceive less spatial detail than smaller animals. However, the only field experiments conducted to support this theory could not find any relationship between body mass and the spatial scale of patch selection (Cromsigt & Olff 2006). Despite this there was some support in Chapter 4 for larger animals preferring larger patches, but smaller animals were also able to maximize nutrient intake at larger scales and mega-herbivores such as elephant were able to select nutrient rich patches at very small scales (Chapter 3). Ultimately it is the animal s perceptions and foraging responses that must define the boundaries between the subunits within hierarchical scales (Senft et al. 1987). As this is difficult to determine accurately, Senft and co-workers (1987) proposed a theory of ecological hierarchies for large herbivore foraging and suggested that the significance of interactive resources to a herbivore is highest at intermediate spatial and temporal scales. Subsequently, Kotliar and Wiens (1990) characterized spatial scale by grain and extent where grain is the smallest measurement unit used and extent the total area of interest. I propose a mechanism by which an herbivore s mouth size and morphology determines the grain size with which it measures its environment and its daily metabolic requirements as the extent of its daily foraging range (Figure 6.5). At the bite scale, variation in the quality of plant parts such as leaf and stem is large but herbivores are constrained by their mouth morphologies to select bites that satisfy their metabolic requirements (Chapter 2). Van Langevelde (2008) recently emphasized that an issue that needs more thought is whether consumers are selected for maximizing instantaneous intake or daily intake. Given the results of this thesis where I look at scales ranging from bite size to daily foraging range, I suggest that maximization of nutrient intake with the associated fitness benefits takes place between the bite scale and the daily foraging range because mouth morphology and metabolic requirements restrict selection at these boundaries (Figure 6.5). 97

108 Figure 6.5: Illustration of how fitness is maximized (left vertical axis) at the patch scale in between the mouth morphological and metabolic constraints of the bite scale and daily foraging range. However, at these scales, between bite scale and daily foraging range, selection will also be more difficult as variability in quality and quantity between patches of forage of the same species composition will be lower. 98
. Once the constraints of metabolic requirements are satisfied the animal can afford to select patches with higher levels of for example N and P (Chapter 3 &4).")
109 Variation in quality and quantity between plant species is large but the inclusion of a plant species in the diet depends on its abundance and quality in relation to the body mass and metabolic requirements of the animal (Chapter 5). Once the constraints of metabolic requirements are satisfied the animal can afford to select patches with higher levels of for example N and P (Chapter 3 &4). However, selection at these intermediate patch scales will be more difficult as variation in quality and quantity within vegetation types of the same plant species composition will be small. I conclude that size, as a characteristic which includes mass and morphology, matters because it first of all determines whether a herbivore will be able to survive in a particular habitat or not and hence the likelihood of it going extinct when climate changes. Secondly, it determines whether herbivores are able to herd or not which further determines the spatial scale at which nutrient intake will be maximized. Future research needs to better define the scaling of spatial patterns in plants to enable a testing of the hypothesis on the conditions necessary for large herbivores to herd. Finally, for the time being, like Hutchinson, I propose to be content with an appreciation of the beauty and magnificence of large herbivore diversity. I cannot refrain from pointing out the immense scientific importance of obtaining a really full insight into the ecology of the large mammals of Africa while they can still be studied under natural conditions. It is indeed quite possible that the results of studies on these wonderful animals would in long-range through purely practical terms pay for the establishment of greater reservations and National Parks than at present exist (Hutchinson 1959) 99
110 100
111 REFERENCES Adler, P.B., D.A. Raff & W.K. Lauenroth The effect of grazing on the spatial heterogeneity of vegetation. Oecologia. 128, Adu, E.F. & A.M. Adamu The nutritive value and utilization of three tropical grass hays by sheep. Tropical Grasslands. 16(1), Aguiar, M.R. & O.E. Sala Patch structure, dynamics and implications for the functioning of arid ecosystems. TREE. 14(1), Alendal, E., S. de Bie & S.E. van Wieren Size and composition of the wild reindeer Rangifer tarandus platyrhynchus population in the southeast Svalbard Nature Reserve. Holarctic Ecology. 2, Alexander, R.M Dynamics of dinosaurs and other extinct giants. Columbia University Press, New York. Anderson, G.D. & B.H. Walker Vegetation composition and elephant damage in Sengwa Wildlife Research Area, Rhodesia. Journal of the South African Wildlife Management Association. 4, Arsenault, R. & Owen-Smith, N Resource partitioning by grass height among grazing ungulates does not follow body mass relation. Oikos. 117, Augustine, D.J. & D.A. Frank Effects of migratory grazers on spatial heterogeneity of soil nitrogen properties in a grassland ecosystem. Ecology, 82(11), Augustine, D.J., S.J. McNaughton & D.A. Frank Feedbacks between soil nutrients and large herbivores in a managed savanna ecosystem. Ecological Applications. 13(5), Bailey, D.W, J.E. Gross, E.A. Laca, L.R. Rittenhouse, M.B. Coughenour, D.M. Swift & P.L. Sims Mechanisms that result in large herbivore grazing distribution patterns. Journal of Range Management. 49(5), Bailey, D.W. & F.D. Provenza Mechanisms determining large-herbivore distribution. In: H.H.T. Prins & F. van Langevelde (Eds.). Resource ecology: spatial and temporal dynamics of foraging. Springer, Netherlands. Ball, J.P., K. Danell & P. Sunesson Response of a herbivore community to increased food quality and quantity: an experiment with nitrogen fertilizer in a boreal forest. Journal of Applied Ecology. 37, Barnes, R.F.W Elephant feeding behaviour in Ruaha National Park, Tanzania. African Journal of Ecology. 20, Barbehenn, R.V., Z. Chenw, D. N. Karowez & A. Spickard C 3 grasses have higher nutritional quality than C 4 grasses under ambient and elevated atmospheric CO 2. Global Change Biology. 10,
112 Beauchamp, G Does group foraging promote efficient exploitation of resources? Oikos. 111, Beauchemin, K.A Effects of dietary neutral detergent fiber concentration and alfalfa hay quality on chewing, rumen function, and milk production of dairy cows. Journal of Dairy Science. 74, Beekman, J.H. & H.H.T. Prins Feeding strategies of sedentary large herbivores in East Africa, with emphasis on the African buffalo, Syncerus caffer. African Journal of Ecology. 27, Beerling, D.J Modelling palaeophotosynthesis: late Cretaceous to present. Philosophical Transactions: Biological Sciences. 346(1318), Bell, R.H.V A grazing ecosystem in the Serengeti. Science America. 225, Belovsky, G.F Diet optimization in a generalist herbivore: the moose. Theoretical Population Biology. 14, Belovsky, G.E Optimal foraging and community structure: the allometry of herbivore food selection and competition. Evolutionary Ecology. 11, Benedict, F.G The Physiology of the Elephant. Carnegie Institution of Washington, Washington. Ben-Shahar, R. & D.W. Macdonald The role of soil factors and leaf protein in the utilization of mopane plants by elephants in northern Botswana. BMC Ecology. Benvenutti, M.A., I.J. Gordon & D.P. Poppi The effect of the density and physical properties of grass stems on the foraging behviour and instantaneous intake rate by cattle grazing an artificial reproductive tropical sward. Grass and Forage Science. 61, Bergman, C.M., J.M. Fryxell, C.C. Gates & D. Fortin Ungulate foraging strategies: energy maximization or time minimization? Ecology. 70, Black, J.L. & P.A. Kennedy Factors affecting diet selection by sheep. II. Height and density of pasture. Australian Journal of Agricultural Research. 35, Blanckenhorn, W.U The evolution of body mass: what keeps organisms small? The Quarterly Review of Biology. 75(4), Bond, W Keystone species: Hunting the snark? Science. 292(5514), Bond, W.J., G.F. Midgley & F.I. Woodward The importance of low atmospheric CO2 and fire in promoting the spread of grasslands and savannas. Global Change Biology. 9(7), Bouchenak-Khelladi, Y., G.A. Verboom, T.R. Hodkinson, N. Salamin, O. Francois, G. Nichonghaile & V. Savolainen The origins and diversification of C 4 grasses and savanna adapted ungulates. Global Change Biology. Online,
113 Brooks, T.M., R. Mittermeier, C.G. Mittermeier, G.A.B. Dafonseca, A.B. Rylands, W.R. Konstant, P. Flick, J. Pilgrim, S. Oldfield, G. Magin & C. Hilton-Taylor Habitat loss and extinction in the hotspots of biodiversity. Conservation Biology. 16(4), Brown, J.H Two decades of homage to Santa Rosalia: Toward a general theory of diversity. American Zoologist. 21(4), Brown, J.H., J.F. Gillooly, A.P. Allen, V.M. Savage & G.B. West Toward a metabolic theory of ecology. Ecology. 85(7), Brown, J.H. & R.M. Sibly Life-history evolution under a production constraint. PNAS. 103(47), Bucyanayandi, J.D., J.M. Bergeron, J. Soucie, D.W. Thomas & Y. Jean Differences in nutritional quality between herbaceous plants and bark of conifers as winter food for the vole Microtus pennsylvanicus. Journal of Applied Ecology 29, Butler, R.J., P.M. Barrett, P. Kenrick & M.G. Penn Diversity patterns amongst herbivorous dinosaurs and plants during the Cretaceous: implications for hypotheses of dinosaur/angiosperm co-evolution. The Natural History Museum, European Society for Evolutionary Biology. 22, Cech, P.G., T. Kuster, P.J. Edwards & H.O. Venterink Effects of herbivory, fire and N2-fixation on nutrient limitation in a humid African savanna. Ecosystems. 11, Cerling, T.E., J.R. Ehleringer & J.M. Harris Carbon dioxide starvation, the development of C 4 ecosystems, and mammalian evolution. Philosophical Transactions of the Royal Society. 353, Cerling, T.E., J.M. Harris and M.G. Leakey Browsing and grazing in elephants: the isotope record of modern and fossil proboscideans. Oecologia. 120, Chafota, J. & N. Owen-Smith Episodic severe damage to canopy trees by elephants: interactions with fire, frost and rain. Journal of Tropical Ecology. 25, Christin, P.A, G. Besnard, E. Samaritani, M.R. Duvall, T.R. Hodkinson, V. Savolainen & N. Salamin Oligocene CO 2 decline promoted C 4 photosynthesis in grasses. Current Biology. 18, Clauset, A. & D. H. Erwin The evolution and distribution of species body mass. Science. 321, Clauss, M., W. Loehlein, E. Kienzle & H. Wiesner. 2003a. Studies on feed digestibilities in captive Asian elephants (Elephas maximus). Journal of Animal Physiology and Animal Nutrition. 87, Clauss, M., R. Frey, B. Kiefer, M. Lechner-Doll, W. Loehlein, C. Polster, G.E. Rössner & W.J. Streich. 2003b. The maximum attainable body mass of herbivorous mammals: morphophysiological constraints on foregut, and adaptations of hindgut fermenters. Oecologia. 136,
114 Clauss, M., N. Robert, C. Walzer, C. Vitaud & J. Hummel Testing predictions on body mass and gut contents: dissection of an African elephant Loxodonta africana Blumenbach European Journal of Wildlife Research. 51, Clauss, M., J.C. Castell, E. Kienzle, E.S. Dierenfeld, E.J. Flach, O. Behlert, S. Ortmann, W.J. Streich, J. Hummel & J.M. Hatt Digestion coefficients achieved by the black rhinoceros (Diceros bicornis), a large browsing hindgut fermenter. Journal of Animal Physiology and Animal Nutrition. 90, Clutton-Brock, T.H. & P.H. Harvey The functional significance of variation in body mass among mammals. American Society of Mammalogists. 7, Coria, R.A. & L. Salgado Mid-Cretaceous turnover of saurischian dinosaur communities: evidence from the Neuque n Basin. Geological Society of London Special Publication. 252, Cromsigt, J.P.G.M. & H. Olff Resource partitioning among savanna grazers mediated by local heterogeneity: an experimental approach. Ecology. 87(6), Cromsigt, J.P.G.M Large herbivores in space, resource partitioning among savanna grazers in a heterogeneous environment. PhD thesis, Community and Conservation Ecology Group, University of Groningen, Haren, the Netherlands. Dall, S.R.X., L. Giraldeau, O. Olsson, J.M. McNamara & D.W. Stephens Information and its use by animals in evolutionary ecology. TREE. 20(4), B Darwin, C On the origin of species by means of natural selection, or the preservation of favoured races in the struggle for life. John Murray, London. De Beer, Y., W. Kilian, W. Versfeld & R.J. van Aarde Elephants and low rainfall alter woody vegetation in Etosha National Park, Namibia. Journal of Arid Environments. 64, De Jong, C.B., S.E. van Wieren, R.M.A. Gill & R. Munro Relationships between diet and liver carcinomas in roe deer in Kielder forest and Galloway forest. Veterinary Record. 155, Dekker, B., K.P. Kirkman & S.I. du Plessis Use of the dry-weight-rank method of botanical analysis in semi-arid savanna communities. African Journal of Range & Forage Science. 18, Demment, M.W. & P.J. van Soest A nutritional explanation for body mass patterns of ruminant and nonruminant herbivores. The American Naturalist. 125(5), Demment, M.W. & G.B. Greenwood Forage ingestion: effects of sward characteristics and body mass. Journal of Animal Science 66, Dierenfeld, E. S., R. du Toit & W.E. Braselton Nutrient composition of selected browses consumed by black rhinoceros (Diceros bicornis) in the Zambezi Valley, Zimbabwe. Journal of Zoo and Wildlife Medicine. 26,
115 Dierenfeld, E.S., R.E.C. Wildman & S. Romo Feed intake, diet utilization and composition of browses consumed by the Sumatran rhino (Dicerorhinus sumatrensis) in a North American zoo. Zoo Biology. 19, Drescher, M Grasping complex matter: large herbivore foraging in patches of heterogeneous resources. Ph.D. Thesis, Wageningen University, the Netherlands. Drescher, M., I.M.A. Heitkönig, J.G. Raats & H.H.T. Prins The role of grass stems as structural foraging deterrents and their effects on the foraging behaviour of cattle. Applied Animal Behaviour Science. 101, du Toit, P.J., J.G. Louw & A.I. Malan A study of the mineral content and feeding value of natural pastures in the Union of South Africa. Onderstepoort Journal of Veterinary Science. Anim. Ind. 14, du Toit, J.T., J.P. Bryant & K. Frisby Re-growth and palatability of Acacia shoots following pruning by African savanna browsers. Ecology 71, Economos, A.C The largest land mammal. Journal of Theoretical Biology. 89, Ehleringer, J.R., T.E. Cerling & B.R. Helliker C 4 photosynthesis, atmospheric CO 2, and climate. Oecologia. 112, Ehleringer, J., T.E. Cerling & D. Dearing A history of atmospheric CO 2 and its effects on plants, animals and ecosystems, (Ecological studies, Vol.177). Springer. Elser, J. J., W. F. Fagan, R. F. Denno, D. R. Dobberfuhl, A. Folarin, A. Huberty, S. Interlandi, S. S. Kilham, E. McCauley, K. L. Schulz, E. H. Siemann, & R. W. Sterneret Nutritional constraints in terrestrial and freshwater food webs. Nature. 408, Enquist, B.J., J.H. Brown & G.B. West Allometric scaling of plant energetics and population density. Nature. 395, Estes, R.D Social organization of the African Bovidae. In: V. Geist & F. Walther (Eds.). The behaviour of ungulates and its relation to management 1 & 11, Estes, R.D The behaviour guide to African mammals. The university of California Press, Berkeley, Los Angeles and London. Felton, A.M., A. Felton, D. Raubenheimer, S.J. Simpson, W.J. Foley, J.T. Wood, I. R. Wallis and D.B. Lindenmayer Protein content of diets dictates the daily energy intake of a free-ranging primate. Behavioural Ecology (in press). Foose, T.J Trophic strategies of ruminant versus nonruminant ungulates. Ph.D. Thesis, University of Chicago, United States. Fornara, D.A. & J.T. du Toit Browsing lawns? Responses of Acacia nigrescens to ungulate browsing in an African savanna. Ecology. 88(1), Fortelius, M Ungulate cheek teeth: developmental, functional, and evolutionary interrelations. Acta Zoologica Fennica 180,
116 Fortelius, M. & J. Kappelman The largest land mammal ever imagined. Zoological Journal of the Linnean Society. 107, Fortin, D The allometry of plant spacing that regulates food intake rate in mammalian herbivores. Ecology. 87(7), Frank, D.A., S.J. McNaughton & B.F. Tracy The ecology of the earth s grazing ecosystems. BioScience. 48(7), Fritz, H., P. Duncan, I. J. Gordon, & A. W. Illius Megaherbivores influence trophic guilds structure in African ungulate communities. Oecologia. 131, Fritz H. & A. Loison Large herbivores across biomes. In: K. Danell, R. Bergstrom, P. Duncan & J. Pastor. (Eds.). Large herbivore ecology, ecosystem dynamics and conservation. Cambridge University, Cambridge. Fryxell, J.M Forage quality and aggregation by large herbivores. The American Naturalist. 138 (2), Fryxell, J.M., Wilmshurst, J.F. & Sinclair, A.R.E Predictive models of movement by Serengeti grazers. Ecology, 85(9), Gagnon, M. & A.E. Chew Dietary preferences in extant African bovidae. Journal of Mammalogy. 81(2), Ginnett, T.F., J.A. Dankosky, G. Deo & M.W. Demment Patch depression in grazers: the roles of biomass distribution and residual stems. Functional Ecology. 13, Goering, H.K. & P.J. van Soest Forage Fiber Analyses (Apparatus, Reagents, Procedures and Some Applications). Agricultural Handbook 379, United States Department of Agriculture, Washington DC. Gordon, I.J. & A.W. Illius Incisor arcade structure and diet selection in ruminants. Functional Ecology. 2(1), Gordon, I.J. & C.E. Lascano Foraging strategies of ruminant livestock on intensively managed grasslands: Potential and constraints. In: M.J. Baker (Ed.). Grasslands for our world. SIR Publishing. Wellington, New Zealand. Gordon, I. & H.H.T. Prins (Eds.) The ecology of browsing and grazing. Springer- Verlag, Berlin. Gould, S.J Evolutionary paleontology and the science of form. Earth-Science Reviews. 6, Printed in The Netherlands Greyling, M.D Sex and age related distinctions in the feeding ecology of the African elephant, Loxodonta africana. Ph.D Thesis, University of Witwatersrand, Johannesburg, South Africa. Griffiths, W.M Plant-animal mechanics & bite procurement in grazing ruminants. In: A. Herrel, T. Speck & N.P. Rowe (Eds.). Ecology and biomechanics: A mechanical approach to the ecology of animals and plants. CRC Press, Boca Raton. 106
117 Groen, T.A Spatial matters: How spatial processes and patterns affect savanna dynamics. Ph.D. Thesis, Wageningen University, the Netherlands. Guy, P.R The daily food intake of the African elephant Loxodonta africana Blumenbach, in Rhodesia. Arnoldia. 26, 1-6. Hanley, T.A The nutritional basis for food selection by ungulates. Journal of Range Management. 35(2), Hanley, T.A A nutritional view of understanding and complexity in the problem of diet selection by deer (Cervidae). Oikos. 79(2), Haydock, K.P. & N.H. Shaw The comparative yield method. Australian Journal of Experimental Agriculture and Animal Husbandry. 15, Hengeveld, G.M., F. van Langevelde, T.A. Groen & H.J. de Knegt Optimal foraging for multiple resources in several food species. American Naturalist. 174, Hester, A.J., I.J. Gordon, G.J. Baillie & E. Tappin Foraging behaviour of sheep and red deer within natural heather grass mosaics. Journal of Applied Ecology. 36, Heuermann, N Tall swards and small grazers: competition, facilitation and coexistence of different-sized grazers. Ph.D. Thesis, Wageningen University, the Netherlands. Hiscocks, K The impact of an increasing elephant population on the woody vegetation in southern Sabi Sand Wildtuin, South Africa. Koedoe. 42(2), Hixon, M.A Energy maximizers and time minimizers: theory and reality. The American Naturalist,. 119(4), Hjeljord, O Research on moose nutrition in the Nordic countries. Swedish Wildlife Research, Suppl.I, Hodgson, J The control of herbage intake in the grazing ruminant. Proceedings of the Nutrition Society. 44, Hofmann, R.R. & D.R.M. Stewart Grazer or browser: a classification based on the stomach structure and feeding habits of East African ruminants. Mammalia. 36, Holdø, R.M., J.P. Dudley & L.R. McDowell Geophagy in the African elephant in relation to availability of dietary sodium. Journal of Mammalogy. 83(3), Holling, C.S Some characteristics of simple types of predation and parasitism. Canadian Entomology. 41, Hongo, A. & M. Akimoto The role of incisors in selective grazing by cattle and horses. Journal of Agricultural Science. 140, Hubbert, M.E The effect of diet on energy partitioning in moose. Ph.D. Thesis, University of Alaska, Fairbanks. Huggard, D.J A linear programming model of herbivore foraging: imprecise, yet successful? Oecologia. 100,
118 Hummel, J., C.T. Gee, K. Südekum, P.M. Sander, G. Nogge & M. Clauss In vitro digestibility of fern and gymnosperm foliage: implications for sauropod feeding ecology and diet selection. Proceedings of the Royal Society. 275, Hutchinson, G.E Homage to Santa Rosalia or why are there so many kinds of animals? The American Naturalist. 93(870), Illius, A.W. & I.J. Gordon The allometry of food intake in grazing ruminants. Journal of Animal Ecology. 56, Illius, A.W. & I.J. Gordon Modelling the nutritional ecology of ungulate herbivores: evolution of body mass and competitive interactions. Oecologia. 89(3), Illius, A. W. & I.J. Gordon The functional significance of the browser-grazer dichotomy in African ruminants. Oecologia. 98, Illius, A.W., I.J. Gordon, D.A. Elston & J.D. Milne Diet selection in goats: a test of intake-rate maximization. Ecology. 80(3), Illius, A.W., B.J. Tolkamp & J. Yearsley The evolution of the control of food intake. Proceedings of the Nutrition Society. 61, Iason, G.R. & S.E. van Wieren Digestive and ingestive adaptations of mammalian herbivores to low quality forage. In: H. Olff, V.K. Brown, R. Brent (Eds.). Herbivores: between plants and predators, Proceedings of the Symposium of the British Ecological Society. Blackwell Scientific Publications, Oxford. Jachmann, H., & R. H. V. Bell Utilization by elephants of the Brachystegia woodlands of the Kasungu National Park, Malawi. African Journal of Ecology. 23, Janis, C.M A climatic explanation for patterns of evolutionary diversity in ungulate mammals. Palaeontology. 32, Janis, C.M Tertiary mammal evolution in the context of changing climates, vegetation and tectonic events. Annual Review of Ecology. 24, Janis, C.M., J. Damuth & J.M. Theodor Miocene ungulates and terrestrial primary productivity: where have all the browsers gone? PNAS. 97(14), Janis, C.M An evolutionary history of browsing and grazing ungulates. In: I.J. Gordon & H.H.T. Prins (Eds.).The ecology of browsing and grazing. Springer, Berlin Heidelberg. Jarman, P.J The social organisation of antelope in relation to their ecology. Behaviour. 48, Jia, J, P. Niemela & K. Danell Moose Alces alces bite diameter selection in relation to twig quality on four phenotypes of Scots pine Pinus sylvestris. Wildlife Biology. 1, Jian, Z. & R.J. Hudson Optimal grazing of wapiti (Cervus elaphus) on grassland: patch and feeding station departure rules. Evolutionary Ecology. 7, Jones, C.G., J.H. Lawton & M. Shachak Organisms as ecosystem engineers. Oikos. 69(3),
119 Kingdon, J The Kingdon Field Guide to African Mammals. Academic Press, London and New York. Kirkham, F.W. & R.J. Wilkins The productivity and response to inorganic fertilizers of species-rich wetland hay meadows on the Somerset Moors: the effect of nitrogen, phosphorus and potassium on herbage production. Grass & Forage Science. 49, Kleiber, M Body mass and metabolism. Hilgardia. 6, Kotliar, N.B. & J.A. Wiens Multiple scales of patchiness and patch structure: a hierarchical framework for the study of heterogeneity. Oikos. 59(2), Laca, E.A., E.D. Ungar & M.W. Demment Mechanisms of handling time and intake rate of a large mammalian grazer. Applied Animal Behaviour Science. 39, Lawes, M.J. & C.A. Chapman Does the herb Acanthus pubescens and/or elephants suppress tree regeneration in disturbed Afrotropical forest? Forest Ecology and Management. 221, Lawley, L The World of Elephants. Friedman/Fairfax Publishers, New York, United States of America. Lewis, D.M Observations of tree growth, woodland structure and elephant damage on Colophospermum mopane in Luangwa Valley, Zambia. African Journal of Ecology. 29, Leyland, R.C. & K.T. Witthüser Regional description of the groundwater chemistry of the Kruger National Park. Report to the Water Research Commission by Department of Geology, University of Pretoria, South Africa. Lindstedt, S.L. & P.J. Schaeffer Use of allometry in predicting anatomical and physiological parameters of mammals. Laboratory animals 36, Logan, K.J. & B.A. Thomas The distribution of lignin derivatives in fossil plants. New Phytologist. 105(1), Loveridge, J.P. & S.R. Moe Termitaria as browsing hotspots for African megaherbivores in miombo woodland. Journal of Tropical Ecology. 20, Low, A.B. & A.G. Rebelo (Eds.) Vegetation of South Africa, Lesotho and Swaziland. Department of Environmental Affairs and Tourism, Pretoria, South Africa. Lucas, S. G. & J.C. Sobus The systematics of Indricotheres. In: D.R. Prothero. & R.M. Schoch. (Eds.). The evolution of Perissodactyls. Oxford University Press, Oxford, England. Ludwig, F., H. de Kroon, H.H.T. Prins & F. Berendse Effects of nutrients and shade on tree-grass interactions in an East African savanna. Journal of Vegetation Science. 12(4), Ludwig, F., H. de Kroon & H.H.T. Prins Impacts of savanna trees on forage quality for a large African herbivore. Oecologia. 155,
120 MacArthur, R.H. & E.R. Pianka On optimal use of a patchy environment. The American Naturalist. 100(916), Makhabu, S.W. & C. Skarpe Rebrowsing by elephants three years after simulated browsing on five woody plant species in northern Botswana. South African Journal of Wildlife Research. 36(11), Mathiesen, S.D., W. SØrmo, Ø.E. Haga, H.J. Norberg, T.H.A. Utsi & N.J.C. Tyler The oral anatomy of arctic ruminants: coping with seasonal change. Journal of the Zoological Society of London. 251, Mattson, W.J Herbivory in relation to plant nitrogen content. Annual Review of Ecology and Systematics.11, McArthur, C., A.E. Hagerman & C.T. Robbins Physiological strategies of mammalian herbivores against plant defenses. In: R.T. Palo & C.T. Robbins. (Eds.). Plant defenses against mammalian herbivory. CRC Press, Boca Raton, FL. McDonald, P., R.A. Edwards, J.F.D. Greenhalgh & C.A. Morgan Animal nutrition. Edition 5. Longman Group Limited, Harlow, United Kingdom. McElwain, J.C., K.J. Willis & R. Lupia Cretaceous CO 2 decline and the radiation and diversification of angiosperms. In: J. Ehleringer, T.E. Cerling & D. Dearing (Eds.). A history of atmospheric CO 2 and its effects on plants, animals and ecosystems, (Ecological studies, Vol.177). Springer. McMahon, T Size and shape in biology. Science. 179(4079), McNaughton, S.J Grazing lawns: animals in herds, plant form, and coevolution. American Naturalist. 124, 863. McNaughton, S.J. & N.J. Georgiadis Ecology of African grazing and browsing mammals. Annual Review of Ecology, Evolution, and Systematics. 17, Meissner, H.H Theory and application of a method to calculate intake of wild southern African ungulates for purposes of estimating carrying capacity. South African Journal of Wildlife Research. 12(2), Meissner, H.H., E.R. Spreeth, P.A. De Villiers, E.W. Pietersen, T.A. Hugo & B.F. Terblanch Quality of food and ad libitum intake by elephant as measured by lignin index. South African Journal of Wildlife Research. 20(3), Meserve, P.L., D.A. Kelt, W. B. Milstead & J.R. Gutierrez Thirteen years of shifting top-down and bottom-up control. BioScience. 53(7), Meyer, H. and M. Coenen Pferdefütterung. Parey Verlag, Berlin. Mihlbachler, M.C Species taxonomy, phylogeny, and biogeography of the Brontotheriidae (Mammalia: Perissodactyla). Bulletin of the American Museum of Natural History. 311,
121 Moe, S.R. & P. Wegge Effects of deposition of deer dung on nutrient redistribution and on soil and plant nutrients on intensively grazed grasslands in lowland Nepal. Ecological Research. 23, Molvar, E.M. & R.T. Bowyer Costs and benefits of group living in a recently social ungulate: the Alaskan moose. Journal of Mammalogy. 75(3), Mouissie, A.M., R.V. Diggelen, M.E.F. Apol, & G.W. Heil Stability and dimensions of grazing-induced vegetation patterns. In: Seed dispersal by large herbivores: implications for the restoration of plant biodiversity, edited by University of Groningen, Groningen. Mueller-Dombois, D. & H. Ellenberg Aims and Methods of Vegetation Ecology. John Wiley and Sons, Inc., New York. National Research Council Nutrient Requirements of Horses, 5th Rev. Ed. National Academy Press, Washington, DC. Niklas, K.J Plant allometry: is there a grand unifying theory? Biological Reviews. 79, Novellie, P.A Comparison of the foraging strategies of blesbok and springbok on the Transvalal highveld. South African Journal of Wildlife Research. 8, Novozamsky I, V.J.G. Houba, R. Vaneck, & W. Vanvark A novel digestion technique for multi-element plant analysis. Communications in Soil Science and Plant Analysis. 14, Nowak, R. M Walker's Mammals of the World. Fifth Edition. The Johns Hopkins University Press, Baltimore. O Connor, T.G., P.S. Goodman & B.Clegg A functional hypothesis of the threat of local extirpation of woody plant species by elephant in Africa. Biological Conservation. 136, Olff, H., M.E. Ritchie & H.H.T. Prins Global environmental controls of diversity in large herbivores. Nature 415, Owen-Smith, N Niche separation among African ungulates. In: E.S. Vrba (Ed.). Species and speciation. Transvaal Museum Monograph 4. Transvaal Museum, Pretoria. Owen-Smith, N Megaherbivores: the influence of very large body mass on ecology. Cambridge University Press, Cambridge Owen-Smith, N Foraging responses of kudus to seasonal changes in food resources: elasticity in constraints. Ecology. 75(4), Palmer, D. (Ed.) The Marshall Illustrated Encyclopedia of Dinosaurs and Prehistoric Animals. London: Marshall Editions. Palo, R.T., R. Bergstrom & K. Danell Digestibility distribution of phenols and fiber at different twig diameters of birch in winter: implications for browsers. Oikos. 65,
122 Parker, K.L., P.S. Barboza & M.P. Gillingham Nutrition integrates environmental responses of ungulates. Functional Ecology. 23, Pays, O., S. Benhamou, R. Helder & J. Gerard The dynamics of group formation in large mammalian herbivores: an analysis in the European roe deer. Animal Behaviour. 74, Pearson, P. N. & M. R. Palmer Atmospheric carbon dioxide concentrations over the past 60 million years. Nature. 406, Peel, M.J.S., J.M. Kruger & S. MacFadyen Woody vegetation of a mosaic of protected areas adjacent to the Kruger National Park, South Africa. Journal of Vegetation Science. 18, Pendlebury, C., N.E. Odongo, A. Renjifo, J. Naelitz, E.V. Valdes & B.W. McBride Acid-insoluble ash as a measure of dry matter digestibility in captive African elephants (Loxodonta Africana). Zoo Biology. 24, Pérez-Barbería, F.J., D.M. Walker & G. Marion Maximizing intake under challenging foraging conditions at two spatial scales in Soya sheep. Animal Behaviour. 73, Peters, R.H The ecological implications of body mass. Cambridge, England, Cambridge University Press. Pietersen, L.M., H.H. Meissner & E.W. Pietersen Food selection and intake by male impalas in the Timbavati area. Suid-Afrikaanse Tydskrif Natuurnavorsing. 23(1), Power, M.E Top-down and bottom-up forces in food webs: do plants have primacy? Ecology. 73(3), Pringle, J The conservationists and the killers. T.V. Bulpin & Books of Africa, Cape Town. Prins, H.H.T., R.C. Ydenberg & R.H. Drent The interaction of Brent geese Branta bernicla and sea plantain Plantago maritime during spring staging: field observations and experiments. Acta Botanica Neerlandica. 29, Prins, H.H.T The buffalo of Manyara: the individual in the context of herd life in a seasonal environment of East Africa. Ph.D. Thesis, University of Groningen, Groningen, the Netherlands. Prins, H.H.T Buffalo herd structure and its repercussions for individual African buffalo cows. Ethology, 81, Prins, H.H.T Ecology and behaviour of the African buffalo: social inequality and decision making. Wildlife Ecology and Behaviour series 1. Chapman & Hall, London. Prins, H.H.T Origins and development of grassland communities in northwestern Europe. In: M.F. Wallis DeVries, J.P. Bakker & S.E. van Wieren. (Eds.). Grazing and conservation management. Kluwer, Boston. 112
123 Prins, H.H.T. & H. Olff Species-richness of African grazer assemblages: towards a functional explanation. In: D.M. Newberry, H.H.T. Prins & N.D. Brown. (Eds.). Dynamics of tropical communities. The 37 th Symposium of the British Ecological Society. London. Blackwell Science. Prins, H.H.T. & H. Fritz Species diversity of browsing and grazing ungulates: consequences for the structure and abundance of secondary production. In: I. Gordon & H.H.T. Prins. (Eds.). The Ecology of Browsing and Grazing. Springer-Verlag, Berlin. Prins, H.H.T. & I.J. Gordon Introduction: Grazers and browsers in a changing world. In: I. Gordon & H.H.T. Prins (Eds.). The Ecology of Browsing and Grazing. Springer- Verlag, Berlin. Prins, H.H.T. & F. van Langevelde (Eds.) Resource ecology: spatial and temporal dynamics of foraging. Springer, the Netherlands. Prins, H.H.T. & F. van Langevelde. 2008b. Assembling a diet from different places. In: H.H.T. Prins & van Langevelde (Eds.). Resource ecology: spatial and temporal dynamics of foraging. Springer, the Netherlands. Provenza, F.D Postingestive feedback as an elementary determinant of food selection and intake in ruminants. Journal of Range Management. 48, Raubenheimer, D. & S.J. Simpson Integrative models of nutrient balancing: application to insects and vertebrates. Nutrition Research Reviews. 10, Raubenheimer, D. & S.J. Simpson Integrating nutrition: a geometrical approach. Entomologia Experimentalis et Applicata. 91, Raubenheimer, D., S.J. Simpson & D. Mayntz Nutrition, ecology and nutritional ecology: toward an integrated framework. Functional Ecology. 23, Rees, P.A Gross assimilation efficiency and food passage time in the African elephant. African Journal of Ecology. 20(3), Ritchie, M.E. & H. Olff Spatial scaling laws yield a synthetic theory of biodiversity. Nature. 400, Ritchie, M. E. & H. Olff Resource partitioning and biodiversity in fractal environments, with application to dryland communities. In: M. Shachak, J. R. Gosz, A. Perevolotsky & S. T. A. Pickett. (Eds.). Biodiversity in drylands: towards a unified framework. Oxford University Press, Oxford, UK. Robbins, C.T Role of tannins in defending plants against ruminants: reduction in dry matter digestion? Ecology. 68(6), Robbins, C.T Wildlife feeding and nutrition.2 nd Ed. Academic Press, New York, NY. Rooke, T., R. Bergström, C. Skarpe & K. Danell Morphological responses of woody species to simulated twig-browsing in Botswana. Journal of Tropical Ecology. 20,
124 Root, T.L., J.T. Price, K.R. Hall, S.H. Schneider, C. Rosenzweig & J.A. Pounds Fingerprints of global warming on wild animals and plants. Nature. 421, Rucker, R.B Allometric scaling, metabolic size and interspecies comparisons of basal nutritional requirements. Journal of Animal Physiology and Animal Nutrition. 91(3), Rutherford, M.C. & R.H. Westfall Biomes of Southern Africa: an objective categorization. Memoirs of the Botanical Survey of South Africa. 54, Sage, R.F The evolution of C4 photosynthesis. New Phytologist. 161, Sankaran, M., J. Ratnam & N. Hanan Woody cover in African savannas: the role of resources, fire and herbivory. Global ecology and biogeography. 17, Schmidt-Nielsen, K Scaling: Why is animal body mass so important? Cambridge University Press, Cambridge. Schoener, T.W Optimal size and specialization in constant and fluctuating environments; an energy-time approach. Brookhaven Symposium of Biology. 22, Scholes, R.J The influence of soil fertility on the ecology of southern African dry savannas. Journal of Biogeography. 17, Scholes, R.J. & K.G. Mennell Elephant management: a scientific assessment for South Africa. Wits University Press, Johannesburg, South Africa. Seagle, S.W. & S.J. McNaughton Spatial variation in forage nutrient concentrations and the distribution of Serengeti grazing ungulates. Landscape Ecology. 7(4), Searle, K.R., N.T. Hobbs & L.A. Shipley Should I stay or should I go? Patch departure decisions by herbivores at multiple scales. Oikos. 111(3), Searle, K.R., & L.A. Shipley The comparative feeding behaviour of large browsing and grazing herbivores. In: I.J. Gordon & H.H.T. Prins (Eds.). The ecology of browsing and grazing. Springer Series, Ecological Studies. Senft, R.L., M.B. Coughenour, D.W. Bailey, L.R. Rittenhouse, O.E. Sala & D.M. Switft Large Herbivore Foraging and Ecological Hierarchies. BioScience. 37(11), Servello, F Pine vole diet quality in relation to apple tree root damage. Journal of Wildlife Management. 48(2), Seymour, R.S Raising the sauropod neck: it costs more to get less. Biology Letters. 5, Shipley, L. A., J.E. Gross, D.E. Spalinger, N.T. Hobbs & B.A. Wunder The scaling of intake rate in mammalian herbivores. The American Naturalist. 143(6), Shipley, L.A. & D.E. Spalinger Influence of size and density of browse patches on intake rates and foraging decisions of young moose and white-tailed deer. Oecologia. 104,
125 Shipley, L.A., A.W. Illius, K. Danell, N.T. Hobbs & D.E. Spalinger Predicting bite size selection of mammalian herbivores: A test of a general model of diet optimization Oikos. 84(1), Shipley, L. A The influence of bite size on foraging at larger spatial and temporal scales by mammalian herbivores. Oikos. 119, Shoshani, J Understanding proboscidean evolution: a formidable task. TREE. 13(12), Shrader, A.M., N. Owen-Smith & J.O. Ogutu How a mega-grazer copes with the dry season: food and nutrient intake rates by white rhinoceros in the wild. Functional Ecology. 20, Sikes, S.K The natural history of the African elephant. Weidenfeld and Nicolson, London, UK. Simpson, S.J. & D. Raubenheimer A multi-level analysis of feeding behaviour: the geometry of nutritional decisions. Philosophical Transactions of the Royal Society. 342, Skarpe, C., P.A. Aarrestad, H.P. Andreassen, S.S. Dhillion, T. Dimakatso, J.T. du Toit, D.J. Halley, H. Hytteborn, S. Makhabu, M. Mari, W. Marokane, G. Masunga, D. Modise, S.R. Moe, R. Mojaphoko, D. Mosugelo, S. Motsumi, G. Neo-Mahupeleng, M. Ramotadima, L. Rutina, L. Sechele, T.B. Sejoe, S. Stokke, J.E. Swenson, C. Taolo, M. Vandewalle & P. Wegge The return of the giants: ecological effects of an increasing elephant population. Ambio. 33, Skinner, J.D. & H.N. Smithers The mammals of the southern African sub-region. University of Pretoria, South Africa. Smallegange, I.M., J. van der Meer & R.H.J.M. Kurvers Disentangling interference competition from exploitative competition in a crab bivalve system using a novel experimental approach. Oikos. 113, Smallie, J.J. & T.G. O Connor Elephant utilization of Colophospermum mopane: possible benefits of hedging. African Journal of Ecology. 38, Smit, G.N Becvol: Biomass Estimates from Canopy/Volume (Version 2) Users Guide (Unpublished manual). University of Orange Free State, Bloemfontein, South Africa. Snyman, H.A Short-term response of rangeland botanical composition and productivity to fertilization (N and P) in a semi-arid climate of South Africa. Journal of Arid Environments. 50, Solomon, M.E The natural control of vertebrate populations. Journal of Animal Ecology. 18, Spalinger, D.E, T.A. Hanley & C.T. Robbins Analysis of the functional response in foraging in the Sitka black-tailed deer. Ecology. 69,
126 Spalinger, D.E. & N.T. Hobbs Mechanisms of Foraging in Mammalian Herbivores: New Models of Functional Response. The American Naturalist. 140(2), Spedding, C.R.W., R.V. Large & D.D. Kydd The evaluation of herbage species by grazing animals. Proceedings of the 10 th International Grassland Congress, Helsinki, p Stephens, D. W., & J.R. Krebs Foraging theory. Princeton University Press, USA. Stevenson, M.F. & O. Walter Management guidelines for the welfare of zoo animals. Elephants, Loxodonta Africana and Elephas maximus. British and Irish Association of zoos and aquariums. Stewart, D.R.M Analysis of plant epidermis in faeces: A technique for studying the food preference of grazing herbivores. The Journal of Applied Ecology. 4(1), Stobbs, T.H The effect of plant structure on the intake of tropical pastures. I. Variation in the bite size of grazing cattle. Australian Journal of Agricultural Research. 24, Stokke, S Sex differences in feeding patch choice in a megaherbivore: elephants in Chobe National Park, Botswana. Canadian Journal of Zoology, 77, Strohbach, B Vegetation degradation trends in the northern Oshikoto Region: 11. The Colophospermum mopane shrublands. Dinteria. 26, Strömberg, C.A.E Evolution of hypsodonty in equids: testing a hypothesis of adaptation. Paleobiology. 32(2), Styles, C.V. & J.D. Skinner Seasonal variations in the quality of mopane leaves as a source of browse for mammalian herbivores. African Journal of Ecology. 35(3), 254. Styles, C.V. & J.D. Skinner The influence of large mammalian herbivores on growth form and utilization of mopane trees, Colosphermum mopane, in Botswana s northern Tuli game reserve. African Journal of Ecology. 38, Sullivan, T.P., D.S. Sullivan, D.G. Reid & M.C. Leung Weasels, voles and trees: influence of mustelid semiochemicals on vole populations and feeding damage. Ecological Applications 14(4), Tomat, L., B. Schumann, J.L. Atkinson and E.V. Valdes Digestibility studies with captive African elephants (Loxodonta africana). First European Zoo Nutrition Meeting. Rotterdam Zoo Veterinary Faculty of Utrecht, Rotterdam, the Netherlands. Treydte, A.C., I.M.A. Heitkönig & F. Ludwig Modelling ungulate dependence on higher quality forage under large trees in African savannahs. Basic and applied ecology. 10(2), Ullrey, D. E., P.T. Robinson & P.A. Whetter Comparative digestibility studies with zoo herbivores. In: The American Association of Zoo Veterinarians Annual Proceedings, Denver. 116
127 Ullrey, D.E., S.D. Crissey & H.F. Hintz Nutrition advisory group handbook. Elephants: Nutrition and dietary husbandry. Ungar, E.D., A. Genizi & M.W. Detriment Bite dimensions and herbage intake by cattle grazing short hand-constructed swards. Agronomy Journal. 83, Ungar, E.D., N. Ravid & I. Bruckental Bite dimensions for cattle grazing herbage at low levels of depletion. Grass and Forage Science. 56, Van de Koppel, J. & H.H.T. Prins The importance of herbivore interactions for the dynamics of African savanna woodlands: an hypothesis. Journal of Tropical Ecology. 14, Van der Waal, C., H. de Kroon, W.F. de Boer, I.M.A. Heitkönig, A.K. Skidmore, H.J. de Knegt, F. van Langevelde, S.E. van Wieren, R.C. Grant, B.R. Page, R. Slotow, E.M. Kohi, E. Mwakiwa & H.H.T. Prins Water and nutrients alter herbaceous competitive effects on tree seedlings in a semi-arid savanna. Journal of Ecology. 97, Van der Wal, R., N. Madan, S. van Lieshout, C. Dormann, R. Langvatn & S.D. Albon Trading forage quality for quantity? Plant phenology and patch choice by Svalbard reindeer. Oecologia. 123, Van Dijk, J.G.B & Duijns, S Effect of interference competition on the foraging behaviour of mallards (Anas platyrhynchos). Masters thesis, Wageningen University, the Netherlands. Van Langevelde, F., M. Drescher, I.M.A. Heitkönig & H.H.T. Prins Instantaneous intake rate of herbivores as function of forage quality and mass: Effects on facilitative and competitive interactions. Ecological Modelling. 213, Van Langevelde, F.M. & H.H.T. Prins Introduction on resource ecology. In: H.H.T. Prins & F.M. van Langevelde. (Eds.). Resource ecology: spatial and temporal dynamics of foraging. Springer, the Netherlands. Van Soest, P.J Impact of feeding behaviour and digestive capacity on nutritional response. In: Animal genetic resources and management. Proceedings of the fao/unep technical consultation. Food and agriculture organistion of the united nations. Rome. Van Soest, P.J Nutritional ecology of the ruminant, 2 nd edition. Cornell University Press, Ithaca, New York. Van Soest, P.J Allometry and ecology of feeding behavior and digestive capacity in herbivores: A Review. Zoo Biology. 15, Van Wieren, S.E Do large herbivores select a diet that maximizes short-term energy intake rate? Forest Ecology and Management. 88, Venter, F.J., R.J. Scholes & H.C. Eckhardt The abiotic template and its associated vegetation pattern. In: J. du Toit, K. Rogers, and H. Biggs (Eds.). The Kruger Experience. Island Press, Washington DC. 117
128 Verheyden, H., P. Ballon, V. Bernard & C. Saint-Andrieux Variations in bark-stripping by red deer Cervus elaphus across Europe. Mammal Review. 36(3), Verweij, R.J.T., J. Verrelst, P.E. Loth, I.M.A. Heitkönig & A.M.H. Brunstig Grazing lawns contribute to the subsistence of mesoherbivores on dystrophic savannas. Oikos. 114, Vesey-FitzGerald, D.F Grazing succession among East African game animals. Journal of Mammalogy. 41(2), Voeten, M.M. & H.H.T. Prins Resource partitioning between sympatric wild and domestic herbivores in the Tarangire region of Tanzania. Oecologia. 120, Waldram, M.S., W.J. Bond & W.D. Stock Ecological engineering by a mega-grazer: white rhino impacts on a South African savanna. Ecosystems. 11, Walker, B.H An approach to the monitoring of changes in the composition and utilization of woodland and savanna vegetation. South African Journal of Wildlife Research. 6, Wallace, L.L., M.G. Turne, W.H. Romme, R.V. O Neill & Y. Wu Scale of heterogeneity of forage production and winter foraging by elk and bison. Landscape Ecology. 10(2), WallisDeVries, M.F., E.A. Laca & M.W. Demment From feeding station to patch: scaling up food intake measurements in grazing cattle. Applied Animal Behaviour Science. 60, WallisDeVries, M.F., E.A. Laca & M.W. Demment The importance of scale of patchiness for selectivity in grazing herbivores. Oecologia. 121, Waterman, P. G., & S. Mole Analysis of phenolic plant metabolites. Blackwell Scientific, Oxford, UK. Weir, J.S Chemical properties and occurrence on Kalahari sand of salt licks created by elephants. Journal of Zoology. 158, Weiss, W.P Predicting energy values of feeds. Journal of Dairy Science. 76(6), West, G.B., J.H. Brown & B.J. Enquist A general model for the origin of allometric scaling laws in biology. Science. 276, West, G.B. & J.H. Brown Life s universal scaling laws. Physics Today p West, G.B. & J.H. Brown The origin of allometric scaling laws in biology from genomes to ecosystems: towards a quantitative unifying theory of biological structure and organization. The Journal of Experimental Biology. 208, Westoby, M An analysis of diet selection by large generalist herbivores. The American Naturalist. 108(961),
129 White, T.C.R The importance of a relative shortage of food in animal ecology. Oecologia. 33, White, G.C Analysis of frequency count data using the binomial distribution. Ecology. 77(8), White, C.R. & R.S. Seymor Does basal metabolic rate contain a useful signal? Mammalian BMR allometry and correlations with a selection of physiological ecological, and life-history variables. Physiological and biochemical zoology. 77(6), Whitney-Smith, E The evolution of an ecosystem: Pleistocene extinctions. In: A.A. Minai & Y. Bar-Yam (Eds.). Unifying themes in complex systems IV, Proceedings of the fourth international conference on complex systems. Springer, Berlin Heidelberg. Wiens, J.A Spatial scaling in ecology. Functional Ecology. 3(4), Williamson, B.R The condition and nutrition of elephant in Wankie National Park. Arnoldia. 7, Wilmhurst, J.F., J.M. Fryxell & R.J. Hudson Forage quality and patch choice by wapiti (Cervus elaphus). Behavioural Ecology. 6, Wilson, S.L. & G.I.H. Kerley Bite diameter selection by thicket browsers: the effect of body mass and plant morphology on forage intake and quality. Forest Ecology and Management. 181, Wiseman, R., B.R. Page & T.G. O Connor Woody vegetation change in response to browsing in Ithala Game Reserve, South Africa. South African Journal of Wildlife Research. 34(1), Ydenberg, R.C. & H.H.T. Prins Spring grazing and the manipulation of food quality by Barnacle geese. Journal of Applied Ecology. 18, Yearsley, J., B.J. Tolkamp & A.W. Illius Theoretical developments in the study and prediction of food intake. Proceedings of the Nutrition Society. 60, Yokoyama, S., I. Maeji, T. Ueda, M. Ando & E. Shibata Impact of bark stripping by sika deer, Cervus nippon, on subalpine coniferous forests in central Japan. Forest Ecology and Management. 140, Zambatis, N., P.J.K. Zacharias, C.D. Morris & J.F. Derry Re-evaluation of the disc pasture meter calibration for the Kruger National Park, South Africa. African Journal of Range and Forage Science. 23(2),
130 SUMMARY Introduction Large mammalian herbivores utilize about half of the earth s land surface and contribute significantly to the survival and well-being of the human race, whether it is through consumption or admiration. Predicting the distribution of large herbivore species, either for the purpose of conservation or management, requires an understanding of the mechanisms of resource use by these species. Historically, many studies used a descriptive approach to determine herbivore diet and habitat use. Subsequently, with the development of optimal foraging theory around the 1970s, the field of foraging ecology became more theoretical and researchers started using experimentation to determine the mechanisms behind the individual components of foraging. However, up until recently optimal foraging theory did not address the issue of scale. Small scale foraging decisions by herbivores have been shown to significantly alter their large scale distribution patterns. By focusing on the mechanisms driving small scale foraging by large herbivores, this study attempts to determine how large herbivores are adapted and able to satisfy their nutritional requirements at scales ranging from bites to the daily foraging range. More specifically, the following research questions are addressed: - Do instantaneous intake rates scale with metabolic requirements and if so how are large herbivores adapted to achieve these rates? - Within the daily foraging range, at pre-determined scales, are large herbivores able to select grains with the highest concentration of nutrients irrespective of the heterogeneity of patches within grains and if so, are they able to select nutrient rich grains at smaller scales? - Which of the following animal characteristics best determine the spatial scale at which herbivores aim to maximize their nutrient intakes: body mass, mouth morphology, herd size and gastro-intestinal tract type? - How is a herbivore, of a specific body mass, able to satisfy its daily nutrient requirements and does a herbivore maximize the intake of specific nutrients beyond satisficing its daily metabolic requirements? To answer these questions field experiments were set-up and data collected on wild large herbivores in the northern parts of the South African savanna. Adaptations at the bite scale Allometric scaling relationships of body mass (BM) provide a powerful but relatively simple tool to explain foraging mechanisms. I hypothesized that bite mass and instantaneous intake rate (IR) of large herbivores should scale isometrically with body mass, but when digestibility is incorporated in the calculation of IR, IR should scale to metabolic rate as BM 0.75, following 120
131 Kleiber s allometry. However, allometric mass-space relationships in plants indicate that leaf:stem ratios of plants decrease as volume increase and that the average number of plants per unit space decreases as average plant mass increase. The implications of these relationships for large herbivores is that if mouth size scales linearly with body mass, megaherbivores will not be able to satisfy their requirements. Therefore, I further hypothesized that intra-dental mouth volume, determined as the product of incisor width, muzzle width and jaw length, should scale linearly with body mass and that the volume added by soft mouth parts such as lips and tongue, should increase total bite volume to scale larger than one with body mass. To test the hypothesis, mouth morphological measurements were collected from carcasses and immobilized large African herbivores covering a body mass range of three orders magnitude. Bite masses and intake rates were determined from foraging observations on the same range of species in the wild. Results confirmed the hypotheses and revealed that the elongated soft mouth parts of mega-herbivores are responsible for that fact that bite volume scales to body mass, as BM 1.7, hence with a constant larger than 1. I conclude by hypothesizing that past extinctions of mega-herbivores occurred because these herbivores did not have suitable mouth morphologies to cope with the dilution of food resources in space. Scaling patch selection Spatial scale is characterized by grains size, which is the smallest measurement unit used at a specific scale, and extent, which includes the total area of interest. Patches are resource locations that are more or less homogenous in their plant species composition, biomass and quality. More over, patches can vary in size and number within or beyond the specified grain size of a chosen scale. Using a novel approach, I set-up a large fertilization experiment at a pre-defined spatial scale of grain size 2500 m 2 and an extent of 30 hectares. Within each 2500 m 2 plot (grain), I fertilized patches at one of three size (4 m 2, 100 m 2, 2500 m 2 ) and one of three local nutrient concentrations (1.2 g N/ m 2, 6 g N/ m 2, 30 g N/ m 2 ). These combinations resulted in three total nutrient loads per 2500 m 2 plot (0.6 ton N, 3 ton N, 15 ton N). Through measuring elephant utilization of trees I tested whether elephants could select the plots with the highest total nutrient loads, irrespective of the number of patches, patch sizes and patch nutrient concentrations in each plot. Further, I tested whether elephants were able to select nutrient rich patches at even smaller scales, and whether the type of impact on trees differed between nutrient rich and poor patches. My results showed that at a spatial scale with a grain size of 2500 m 2, elephant are able to select grains with the highest total nutrient loads and can even do so at smaller scales. More over, uprooting of trees occurred more outside nutrient rich patches, whereas leaf utilization was more common inside these patches. This means that elephant foraging behaviour can be 121
132 used as indicators of changes in the availability of nutrients. Hence, the findings of this research shed some light on how future studies should interpret patch selection by herbivores at different scales. Determinants of the scale of intake Body mass is probably the best studied animal characteristic and a reliable universal predictor of foraging behaviour in herbivores. Other foraging characteristics, which are essentially functions of body mass, and that have been recognised to significantly influence large herbivore foraging, include mouth size, herd size and gastro-intestinal tract type. Although the functions of these characteristics are well understood, how they affect a herbivore s response to spatial heterogeneity in forage resource distribution is less clear. I analysed how body mass, mouth size, digestive system type and herd size affect selection of the spatial scale at which herbivores select nutrient rich patches to maximize intake. I hypothesized that smaller animals, animals occurring in large herds, and ruminant species select areas of high nutrient concentration at small spatial scales, whereas small-mouthed animals select areas with high nutrient content at larger spatial scales. Data on spoor and dung counts of large herbivores visiting the large scale fertilization experiment described before were used to test these hypotheses. I found that large animals selected areas of high nutrient concentration at larger spatial scales, whereas the abundance of ruminants decreased as nutrient concentrations at large scales increased. As for individual species, duiker, warthog and elephant selected for high nutrient concentrations at large scales while buffalo, zebra and impala did so at the local point scale. From the response of individual species it seems as though herd living animals maximize nutrient intake at the local point scale in stead of at larger scales, possible due to intra-specific competition. Satisfying large herbivore requirements Classical optimal foraging models only use energy as the currency of maximization. However, in reality animals have to satisfy requirements for multiple nutrients. Although recent studies have recognized this fact, some disparity still exists on whether animals aim to only satisfy daily nutrient requirements or whether the intake of particular nutrients is maximized. Using linear programming techniques I tested which strategies best explain the daily diets of African elephant. I used daily requirements of the macro-nutrients nitrogen, phosphorous, potassium, sodium, calcium, magnesium and metabolizable energy from literature as constraints in the model, and incorporated availability of each potential forage species in the study area as the amount of nutrients and metabolizable energy available per plant that could be gained, taken into account the amount of energy that is required to find each species. Surprisingly, results from the model show that elephant use different optimization currencies, depending on the 122
133 time of year and hence the availability of resources. Energy intake is maximized during the dry season possibly due to changes in water availability and forage abundance in the environment. During the wet season when food becomes more abundant and energy requirements are satisfied easier, elephant maximize nitrogen intake for growth and reproduction. Conclusion Results from this study not only re-confirm the effects of the universal scaling of metabolic rate as BM 0.75 on foraging of large herbivores, but also provides new insights for how especially mega-herbivores are adapted to cope with the heterogeneity in the spatial distribution of their forage resources. Moreover, from the main theme of this study on the mechanisms of small scale foraging by large herbivores, new questions for future research emerged, including: - What are the morphological adaptations required by animals in relation to body mass to cope with the effects of climate change? - Is the body mass range of extant large herbivore species, which tend to aggregate together in large numbers, a reflection of a greater forage resource availability at small spatial scales compared to herbivores with body masses outside of this range? I conclude that size, as a characteristic which includes mass and morphology, matters because it first of all determines whether an herbivore will be able to survive in a particular landscape and secondly, whether herbivores are able to aggregate together or not which further determines the spatial scale at which nutrient intake will be maximized. 123
134 SAMENVATTING Dutch summary Introduction Grote zoogdierlijke herbivoren komen voor op ongeveer de helft van het landoppervlak van de Aarde en dragen bij aan de overleving en het welzijn van het menselijke ras, zowel door middel van consumptie als door waardering. Het voorspellen van de verspreiding van grote herbivoren, ofwel voor natuurbescherming of voor beheer, vereist een goed begrip van de mechanismen waarmee deze soorten voedselbronnen gebruiken. Historisch gezien hanteren veel studies een beschrijvende aanpak om het dieet en habitat gebruik van herbivoren te bepalen. Na de totstandkoming van de optimaal foerageren theorie in the jaren 1970, werd het vakgebied ecologie meer theoretisch georiënteerd en begonnen onderzoekers met experimenten om de mechanismen achter de verschillende componenten van foerageren vast te stellen. Echter, tot voorkort besteedde de optimaal foerageren theorie geen aandacht aan de kwestie van schaal. Kleinschalige foerageer beslissingen door herbivoren kunnen een enorme invloed hebben op hun verspreidingspatroon op grote schaal. Door te focussen op de mechanismen achter het foerageren van herbivoren op en kleine schaal probeert dit onderzoek vast te stellen hoe grote herbivoren zijn aangepast en in staat zijn om hun nutritionele behoeften te voldoen op schalen variërend van een hap tot aan hun dagelijks verspreidingsgebied. Meer specifiek, de volgende onderzoeksvragen komen aan bod: - Schalen instantane voedselinname snelheden met metabolische behoeften, en zo ja, hoe zijn grote herbivoren aangepast om deze snelheden te bereiken? - Binnen het dagelijks verspreidingsgebied, op vooraf vastgestelde schalen, zijn grote herbivoren in staat om korrels met de hoogste concentratie van nutriënten, ongeacht de heterogeniteit van patches binnen korrels te selecteren, en zo ja, zijn ze in staat om nutriëntrijke korrels op kleinere schalen te selecteren? - Welke van de volgende kenmerken bepalen het beste de ruimtelijke schaal waarop herbivoren ernaar streven hun inname van nutriënten te maximaliseren: lichaamsgewicht, mond morfologie, kudde grootte of het type van het maag-darmkanaal? - Hoe is een herbivoor, met een specifiek lichaamsgewicht, in staat om aan haar dagelijkse nutritionele behoeften te voldoen en maximaliseert een herbivoor de inname van specifieke nutriënten meer dan zij nodig heeft om in haar dagelijkse behoefte te voldoen? Om deze vragen te beantwoorden werden veldexperimenten opgezet en gegevens verzameld over wilde herbivoren in de noordelijke delen van de Zuid-Afrikaanse savanne. 124
135 Aanpassingen op schaal van een hap Allometrische schaalrelaties van lichaamsgewicht (BM) bieden een krachtige maar relatief eenvoudige mannier om foerageer mechanismen te verklaren. Ik had als hypothese dat hap grootte en instantane opname snelheid (IR) van grote herbivoren isometrisch zullen schalen met een lichaamsgewicht, maar als verteerbaarheid wordt opgenomen in de berekening van IR, zal IR schalen naar stofwisseling als BM 0.75, zoals Kleiber's allometrie. Echter, allometrische gewicht-volume verhoudingen van planten geven aan dat de blad:stengel ratio van planten afneemt met toenemend volume en dat het gemiddeld aantal planten per eenheid ruimte daalt als het gemiddelde gewicht van planten hoger wordt. De implicatie van deze relaties voor grote herbivoren is dat als mond grootte lineair schaalt met een lichaamsgewicht, mega-herbivoren niet in staat zullen zijn om aan hun behoeften te voldoen. Daarom had ik de hypothese dat intra-tand mond volume, bepaald als het product van snijtand breedte, mond breedte en lengte van de kaak, lineair zal schalen met lichaamsgewicht en dat het volume dat wordt toegevoegd door zachte monddelen zoals de lippen en de ton, het totale hap volume zal doen toenemen zodat het groter schaalt dan 1 met lichaamsgewicht. Om deze hypothese te testen, werden mond morfologische metingen gedaan van karkassen en geïmmobiliseerd grote Afrikaanse herbivoren, over een reeks in lichaamsgewicht die meer dan drie orders van grootte spant. Hap massa en inname snelheid waren vastgesteld op basis van foerageer observaties van dezelfde soorten in het wild. De resultaten bevestigen de hypothesen en lieten zien dat de langwerpige zachte monddelen van mega-herbivoren verantwoordelijk zijn voor het feit dat hap volume schaalt met lichaamsgewicht, als BM 1.7, dus met een constante groter dan 1. Ik sluit af met de verwachting dat er in het verleden uitsterving van mega-herbivoren optrad omdat deze herbivoren een ongeschikte mond morfologie hadden om goed om te kunnen gaan met de verdunning van voedselbronnen in de ruimte. Het schalen van patch selectie Ruimtelijke schaal wordt gekenmerkt door korrelgrootte, dat is de kleinste meeteenheid die gebruikt wordt op een bepaalde schaal, en de uitgestrektheid, namelijk de oppervlakte van het totale gebied. Patches zijn locaties met resources die min of meer homogeen zijn in hun planten soortensamenstelling, biomassa en kwaliteit. Bovendien kunnen patches variëren in grootte en aantal ten opzichte van de korrelgrootte van een gekozen schaal. Met behulp van een nieuwe benadering heb ik een groot bemestingsexperiment opgestart, met een vooraf bepaalde ruimtelijke schaal wat betreft korrelgrootte van 2500 m 2 en een omvang van 30 hectare. Binnen elk 2500 m 2 plot (korrelgrootte), bemestte ik patches met een van de drie groottes (4 m 2, 100 m 2, 2500 m 2 ) en een van de drie lokale concentraties nutriënten (1,2 g N / m 2, 6 g N / m 2, 30 g N / m 2 ). Deze combinaties resulteerde in drie totale nutriënten 125
136 hoeveelheden per 2500 m 2 plot (0,6 ton N, 3 ton N, 15 ton N). Door het meten van het gebruik van bomen door olifanten heb ik getest of olifanten de plots met de hoogste totale nutriënten hoeveelheid zouden kiezen, ongeacht het aantal patches, patch grootte en patch nutriënten concentraties in elk plot. Verder testte ik of de olifanten in staat waren om nutriëntrijke patches te selecteren op nog kleinere schalen, en of de aard van de gevolgen voor de bomen verschilden tussen nutriëntarme en nutriëntrijke patches. Mijn resultaten toonden aan dat, op een ruimtelijke schaal met een korrelgrootte van 2500 m 2, olifanten in staat zijn om korrels met de hoogste totale nutriënten hoeveelheid te selecteren, en dat ze dit zelfs kunnen op kleinere schalen. Bovendien kwam ontworteling van bomen meer voor buiten nutriëntrijke patches, terwijl consumptie van blad meer gebruikelijk was binnen deze patches. Dit betekent dat het foerageergedrag van olifanten kan worden gebruikt als indicator voor veranderingen in de beschikbaarheid van voedingsstoffen. De bevindingen van dit onderzoek werpen dus enig licht op hoe toekomstige studies patch selectie door herbivoren moeten interpreteren op verschillende schalen. Determinanten van de schaal van inname Lichaamsgewicht is waarschijnlijk de best bestudeerde karakteristiek van dieren en een universele en betrouwbare voorspeller van het foerageergedrag van herbivoren. Andere foerageer kenmerken, die in wezen functies zijn van het lichaamsgewicht en die een grote invloed hebben op het foerageren van herbivoren, zijn grootte van de mond, grootte van de kudde en het type maag-darmkanaal. Hoewel de functies van deze kenmerken al goed worden begrepen, is de invloed van deze kenmerken op de reactie van een herbivoor op de ruimtelijke heterogeniteit in de verspreiding van voedsel minder duidelijk. Ik analyseerde daarom hoe lichaamsgewicht, mond grootte, het type spijsvertering en grootte van de kudde invloed hebben op de selectie van de ruimtelijke schaal waarop herbivoren nutriëntrijke patches selecteren om nutriënt inname te maximaliseren. Ik veronderstelde dat kleinere dieren, dieren in grote kuddes en herkauwers gebieden selecteren met een hoge concentratie voedingsstoffen op kleine ruimtelijke schalen, terwijl dieren met een kleine mond gebieden selecteren met een hoog gehalte aan nutriënten op een grotere ruimtelijke schaal. Gegevens over sporen en feces van grote herbivoren in het grootschalige bemestingsexperiment zoals eerder beschreven werden gebruikt om deze hypothesen te testen. Ik vond dat grote dieren gebieden selecteerden met een hoge concentratie nutriënten op grotere ruimtelijke schalen, terwijl het aantal herkauwers daalde naarmate de nutriënt concentratie op grote schaal toenam. Duikers, wrattenzwijnen en olifanten selecteerden hoge concentraties nutriënten op een grote schaal, terwijl buffels, zebra's en impala s dit deden op een lokale schaal. Uit de respons van individuele soorten lijkt het alsof kudde dieren 126
137 nutriëntinname maximaliseren op de lokale schaal in plaats van op grotere schaal, mogelijk als gevolg van binnen-soortelijke concurrentie. Het voldoen aan de behoeften van grote herbivoren Klassieke optimaal foerageer modellen gebruiken alleen energie als de eenheid van maximalisatie. Echter, in werkelijkheid moeten dieren voldoen aan de behoefte voor meerdere nutriënten. Hoewel recente studies dit feit erkennen, bestaat er nog steeds enige ongelijkheid over de vraag of dieren het doel hebben om alleen aan de dagelijkse behoeften te voldoen dan wel de inname van bepaalde nutriënten te maximaliseren. Met behulp van lineaire programmering testte ik welke strategieën het beste het dagelijkse dieet van de Afrikaanse olifant verklaren. Ik gebruikte de dagelijkse behoeften voor de macro-nutriënten stikstof, fosfor, kalium, natrium, calcium, magnesium en metaboliseerbare energie uit de literatuur als beperkingen in het model, en introduceerde de beschikbaarheid van elke plantensoort in het studiegebied als de hoeveelheid nutriënten en metaboliseerbare energie die beschikbaar is per plant en die kan worden geconsumeerd, rekening houdend met de hoeveelheid energie die nodig is om elke soort te vinden. Verrassend genoeg blijkt uit de resultaten van het model dat olifanten gebruik maken van verschillende optimalisatie eenheden, afhankelijk van de tijd in het jaar en daarmee de beschikbaarheid van voedselbronnen. Energie-inname wordt gemaximaliseerd tijdens het droge seizoen, mogelijk als gevolg van veranderingen in de beschikbaarheid van water en planten in de omgeving. Tijdens het natte seizoen, wanneer voedsel overvloediger wordt en aan energiebehoeften makkelijker wordt voldaan, maximaliseren olifanten de inname van stikstof voor groei en voortplanting. Conclusie De resultaten van deze studie bevestigen niet alleen opnieuw de effecten van het universeel schalen van metabolische activiteit als BM 0.75 op het foerageergedrag van grote herbivoren, maar bieden ook nieuwe inzichten voor de wijze waarop vooral mega-herbivoren zijn aangepast voor het omgaan met heterogeniteit in de ruimtelijke verspreiding van voedselbronnen. Bovendien, uit het hoofdthema van deze studie over de mechanismen van kleinschalig foerageren door grote herbivoren zijn nieuwe vragen voor toekomstig onderzoek naar voren gekomen, waaronder: - Wat zijn de morfologische aanpassingen van dieren in relatie tot lichaamsgewicht voor het omgaan met de gevolgen van klimaatsverandering? - Is de spreiding in het lichaamsgewicht van uitgestorven grote herbivoren, die vaak in grote aantallen aggregeerden, een weerspiegeling van een grotere beschikbaarheid van voedselbronnen op kleine ruimtelijke schalen in vergelijking met herbivoren met een ander lichaamsgewicht? 127
138 Ik concludeer dat grootte, als een kenmerk dat gewicht en morfologie omvat, van belang is, omdat het zaken bevat die in de eerste plaats bepalen of een herbivoor in staat zal zijn te overleven in een bepaald landschap en, in de tweede plaats, of herbivoren al dan niet zullen aggregeren, wat weer de ruimtelijke schaal waarop nutriëntinname zal worden gemaximaliseerd beïnvloed. 128
139 129
140 SAMEVATTING - Afrikaans summary Inleiding Groot soogdier herbivore benut die helfte van die aarde se land oppervlakte en dra grotendeels by tot die welvaart en oorlewing van die mens, of dit nou is deur te dien as n bron van voedsel of deur blote bewondering. Vir navorsing en bestuur vereis die voorspelling van groot herbivoor verspreiding n begrip van die meganismes wat die benutting van hul natuurlike hulpbronne dryf. Histories het die meeste studies n beskrywende benadering gebruik om herbivore se dieet en habitat benutting te bepaal. Vervolgens, met die ontwikkeling van die optimale voedingsteorie rondom 1970, het die veld van voedingsekologie meer teoreties begin raak en het navorsers meer eksperimentering begin gebruik om die meganismes agter die individuele komponente van voeding te bepaal. Ten spyte hiervan het die optimale voedings teorie tot onlangs nie die kwessie van skaal aangespreek nie. Kleinskaalse voedingskeuses deur herbivore is aangetoon om hul grootskaalse verspreidingspatrone merkwaardig te beinvloed. Deur te fokus op die meganismes wat kleinskaalse voeding van groot herbivore dryf, probeer die huidige studie om vas te stel hoe groot herbivore aangepas is en hoe dit moontlik is om hul voedingsbehoeftes te bevredig by skale wat strek vanaf individuele happe tot die daaglikse voedingsarea. Meer spesifiek sal die volgende navorsingsvrae aangespreek word: - Kan oombliklike tempos van inname voorspel word deur metaboliese behoeftes en indien wel hoe is groot herbivore aangepas om hierdie tempos te bereik? - Binne die daaglikse voedingsruimte en by n vooraf bepaalde skaal, is groot herbivore instaat om areas met die hoogste konsentrasies nutriente onafhanklik van die heterogeniteit van posisies binne daardie areas te selekteer en indien wel is hulle instaat om dieselfde op kleiner skale te doen? - Watter van die volgende dierlike eienskappe bepaal die ruimtelike skaal waarby herbivore mik om hul nutrient innames te maksimiseer die beste: liggaamsmassa, mond morfologie, kudde grootte en/ tipe verteringsstelsel? - Hoe is n herbivoor met n spesifieke liggaamsmassa instaat om sy daaglikse nutrient behoeftes te bevredig en behalwe vir die bevrediging van daaglikse metaboliese behoeftes, probeer herbivore om inname van ander spesifieke nutriente te maksimiseer? Om hierdie vrae te beantwoord is veld eksperimente opgestel en data versamel op wilde groot herbivore in die noordelike dele van die Suid-Afrikaanse savanna. Aanpassings by die skaal van individuele happe Allometriese skaal verhoudings van liggaamsmassa (LM) voorsien n kragtige maar relatief eenvoudige manier om voedingsmeganismes te verduidelik. Ek stel deur n hipotese voor dat 130
141 hapmassa en die oombliklike tempo van inname (IT) van groot herbivore isometries moet skaal met liggaamsmassa maar dat as verteerbaarheid in ag geneem word in die berekening van IT, IT behoort te skaal met die tempo van metabolisme volgens Kleiber se allometrie (LM 0.75 ). Aan die ander kant, dui allometriese massa-ruimte verhoudings in plante daarop dat blaar:stingel verhoudings van plante afneem soos wat volume toeneem en dat die gemiddelde hoeveelheid plante per eenheid ruimte afneem soos wat gemiddelde plant massa toeneem. Die gevolge van hierdie verhoudings vir groot herbivore is dat indien mondgrootte liniêr met liggaamsmassa toeneem, mega-herbivore nie hul behoeftes sal kan bevredig nie. Daarom stel ek met n volgende hipotese voor dat intra-dentale mondvolume wat bepaal word deur die produk van snytand wydte, snoet wydte en kaakbeen lengte, liniêr moet toeneem met liggaamsmassa en dat die volume wat bygevoeg word met sagte monddele soos lippe en die tong, die totale hap volume sal laat toeneem sodat dit met n faktor groter as een tot liggaamsmassa skaal. Hierdie hipotesis is getoets deur mond morfologiese metings te versamel vanaf karkasse en geimmobiliseerde groot Afrika herbivore wat in totaal n liggaamsmassa reeks van meer as drie ordes gedek het. Hap massas en inname tempos is vasgestel vanaf voedingswaarnemings op dieselfde reeks grootte herbivoor spesies in die veld. Resultate bevestig die hipotesis en openbaar verder dat die verlengde sagte monddele van mega-herbivore verantwoordelik is vir die feit dat hap volume skaal tot liggaamsmassa as LM 1.7 en dus met n faktor groter as een. Ek kom tot gevolgtrekking met n verdere hipotese wat uitspel dat uitsterwings van megaherbivore in die verlede plaasgevind het omrede hierdie diere nie geskikte mond morfologiese aanpassings gehad het om die verdunning van hul voedingsbronne in ruimte te kon hanteer nie. Skaling van posisie seleksie Ruimtelike skale word gekenmerk deur graan grootte wat die kleinste metingseenheid is wat gebruik word vir n spesifieke skaal en area grootte wat die totale area van toepassing insluit. Kolle in die konteks van hierdie studie is plekke waar voedingsbronne min of meer homogeen is in hul plant spesies samestelling, biomassa en kwaliteit. Daarby kan kolle varieer in grootte en hoeveelheid binne of verby die wydte en breedte van die vooraf bepaalde graan grootte van die gekose skaal. Met n nuwe benadering het ek in hierdie studie n groot skaalse bemestingsprojek gebruik met n vooraf bepaalde ruimtelike skaal van graan grootte 2500 m 2 en n area grootte van 30 hektaar. Binne elke 2500 m 2 plot (graan) het ek kolle bemes by een van drie groottes (4 m 2, 100 m 2, 2500 m 2 ) en een van drie lokale nutrient konsentrasies (1.2 g N/ m 2, 6 g N/ m 2, 30 g N/ m 2 ). Hierdie kombinasies het gelei tot drie totale nutrient vragte per 2500 m 2 plot (0.6 ton N, 3 ton N, 15 ton N). Deur die benutting van bome deur olifante te meet het ek getoets of olifante die plotte kon selekteer met die hoogste totale nutrient vragte, 131
142 ongeag die hoeveelheid kolle, kol grootte en die nutrient konsentrasie van kolle in elke plot. Verder het ek getoets of olifante in staat was om die nutrient ryke kolle by selfs kleiner skale kon selekteer en of die tipe impak op bome verksil tussen nutrient ryk en arm kolle. My resultate dui daarop dat olifante in staat is om die plotte (grane) met die hoogste totale nutrient vragte by ruimtelike skale met n graan grootte van 2500 m 2 of selfs kleiner te selekteer. Bo en behalwe hiervoor het die ontworteling van bome meer buite nutrient ryke kolle plaas gevind terwyl die benutting van blare meer binne hierdie kolle geskied het. Dit beteken dat olifant voedingsgedrag gebruik kan word as n indikator van veranderings in die beskikbaarheid van nutriente. Hiermee bied die vindinge van hierdie navorsing meer duidelikheid vir toekomstige studies oor hoe om die seleksie van nutrient kolle deur herbivore by verskillende skale te intrepeteer. Bepalende faktore vir die skaal van inname Liggaamsmassa is sekerlik die bes bestudeerde dierlike eienskap en n betroubare universele voorspeller vir die voedingsgedrag van herbivore. Ander voedingseienskappe wat in werklikheid funksies van liggaamsmassa is en wat erken is om voeding van groot herbivore merkwaardig te beïnvloed sluit mondgrootte, kudde grootte en spysverteringstelsel tipe in. Alhoewel die funksies van hierdie eienskappe welom bekend is, is die manier waarop hulle n herbivoor se reaksie teenoor die ruimtelike heterogeniteit van voedingsbron verspreiding beïnvloed minder duidelik. Ek het bepaal hoe liggaamsmassa, mondgrootte, spysverteringstelsel tipe en kudde grootte die ruimtelike skaal waarby herbivore nutrient ryke kolle kies om hul innames te maksimiseer beïnvloed. Ek het voorgestel dat kleiner diere, diere wat in groot troppe voorkom en herkouer spesies areas selekteer met hoë nutrient konsentrasies by klein ruimtelike skale waar andersins diere met klein monde areas selekteer met hoë nutrient konsentrasies by groter ruimtelike skale. Data van spoor en mis tellings van groot herbivore wat die groot skaalse bemestingseksperiment wat hierbo beskryf is besoek het was gebruik om die hipotese te toets. Ek het gevind dat groot herbivore areas met hoë nutrient konsentrasies by groter ruimtelike skale selekteer terwyl die hoeveelheid herkouers afgeneem het onder hierdie kondisies. Wat die individuele spesies betref het duikers, vlakvarke en olifante areas met hoë nutrient konsentrasies by groot skale geselekteer waarteenoor buffels, zebras en rooibokke nutrient ryke areas geselekteer het by die lokale punt skaal. Vanuit die reaksie van individuele spesies lyk dit asof trop lewende diere nutrient inname maksimiseer by die lokale punt skaal moontlik as gevolg van intra-spesifieke kompetisie. 132
143 Versadiging van groot herbivoor behoeftes Klassieke modelle oor die optimale voedingsteorie gebruik slegs energie as die eenheid vir maksimisering. Nietemin, moet diere in die werklikheid behoeftes vir verskeie nutriente bevredig. Alhoewel meer huidige studies hierdie feit erken bestaan daar nog onduidelikheid oor of diere daarop mik om slegs daaglikse behoeftes te bevredig en of die inname van spesifieke nutriente gemaksimiseer word. Deur gebruik te maak van liniere programmeringstegnieke het ek getoets watter strategieë die daaglikse dieet van die Afrika olifant die beste verduidelik. Ek het die daaglikse behoeftes vir die makro nutriente stikstof, fosfor, kalium, natrium, kalsium, magnesium en metaboliseerbare energie vanuit literatuur geneem en gebruik as beperkings in die model en het verder die beskikbaarheid van elke potensiële voer spesie in die studie area geinkorporeer as die hoeveelheid nutriente en metaboliseerbare energie wat gewin kon word per plant met inagname van die hoeveelheid energie wat benodig word om elke plantspesie te vind. Onverwags het die resultate van die model daarop gedui dat olifante verskillende optimiseringseenhede gebruik afhangende van die tyd van die jaar en dus die beskikbaarheid van voedselbronne. Energie inname word gemaksimiseer gedurende die droë seisoen moontlik as gevolg van veranderinge in die beskikbaarheid van water en voer in die omgewing. Gedurende die nat seisoen wanneer voer meer beskikbaar raak en energie behoeftes makliker versadig kan word maksimiseer olifante hul stikstof innames om te groei en te reproduseer. Gevolgtrekking Resultate van hierdie studie herbevestig nie net die uitwerking van die universele skaling van metaboliese tempo as LM0.75 op die voeding van groot herbivore het nie, maar verskaf ook nuwe insig oor hoe veral mega-herbivore aangepas is om die heterogeniteit in die verspreiding van hul voedselbronne te hanteer. Vanuit die hoof tema van hierdie studie oor die meganismes agter die klein skaalse voedingskeuses van groot herbivore ontstaan nuwe vrae vir toekomstige navorsing insluitende: - Watter morfologiese aanpassings is noodsaaklik vir diere in verhouding tot hul liggaamsmassas om die uitwerking van klimaatveranderings te kan hanteer? - Is die liggaamsmassa reeks van bestaande herbivoor spesies wat tipies saamdrom in groot getalle, n refleksie van hoër voedingsbron beskikbaarheid by klein skale in vergelyking met herbivore met liggaamsmassas buite hierdie reeks? Ek kom tot die gevolgtrekking dat grootte as n eienskap wat massa en morfologie insluit saak maak omdat dit eerstens bepaal of n herbivoor kan oorleef in n spesifieke landskap of nie en tweedens of herbivore kan saam drom of nie wat verder die ruimtelike skaal waarby nutrient innames gemaksimiseer word bepaal. 133
144 134
145 AFFILIATION OF COAUTHORS Resource Ecology Group, Wageningen University*: H.J. de Knegt, PhD candidate Dr. I.M. Heitkönig, lecturer E. Kohi, PhD candidate K. Kortekaas, MSc E. Mwakiwa, PhD candidate C. van der Waal, PhD candidate Dr.ir. F. van Langevelde, lecturer Dr. S.E. van Wieren, lecturer M. van Wijngaarden, MSc *(Droevendaalsesteeg 3a, 6708 PB, Wageningen, the Netherlands) Systems and Control Group, Wageningen University*: Dr.ir. J.D. Stigter, lecturer *(Droevendaalsesteeg 1, 6708 PB, Wageningen, the Netherlands) International Institute for Geo-information Science and Earth Observation * : N. Knox, PhD candidate Prof. Dr. A.K. Skidmore, head of department of Natural Resources *(PO Box 6, 7500 AA, Enschede, the Netherlands) Department of Experimental Plant Ecology, Radboud University Nijmegen*: Prof. Dr. H. de Kroon, head of department *(P.O. Box 9010, 6500 GL Nijmegen, the Netherlands) Natural Resource Ecology Laboratory, Colorado State University*: Dr. M.B. Coughenour, researcher & lecturer *(Fort Collins, Colorado USA) Scientific Services, Kruger National Park*: Dr. C.C. Grant, senior researcher *(Private Bag X402, Skukuza 1350, South Africa) Agricultural Research Council - Animal Production Institute*: Dr. M.J.S. Peel *(Institute, PO Box 7063, Nelspruit 1200, South Africa) 135
146 ACKNOWLEDGEMENTS When you start your journey as a PhD candidate you have no idea of what to expect and in hindsight, even my wildest dreams (and sometimes nightmares) could not have prepared me for the road ahead. However, at the end of it all you come to the realization that the key to success does not lie in yourself but in the ones who help you along the way. First and foremost I would like to thank God for granting me the strength to complete this study, for guiding me every step of the way and for blessing me with the wonderful people who have shared this experience with me. Even with the best opportunities and technical support in the world I realized early on that completing this research could not be possible without moral support and people who truly believe in me. In this regard I would first like to thank my parents, Danie and Jorina and my best friend Paul for their unconditional love and support, further, my entire family right through from my grandmothers and grandfather to my aunt Retha and Dorie, my brother and his wife as well as all my friends out in the field including Garth, Liz, Emma, Bruce, Judy, Ziggy, Rina, Anna, Nikky, Rebecca and Jock. Next, I would like to thank the following invaluable people that helped me collect data and sweat it out in the field under sometimes harsh conditions: field technicians Tian, Rina, Emma, Jan and especially Floris and Christine, who served the project for the longest period, volunteers Anne, Daniel, Kirsty, Eve and Steve, MSc students Martine, Arno, Kim and Machiel and the ever loyal field rangers Reis and Nyati. Further, I am forever grateful to all the members of the TEMBO programme, especially Hans Stigter, Emmanuel Mwakiwa, Rina Grant, Mike Peel and Sip van Wieren, who all helped shape the articles to be published from this thesis, my co-supervisor Rob Slotow for his advice and all members of the Resource Ecology Group at Wageningen University who constantly provided me with inspiration during the write-up phase of this thesis. I think a good supervisor can be categorized as someone who knows his field of science, who gives quick feedback, who creates an atmosphere where questions can be asked and ideas shared with comfort and who has the ability to guide when necessary but also to step back and let the student make his/her own mistakes when necessary. I think Fred de Boer possesses all these qualities and I feel myself incredibly fortunate to have had him as my daily supervisor (thank you Fred, and know that I will always be grateful for what you have done for me). Further, I would like to thank the stakeholders of Mabula Game Reserve, Kruger National Park and the Associated Private Nature Reserves for allowing me access to these beautiful areas to collect data, and especially the wardens Scott, Paul, Jacques, Errol, Gustav and Colin, owners oom Tokkie, oom Piet, oom Wilkens, Andy, Winston and Van Zyl, researchers Steve, 136

147 Michelle, Rina, Mike and Stephanie and reserve personnel Steve, Cathy and Michelle for all their assistance as well as the professional hunters, Rudi and Siegfred, who worked with me to get data on the mouth morphology of different herbivores. Finally, this study would not have been possible without the financial support from the WOTRO fund, Dr Marie Luttig trust, Shell-SA, Mr. T. Scholtz and Omnia. Once, and maybe more than once if you are very fortunate, someone enters your life with the ability to look right through the barriers, which each of us have, and speak to you in a language that the essence of your being understands, thereby fuelling the thirst for knowledge and stimulating the longing to distinguish right from wrong. This is what Herbert Prins has meant to me during the last five years and as my mentor I will always be grateful to him for that (Herbert, please know that your teachings have become one of the voices of my conscience and that this makes me better equipped for the road ahead). 137
148 138
149 CURRICULUM VITAE Yolanda Pretorius was born on the 10 th of October 1978 in Pretoria, South Africa (SA). She matriculated at Verwoerdburg High School, Centurion (SA) in 1996 in the same area where she grew up. Her academic career started in 1997 at the University of Pretoria (SA) where she completed her pre-graduate studies in agriculture and animals science (BSc(Agric) Animal science) and was awarded the SASAS prize for most outstanding under graduate in animal science in In 2001 she obtained her Baccalaureus Scientiae Honores degree in wildlife management at the Centre for Wildlife Management (University of Pretoria). This study included a small thesis on feed supplementation for the African elephant at Mabula Private Game Reserve under supervision of Mr. B. Orban, Prof.dr. W. van Hoven and Prof.dr. JduP. Bothma. Following this, she moved to the University of Kwa-Zulu Natal (SA) to initiate her masters studies. In 2003, under the supervision of Prof.dr. R. Slotow, Yolanda completed her Masters degree in Biology with a behavioural study and thesis on tourism and disrupted social structure as possible causes of stress for African elephant on small game reserves. Whilst moving out of academia and formal education temporarily during 2004, Yolanda acted as field researcher for the University of Kwa-Zulu Natal and subsequently for the governmental organization, Ezemvelo-KZN wildlife, to determine the population dynamics of the elephant at Ithala Game Reserve. Since 2005, Yolanda has been registered as a PhD student at the Resource Ecology Group, Wageningen University (NL) with joint partnership from the University of Kwa-Zulu Natal. She has been part of the TEMBO programme initiated by the Resource Ecology Group in co-operation with academic institutions and organizations in South Africa, Australia and the United States. The main aim of this multi-disciplinary programme is to develope a spatial explicit cost benefit analysis of elephant management in the Greater Kruger National Park, South Africa. Yolanda s function in the programme has been to contribute in the understanding of the mechanisms governing small-scale foraging choices of large herbivores. Her study involved two and a half years of field work at a remote location within the Greater Kruger National Park followed by a year and a half of processing her data and completing this thesis. 139
150 140
 which comprises of a minimum total of 32 ECTS (= 22 weeks of activities) Review of Literature (4.")
151 PE&RC PhD Education Certificate With the educational activities listed below the PhD candidate has complied with the educational requirements set by the C.T. de Wit Graduate School for Production Ecology and Resource Conservation (PE&RC) which comprises of a minimum total of 32 ECTS (= 22 weeks of activities) Review of Literature (4.2 ECTS) - Investigating mechanisms which determines small scale foraging by herbivores (2008) Writing of Project Proposal (2 ECTS) - Small scale foraging by large African herbivores (2005) Laboratory Training and Working Visits (1 ECTS) - Plant chemical analysis of N, P, Ca, Mg,, K & tannin; Wageningen University (2008) Post-Graduate Courses (5.5 ECTS) - Survival analysis; FE and PE&RC (2005) - The art of modelling; SENSE Research School (2006) - Introduction of R for statistical analysis; PE&RC (2008) - Spatio-temporal models in ecology: an introduction to Integro-difference equations; PE&RC (2009) Deficiency, Refresh, Brush-up Courses (2.8 ECTS) - Ecological methods; Resource Ecology Group (2005) Competence Strengthening / Skills Courses (2.5 ECTS) - The art of writing; CENTA (2005) - Techniques for writing and presenting a scientific paper; PE&RC (2008) Discussion Groups / Local Seminars and Other Scientific Meetings (7 ECTS) - Ecological theory and application discussion group; Wageningen University (2005 and 2008) - Research progress discussions at the Associated Private Nature Reserves; South Africa ( ) PE&RC Annual Meetings, Seminars and the PE&RC Weekend (1.2 ECTS) - PE&RC Weekend (2005) - PE&RC Day (2008) International Symposia, Workshops and Conferences (8.3 ECTS) - Elephant Managers and Owners Association, EMOA, annual symposia; South Africa (2006 and 2007) - Scientific services Kruger National Park Network meeting (2006, 2007 and 2008) - Pathways to success conference Integrating human dimensions into fisheries and wildlife management; Colorado (2008) Supervision of MSc Students (4 students, 40 days) - Elephant and impala diet switches between grass and browse - Foraging dynamics within patches of browsing ruminant African ungulates 141
Effect of elephants on vegetation in Pongola Game Reserve. Dr Heather Gilbert, Operation Wallacea
 Effect of elephants on vegetation in Pongola Game Reserve Dr Heather Gilbert, Operation Wallacea Contents Key Findings... 2 Introduction... 2 Research Site... 3 Results and discussion... 4 Changes over
Chapter 11: Range Animal Nutrition
 Chapter 11: Range Animal Nutrition 1. Nutritional Components of Forages a. Protein b. Energy c. Phosphorus d. Vitamin A 2. Comparative Nutrition of Forages a. Grasses b. Forbs c. Shrubs 3. Comparative
Main Points. 2) Metabolism and allometries -- universal patterns in ecology -- example: allometries for population density in carnivores
 Metabolism and allometries -- universal patterns in ecology -- example: allometries for population density in carnivores") Main Points 1) Diet -- primitive monogastric, cecal fermentation, and ruminant fermentation -- ruminant digestion and an adaptive radiation -- example: the global distribution of mammalian herbivores 2)
Main Points 1) Diet -- primitive monogastric, cecal fermentation, and ruminant fermentation -- ruminant digestion and an adaptive radiation -- example: the global distribution of mammalian herbivores 2)
Serum Magnesium and Zinc Status of Wild Ungulates in the Swaziland Lowveld
 Serum Magnesium and Zinc Status of Wild Ungulates in the Swaziland Lowveld Gordon J. Gallivan 1, J. Culverwel1 2, and R. Girdwood 3 1 Department of Biology, University of Swaziland, Private Bag Kwaluseni,
Stable isotope composition of faeces as an indicator of seasonal diet selection in wild herbivores in southern Africa
 Edith Cowan University Research Online ECU Publications Pre. 2011 2005 Stable isotope composition of faeces as an indicator of seasonal diet selection in wild herbivores in southern Africa Susan Botha
FEEDING BROCHURE GAME PRODUCTS
 FEEDING BROCHURE GAME PRODUCTS WILDLIFE/GAME FEEDING AND SUPPLEMENTATION In their natural environment, wild game species have little need for supplementary feeding as their freeranging habits enable them
THE 'FIBREVORES' GUIDE FROM BURGESS PET CARE
 THE 'FIBREVORES' GUIDE FROM BURGESS PET CARE Essential facts for rabbits, guinea pigs & chinchillas. WHAT IS A 'FIBREVORE'? You'll be familiar with the words carnivore (a meat eater), omnivore (an eater
Spatial redistribution of nutrients by large herbivores and dung beetles in a savanna ecosystem
 Received: 27 July 2017 Accepted: 25 September 2017 DOI: 10.1111/1365-2745.12874 RESEARCH ARTICLE Spatial redistribution of nutrients by large herbivores and dung beetles in a savanna ecosystem Michiel
arboreal arboreal crepuscular ( nocturnal
 The information listed here should help you understand some of the terms that you may see on the red panda fact sheet and the red panda bag talking points. 1 Panda comes from the Nepali word ponya, which
Instantaneous intake rate of herbivores as function of forage quality and mass: Effects on facilitative and competitive interactions
 ecological modelling 213 (2008) 273 284 available at www.sciencedirect.com journal homepage: www.elsevier.com/locate/ecolmodel Instantaneous intake rate of herbivores as function of forage quality and
Introduction to comparative digestive physiology
 Introduction to comparative digestive physiology Marcus Clauss Clinic for Zoo Animals, Exotic Pets and Wildlife, Vetsuisse Faculty, University of Zurich, Switzerland Wildlife Digestive Physiology Course
Matching Forages to the Nutrient Needs of Meat Goats
 Matching Forages to the Nutrient Needs of Meat Goats J. Paul Mueller, Matthew H. Poore, Jean-Marie Luginbuhl, and James T. Green, Jr. FORAGES FOR GOATS Goats offer an alternative to utilizing forage and
Habitat selection of the desert night lizard (Xantusia vigilis) on Mojave yucca (Yucca schidigera) in the Mojave Desert, California
 on Mojave yucca (Yucca schidigera) in the Mojave Desert, California") Habitat selection of the desert night lizard (Xantusia vigilis) on Mojave yucca (Yucca schidigera) in the Mojave Desert, California Kirsten Boylan1, Robert Degen2, Carly Sanchez3, Krista Schmidt4, Chantal
Habitat selection of the desert night lizard (Xantusia vigilis) on Mojave yucca (Yucca schidigera) in the Mojave Desert, California Kirsten Boylan1, Robert Degen2, Carly Sanchez3, Krista Schmidt4, Chantal
The browser wars ( )
") The browser wars (1968-2004) Marcus Clauss Clinic for Zoo Animals, Exotic Pets and Wildlife, Vetsuisse Faculty, University of Zurich, Switzerland Wildlife Digestive Physiology Course Vienna 2013 The term
The browser wars (1968-2004) Marcus Clauss Clinic for Zoo Animals, Exotic Pets and Wildlife, Vetsuisse Faculty, University of Zurich, Switzerland Wildlife Digestive Physiology Course Vienna 2013 The term
Structure of an Incisor
 MAMMALIAN TEETH Mammals have different types and shapes of teeth and they are thus termed Heterodonts. Those which have teeth of the same size and shapes are termed as Homodonts. In mammals teeth consist
Understanding Forage Intake in Range Animals
 L-5152 1-99 Understanding Forage Intake in Range Animals Robert K. Lyons, Rick Machen, and T.D.A. Forbes* Forage quality influences the performance of range livestock and wildlife, and it is often assumed
DAIRY FOCUS AT ILLINOIS NEWSLETTER. Focus on Forages Volume 2, Number 1
 Volume 2, Number 1 Focus on Forages 2015 Forages have always been an important source of nutrients for the dairy cow. Feeding high quality forages can increase dairy efficiency and help reduce the feed
Understanding Dairy Nutrition Terminology
 Understanding Dairy Nutrition Terminology Mat Haan, Penn State Dairy Educator, Berks County Lucas Mitchell, Penn State Department of Animal Science Dairy Cattle Nutrition Workshop November 15, 2017 Interpreting
GOAT NUTRITION; SIMILARITIES AND DIFFERENCES TO SHEEP NUTRITION
 Goat Notes GOAT NUTRITION; SIMILARITIES AND DIFFERENCES TO SHEEP NUTRITION Professor Ronald A Leng AO B.Sc., Ph.D., D.Rur.Sc., FASAP Goats come in all shapes and sizes from the smallest, which is the Black
Contrasting timing of parturition of chital Axis axis and gaur Bos gaurus in tropical South India the role of body mass and seasonal forage quality
 Oikos 121: 13 131, 212 doi: 1.1111/j.16-76.211.2244.x 211 The Authors. Oikos 211 Nordic Society Oikos Subject Editor: Stan Boutin. Accepted 12 September 211 Contrasting timing of parturition of chital
FIBER DIGESTIBILITY AND FORAGE FRAGILITY IN DAIRY CATTLE. K. Cotanch and R. Grant William H. Miner Agricultural Research Institute Chazy, NY
 FIBER DIGESTIBILITY AND FORAGE FRAGILITY IN DAIRY CATTLE K. Cotanch and R. Grant William H. Miner Agricultural Research Institute Chazy, NY Physically Effective Fiber System INTRODUCTION Mertens (1997)
Effect of Species Richness on Disease Risk
 Effect of Species Richness on Disease Risk Dilution Effect and Underlying Mechanisms Zheng Huang i Chapter 1 Thesis committee Promotor Prof. Dr H.H.T. Prins Professor of Resource Ecology Group Wageningen
Unit 2: Animals on the land
 GCSE Animal Nutrition Unit 2: Animals on the land For first teaching from September 2013 For first award in Summer 2015 Animal Nutrition Learning Outcomes At the end of this unit students should be able
Beef Cattle Nutrient Requirements
 Beef Cattle Nutrient Requirements Nutrients Required by Beef Cattle Beef cattle require nutrients to support body maintenance, reproduction, lactation, and growth. The nutritional needs of beef cattle
Example. Biomentor Foundation. Advice Example
 Example Advice Example Biomentor Foundation URL WERK The normal values that are given, are our interpretation of all the results that we have seen in relation to (subject) judgements. So there is no absolute
INTAKE AND QUALITATIVE ASPECTS OF GUINEA GRASS GRAZED BY SHEEP OVER THREE DIFFERENT SEASONS. W.A. van Niekerk. Africa
 INTAKE AND QUALITATIVE ASPECTS OF GUINEA GRASS GRAZED BY SHEEP OVER THREE DIFFERENT SEASONS ID # 09-40 W.A. van Niekerk Department of Animal & Wildlife Sciences, University of Pretoria, Pretoria, 0002,
Vraag: Ek sien dat baie van die blaarvreters vir n rukkie by n boom vreet waarna hulle padgee na n ander boom. Wat is die rede hiervoor?
 Opskrif: Tanniene se rol in herkouervoeding Vraag: Ek sien dat baie van die blaarvreters vir n rukkie by n boom vreet waarna hulle padgee na n ander boom. Wat is die rede hiervoor? Antwoord: Plante produseer
A Study of the Predator-Prey Relationship
 Name: Block: v3/06 A Study of the Predator-Prey Relationship The predator-prey relationship is important to ecosystems. How can we measure that relationship? It would be difficult to follow a predator
Beef Cattle Nutrient Requirements
 Beef Cattle Nutrient Requirements Nutrients Required by Beef Cattle Beef cattle require nutrients to support body maintenance, reproduction, lactation, and growth. The nutritional needs of beef cattle
HAY QUALITY EVALUATION
 - 16 - HAY QUALITY EVALUATION William C. Templeton, Jr. Professor Emeritus Department of Agronomy, University of Kentucky and Director (Retired) U.S. Regional Pasture Research Laboratory USDA/ARS During
Effective Practices In Sheep Production Series
 Effective Practices In Sheep Production Series Understanding Feed Test Analysis Terms The key to accurate feed tests is correct sampling of your forages and grains. Equally important, is understanding
Ruminant Digestion 8/7/2014 1
 Ruminant Digestion 8/7/2014 1 Different Digestive Systems The three different types of digestive systems are: Monogastric Modified Monogastric Ruminant 8/7/2014 2 A few animals with ruminant digestive
Fundamentals of Ration Balancing for Beef Cattle Part II: Nutrient Terminology
 Fundamentals of Ration Balancing for Beef Cattle Part II: Nutrient Terminology Randy Wiedmeier, Regional Livestock Specialist, South-Central Area What information and skills are required to balance diet
1. Soil and climatic factors 2. Stage of growth: 3. Genotype: 4. Sampling and processing: 5. Toxic substances: Some forages that rated high in their
 Factors affecting chemical composition 1. Soil and climatic factors 2. Stage of growth: 3. Genotype: 4. Sampling and processing: 5. Toxic substances: Some forages that rated high in their dietary components
Overview of Principles on Game Nutrition HINNER KÖSTER
 Overview of Principles on Game Nutrition HINNER KÖSTER Introduction Profitability of modern intensive game farming practises affected by: Reproduction Amount of offspring produced within a specific specie
UNIVERSITY OF CAMBRIDGE INTERNATIONAL EXAMINATIONS International General Certificate of Secondary Education
 UNIVERSITY OF CAMBRIDGE INTERNATIONAL EXAMINATIONS International General Certificate of Secondary Education *8516461728* BIOLOGY 0610/31 Paper 3 Extended May/June 2008 1 hour 15 minutes Candidates answer
Fibre is complicated! NDFD, undfom in forage analysis reports NDF. Review. NDF is meant to measure Hemicellulose Celluose Lignin
 Fibre is complicated! Understanding andf, andfom, NDFD, undfom in forage analysis reports T.P. Tylutki PhD Dpl ACAS CEO AMTS LLC Groton NY USA NDF NDF is meant to measure Hemicellulose Celluose Lignin
{A number of conditions
 Need to Know How to adjust sheep feed requirements Things you need to know about livestock production practices. LINK The information on this Need to Know card is from Virtual Apprentice 2040: Livestock1.
Response of Ruminants to Protein Supplementation is Affected by Type of Low-quality Forage 1
 Oregon State University BEEF0028 Beef Research Report Beef Cattle Sciences Response of Ruminants to Protein Supplementation is Affected by Type of Low-quality Forage 1 David W. Bohnert 2, Timothy DelCurto
INTERPRETING FORAGE QUALITY TEST REPORTS
 INTERPRETING FORAGE QUALITY TEST REPORTS Donna M. Amaral-Phillips, Ph.D. Department of Animal and Food Sciences University of Kentucky Forages are the foundation for building diets for beef and dairy cattle,
CHAPTER 6A PREDICTIVE MODELLING OF PATCH USE BY TERRESTRIAL HERBIVORES
 CHAPTER 6A PREDICTIVE MODELLING OF PATCH USE BY TERRESTRIAL HERBIVORES JOHN M. FRYXELL Department of Zoology, University of Guelph, Guelph, Ontario, N1G 2W1, Canada E-mail: jfryxell@uoguelph.ca Abstract.
How to use the card system. OBSALIM: A set of cards to make a diagnosis of the nutrition of goats English
 How to use the card system OBSALIM: A set of cards to make a diagnosis of the nutrition of goats. 2011 English The objective of the OBSALIM diagnosis 3 How to make the OBSALIM diagnosis 3 Four steps 4
ESTIMATING THE ENERGY VALUE OF CORN SILAGE AND OTHER FORAGES. P.H. Robinson 1 ABSTRACT INTRODUCTION
 ESTIMATING THE ENERGY VALUE OF CORN SILAGE AND OTHER FORAGES P.H. Robinson 1 ABSTRACT It is possible to estimate the energy value of ruminant feeds if some chemical assays of the feedstuffs, and the estimated
Applications of C in animals: Diet and resource partitioning, resource allocation. All using differences in 13 C C3 and C4 plants
 Applications of C in animals: Diet and resource partitioning, resource allocation All using differences in 13 C C3 and C4 plants Renewable and nonrenewable resources: Amino acid turnover and allocation
Towering Traits: An Adaptations Inquiry (6-12)
") : An Adaptations Inquiry (6-12) At a glance Students investigate the question of how elephants use their trunks most often through observation at the Zoo. Time requirement Two classroom sessions of 45
: An Adaptations Inquiry (6-12) At a glance Students investigate the question of how elephants use their trunks most often through observation at the Zoo. Time requirement Two classroom sessions of 45
LIFE SCIENCES. 1. The question paper consists of 8 pages (1 to 8) and an insert of 4 pages (i iv). Please check that your question paper is complete.
 and an insert of 4 pages (i iv). Please check that your question paper is complete.") GRADE 10 EXEMPLAR EXAMINATION NOVEMBER 2006 LIFE SCIENCES Time: 2 hours 150 marks PLEASE READ THE FOLLOWING INSTRUCTIONS CAREFULLY 1. The question paper consists of 8 pages (1 to 8) and an insert of 4
GRADE 10 EXEMPLAR EXAMINATION NOVEMBER 2006 LIFE SCIENCES Time: 2 hours 150 marks PLEASE READ THE FOLLOWING INSTRUCTIONS CAREFULLY 1. The question paper consists of 8 pages (1 to 8) and an insert of 4
NEW/EMERGING MEASUREMENTS FOR FORAGE QUALITY. Dan Putnam 1 ABSTRACT
 NEW/EMERGING MEASUREMENTS FOR FORAGE QUALITY Dan Putnam 1 ABSTRACT A nationally accepted standard hay test for alfalfa hay has included measurement of Acid Detergent Fiber (ADF), Neutral Detergent Fiber
water from several miles away.
 by The elephant is the world s largest mammal. It can weigh between 3.5 and 6.5 tons (that s 7,000 to 13,200 pounds!) and grow up to 11 feet tall. To put that in some perspective, an average car weighs
The digestion system and nutrient requirements
 Principles of nutrition 1 TechNote 1 The digestion system and nutrient requirements IN THIS TECHNOTE 1.1 Functions of the ruminant digestive system 1.2 Requirements of the dairy cow 1.3 Further reading
Competition between black rhinoceros (Diceros bicornis) and greater kudu (Tragelaphus strepsiceros) in the Great Fish River Reserve, South Africa
 and greater kudu (Tragelaphus strepsiceros) in the Great Fish River Reserve, South Africa") Competition between black rhinoceros (Diceros bicornis) and greater kudu (Tragelaphus strepsiceros) in the Great Fish River Reserve, South Africa Influence of black rhinoceros presence on the diet, density,
Competition between black rhinoceros (Diceros bicornis) and greater kudu (Tragelaphus strepsiceros) in the Great Fish River Reserve, South Africa Influence of black rhinoceros presence on the diet, density,
DIETS OF SOUTHERN AFRICAN BOVIDAE: STABLE ISOTOPE EVIDENCE
 Journal of Mammalogy, 84(2):471 479, 23 DIETS OF SOUTHERN AFRICAN BOVIDAE: STABLE ISOTOPE EVIDENCE MATT SPONHEIMER,* JULIA A. LEE-THORP, DARRYL J. DERUITER, JEANNETTE M. SMITH, NIKOLAAS J. VAN DER MERWE,
Quick Start. Cornell Net Carbohydrate and Protein System for Sheep
 Quick Start Cornell Net Carbohydrate and Protein System for Sheep The Cornell Net Carbohydrate and Protein System (CNCPS) for Sheep is a feeding system derived from the CNCPS for cattle (Fox et al., 2003).
All nutrients fall into one of; proteins, fats, carbohydrates, vitamins and minerals
 Essential nutrients; - must be supplied to an animal because the animal cannot synthesise them - needed to satisfy the requirements of its cells * if the amount of essential nutrients supplied is insufficient
There are six general classes of nutrients needed in the horse s diet: water carbohydrates fats protein minerals vitamins.
 HORSE NUTRITION Nutrients A nutrient is defined as any feed constituent that is necessary to support life. The following is a list of functions that nutrients perform in the horse's body: source of energy
Assessment Schedule 2017 Biology: Demonstrate understanding of evolutionary processes leading to speciation (91605)
") NCEA Level 3 Biology (91605) 2017 page 1 of 5 Assessment Schedule 2017 Biology: Demonstrate understanding of evolutionary processes leading to speciation (91605) Evidence Statement Q1 Evidence Achievement
NCEA Level 3 Biology (91605) 2017 page 1 of 5 Assessment Schedule 2017 Biology: Demonstrate understanding of evolutionary processes leading to speciation (91605) Evidence Statement Q1 Evidence Achievement
SMALL GRAIN CEREAL FORAGES: TIPS FOR EVALUATING VARIETIES AND TEST RESULTS. George Fohner 1 ABSTRACT
 SMALL GRAIN CEREAL FORAGES: TIPS FOR EVALUATING VARIETIES AND TEST RESULTS George Fohner 1 ABSTRACT The attributes of small grain cereal forages that increase their versatility and value also can complicate
Environmental Studies
 Centre Number Candidate Number For Examiner s Use Surname Other Names Candidate Signature Examiner s Initials Question Mark Environmental Studies Unit 1 The Living Environment Wednesday 14 January 2009
The Effect of Maturity and Frost Killing of Forages on Degradation Kinetics and Escape Protein Concentration
 The Effect of Maturity and Frost Killing of Forages on Degradation Kinetics and Escape Protein Concentration A. S. Leaflet R1546 M. A. Karsli, graduate research assistant, and J. R. Russell, professor
Ecological Parameters. Diet of Farmland Birds. Peter Edwards, Syngenta; UK Kees Romijn, Bayer Crop Science AG; Germany
 Ecological Parameters Diet of Farmland Birds Peter Edwards, Syngenta; UK Kees Romijn, Bayer Crop Science AG; Germany 1 Diet of Farmland Birds Why is this important? What factors influence the diet? What
The Effect of Heat Treatment of Forages on Degradation Kinetics and Escape Protein Concentration
 The Effect of Heat Treatment of Forages on Degradation Kinetics and Escape Protein Concentration A. S. Leaflet R1547 M. A. Karsli, graduate research assistant, and J. R. Russell, professor of animal science.
Int.J.Curr.Microbiol.App.Sci (2016) 5(5):
 5(5):") International Journal of Current Microbiology and Applied Sciences ISSN: 2319-7706 Volume 5 Number 5 (2016) pp. 934-939 Journal homepage: http://www.ijcmas.com Original Research Article http://dx.doi.org/10.20546/ijcmas.2016.505.098
International Journal of Current Microbiology and Applied Sciences ISSN: 2319-7706 Volume 5 Number 5 (2016) pp. 934-939 Journal homepage: http://www.ijcmas.com Original Research Article http://dx.doi.org/10.20546/ijcmas.2016.505.098
URGENT NEWS. Grass Silage Update No 144: Grass Silage Update /2011. Fermentation quality and intake characteristics
 1 of 6 Grass Silage Update Nature is such a great leveler. The early fears of winter forage shortages have gone on most farms but so too have the hopes of the highest quality grass silage crop for many
Ecology B/C Test. Science Olympiad North Regional Tournament at the University of Florida
 Ecology B/C Test Science Olympiad North Regional Tournament at the University of Florida Answers go on the team answer sheet. DO NOT WRITE ON THIS TEST SET. Principles of ecology 1. List 3 biotic and 3
The Mineral Specialists
 % DM The Mineral Specialists HEADLINES: G R A S S S I L A G E 2 0 1 5 - M I N E R A L P R O F I L E PHOSPHORUS UP BY 16% DUE TO SLOWER GRASS GROWTH POTASSIUM REDUCED BY 10% AND CATION ANION BALANCE BY
Research and Monitoring
 Research and Monitoring Published literature The Addo elephants are probably the world's most comprehensively recorded elephant population. Elephant research began in earnest in 1976 when Dr. Anthony Hall-Martin
ANIMAL NUTRITION 24 APRIL 2013
 ANIMAL NUTRITION 24 APRIL 2013 Lesson Description In this lesson, we: Look at nutrition in various animals o Herbivores, Carnivores and Omnivores Study the structure of the human digestive system Look
Pretest score: Posttest score:
 Pretest score: Posttest score: 1. Selenium is an essential trace mineral which helps make up many anti-oxidant enzymes and deficiencies can cause a fatal muscular dystrophy in young ruminants. If it is
SUPPLEMENTAL DEGRADABLE PROTEIN REQUIREMENT FOR CATTLE FED STOCKPILED BERMUDAGRASS FORAGE. Authors:
 SUPPLEMENTAL DEGRADABLE PROTEIN REQUIREMENT FOR CATTLE FED STOCKPILED BERMUDAGRASS FORAGE 1999 Animal Science Research Report Authors: Story in Brief Pages 96-99 J.S. Wheeler, D.L. Lalman, S. Janloo and
Nutrient Requirements of Beef Cattle E-974
 Nutrient Requirements of Beef Cattle E-974 Department of Animal Science Oklahoma Cooperative Extension Service Division of Agricultural Sciences and Natural Resources Oklahoma State University David Lalman
The content assessed by the examination papers and the type of questions is unchanged.
 Location Entry Codes As part of CIE s continual commitment to maintaining best practice in assessment, CIE uses different variants of some question papers for our most popular assessments with large and
Size matters. (J.B.S. Haldane, 1928: On being the right size)
") Size matters You can drop a mouse down a thousand-yard mine shaft; and, on arriving at the bottom, it gets a slight shock and walks away, provided the ground is fairly soft. A rat is killed, a man is broken,
Size matters You can drop a mouse down a thousand-yard mine shaft; and, on arriving at the bottom, it gets a slight shock and walks away, provided the ground is fairly soft. A rat is killed, a man is broken,
Chapter 9 Resource utilization and energy balance of Earthworm Metaphire hilgendorfi spp-complex (Oligochaeta : Megascolecidae) in old grass field
 in old grass field") Chapter 9 Resource utilization and energy balance of Earthworm Metaphire hilgendorfi spp-complex (Oligochaeta : Megascolecidae) in old grass field Introduction The number, the biomass, the metabolism and
Chapter 9 Resource utilization and energy balance of Earthworm Metaphire hilgendorfi spp-complex (Oligochaeta : Megascolecidae) in old grass field Introduction The number, the biomass, the metabolism and
ABSTRACT FORAGE SAMPLING AND TESTING ACCURACY CHOOSING A FORAGE TESTING LAB
 PARAMETERS FOR GOOD QUALITY ALFALFA HAY Glenn E. Shewmaker, Mireille Chahine, and Rikki Wilson 1 ABSTRACT When alfalfa hay is tested in a laboratory analysis, several forage quality factors are considered.
Making Forage Analysis Work for You in Balancing Livestock Rations and Marketing Hay
 A3325 Making Forage Analysis Work for You in Balancing Livestock Rations and Marketing Hay Dan Undersander, W. Terry Howard, and Randy Shaver Forage and grain samples differ in their chemical composition
THE PREVALENCE OF ANTIBODY TO INFECTIOUS BOVINE RHINOTRACHEITIS VIRUS IN SOME GAME ANIMALS OF EAST AFRICA
 THE PREVALENCE OF ANTIBODY TO INFECTIOUS BOVINE RHINOTRACHEITIS VIRUS IN SOME GAME ANIMALS OF EAST AFRICA Author(s): C. S. RAMPTON and D. M. JESSETT Source: Journal of Wildlife Diseases, 12(1):2-5. Published
Elephant distribution and density within the Associated Private Nature Reserves as derived from GPS-telemetry data
 Elephant distribution and density within the Associated Private Nature Reserves as derived from GPS-telemetry data Steve Henley Save the Elephants South Africa December 2009 This brief report was produced
Wheat Pasture Bloat of Stockers
 Wheat Pasture Bloat of Stockers G. W. Horn, B. R. Clay and L. I. Croy Story in Brief Ruminal motility and foam stability, and expansion and strength measurements offoamed rumen fluid samples (as estimates
Composition and Nutritive Value of Corn Fractions and Ethanol Co-products Resulting from a New Dry-milling Process 1
 Composition and Nutritive Value of Corn Fractions and Ethanol Co-products Resulting from a New Dry-milling Process 1 Greg B. Kleinhans 2, Robbi H. Pritchard 3, and Simone M. Holt 4 Department of Animal
2. What happens to the bunny population if a friend is never added? What happens when you add a friend?
 Name: Natural Selection Simulation at PHET http://phet.colorado.edu/simulations/sims.php?sim=natural_selection (link is also posted on Evolution Unit page at www.biologybynapier.com ) Exploration: Access
Characteristics of living organism
 At a glance : Chapter 2 Nutrition in Animals Living organisms are bundles of cells that carry out specialized functions. 1. Life is uncertain because Organic Matter is born, it Organic / Biotic Matter
Copyright 2014 Edmentum - All rights reserved. 2. In plants, which characteristic or behavior is typically independent of the plant's environment?
 Copyright 2014 Edmentum - All rights reserved. AP Biology Living System and Free Energy Blizzard Bag 2014 2015 1. How is cellular respiration useful to the cell? A. producing ATP, which provides the nucleotides
Kashif Ishaq PhD; DVM
 Kashif Ishaq PhD; DVM Hind gut fomenters Stomach is not chambered Other animals are donkey, rabbits Parts of Digestive System Mouth Esophagus Stomach Small intestine is 21 m long Large intestine 40-50
What deer eat and why: A look at white-tailed deer nutrition. Mike Miller Technical Guidance Biologist Wildlife Division - District 3
 What deer eat and why: A look at white-tailed deer nutrition Mike Miller Technical Guidance Biologist Wildlife Division - District 3 Dietary strategy Nutritional requirements Food habits Influences on
Department of Animal Science; University of Nebraska; Lincoln, NE
 BASICS OF RUMINANT ANIMAL NUTRITION Pablo L. Loza, MS and Jess L. Miner, PhD* Department of Animal Science; University of Nebraska; Lincoln, NE 68583-0908 Introduction Cellulose is the main constituent
Interference competition and temporal niche shifts: elephants and herbivore communities at waterholes
 Oecologia (7) 153:739 7 DOI 1.17/s-7-7-5 BEHAVIORAL ECOLOGY Interference competition and temporal niche shifts: elephants and herbivore communities at waterholes Marion Valeix Æ Simon Chamaillé-Jammes
Nutrition #3 Created for Canadian Pony Club Education By Lezah Williamson
 Nutrition #3 Created for Canadian Pony Club Education By Lezah Williamson 1. Feed little and often 2. Feed plenty of bulk food 3. Feed according to size, age, breed, temperament, condition, season and
Unit 1 Biological Diversity Topic 1.1 Examining Diversity. Text p. 3-15
 Topic 1.1 Examining Diversity. Text p. 3-15 Variation to the MAX! Biologists have identified over species of animals and over species of plants. The most successful life form is What is Biodiversity? The
Naturally Acquired Anthrax Antibodies in a Cheetah (Acinonyx jubatus) in Botswana
 in Botswana") SHORT COMMUNICATION Naturally Acquired Anthrax Antibodies in a Cheetah (Acinonyx jubatus) in Botswana Kyle M. Good 1,5, AnnMarie Houser 2, Lorraine Arntzen 3 and Peter C. B. Turnbull 4 1 Cheetah Conservation
SHORT COMMUNICATION Naturally Acquired Anthrax Antibodies in a Cheetah (Acinonyx jubatus) in Botswana Kyle M. Good 1,5, AnnMarie Houser 2, Lorraine Arntzen 3 and Peter C. B. Turnbull 4 1 Cheetah Conservation
Natural Selection. species: a group of organisms that can interbreed and produce viable, fertile offspring
 Imagine that you and your classmates are taking a nature hike through a nearby desert ecosystem. The hot sun is beating down on you, and you begin to wonder how anything could live in this harsh climate.
F. M. Ciriaco, D. D. Henry, V. R. G. Mercadante, T. Schulmeister, M. Ruiz-Moreno, G. C. Lamb, N. DiLorenzo
 Effects of Supplementation with a Mixture of Molasses and Crude Glycerol on Performance and Total Tract Digestibility of Beef Heifers Consuming Bermudagrass Hay F. M. Ciriaco, D. D. Henry, V. R. G. Mercadante,
Pre-lab homework Lab 8: Community Interactions
 Lab Section: Pre-lab homework Lab 8: Community Interactions Name: In lab this week we will work on developing an understanding of community interactions. Prior to lab answer the following questions to
Copyright is owned by the Author of the thesis. Permission is given for a copy to be downloaded by an individual for the purpose of research and
 Copyright is owned by the Author of the thesis. Permission is given for a copy to be downloaded by an individual for the purpose of research and private study only. The thesis may not be reproduced elsewhere
The four stomachs of a dairy cow
 The four stomachs of a dairy cow Left side view 1) Rumen 2) Reticulum 3) Omasum 4) Abomasum Reticulo-omasal orifice (reticulo-rumen exit) (on the right side of the cow) (on the right side of the cow) Esophagus
TOTALLY TEETH. by Dr. John Charles (BVSc) Straight from the Horse s Mouth why the fuss about a healthy mouth?
 Straight from the Horse s Mouth why the fuss about a healthy mouth?") 19 August 2010 TOTALLY TEETH by Dr. John Charles (BVSc) Straight from the Horse s Mouth why the fuss about a healthy mouth? The healthy condition of your horse s mouth is essential to his/her existence
19 August 2010 TOTALLY TEETH by Dr. John Charles (BVSc) Straight from the Horse s Mouth why the fuss about a healthy mouth? The healthy condition of your horse s mouth is essential to his/her existence
Nonstructural and Structural Carbohydrates in Dairy Cattle Rations 1
 CIR1122 Nonstructural and Structural Carbohydrates in Dairy Cattle Rations 1 Barney Harris, Jr. 2 Carbohydrates are the largest component in the dairy ration and contribute 60 to 70% of the net energy
WLF 315 Wildlife Ecology I Lab Fall 2012 Sampling Methods for the Study of Animal Behavioral Ecology
 WLF 315 Wildlife Ecology I Lab Fall 2012 Sampling Methods for the Study of Animal Behavioral Ecology Lab objectives: 1. Introduce field methods for sampling animal behavior. 2. Gain an understanding of
A. Farhat, L. Normand, E.R. Chavez, S.P. Touchburn, P.C. Laguë
 Energy and Digestibility Values of Food Wastes A. Farhat, L. Normand, E.R. Chavez, S.P. Touchburn, P.C. Laguë Introduction There are many important reasons for the determination of the metabolizable energy
172 Trop Anim Prod :2
 7 Trop Anim Prod 979 4: AMMONIA TREATED WHEAT STRAW AS A SUBSTITUTE FOR MAIZE SILAGE FOR GROWING LAMBS R Tejada, Beatriz Murillo and M T Cabezas University San Carlos, Facultad de Medicina Veterinaria