Providing Knowledge to Serve the Turfgrass Industry and Promote Sustainability
|
|
|
- Gilbert Goodman
- 6 years ago
- Views:
Transcription


1 Providing Knowledge to Serve the Turfgrass Industry and Promote Sustainability
2 Cover photo: Turfgrass cultivar evaualtion study being discussed at the 2016 UConn Turfgrass Field Day. (Photo credits: Kim Bova, Kim Bova Photography, The University of Connecticut complies with all applicable federal and state laws regarding non-discrimination, equal opportunity and affirmative action. The University is committed to a policy of equal opportunity for all persons and does not discriminate on the basis of legally protected characteristics in employment, education, the provision of services and all other programs and activities. In Connecticut, legally protected characteristics include: race; color; religion; ethnicity; age; sex; marital status; national origin; ancestry; sexual orientation; gender identity or expression; genetic information; veteran status; disability; and workplace hazards to reproductive systems. Employees, students, visitors and applicants with disabilities may request reasonable accommodations to address limitations resulting from a disability. The University engages in an interactive process with each person making a request for accommodations and reviews the requests on an individualized, case-by-case basis. To request an accommodation or for questions related to the University s non-discrimination policies, please contact: Elizabeth Conklin, J.D. ADA Coordinator Title IX Coordinator Associate Vice President Office of Diversity and Equity 241 Glenbrook Road, Unit 4175 Storrs, CT Phone: (860) ode@uconn.edu / Website: University of Connecticut
3 2016 Annual Turfgrass Research Report Summary University of Connecticut College of Agriculture, Health and Natural Resources Department of Plant Science and Landscape Architecture Storrs, Connecticut The University of Connecticut s Annual Turfgrass Research Report is published to provide timely dissemination of current research findings. The purpose of this report is to encourage the exchange of ideas and knowledge between university researchers and members of the turfgrass industry. Research summaries included within this report are designed to provide turfgrass managers, extension specialists, research scientists, and industry personnel with information about current topics related to managing turfgrass. This report is divided into various sections and includes original research results in turf pathology, athletic field and golf turf maintenance, fertility and nutrient management, and cultivar evaluation and improvement. Additionally, abstracts and citations of scientific publications and presentations published in calendar year 2016 by University of Connecticut turfgrass researchers are included. This information is presented in the hopes of providing current information on relevant research topics for use by members of the turfgrass industry. Special thanks are given to those individuals, companies, and agencies that provided support to the University of Connecticut s Turfgrass Research, Extension, and Teaching Programs. Dr. Karl Guillard, Editor University of Connecticut College of Agriculture, Health and Natural Resources Dept. of Plant Science & Landscape Architecture Unit 4067, 1376 Storrs Road, Storrs, CT USA karl.guillard@uconn.edu (860) i Table of Contents
4 University of Connecticut Turfgrass Science Program ADMINISTRATION Gregory J. Weidemann, Dean and Director, College of Agriculture, Health and Natural Resources Michael P. O'Neill, Associate Dean & Associate Director, Cooperative Extension System Cameron Faustman, Associate Dean for Research and Associate Director, Storrs Agricultural Experiment Station; Associate Dean for Academic Programs Richard McAvoy, Department Head and Professor, Plant Science and Landscape Architecture RESEARCH, TEACHING, EXTENSION FACULTY AND EDUCATORS Karl Guillard, Professor, Agronomy Jason Henderson, Associate Professor, Turfgrass and Soil Sciences John Inguagiato, Assistant Professor, Turfgrass Pathology Ana Legrand, Assistant Extension Professor, IPM/Entomology Yi Li, Professor, Horticultural Biotechnology Thomas Morris, Professor, Soil Fertility Steven Rackliffe, Associate Extension Professor, Turfgrass Science Cristian Schulthess, Associate Professor, Soil Chemistry Victoria Wallace, Extension Educator, Sustainable Turf & Landscape STAFF Nicole Gableman, Administrative Services Asstistant 3 Kevin Miele, Research Assistant II Stephen Olsen, Farm Manager Cristina Osbourne, Financial Assistant 2 Christine Strand, Secretary 1 Mark Oliver, Research Lab Aide Geoffrey Scott Vose, Agricultural Worker 2 GRADUATE RESEARCH ASSISTANTS Julie Campbell Rania El Tanbouly Xuan Chen Lorenzo Katin-Grazzini Rahul Kumar Wei Li Garrett Maxey David Moore Huseyin Yer UNDERGRADUATE RESEARCH ASSISTANTS Jesse Dunnack Zoë Esponda Derek Lockwood Andrew Redlund ii Table of Contents
5 2016 Financial Support The University of Connecticut Turfgrass Science Program appreciates the support of the turfgrass industry, state and federal agencies, private foundations, and university units and departments. Without your contributions, we would be unable to conduct many of the research projects included in this report. We extend our thanks to all of the individuals and companies who supported turfgrass research and education at the University of Connecticut. Allen s Seed AMVAC Environmental Products A-OK Turf Equipment Aquatrols Argesource Inc. Artscape Organic Care LLC. Atlantic Golf and Turf Barenbrug, USA BASF Corp. Bayer Environmental Science BioWorks Inc. Cardinals Inc. Connecticut Association of Golf Course Superintendents Connecticut Department of Energy and Environmental Protection Connecticut Grounds Keepers Associaton Crop Production Services CTEC/CICA DeLea Sod Farms DGM Systems Executive Turf Products Franklin Paint Golf Course Superintendents Association of Cape Cod Green Earth Ag & Turf Grigg Brothers Harrells LLC Helena Lebanon Turf Metropolotain Golf Course Superintendents Association National Turfgrass Evaluation Program New England Regional Turfgrass Foundation New England Specialty Soils New England Sports Turf Manager s Assoc. Nufarm, Ltd. PBI Gordon Corp. Pennington Seed Pioneer Athletics PJC Organic Plant Food Company, Inc. Read Custom Soils Residex Savage Farms Inc. SiteOne Landscape Supply Slater Farms LLC Sodco Inc. Steven Willand Inc. Storrs Agricultural Experiment Station Sustane Natural Fertilizer Syngenta Professional Products The Chas. C. Hart Seed Co. The Lawn Institute Tom Irwin, Inc. Tuckahoe Turf Farms, Inc. Turf Products, LLC UCONN Extension United States Environmental Protection Agency United States Golf Association USDA NIFA Hatch Multistate Project NE-1046 Valley Green, Inc. Warner Turf Equipment Winding Brook Turf Farm Inc. Winfield Winterberry Irrigation We regret that some individuals may have been inadvertently left off of this list. If you or your company has provided financial support for turfgrass research at the University of Connecticut and were not included on the above list, please contact us to ensure that you are included in future reports. The University of Connecticut Turfgrass Science Program iii Table of Contents
6 2016 In-Kind Support The University of Connecticut Turfgrass Science Program appreciates the support of the turfgrass industry, state and federal agencies, private foundations, and university units and departments. Without your contributions, we would be unable to conduct many of the research projects included in this report. We extend our thanks to all of the individuals and companies who supported turfgrass research and education at the University of Connecticut. A-List Turf Allens Seed Atlantic Golf and Turf BASF Corp. Bayer Environmental Science Championship Turf Services DLF/Seed Research of Oregon Green Earth Ag. & Turf, LLC F.M. Brown, Sons, Inc. Holliston Sand Company, Inc. Indian Hill Country Club Landmark Turf & Native Seed MAS Golf Course Renovation & Construction PBI Gordon Corp. ProSeeds Marketing, Inc. Pure Seed Testing, Inc. Shelter Harbor Golf Club Suståne/Natural Fertilizer of America, Inc. Syngenta Professional Products Tartan Farms, LLC The Chas. C. Hart Seed Co. The Toro Company Turf Merchants, Inc. Turf Products Corp. We regret that some individuals may have been inadvertently left off of this list. If you or your company has provided material support for turfgrass research at the University of Connecticut and were not included on the above list, please contact us to ensure that you are included in future reports. The University of Connecticut Turfgrass Science Program iv Table of Contents

7 2016 TURFGRASS FIELD DAY SPONSORS v Table of Contents

8 2016 TURFGRASS FIELD DAY EXHIBITORS Allen s Seed A-OK Turf Equipment Argesource Inc. Artscape Organic Care LLC. Atlantic Golf and Turf BASF Corporation BioWorks Inc. Cardinals Inc. Chas. C. Hart Seed Co. Connecticut Assoc. of Golf Course Superintendents Connecticut Grounds Keepers Assoc. Crop Production Services CTEC/CICA DeLea Sod Farms DGM Systems Executive Turf Products Franklin Paint Green Earth Ag & Turf Harrells LLC Lebanon Turf New England Specialty Soils Nufarm PBI Gordon Pennington Seed Pioneer Athletics PJC Organic Read Custom Soils Residex Savage Farms Inc. SiteOne Landscape Supply Slater Farms LLC Sodco Inc. Steven Willand Inc. Sustane Natural Fertilizer Tom Irwin, Inc. Tuckahoe Turf Farms, Inc. Turf Products Valley Green, Inc. Warner Turf Equipment Winding Brook Turf Farm Inc. Winfield Winterberry Irrigation We regret that some individuals may have been inadvertently left off of this list. If you or your company were exhibitors for the 2016 UConn Turfgrass Field Day and were not listed above, please contact us to ensure that you are included in future reports. The University of Connecticut Turfgrass Science Program vi Table of Contents
9 DISCLAIMER Do not duplicate, reprint, or publish information within this report without the expressed written consent of the author(s). The information in this material is for educational purposes. This publication reports pesticide use in research trials and these may not conform to the pesticide label. Results described in these reports are not provided as recommendations. It is the responsibility of the pesticide applicator to follow current label directions for the specific pesticide being used. Any reference to commercial products, trade or brand names is for information only, and no endorsement or approval is intended. The Cooperative Extension System does not guarantee or warrant the standard of any product referenced or imply approval of the product to the exclusion of others which also may be available. If the information does not agree with current labeling, follow the label instructions. The label is the law. Read and follow all instructions and safety precautions on labels. Carefully handle and store agrochemicals/pesticides in originally labeled containers in a safe manner and place. Contact the Connecticut Department of Environmental Protection for current regulations. The user of this information assumes all risks for personal injury or property damage. Issued in furtherance of Cooperative Extension work, Acts of May 8 and June 30, 1914, in cooperation with the U.S. Department of Agriculture, Gregory J. Weidemann, Dean, Cooperative Extension System, University of Connecticut, Storrs. An equal opportunity program provider and employer. To file a complaint of discrimination, write USDA, Director, Office of Civil Rights, Room 326-W, Whitten Building, Stop Code 9410, 1400 Independence Avenue, SW, Washington, DC or call (202) vii Table of Contents
10 Table of Contents Page No. UNIVERSITY OF CONNECTICUT TURFGRASS SCIENCE PROGRAM 2016 Annual Turfgrass Research Report Summary... i University of Connecticut Turfgrass Program... ii 2016 Financial Support... iii 2016 In-Kind Support... iv 2016 Turfgrass Field Day Sponsors... v 2016 Turfgrass Field Day Exhibitors... vi Disclaimer... vii Table of Contents... viii TURFGRASS PATHOLOGY Preventive anthracnose control with various fungicides on an annual bluegrass putting green turf, Preventive anthracnose control with Oreon and Autilus fungicides on an annual bluegrass putting green turf, Preventive brown patch control with fungicides on a colonial bentgrass fairway turf, Preventive brown patch control with fungicides on a tall fescue lawn turf, Preventive copper spot control using various SDHI fungicides applied with and without Secure on a creeping bentgrass putting green turf, Preventive dollar spot control with Pinpoint and SDHI fungicides applied at various rates and intervals on a creeping bentgrass fairway turf, Curative dollar spot control with various fungicides on a creeping bentgrass fairway turf, Preventive dollar spot control with various fungicides on a creeping bentgrass putting green turf, Influence of Fiata on phytosafety of plant growth regulators on creeping bentgrass putting green turf, SPORTS TURF MANAGEMENT Determining dislodgeable foliar residue levels following the application of two pesticides used to manage sports turf, Organic turf and no-pesticide turf demonstration for home lawns and athletic fields FERTILITY AND NUTRIENT MANAGEMENT Solvita soil test kits to categorize turfgrass site responsiveness to nitrogen fertilization 2016 results Clippings sap nitrate-n concentrations and relationship to NDVI and DGCI TURFGRASS CULTIVAR EVALUATION AND IMPROVEMENT Bentgrass cultivar performance of one-year old fairway turf in Connecticut, National turfgrass evaluation program (NTEP) 2014 national fineleaf fescue ancillary test 2016 results National turfgrass evaluation program (NTEP) 2012 national tall fescue test 2016 results National Turfgrass Evaluation Program (NTEP) 2015 standard and ancillary low-input cool-season test, 2016 results.. 93 Efficacy trials of EPA minimum exempt products Transcriptome sequencing of the shadow-1 perennial ryegrass (Lolium perenne, L.) mutant provides insight into genetic mechanisms leading to dwarfism and shade tolerance SCIENTIFIC PUBLICATIONS (ABSTRACTS & CITATIONS) Can frequent measurement of normalized difference vegetative index and soil nitrate guide nitrogen fertilization of Kentucky bluegrass sod? Effect of plant growth-promoting Bacillus sp. on color and clipping yield of three turfgrass species Digitally quantifying sand particle shape and particle size distribution: Resultant effects on root zone bearing capacity Foliar N concentration and reflectance meters to guide N fertilization for anthracnose management of annual bluegrass putting green turf Influence of simulated rainfall on efficacy of fluazinam, chlorothalonil and iprodione for dollar spot control in creeping bentgrass Effect of phosphite rate and source on cyanobacteria colonization of putting green turf Dollar spot control using biofungicides and conventional fungicides applied based on the Smith-Kerns dollar spot model in creeping bentgrass fairway turf Influence of plant growth regulators on winter hardiness of annual bluegrass putting green turf A novel two-step method for screening shade tolerant mutant plants via dwarfism Isolation of prostrate turfgrass mutants via screening of dwarf phenotype and characterization of a perennial ryegrass prostrate mutant Turf manager response to changing pesticide regulations viii Table of Contents
11 PREVENTIVE ANTHRACNOSE CONTROL WITH VARIOUS FUNGICIDES ON AN ANNUAL BLUEGRASS PUTTING GREEN TURF, 2016 INTRODUCTION Anthracnose (caused by Colletotrichum cereale) is a devastating disease of annual bluegrass putting green turf. An integrated disease control program including cultural management and fungicides is required to minimize turf loss due to this disease. Rotational fungicide programs utilizing different chemical modes of action and multi-site fungicides have been found to be most effective in providing season-long anthracnose control. Identifying new fungicides with unique modes of action effective against anthracnose is important to continued control of this disease and resistance management. The objective of this study was to examine the efficacy of experimental and commonly used fungicides for anthracnose control on an annual bluegrass putting green turf. MATERIALS & METHODS A field study was conducted on an annual bluegrass (Poa annua) turf grown on a Paxton fine sandy loam at the Plant Science Research and Education Facility in Storrs, CT. Turf was mowed five days wk -1 at a bench setting of inches. Minimal nitrogen was applied to the study area to encourage anthracnose development. A total of 1.6 lb N 1000-ft -2 was applied as water soluble sources from March through 19 August. Overhead irrigation and hand-watering was applied as needed to prevent drought stress. A rotation of Xzemplar (0.26 fl.oz.), Curalan (1.0 oz.), and Emerald (0.18 oz.) was applied every 14-d between 26 May and 15 August to prevent dollar spot development; ProStar (1.5 oz.) was applied preventively for brown patch on 18 June and 15 July. Dylox 80WP (3.75 oz.) was applied on 27 May for control of annual bluegrass weevil. Wetting agents Dispatch (0.55 fl.oz.) and Revolution (6 fl.oz.) were applied on 18 Jun and 23 Jul. Treatments consisted of tank mixes and rotational programs of commercially available and developmental fungicides. Initial applications were made on 18 May prior to disease developing in the trial area, except UC16-15 and UC16-16 which were applied preventively on 31 May. Subsequent applications were made every 14-d through 9 August. All treatments were applied using a hand held CO 2 powered spray boom outfitted with a single AI9508E flat fan nozzle calibrated to deliver 2 gal 1000-ft -2 at 40 psi. Plots measured 3 x 6 ft and were arranged in a randomized complete block design with four replications. Anthracnose was determined visually as the percent area blighted by C. cereale from 13 June through 19 August. Turf quality was visually assessed on a 1 to 9 scale; where 9 represented the best possible quality turf and 6 was the minimum acceptable level. Phytotoxicity was also assessed visually on a 0 to 5 scale, where 0 was equal to no discoloration J. Inguagiato, K. Miele, J. Dunnack, Z. Esponda, and S. Vose Department of Plant Science and Landscape Architecture University of Connecticut, Storrs and 2 represented the maximum acceptable level of injury. Normalized difference vegetative index (NDVI) was calculated as the mean of 10 subsamples taken randomly throughout the plot area (NDVI 500, Spectrum Technologies). Algae severity was visually assessed on a 0 to 5 scale, where 0 was equal to no surface algae and 2 represented the maximum acceptable level of algae colonization. All data were subjected to an analysis of variance and means were separated using Fisher s Protected Least Significant Difference Test. Anthracnose severity data were log-transformed as necessary for ANOVA and mean separation tests, means were de-transformed for presentation. RESULTS AND DISCUSSION Anthracnose Severity Anthracnose pressure was low throughout most of this trial. Symptoms developed from a natural infestation on 13 Jun and increased slightly to 8 to 12% plot area blighted in untreated control plots throughout July before increasing to 43% plot area blighted by 19 Aug (Tables 1a & 1b). Most treatments significantly reduced anthracnose compared to untreated control throughout the trial (Tables 1 & 2). Among those fungicides which provided anthracnose control, few differences were observed. Anthracnose severity among the top performing fungicides was less than or equal to 3% plot area blighted, which was considered a good level of disease control in this trial. Treatments which consistently provided good anthracnose control in this trial included: rotational programs containing Appear, Primo MAXX, and Daconil Action, with Velista, or Medallion SC, Rotation Program, Fame+T, and Daconil Ultrex tank mixed with Signature, Signature XTRA, or Appear. Kabuto + TebuStar tank mixes regardless of rate or application interval, except Kabuto (0.5 fl.oz.) + TebuStar (0.68 fl.oz.) every 28-d, Medallion SC + Appear, and UC16-16 generally provided good control during mid-july through August, but were not different from untreated control during June and early-july. However, initial application of UC16-16 was not until 31 May, 2 weeks after all other treatments began. The Plant Food program, which included only nutrient and biostimulant based products with no fungicide, provided good anthracnose control through 15 Jul, but was no different than untreated control thereafter. UC16-15 did not differ from untreated control on all but one observation date in this trial. 1 Table of Contents
12 Transfilm did not influence efficacy of Kabuto + TebuStar tank mixes. Kabuto (0.5 fl.oz.) + TebuStar (0.68 fl.oz.) every 28-d and UC16-15 were consistently no different than untreated control. Turf Quality, Phytotoxicity, NDVI and Algae Severity Turf quality of treatments transitioned throughout the trial as growth regulation effects and anthracnose severity changed. Generally, treatments which provided good anthracnose control throughout the trial also had the greatest turf quality including: rotations of Appear, Primo MAXX, and Daconil Action, with Velista, or Medallion SC, Rotation Program, and Daconil Ultrex tank mixed with Signature, Signature XTRA, or Appear (Tables 2a & 2b). Turf quality of plots treated with Fame+T, Kabuto + TebuStar (regardless of rate or interval), and UC16-16 was unacceptable (< 6.0) from June through mid-july (15 Jul). Leaf texture of turf in these plots was course, surface uniformity appeared poor, and density was reduced. These effects were most pronounced where TebuStar was applied every 14-d at 1.1 or 0.7 fl.oz. with Kabuto, Fame+T, and UC16-16 which was apparent in the unacceptable phytotoxicity ratings (i.e., > 2.0) on 24 Jun and 1 Jul (Table 3). This turf response to tebuconazole is not uncommon when DMI fungicides are applied repeatedly, or at high rates. TebuStar applied with Kabuto every 28-d generally had better turf quality than equivalent rates applied every 14-d. However, despite poor turf quality during June and early-july, all treatments containing tebuconazole (i.e., TebuStar, Fame+T) provided acceptable turf quality ( 6.0) during late-july and early-august. Algae developed uniformly throughout the study area following a period of thunderstorms and overcast conditions on 8 Jul. All treatments containing chlorothalonil applied as Daconil Action and Daconil Ultrex had less algae than untreated control plots (Table 4). Similarly, plots treated with phosphite (i.e., Appear, Phosphite 30) or fosetyl-al (i.e., Signature, Signature Xtra). All other treatments increased algae compared to untreated control, except phosphate and the Plant Food Program. 2 Table of Contents
13 Table 1a. Effect of various fungicides on preventative anthracnose control in an annual bluegrass putting turf at the Plant Science Research and Education Facility in Storrs, CT during Anthracnose Severity Treatment Rate per 1000ft 2 Int x 13 Jun 17 Jun 24 Jun 1 Jul 8 Jul % plot area blighted Appear fl.oz. 14-d 0.0 t h s 0.2 hi 0.2 fgh 0.1 h 0.2 ef + Primo Maxx fl.oz. 14-d - Daconil Action fl.oz. pgm w - Velista oz. Appear fl.oz. 14-d 0.6 fgh 0.3 ghi 0.8 d-h 0.9 e-h 1.2 b-f +Primo Maxx fl.oz. 14-d - Daconil Action fl.oz. pgm v - Medallion SC fl.oz. Appear fl.oz. 14-d 0.0 h 0.2 hi 0.0 h 0.3 fgh 0.2 f +Primo Maxx fl.oz. 14-d +Daconil Action fl.oz. 14-d - Medallion SC fl.oz. pgm u - Velista oz. Kabuto fl.oz. 14-d 3.9 a-f 2.2 d-g 1.1 c-h 6.2 b-f 2.1 b-f + TebuStar fl.oz. Kabuto fl.oz. 28-d 2.9 a-g 3.0 b-f 1.4 c-h 5.7 b-f 1.8 b-f + TebuStar fl.oz. Kabuto fl.oz. 14-d 1.7 b-h 1.8 d-h 0.0 h 5.5 b-f 1.9 b-f + TebuStar fl.oz. Kabuto fl.oz. 28-d 0.9 d-h 1.1 e-i 0.0 h 0.8 e-h 0.3 ef + TebuStar fl.oz. Kabuto fl.oz. 14-d 3.4 a-f 2.9 c-f 0.3 fgh 3.5 c-h 0.9 def + TebuStar fl.oz. + Transfilm fl.oz. Kabuto fl.oz. 28-d 3.0 a-g 3.7 a-e 2.5 b-h 5.1 b-g 2.0 b-f + TebuStar fl.oz. + Transfilm fl.oz. Kabuto fl.oz. 14-d 2.5 a-g 2.0 d-h 1.3 c-h 3.2 c-h 1.1 b-f + TebuStar fl.oz. Kabuto fl.oz. 28-d 4.7 a-e 5.1 a-d 4.1 b-e 12.3 abc 5.1 abc + TebuStar fl.oz. Fame+T fl.oz. 28-d 1.2 c-h 1.2 e-i 0.2 fgh 4.2 c-h 1.1 b-f Phosphate fl.oz. 14-d 7.0 ab 9.9 a 8.0 ab 11.9 abc 5.0 a-d + Phosphite fl.oz. Phosphate fl.oz. 14-d 9.0 a 9.5 ab 19.1 a 20.6 a 17.3 a Phosphite fl.oz. 14-d 2.1 a-h 2.3 d-g 0.6 e-h 5.7 b-f 2.4 b-f UC fl.oz. 14-d 5.4 a-d 5.2 a-d 6.1 abc 8.8 a-d 2.7 b-f UC fl.oz. 14-d 8.7 a 9.0 abc 2.8 b-g 16.5 ab 5.7 ab Daconil Ultrex oz. 14-d 1.2 c-h 1.9 d-h 0.7 d-h 4.7 b-h 2.3 b-f + Signature oz. Daconil Ultrex oz. 14-d 0.2 gh 0.0 i 0.0 h 0.1 gh 0.2 ef + Signature XTRA oz. Daconil Ultrex oz. 14-d 0.0 h 0.8 e-i 0.1 gh 3.7 c-h 1.9 b-f + Appear fl.oz. Medallion SC fl.oz. 14-d 3.8 a-f 2.4 d-g 5.2 a-d 8.2 a-e 3.0 b-e + Appear fl.oz. Rotational Program z d 0.2 gh 0.0 i 0.3 fgh 2.5 c-h 0.9 c-f Plant Food Program y... 7-d 0.7 e-h 0.7 f-i 0.6 e-h 1.0 d-h 0.9 c-f Untreated abc 5.1 a-d 3.3 b-f 8.9 abc 4.2 bcd ANOVA: Treatment (P > F) Days after treatment 7-d d d z Rotational Program consisted of Signature XTRA (4.0 oz.), tank-mixed with the following treatments listed by application date. 18 May: Insignia SC (0.7 fl.oz.) + Chipco (4.0 fl.oz.), 31 May: Autilus (5.0 fl.oz) + Affirm (0.88 oz.), 15 June: Mirage (1.5 fl.oz.) + Medallion SC (1.0 fl.oz.), 28 June: Velista (0.5 oz.) + Daconil Action (2.0 fl.oz.), 12 July: Briskway (0.6 fl.oz.) + Segway (0.6 fl.oz.), 26 July: Medallion SC (1.0 fl.oz.) + Velista (0.5 oz.), 9 August: Affirm (0.88 oz.) + Daconil Action (2.0 fl.oz.). All rates are per 1000ft 2. y The Plant Foods Program consisted of Kelp Iron (3.0 fl.oz.) tank-mixed with the following treatments on an alternating weekly basis. Week 1: (6.0 fl.oz.) + Adams Earth (3.0 fl.oz.) + Phosphite 30 (3.0 fl.oz.). Week 2: Sugar Cal (3.0 fl.oz.) + Mg Nitrate (6.0 fl.oz.) + Omega (6.0 fl.oz.). All rates are per 1000ft2. x Treatments were initiated on 18 May, prior to disease development in the trial area. Treatments were reapplied on either a 7-d, 14-d, or 28-d basis. w Daconil Action and Velista were alternately tank-mixed with Appear + Primo Maxx v Daconil Action and Medallion SC were alternately tank-mixed with Appear + Primo Maxx u Medallion SC and Velista were alternately tank-mixed with Appear + Primo Maxx + Daconil Action tanthracnose data were log transformed. Means are detransformed for presentation. s Treatment means followed by the same letter, within each column, are not significantly different based on Fisher s protected least significant difference test (α = 0.05) 3 Table of Contents
14 Table 1b. Effect of various fungicides on preventative anthracnose control in an annual bluegrass putting turf at the Plant Science Research and Education Facility in Storrs, CT during Anthracnose Severity Treatment Rate per 1000ft 2 Int x 15 Jul 28 Jul 4 Aug 12 Aug 19 Aug % plot area blighted Appear fl.oz. 14-d 0.0 t g s 0.0 g 0.0 e x 0.0 g 0.8 hi + Primo Maxx fl.oz. 14-d - Daconil Action fl.oz. pgm w - Velista oz. Appear fl.oz. 14-d 0.4 efg 0.4 fg 0.6 de 0.0 g 1.7 hi +Primo Maxx fl.oz. 14-d - Daconil Action fl.oz. pgm v - Medallion SC fl.oz. Appear fl.oz. 14-d 0.1 g 0.2 fg 0.0 e 0.2 fg 0.0 i +Primo Maxx fl.oz. 14-d +Daconil Action fl.oz. 14-d - Medallion SC fl.oz. pgm u - Velista oz. Kabuto fl.oz. 14-d 0.6 d-g 0.7 efg 0.4 de 0.3 fg 0.0 i + TebuStar fl.oz. Kabuto fl.oz. 28-d 1.2 b-g 1.3 d-g 0.6 de 0.4 fg 1.9 hi + TebuStar fl.oz. Kabuto fl.oz. 14-d 1.0 b-g 0.7 efg 0.3 de 0.0 g 0.4 hi + TebuStar fl.oz. Kabuto fl.oz. 28-d 0.2 fg 0.0 g 0.0 e 0.0 g 0.4 hi + TebuStar fl.oz. Kabuto fl.oz. 14-d 0.4 efg 0.8 efg 0.3 de 0.7 fg 3.8 fgh + TebuStar fl.oz. + Transfilm fl.oz. Kabuto fl.oz. 28-d 1.3 b-g 0.7 efg 0.4 de 1.5 def 9.7 ef + TebuStar fl.oz. + Transfilm fl.oz. Kabuto fl.oz. 14-d 1.0 b-g 0.0 g 0.7 de 0.6 fg 1.3 hi + TebuStar fl.oz. Kabuto fl.oz. 28-d 3.8 abc 4.1 b-e 1.5 cde 3.3 de 13.3 de + TebuStar fl.oz. Fame+T fl.oz. 28-d 0.5 d-g 1.0 efg 0.5 de 1.3 d-g 1.4 hi Phosphate fl.oz. 14-d 4.9 ab 6.8 bc 4.4 bc 12.6 ab 21.2 cd + Phosphite fl.oz. Phosphate fl.oz. 14-d 9.0 a 25.4 a 23.0 a 30.4 a 54.3 a Phosphite fl.oz. 14-d 3.1 a-e 2.4 c-f 1.7 cd 4.3 cd 12.1 de UC fl.oz. 14-d 3.3 a-d 12.0 ab 9.7 ab 17.4 ab 32.4 bc UC fl.oz. 14-d 3.8 abc 2.0 c-g 0.9 de 0.9 efg 1.0 hi Daconil Ultrex oz. 14-d 0.6 d-g 0.5 fg 0.2 de 0.2 fg 1.5 hi + Signature oz. Daconil Ultrex oz. 14-d 0.00 g 0.3 fg 0.2 de 0.1 fg 2.1 ghi + Signature XTRA oz. Daconil Ultrex oz. 14-d 1.1 b-g 1.4 d-g 0.5 de 0.3 fg 0.4 hi + Appear fl.oz. Medallion SC fl.oz. 14-d 2.4 b-f 1.3 d-g 1.7 cd 1.2 efg 7.8 efg + Appear fl.oz. Rotational Program z d 0.7 c-g 0.6 fg 0.3 de 0.0 g 0.9 hi Plant Food Program y... 7-d 1.1 b-g 5.8 bcd 6.3 b 9.9 bc 38.2 ab Untreated ab 12.5 ab 10.4 ab 18.8 ab 42.5 ab ANOVA: Treatment (P > F) Days after treatment 7-d d d z Rotational Program consisted of Signature XTRA (4.0 oz.), tank-mixed with the following treatments listed by application date. 18 May: Insignia SC (0.7 fl.oz.) + Chipco (4.0 fl.oz.), 31 May: Autilus (5.0 fl.oz) + Affirm (0.88 oz.), 15 June: Mirage (1.5 fl.oz.) + Medallion SC (1.0 fl.oz.), 28 June: Velista (0.5 oz.) + Daconil Action (2.0 fl.oz.), 12 July: Briskway (0.6 fl.oz.) + Segway (0.6 fl.oz.), 26 July: Medallion SC (1.0 fl.oz.) + Velista (0.5 oz.), 9 August: Affirm (0.88 oz.) + Daconil Action (2.0 fl.oz.). All rates are per 1000ft 2. y The Plant Foods Program consisted of Kelp Iron (3.0 fl.oz.) tank-mixed with the following treatments on an alternating weekly basis. Week 1: (6.0 fl.oz.) + Adams Earth (3.0 fl.oz.) + Phosphite 30 (3.0 fl.oz.). Week 2: Sugar Cal (3.0 fl.oz.) + Mg Nitrate (6.0 fl.oz.) + Omega (6.0 fl.oz.). All rates are per 1000ft2. x Treatments were initiated on 18 May, prior to disease development in the trial area. Treatments were reapplied on either a 7-d, 14-d, or 28-d basis. w Daconil Action and Velista were alternately tank-mixed with Appear + Primo Maxx v Daconil Action and Medallion SC were alternately tank-mixed with Appear + Primo Maxx u Medallion SC and Velista were alternately tank-mixed with Appear + Primo Maxx + Daconil Action tanthracnose data were log transformed. Means are detransformed for presentation. s Treatment means followed by the same letter, within each column, are not significantly different based on Fisher s protected least significant difference test (α = 0.05) 4 Table of Contents
15 Table 2a. Effect of various fungicides on turf quality in an annual bluegrass putting turf at the Plant Science Research and Education Facility in Storrs, CT during Turf Quality Treatment Rate per 1000ft 2 Int x 6 Jun 10 Jun 17 Jun 24 Jun 1 Jul , 6=min acceptable Appear fl.oz. 14-d 7.5 a t 7.0 ab 7.7 a 6.5 a-e 7.2 ab + Primo Maxx fl.oz. 14-d - Daconil Action fl.oz. pgm w - Velista oz. Appear fl.oz. 14-d 7.5 a 6.8 ab 7.2 ab 6.5 a-e 6.4 a-d +Primo Maxx fl.oz. 14-d - Daconil Action fl.oz. pgm v - Medallion SC fl.oz. Appear fl.oz. 14-d 7.0 ab 7.0 ab 7.7 a 7.5 ab 6.7 abc +Primo Maxx fl.oz. 14-d +Daconil Action fl.oz. 14-d - Medallion SC fl.oz. pgm u - Velista oz. Kabuto fl.oz. 14-d 5.3 def 5.3 de 5.0 de 5.3 e-h 4.5 f + TebuStar fl.oz. Kabuto fl.oz. 28-d 5.0 ef 5.3 de 5.2 de 5.0 fgh 5.0 def + TebuStar fl.oz. Kabuto fl.oz. 14-d 5.0 ef 5.0 def 5.0 de 5.0 fgh 4.5 f + TebuStar fl.oz. Kabuto fl.oz. 28-d 5.8 cde 5.8 cd 5.7 cd 6.0 c-f 5.7 b-f + TebuStar fl.oz. Kabuto fl.oz. 14-d 6.0 cd 5.3 de 5.2 de 5.2 fgh 5.8 b-f + TebuStar fl.oz. + Transfilm fl.oz. Kabuto fl.oz. 28-d 5.8 cde 5.3 de 5.2 de 5.5 d-g 5.5 c-f + TebuStar fl.oz. + Transfilm fl.oz. Kabuto fl.oz. 14-d 5.5 de 5.3 de 5.2 de 5.5 d-g 5.2 c-f + TebuStar fl.oz. Kabuto fl.oz. 28-d 5.3 def 5.0 def 4.5 ef 4.5 gh 4.5 f + TebuStar fl.oz. Fame+T fl.oz. 28-d 6.0 cd 5.3 de 5.0 de 5.0 fgh 4.7 ef Phosphate fl.oz. 14-d 5.3 def 5.0 def 5.0 de 5.0 fgh 5.2 c-f + Phosphite fl.oz. Phosphate fl.oz. 14-d 5.0 ef 4.3 f 3.9 f 4.5 gh 4.7 ef Phosphite fl.oz. 14-d 5.7 de 5.3 de 4.8 def 5.9 c-f 6.1 a-e UC fl.oz. 14-d 5.0 ef 5.3 de 4.9 de 5.0 fgh 5.0 def UC fl.oz. 14-d 5.0 ef 4.6 ef 4.5 ef 4.2 h 5.2 c-f Daconil Ultrex oz. 14-d 6.5 bc 6.3 bc 5.7 cd 5.8 c-g 5.4 c-f + Signature oz. Daconil Ultrex oz. 14-d 7.8 a 7.5 a 8.0 a 7.8 a 7.7 a + Signature XTRA oz. Daconil Ultrex oz. 14-d 7.0 ab 6.8 ab 6.5 bc 6.3 b-f 5.7 b-f + Appear fl.oz. Medallion SC fl.oz. 14-d 5.7 de 5.3 de 5.2 de 5.2 fgh 6.1 a-e + Appear fl.oz. Rotational Program z d 7.8 a 6.8 ab 8.0 a 7.0 abc 5.9 b-e Plant Food Program y... 7-d 6.5 bc 6.3 bc 6.2 bc 6.8 a-d 6.0 a-e Untreated f 5.0 def 5.0 de 5.3 e-h 5.0 def ANOVA: Treatment (P > F) Days after treatment 7-d d d z Rotational Program consisted of Signature XTRA (4.0 oz.), tank-mixed with the following treatments listed by application date. 18 May: Insignia SC (0.7 fl.oz.) + Chipco (4.0 fl.oz.), 31 May: Autilus (5.0 fl.oz) + Affirm (0.88 oz.), 15 June: Mirage (1.5 fl.oz.) + Medallion SC (1.0 fl.oz.), 28 June: Velista (0.5 oz.) + Daconil Action (2.0 fl.oz.), 12 July: Briskway (0.6 fl.oz.) + Segway (0.6 fl.oz.), 26 July: Medallion SC (1.0 fl.oz.) + Velista (0.5 oz.), 9 August: Affirm (0.88 oz.) + Daconil Action (2.0 fl.oz.). All rates are per 1000ft 2. y The Plant Foods Program consisted of Kelp Iron (3.0 fl.oz.) tank-mixed with the following treatments on an alternating weekly basis. Week 1: (6.0 fl.oz.) + Adams Earth (3.0 fl.oz.) + Phosphite 30 (3.0 fl.oz.). Week 2: Sugar Cal (3.0 fl.oz.) + Mg Nitrate (6.0 fl.oz.) + Omega (6.0 fl.oz.). All rates are per 1000ft2. x Treatments were initiated on 18 May, prior to disease development in the trial area. Treatments were reapplied on either a 7-d, 14-d, or 28-d basis. w Daconil Action and Velista were alternately tank-mixed with Appear + Primo Maxx v Daconil Action and Medallion SC were alternately tank-mixed with Appear + Primo Maxx u Medallion SC and Velista were alternately tank-mixed with Appear + Primo Maxx + Daconil Action ttreatment means followed by the same letter, within each column, are not significantly different based on Fisher s protected least significant difference test (α = 0.05) 5 Table of Contents
16 Table 2b. Effect of various fungicides on turf quality in an annual bluegrass putting turf at the Plant Science Research and Education Facility in Storrs, CT during Turf Quality Treatment Rate per 1000ft 2 Int x 8 Jul 15 Jul 28 Jul 4 Aug 19 Aug , 6=min acceptable Appear fl.oz. 14-d 7.0 ab t 7.7 ab 8.5 ab 8.0 abc 8.0 ab + Primo Maxx fl.oz. 14-d - Daconil Action fl.oz. pgm w - Velista oz. Appear fl.oz. 14-d 7.3 ab 7.7 ab 8.8 a 7.5 a-e 6.8 b-e +Primo Maxx fl.oz. 14-d - Daconil Action fl.oz. pgm v - Medallion SC fl.oz. Appear fl.oz. 14-d 7.5 a 7.3 abc 8.3 abc 8.5 ab 8.3 a +Primo Maxx fl.oz. 14-d +Daconil Action fl.oz. 14-d - Medallion SC fl.oz. pgm u - Velista oz. Kabuto fl.oz. 14-d 3.3 hi 5.3 fgh 6.0 ghi 6.5 def 7.8 abc + TebuStar fl.oz. Kabuto fl.oz. 28-d 4.0 f-i 6.7 b-e 6.0 ghi 7.3 b-e 6.3 def + TebuStar fl.oz. Kabuto fl.oz. 14-d 3.3 hi 5.3 fgh 6.0 ghi 7.5 a-e 8.0 ab + TebuStar fl.oz. Kabuto fl.oz. 28-d 4.8 d-g 6.7 b-e 7.8 a-d 8.0 abc 6.8 b-e + TebuStar fl.oz. Kabuto fl.oz. 14-d 2.9 i 4.9 gh 6.0 ghi 7.0 cde 6.5 cde + TebuStar fl.oz. + Transfilm fl.oz. Kabuto fl.oz. 28-d 4.0 f-i 5.7 efg 6.3 fgh 7.8 a-d 5.0 fgh + TebuStar fl.oz. + Transfilm fl.oz. Kabuto fl.oz. 14-d 3.5 hi 6.0 d-g 8.0 abc 7.5 a-e 7.0 a-d + TebuStar fl.oz. Kabuto fl.oz. 28-d 4.3 e-h 5.7 efg 6.0 ghi 6.5 def 4.5 gh + TebuStar fl.oz. Fame+T fl.oz. 28-d 4.3 e-h 6.3 c-f 6.8 d-g 7.3 b-e 6.0 def Phosphate fl.oz. 14-d 5.0 def 5.0 gh 5.0 ijk 5.5 fg 4.5 gh + Phosphite fl.oz. Phosphate fl.oz. 14-d 3.8 ghi 4.3 h 4.0 k 4.3 g 3.0 i Phosphite fl.oz. 14-d 5.3 cde 5.4 fgh 5.3 hij 6.3 ef 5.5 efg UC fl.oz. 14-d 4.8 d-g 5.3 fgh 4.8 jk 4.8 g 3.8 hi UC fl.oz. 14-d 3.9 f-i 5.9 d-g 6.3 e-h 6.4 ef 6.9 a-e Daconil Ultrex oz. 14-d 7.0 ab 7.0 a-d 7.5 b-e 7.8 a-d 7.3 a-d + Signature oz. Daconil Ultrex oz. 14-d 8.0 a 8.0 a 8.5 ab 8.8 a 6.8 b-e + Signature XTRA oz. Daconil Ultrex oz. 14-d 7.0 ab 6.7 b-e 7.3 c-f 7.5 a-e 7.0 a-d + Appear fl.oz. Medallion SC fl.oz. 14-d 5.6 cd 5.4 fgh 7.3 b-f 7.5 a-e 6.3 def + Appear fl.oz. Rotational Program z d 6.3 bc 6.7 b-e 8.3 abc 8.0 abc 7.8 abc Plant Food Program y... 7-d 5.5 cd 5.4 fgh 6.3 fgh 5.3 fg 3.0 i Untreated d-g 5.0 gh 4.8 jk 4.8 g 3.0 i ANOVA: Treatment (P > F) Days after treatment 7-d d d Rotational Program consisted of Signature XTRA (4.0 oz.), tank-mixed with the following treatments listed by application date. 18 May: Insignia SC (0.7 fl.oz.) + Chipco (4.0 fl.oz.), 31 May: Autilus (5.0 fl.oz) + Affirm (0.88 oz.), 15 June: Mirage (1.5 fl.oz.) + Medallion SC (1.0 fl.oz.), 28 June: Velista (0.5 oz.) + Daconil Action (2.0 fl.oz.), 12 July: Briskway (0.6 fl.oz.) + Segway (0.6 fl.oz.), 26 July: Medallion SC (1.0 fl.oz.) + Velista (0.5 oz.), 9 August: Affirm (0.88 oz.) + Daconil Action (2.0 fl.oz.). All rates are per 1000ft 2. y The Plant Foods Program consisted of Kelp Iron (3.0 fl.oz.) tank-mixed with the following treatments on an alternating weekly basis. Week 1: (6.0 fl.oz.) + Adams Earth (3.0 fl.oz.) + Phosphite 30 (3.0 fl.oz.). Week 2: Sugar Cal (3.0 fl.oz.) + Mg Nitrate (6.0 fl.oz.) + Omega (6.0 fl.oz.). All rates are per 1000ft2. x Treatments were initiated on 18 May, prior to disease development in the trial area. Treatments were reapplied on either a 7-d, 14-d, or 28-d basis. w Daconil Action and Velista were alternately tank-mixed with Appear + Primo Maxx v Daconil Action and Medallion SC were alternately tank-mixed with Appear + Primo Maxx u Medallion SC and Velista were alternately tank-mixed with Appear + Primo Maxx + Daconil Action ttreatment means followed by the same letter, within each column, are not significantly different based on Fisher s protected least significant difference test (α = 0.05) 6 Table of Contents
17 Table 3. Effect of various fungicides on phytotoxicity in an annual bluegrass putting turf at the Plant Science Research and Education Facility in Storrs, CT during Phytotoxicity Treatment Rate per 1000ft 2 Int x 10 Jun 17 Jun 24 Jun 1 Jul 28 Jul 4 Aug 19 Aug ; 2 = max acceptable Appear fl.oz. 14-d 0.0 e t 0.0c 0.0 e 0.0 g 0.0 e Primo Maxx fl.oz. 14-d - Daconil Action fl.oz. pgm w - Velista oz. Appear fl.oz. 14-d 0.0 e 0.0c 0.0 e 0.0 g 0.0 e Primo Maxx fl.oz. 14-d - Daconil Action fl.oz. pgm v - Medallion SC fl.oz. Appear fl.oz. 14-d 0.0 e 0.0c 0.0 e 0.0 g 0.0 e Primo Maxx fl.oz. 14-d +Daconil Action fl.oz. 14-d - Medallion SC fl.oz. pgm u - Velista oz. Kabuto fl.oz. 14-d 0.9 ab 0.5b 2.5 ab 2.3 a 0.7 a-d TebuStar fl.oz. Kabuto fl.oz. 28-d 0.6 bc 0.3bc 1.8 abc 1.5 bcd 1.0 ab TebuStar fl.oz. Kabuto fl.oz. 14-d 1.6 a 1.0a 2.8 a 2.0 ab 0.4 b-e TebuStar fl.oz. Kabuto fl.oz. 28-d 0.1 cde 0.0c 1.5 bcd 0.8 ef 0.4 b-e TebuStar fl.oz. Kabuto fl.oz. 14-d 0.3 bcd 0.3b 1.3 cd 1.6 a-d 1.3 a TebuStar fl.oz. + Transfilm fl.oz. Kabuto fl.oz. 28-d 0.1 cde 0.0c 0.5 de 1.0 de 0.2 de TebuStar fl.oz. + Transfilm fl.oz. Kabuto fl.oz. 14-d 0.3 bcd 0.0c 1.8 abc 1.0 de 0.6 a-d TebuStar fl.oz. Kabuto fl.oz. 28-d 0.1 de 0.0c 1.0 cde 1.3 cde 0.2 de TebuStar fl.oz. Fame+T fl.oz. 28-d 0.2 cde 0.3bc 2.0 abc 1.8 abc 0.9 abc Phosphate fl.oz. 14-d 0.0 e 0.0c 0.0 e 0.0 g 0.0 e Phosphite fl.oz. Phosphate fl.oz. 14-d 0.0 e 0.0c 0.0 e 0.0 g 0.0 e Phosphite fl.oz. 14-d 0.0 e 0.0c 0.0 e 0.0 g 0.0 e UC fl.oz. 14-d 0.0 e 0.0c 0.0 e 0.0 g 0.0 e UC fl.oz. 14-d 0.1 cde 0.0c 1.7 abc 1.0 de 0.2 cde Daconil Ultrex oz. 14-d 0.0 e 0.0c 0.5 de 0.3 fg 0.0 e Signature oz. Daconil Ultrex oz. 14-d 0.0 e 0.0c 0.0 e 0.0 g 0.0 e Signature XTRA oz. Daconil Ultrex oz. 14-d 0.0 e 0.0c 0.0 e 0.0 g 0.0 e Appear fl.oz. Medallion SC fl.oz. 14-d 0.0 e 0.0c 0.0 e 0.0 g 0.0 e Appear fl.oz. Rotational Program z d 0.0 e 0.0c 0.0 e 0.0 g 0.0 e Plant Food Program y... 7-d 0.0 e 0.0 c 0.5 de 0.0 g 0.0 e Untreated e 0.0 c 0.0 e 0.0 g 0.3 cde ANOVA: Treatment (P > F) Days after treatment 7-d d d Rotational Program consisted of Signature XTRA (4.0 oz.), tank-mixed with the following treatments listed by application date. 18 May: Insignia SC (0.7 fl.oz.) + Chipco (4.0 fl.oz.), 31 May: Autilus (5.0 fl.oz) + Affirm (0.88 oz.), 15 June: Mirage (1.5 fl.oz.) + Medallion SC (1.0 fl.oz.), 28 June: Velista (0.5 oz.) + Daconil Action (2.0 fl.oz.), 12 July: Briskway (0.6 fl.oz.) + Segway (0.6 fl.oz.), 26 July: Medallion SC (1.0 fl.oz.) + Velista (0.5 oz.), 9 August: Affirm (0.88 oz.) + Daconil Action (2.0 fl.oz.). All rates are per 1000ft 2. y The Plant Foods Program consisted of Kelp Iron (3.0 fl.oz.) tank-mixed with the following treatments on an alternating weekly basis. Week 1: (6.0 fl.oz.) + Adams Earth (3.0 fl.oz.) + Phosphite 30 (3.0 fl.oz.). Week 2: Sugar Cal (3.0 fl.oz.) + Mg Nitrate (6.0 fl.oz.) + Omega (6.0 fl.oz.). All rates are per 1000ft2. x Treatments were initiated on 18 May, prior to disease development in the trial area. Treatments were reapplied on either a 7-d, 14-d, or 28-d basis. w Daconil Action and Velista were alternately tank-mixed with Appear + Primo Maxx v Daconil Action and Medallion SC were alternately tank-mixed with Appear + Primo Maxx u Medallion SC and Velista were alternately tank-mixed with Appear + Primo Maxx + Daconil Action ttreatment means followed by the same letter, within each column, are not significantly different based on Fisher s protected least significant difference test (α = 0.05) 7 Table of Contents
18 Table 4. Effect of various fungicides on NDVI and algae severity in an annual bluegrass putting turf at the Plant Science Research and Education Facility in Storrs, CT during NDVI Algae Severity Treatment Rate per 1000ft 2 Int x 1 Jul 8 Jul 27 Jul 12 Aug 8 July Vegetation Index ; 2=max-- Appear fl.oz. 14-d ab t gh + Primo Maxx fl.oz. 14-d - Daconil Action fl.oz. pgm w - Velista oz. Appear fl.oz. 14-d ab hi +Primo Maxx fl.oz. 14-d - Daconil Action fl.oz. pgm v - Medallion SC fl.oz. Appear fl.oz. 14-d a-f hi +Primo Maxx fl.oz. 14-d +Daconil Action fl.oz. 14-d - Medallion SC fl.oz. pgm u - Velista oz. Kabuto fl.oz. 14-d a-f ab + TebuStar fl.oz. Kabuto fl.oz. 28-d a-d ab + TebuStar fl.oz. Kabuto fl.oz. 14-d abc ab + TebuStar fl.oz. Kabuto fl.oz. 28-d abc bc + TebuStar fl.oz. Kabuto fl.oz. 14-d a-e a + TebuStar fl.oz. + Transfilm fl.oz. Kabuto fl.oz. 28-d abc bc + TebuStar fl.oz. + Transfilm fl.oz. Kabuto fl.oz. 14-d abc ab + TebuStar fl.oz. Kabuto fl.oz. 28-d b-g bc + TebuStar fl.oz. Fame+T fl.oz. 28-d a-f ab Phosphate fl.oz. 14-d def fg + Phosphite fl.oz. Phosphate fl.oz. 14-d g cd Phosphite fl.oz. 14-d eg fg UC fl.oz. 14-d c-g cd UC fl.oz. 14-d fg ab Daconil Ultrex oz. 14-d a-e i + Signature oz. Daconil Ultrex oz. 14-d abc i + Signature XTRA oz. Daconil Ultrex oz. 14-d abc i + Appear fl.oz. Medallion SC fl.oz. 14-d a-f fg + Appear fl.oz. Rotational Program z d a ghi Plant Food Program y... 7-d ab ef Untreated f de ANOVA: Treatment (P > F) Days after treatment 7-d d d Rotational Program consisted of Signature XTRA (4.0 oz.), tank-mixed with the following treatments listed by application date. 18 May: Insignia SC (0.7 fl.oz.) + Chipco (4.0 fl.oz.), 31 May: Autilus (5.0 fl.oz) + Affirm (0.88 oz.), 15 June: Mirage (1.5 fl.oz.) + Medallion SC (1.0 fl.oz.), 28 June: Velista (0.5 oz.) + Daconil Action (2.0 fl.oz.), 12 July: Briskway (0.6 fl.oz.) + Segway (0.6 fl.oz.), 26 July: Medallion SC (1.0 fl.oz.) + Velista (0.5 oz.), 9 August: Affirm (0.88 oz.) + Daconil Action (2.0 fl.oz.). All rates are per 1000ft 2. y The Plant Foods Program consisted of Kelp Iron (3.0 fl.oz.) tank-mixed with the following treatments on an alternating weekly basis. Week 1: (6.0 fl.oz.) + Adams Earth (3.0 fl.oz.) + Phosphite 30 (3.0 fl.oz.). Week 2: Sugar Cal (3.0 fl.oz.) + Mg Nitrate (6.0 fl.oz.) + Omega (6.0 fl.oz.). All rates are per 1000ft2. x Treatments were initiated on 18 May, prior to disease development in the trial area. Treatments were reapplied on either a 7-d, 14-d, or 28-d basis. w Daconil Action and Velista were alternately tank-mixed with Appear + Primo Maxx v Daconil Action and Medallion SC were alternately tank-mixed with Appear + Primo Maxx u Medallion SC and Velista were alternately tank-mixed with Appear + Primo Maxx + Daconil Action ttreatment means followed by the same letter, within each column, are not significantly different based on Fisher s protected least significant difference test (α = 0.05) 8 Table of Contents
19 PREVENTIVE ANTHRACNOSE CONTROL WITH OREON AND AUTILUS FUNGICIDES ON AN ANNUAL BLUEGRASS PUTTING GREEN TURF, 2016 INTRODUCTION Anthracnose (caused by Colletotrichum cereale) is a devastating disease of annual bluegrass putting green turf. An integrated disease control program including cultural management and fungicides is required to minimize turf loss due to this disease. Rotational fungicide programs utilizing different chemical modes of action and multi-site fungicides have been found to be most effective in providing season-long anthracnose control. Identifying new fungicides with unique modes of action effective against anthracnose is important to continued control of this disease and resistance management. The objective of this study was to examine the efficacy of experimental and commonly used fungicides for anthracnose control on an annual bluegrass putting green turf. MATERIALS & METHODS A field study was conducted on an annual bluegrass (Poa annua) turf grown on a Paxton fine sandy loam at the Plant Science Research and Education Facility in Storrs, CT. Turf was mowed five days wk -1 at a bench setting of inches. Minimal nitrogen was applied to the study area to encourage anthracnose development. A total of 1.6 lb N 1000-ft -2 was applied as water soluble sources from March through 19 August. Overhead irrigation and hand-watering was applied as needed to prevent drought stress. A rotation of Xzemplar (0.26 fl.oz.), Curalan (1.0 oz.), and Emerald (0.18 oz.) was applied every 14-d between 26 May and 15 August to prevent dollar spot development; ProStar (1.5 oz.) was applied preventively for brown patch on 18 June and 15 July. Dylox 80WP (3.75 oz.) was applied on 27 May for control of annual bluegrass weevil. Wetting agents Dispatch (0.55 fl.oz.) and Revolution (6 fl.oz.) were applied on 18 Jun and 23 Jul. Treatments consisted of OREON, Autilus, or UC16-14 tank mixed with various commercially available fungicides. UC16-13 was also evaluated at various application rates. Initial applications were made on 18 May prior to disease developing in the trial area, except UC16-15 and UC16-16 which were applied preventively on 31 May. Subsequent applications were made every 14-d through 9 August. All treatments were applied using a hand held CO 2 powered spray boom outfitted with a single AI9508E flat fan nozzle calibrated to deliver 2 gal ft -2 at 40 psi. Plots measured 3 x 6 ft and were arranged in a randomized complete block design with four replications. Anthracnose was determined visually as the percent area blighted by C. cereale from 13 June through 19 August. Turf quality was visually assessed on a 1 to 9 scale; where 9 represented the best possible quality turf and 6 was the minimum acceptable level. Phytotoxicity was also assessed visually on a 0 to 5 scale, where 0 was equal to no discoloration J. Inguagiato, K. Miele, J. Dunnack, Z. Esponda, and S. Vose Department of Plant Science and Landscape Architecture University of Connecticut, Storrs and 2 represented the maximum acceptable level of injury. Normalized difference vegetative index (NDVI) was calculated as the mean of 10 subsamples taken randomly throughout the plot area (NDVI 500, Spectrum Technologies). Algae severity was visually assessed on a 0 to 5 scale, where 0 was equal to no surface algae and 2 represented the maximum acceptable level of algae colonization. All data were subjected to an analysis of variance and means were separated using Fisher s Protected Least Significant Difference Test. Anthracnose severity data were arc-sin or log-transformed as necessary for ANOVA and mean separation tests, means were de-transformed for presentation. RESULTS AND DISCUSSION Anthracnose Severity Anthracnose pressure was moderate throughout most of this trial. Symptoms developed from a natural infestation on 13 June and increased to a sustained, moderate level of disease (~ 30% plot area blighted) in untreated control plots throughout June, July, and August (Tables 1a & 1b). OREON tank-mixed with PAR generally provided excellent to good anthracnose control throughout the duration of the trial (Tables 1a + 1b). No differences in anthracnose control were observed among rates of OREON ranging from 4.0 to 8.0 fl.oz. Autilus or UC16-14 were also evaluated as tank-mixes with PAR, and provided excellent anthracnose control, comparable to OREON. UC16-14 was evaluated as a tank-mix partner with several commonly applied fungicides. Results varied among tank-mix combinations. The most consistent differences in anthracnose control occurred between Insignia SC, Heritage TL, and Medallion SC applied alone compared to tank mixes of each of these with UC In each of these cases, the tank mix reduced anthracnose compared to the former fungicides applied alone. Tank-mixing fungicides is typically more effective for controlling anthracnose than applying single products, as is apparent in Medallion SC plots. However, in this study the benefit of tank-mixing UC16-14 with Insignia SC or Heritage TL was particularly evident since, these fungicides have previously been observed to be ineffective at controlling anthracnose at this particular site; likely due to resistance of the pathogen to strobilurin fungicides. Differences between tankmixes of UC16-14 and Velista or Signature XTRA were also apparent, albeit observed less frequently. These tank mixes reduced anthracnose 4 to 13% or 2 to 9% compared to Velista or Signature XTRA, respectively. Tank-mixing UC16-14 with Civitas One generally was no different than Civitas One alone; although the tank mix appeared to reduce the efficacy of UC UC16-14 applied in the absence of Civitas One generally 9 Table of Contents
20 contained 2 to 9% less anthracnose than UC Civitas One. Applications of UC16-13 consistently reduced anthracnose compared to untreated control, although failed to provide acceptable disease control during mid- to late-june. Anthracnose control improved during July and August with all rates reducing disease to 5% disease. Turf Quality, Phytotoxicity, NDVI and Algae Severity Turf quality of treatments transitioned throughout the trial as growth regulation effects and anthracnose severity changed. Generally, treatments which provided good anthracnose control throughout the trial and contained a green pigment also had the greatest turf quality including: Autilus + PAR, UC PAR, Velista + UC PAR, Insignia SC + UC PAR, Medallion SC + UC PAR, and Signature XTRA + UC16-14 (Tables 2a & 2b). Plots treated with Civitas One + UC16-14 contained slight, albeit acceptable, phytotoxicity symptoms (slight chlorosis) on 1 July (Table 4). However, symptoms were more pronounced on 28 July, increasing to an unacceptable yellow discoloration. The tank mix increased phytotoxicity compared to either material applied individually. It may be possible that the mineral oil in Civitas One enhanced uptake of the active ingredient in UC16-14 resulting in phytotoxicity and reduced anthracnose control. 10 Table of Contents
21 Table 1a. Effect of new and experimental AMVAC fungicides tank-mixed with various fungicides on anthracnose on an annual bluegrass putting green at the Plant Science Research and Education Facility in Storrs, CT during Anthracnose Severity Treatment Rate per 1000ft 2 Int z 13 Jun 17 Jun 24 Jun 1 Jul 8 Jul % plot area blighted OREON fl.oz. 14-d 0.1 y gh x 0.1 y hi 3.4 y f-j 3.5 y e-i 2.0 y d-g + Harrell s Par fl.oz. OREON fl.oz. 14-d 0.0 h 0.0 i 0.3 j 0.6 hi 0.1 g + Harrell s Par fl.oz. OREON fl.oz. 14-d 0.0 h 0.1 hi 2.0 g-j 5.9 d-h 0.1 g + Harrell s Par fl.oz. Autilus fl.oz. 14-d 0.0 h 0.1 hi 1.5 hij 1.1 hi 0.4 fg + Harrell s Par fl.oz. UC fl.oz. 14-d 0.1 gh 0.1 hi 1.1 ij 0.5 i 0.1 g + Harrell s Par fl.oz. Velista oz. 14-d 4.7 b-e 11.6 bcd 15.2 b-e 13.4 bcd 6.8 cd Velista oz. 14-d 0.0 h 0.0 i 2.4 f-j 2.8 f-i 1.8 d-g + UC fl.oz. + Harrell s Par fl.oz. Insignia SC fl.oz. 14-d 9.4 bc 9.0 cde 23.6 a-d 18.5 abc 21.6 ab Insignia SC fl.oz. 14-d 0.0 h 0.1 hi 1.7 hij 0.7 hi 0.1 g + UC fl.oz. + Harrell s Par fl.oz. Heritage TL fl.oz. 14-d 26.3 a 22.2 a 30.9 ab 30.6 a 23.5 ab Heritage TL fl.oz. 14-d 0.0 h 0.0 i 0.7 hij 2.5 f-i 0.7 efg + UC fl.oz. + Harrell s Par fl.oz. Medallion SC fl.oz. 14-d 6.1 bcd 11.1 b-e 27.3 abc 8.8 b-g 5.3 cde Medallion SC fl.oz. 14-d 0.0 h 0.0 i 0.6 j 0.5 i 0.1 g + UC fl.oz. + Harrell s Par fl.oz. Signature Xtra oz. 14-d 0.9 e-h 1.8 gh 8.1 e-i 11.2 b-e 6.1 cd Signature Xtra oz. 14-d 0.0 h 0.1 hi 5.4 e-j 1.8 ghi 0.7 efg + UC fl.oz. Civitas One fl.oz. 14-d 0.6 fgh 3.6 fg 12.1 c-f 12.9 bcd 8.0 cd Civitas One fl.oz. 14-d 1.4 d-h 3.6 fg 10.2 d-h 8.3 c-f 4.0 def + UC fl.oz. UC fl.oz. 21-d 10.4 bc 13.4 bc 22.9 a-d 20.3 ab 13.5 bc UC fl.oz. 21-d 3.7 c-f 5.1 efg 11.6 c-g 10.5 b-f 5.6 cde UC fl.oz. 21-d 10.9 b 7.9 c-f 24.2 a-d 12.3 b-e 4.8 cde Mirage fl.oz. 14-d 2.2 d-g 5.8 d-g 17.1 b-e 17.2 abc 6.8 cd Untreated a 17.4 ab 35.9 a 29.3 a 25.8 a ANOVA: Treatment (P > F) Days after treatment 14-d d z Treatments were initiated on 18 May, prior to disease development. Subsequent 14-d treatments were made on 31 May, 15 June, 29 June, 12 July, and 28 July. Subsequent 21-d treatments were made on 7 June, 29 June, and 20 July. y Data were automatically arc-sin square root transformed. Means are de-transformed for presentation. x Treatment means followed by the same letter, within each column, are not significantly different based on Fisher s protected least significant difference test (α = 0.05). 11 Table of Contents
22 Table 1b. Effect of new and experimental AMVAC fungicides tank-mixed with various fungicides on anthracnose on an annual bluegrass putting green at the Plant Science Research and Education Facility in Storrs, CT during Anthracnose Severity Treatment Rate per 1000ft 2 Int z 15 Jul 28 Jul 4 Aug 12 Aug % plot area blighted OREON fl.oz. 14-d 0.8 y c-g x 1.1 y def 0.0 y e z 0.0 y h + Harrell s Par fl.oz. OREON fl.oz. 14-d 0.2 fg 0.2 ef 0.2 de 0.2 fgh + Harrell s Par fl.oz. OREON fl.oz. 14-d 0.0 g 2.1 b-f 0.1 de 1.2 d-h + Harrell s Par fl.oz. Autilus fl.oz. 14-d 0.1 g 0.0 f 0.2 de 0.3 e-h + Harrell s Par fl.oz. UC fl.oz. 14-d 0.2 fg 0.6 ef 0.0 e 0.0 h + Harrell s Par fl.oz. Velista oz. 14-d 2.1 b-e 1.4 c-f 0.3 de 0.3 e-h Velista oz. 14-d 0.3 efg 0.3 ef 0.1 de 0.5 e-h + UC fl.oz. + Harrell s Par fl.oz. Insignia SC fl.oz. 14-d 16.3 a 38.6 a 22.0 a 26.7 a Insignia SC fl.oz. 14-d 0.2 fg 0.00 f 0.0 e 0.1 gh + UC fl.oz. + Harrell s Par fl.oz. Heritage TL fl.oz. 14-d 19.9 a 42.2 a 18.4 a 35.0 a Heritage TL fl.oz. 14-d 0.7 d-g 0.9 def 0.4 de 0.9 e-h + UC fl.oz. + Harrell s Par fl.oz. Medallion SC fl.oz. 14-d 2.5 bcd 5.8 bc 0.8 cde 6.5 bc Medallion SC fl.oz. 14-d 0.2 fg 0.3 ef 0.2 de 0.0 h + UC fl.oz. + Harrell s Par fl.oz. Signature Xtra oz. 14-d 1.5 b-g 1.2 c-f 0.5 de 2.2 cde Signature Xtra oz. 14-d 0.1 g 0.8 ef 0.0 e 0.2 fgh + UC fl.oz. Civitas One fl.oz. 14-d 3.1 bc 8.2 b 4.9 b 20.9 a Civitas One fl.oz. 14-d 1.4 b-g 2.2 b-e 1.0 cde 1.7 def + UC fl.oz. UC fl.oz. 21-d 4.7 b 4.5 bcd 1.3 cd 4.2 bcd UC fl.oz. 21-d 1.8 b-f 2.5 b-e 2.3 bc 7.4 b UC fl.oz. 21-d 2.1 b-e 2.4 b-e 1.0 cde 1.7 d-g Mirage fl.oz. 14-d 1.1 c-g 0.9 def 0.0 e 0.3 e-h Untreated a 30.4 a 12.8 a 30.3 a ANOVA: Treatment (P > F) Days after treatment 14-d d z Treatments were initiated on 18 May, prior to disease development. Subsequent 14-d treatments were made on 31 May, 15 June, 29 June, 12 July, and 28 July. Subsequent 21-d treatments were made on 7 June, 29 June, and 20 July. y Data were automatically log transformed. Means are de-transformed for presentation. x Treatment means followed by the same letter, within each column, are not significantly different based on Fisher s protected least significant difference test (α = 0.05). 12 Table of Contents
23 Table 2a. Effect of new and experimental AMVAC fungicides tank-mixed with various fungicides on Turf Quality on an annual bluegrass putting green at the Plant Science Research and Education Facility in Storrs, CT during Turf Quality Treatment Rate per 1000ft 2 Int z 6 Jun 10 Jun 17 Jun 24 Jun ; 6=min acceptable OREON fl.oz. 14-d 6.8 bcd y 6.5 cde 7.0 ab 6.4 x abc + Harrell s Par fl.oz. OREON fl.oz. 14-d 7.3 ab 7.5 ab 7.5 a 7.0 ab + Harrell s Par fl.oz. OREON fl.oz. 14-d 7.0 abc 6.8 bcd 7.0 ab 6.4 abc + Harrell s Par fl.oz. Autilus fl.oz. 14-d 7.0 abc 7.5 ab 7.0 ab 7.2 a + Harrell s Par fl.oz. UC fl.oz. 14-d 6.5 cde 7.3 abc 7.5 a 7.2 a + Harrell s Par fl.oz. Velista oz. 14-d 5.8 fgh 5.5 fg 4.3 def 4.7 efg Velista oz. 14-d 7.0 abc 7.3 abc 7.3 a 6.9 ab + UC fl.oz. + Harrell s Par fl.oz. Insignia SC fl.oz. 14-d 5.5 gh 5.3 gh 4.5 de 4.5 fg Insignia SC fl.oz. 14-d 7.5 a 7.3 abc 7.5 a 6.7 ab + UC fl.oz. + Harrell s Par fl.oz. Heritage TL fl.oz. 14-d 5.3 h 4.5 hi 3.5 ef 4.0 g Heritage TL fl.oz. 14-d 6.8 bcd 6.8 bcd 7.0 ab 6.5 abc + UC fl.oz. + Harrell s Par fl.oz. Medallion SC fl.oz. 14-d 5.8 fgh 5.5 fg 4.3 def 4.7 efg Medallion SC fl.oz. 14-d 7.0 abc 7.8 a 7.3 a 6.9 ab + UC fl.oz. + Harrell s Par fl.oz. Signature Xtra oz. 14-d 6.3 def 6.3 def 6.0 bc 5.5 cde Signature Xtra oz. 14-d 6.8 bcd 7.0 a-d 6.5 ab 6.0 bcd + UC fl.oz. Civitas One fl.oz. 14-d 6.0 efg 5.8 efg 5.3 cd 5.2 def Civitas One fl.oz. 14-d 5.8 fgh 5.5 fg 4.8 d 5.0 def + UC fl.oz. UC fl.oz. 21-d 5.8 fgh 5.0 ghi 4.5 de 5.0 def UC fl.oz. 21-d 5.8 fgh 5.3 gh 4.8 d 5.2 def UC fl.oz. 21-d 5.3 h 5.0 ghi 4.5 de 5.2 def Mirage fl.oz. 14-d 6.0 efg 5.5 fg 5.0 cd 4.7 efg Untreated i 4.3 i 3.3 f 3.9 g ANOVA: Treatment (P > F) Days after treatment 14-d d z Treatments were initiated on 18 May, prior to disease development. Subsequent 14-d treatments were made on 31 May, 15 June, 29 June, 12 July, and 28 July. Subsequent 21-d treatments were made on 7 June, 29 June, and 20 July. y Treatment means followed by the same letter, within each column, are not significantly different based on Fisher s protected least significant difference test (α = 0.05). x Data were automatically log transformed. Means are de-transformed for presentation. 13 Table of Contents
24 Table 2b. Effect of new and experimental AMVAC fungicides tank-mixed with various fungicides on Turf Quality on an annual bluegrass putting green at the Plant Science Research and Education Facility in Storrs, CT during Turf Quality Treatment Rate per 1000ft 2 Int z 1 Jul 8 Jul 15 Jul 28 Jul 4 Aug ; 6=min acceptable OREON fl.oz. 14-d 5.7 y b-e x 5.5 c-f 6.3 a-d 7.0 a-d 8.3 a + Harrell s Par fl.oz. OREON fl.oz. 14-d 6.2 a-d 5.8 b-e 6.8 ab 7.8 a 8.0 ab + Harrell s Par fl.oz. OREON fl.oz. 14-d 5.7 b-e 5.8 b-e 5.5 cde 6.8 a-d 6.5 def + Harrell s Par fl.oz. Autilus fl.oz. 14-d 7.0 ab 6.0 a-d 6.3 a-d 7.5 ab 7.5 a-d + Harrell s Par fl.oz. UC fl.oz. 14-d 7.2 a 6.5 abc 6.5 abc 7.8 a 8.0 ab + Harrell s Par fl.oz. Velista oz. 14-d 5.0 ef 4.8 efg 5.8 b-e 6.0 cde 7.5 a-d Velista oz. 14-d 6.3 a-d 5.5 c-f 6.5 abc 8.0 a 8.0 ab + UC fl.oz. + Harrell s Par fl.oz. Insignia SC fl.oz. 14-d 4.2 fg 3.8 gh 4.0 fg 3.8 f 4.0 i Insignia SC fl.oz. 14-d 6.2 a-d 5.5 c-f 6.5 abc 7.5 ab 7.8 abc + UC fl.oz. + Harrell s Par fl.oz. Heritage TL fl.oz. 14-d 3.7 g 3.3 h 3.8 g 3.8 f 4.3 hi Heritage TL fl.oz. 14-d 6.2 a-d 6.0 a-d 5.8 b-e 7.0 a-d 7.8 abc + UC fl.oz. + Harrell s Par fl.oz. Medallion SC fl.oz. 14-d 5.2 def 5.8 b-e 6.0 a-e 5.8 de 6.8 c-f Medallion SC fl.oz. 14-d 7.4 a 6.8 ab 6.8 ab 7.8 a 8.0 ab + UC fl.oz. + Harrell s Par fl.oz. Signature Xtra oz. 14-d 5.2 c-f 5.5 c-f 6.3 a-d 7.3 abc 7.0 b-e Signature Xtra oz. 14-d 6.4 abc 7.0 a 7.0 a 7.3 abc 8.0 ab + UC fl.oz. Civitas One fl.oz. 14-d 5.0 ef 4.8 efg 5.3 de 5.3 e 5.3 gh Civitas One fl.oz. 14-d 5.2 c-f 5.3 def 5.5 cde 5.0 ef 5.8 fg + UC fl.oz. UC fl.oz. 21-d 4.5 fg 4.8 efg 5.0 ef 5.3 e 6.0 efg UC fl.oz. 21-d 5.0 ef 4.5 fg 5.3 de 5.8 de 6.0 efg UC fl.oz. 21-d 4.5 fg 4.8 efg 5.5 cde 6.3 b-e 7.0 b-e Mirage fl.oz. 14-d 5.0 ef 4.5 fg 5.5 cde 5.8 de 6.8 c-f Untreated fg 3.8 gh 3.8 g 3.8 f 4.5 hi ANOVA: Treatment (P > F) Days after treatment 14-d d z Treatments were initiated on 18 May, prior to disease development. Subsequent 14-d treatments were made on 31 May, 15 June, 29 June, 12 July, and 28 July. Subsequent 21-d treatments were made on 7 June, 29 June, and 20 July. y Data were automatically log transformed. Means are de-transformed for presentation. x Treatment means followed by the same letter, within each column, are not significantly different based on Fisher s protected least significant difference test (α = 0.05). 14 Table of Contents
25 Table 3. Effect of new and experimental AMVAC fungicides tank-mixed with various fungicides on NDVI vegetation index on an annual bluegrass putting green at the Plant Science Research and Education Facility in Storrs, CT during NDVI Treatment Rate per 1000ft 2 Int z 17 Jun 1 Jul 8 Jul 27 Jul 12 Aug Vegetation Index OREON fl.oz. 14-d a-d y c-g Harrell s Par fl.oz. OREON fl.oz. 14-d a a-e Harrell s Par fl.oz. OREON fl.oz. 14-d ab fg Harrell s Par fl.oz. Autilus fl.oz. 14-d ab c-g Harrell s Par fl.oz. UC fl.oz. 14-d ab a-f Harrell s Par fl.oz. Velista oz. 14-d a-d ab Velista oz. 14-d a-d a-f UC fl.oz. + Harrell s Par fl.oz. Insignia SC fl.oz. 14-d a-d c-g Insignia SC fl.oz. 14-d a a-f UC fl.oz. + Harrell s Par fl.oz. Heritage TL fl.oz. 14-d cde efg Heritage TL fl.oz. 14-d a-e c-g UC fl.oz. + Harrell s Par fl.oz. Medallion SC fl.oz. 14-d a-d abc Medallion SC fl.oz. 14-d a UC fl.oz. + Harrell s Par fl.oz. Signature Xtra oz. 14-d ab a-e Signature Xtra oz. 14-d ab b-g UC fl.oz. Civitas One fl.oz. 14-d a-e c-g Civitas One fl.oz. 14-d de g UC fl.oz. UC fl.oz. 21-d b-e a-f UC fl.oz. 21-d a a UC fl.oz. 21-d abc b-g Mirage fl.oz. 14-d ab a-d Untreated e d-g ANOVA: Treatment (P > F) Days after treatment 14-d d z Treatments were initiated on 18 May, prior to disease development. Subsequent 14-d treatments were made on 31 May, 15 June, 29 June, 12 July, and 28 July. Subsequent 21-d treatments were made on 7 June, 29 June, and 20 July. y Treatment means followed by the same letter, within each column, are not significantly different based on Fisher s protected least significant difference test (α = 0.05). 15 Table of Contents
26 Table 4. Effect of new and experimental AMVAC fungicides tank-mixed with various fungicides on phytotoxicity on an annual bluegrass putting green at the Plant Science Research and Education Facility in Storrs, CT during Phytotoxicity Treatment Rate per 1000ft 2 Int z 10 Jun 17 Jun 24 Jun 1 Jul 28 Jul 4 Aug ; 2 = max acceptable OREON fl.oz. 14-d d y 0.0 b Harrell s Par fl.oz. OREON fl.oz. 14-d d 0.0 b Harrell s Par fl.oz. OREON fl.oz. 14-d d 0.0 b Harrell s Par fl.oz. Autilus fl.oz. 14-d d 0.0 b Harrell s Par fl.oz. UC fl.oz. 14-d d 0.0 b Harrell s Par fl.oz. Velista oz. 14-d d 0.0 b 0.0 Velista oz. 14-d abc 0.0 b UC fl.oz. + Harrell s Par fl.oz. Insignia SC fl.oz. 14-d bc 0.3 b 0.0 Insignia SC fl.oz. 14-d d 0.0 b UC fl.oz. + Harrell s Par fl.oz. Heritage TL fl.oz. 14-d cd 0.0 b 0.0 Heritage TL fl.oz. 14-d d 0.0 b UC fl.oz. + Harrell s Par fl.oz. Medallion SC fl.oz. 14-d d 0.5 b 0.0 Medallion SC fl.oz. 14-d d 0.0 b UC fl.oz. + Harrell s Par fl.oz. Signature Xtra oz. 14-d d 0.0 b 0.0 Signature Xtra oz. 14-d d 0.3 b UC fl.oz. Civitas One fl.oz. 14-d cd 0.5 b 0.0 Civitas One fl.oz. 14-d ab 2.3 a UC fl.oz. UC fl.oz. 21-d cd 0.0 b 0.0 UC fl.oz. 21-d a 0.0 b 0.0 UC fl.oz. 21-d bc 0.3 b 0.0 Mirage fl.oz. 14-d a 0.0 b 0.0 Untreated d 0.0 b 0.0 ANOVA: Treatment (P > F) Days after treatment 14-d d z Treatments were initiated on 18 May, prior to disease development. Subsequent 14-d treatments were made on 31 May, 15 June, 29 June, 12 July, and 28 July. Subsequent 21-d treatments were made on 7 June, 29 June, and 20 July. y Treatment means followed by the same letter, within each column, are not significantly different based on Fisher s protected least significant difference test (α = 0.05). 16 Table of Contents
27 Table 5. Effect of new and experimental AMVAC fungicides tank-mixed with various fungicides on algae intensity on an annual bluegrass putting green at the Plant Science Research and Education Facility in Storrs, CT during Algae Intensity Treatment Rate per 1000ft 2 Int z 8 July ; 2 = max acceptable -- OREON fl.oz. 14-d 2.0 b-e y + Harrell s Par fl.oz. OREON fl.oz. 14-d 2.3 a-d + Harrell s Par fl.oz. OREON fl.oz. 14-d 2.3 a-d + Harrell s Par fl.oz. Autilus fl.oz. 14-d 2.0 b-e + Harrell s Par fl.oz. UC fl.oz. 14-d 1.5 cde + Harrell s Par fl.oz. Velista oz. 14-d 2.8 abc Velista oz. 14-d 1.5 cde + UC fl.oz. + Harrell s Par fl.oz. Insignia SC fl.oz. 14-d 1.8 b-e Insignia SC fl.oz. 14-d 2.0 b-e + UC fl.oz. + Harrell s Par fl.oz. Heritage TL fl.oz. 14-d 2.8 abc Heritage TL fl.oz. 14-d 2.3 a-d + UC fl.oz. + Harrell s Par fl.oz. Medallion SC fl.oz. 14-d 1.3 def Medallion SC fl.oz. 14-d 1.3 def + UC fl.oz. + Harrell s Par fl.oz. Signature Xtra oz. 14-d 0.8 ef Signature Xtra oz. 14-d 0.0 f + UC fl.oz. Civitas One fl.oz. 14-d 3.0 ab Civitas One fl.oz. 14-d 2.3 a-d + UC fl.oz. UC fl.oz. 21-d 2.0 b-e UC fl.oz. 21-d 3.0 ab UC fl.oz. 21-d 3.0 ab Mirage fl.oz. 14-d 3.5 a Untreated b-e ANOVA: Treatment (P > F) Days after treatment 14-d 9 21-d 9 z Treatments were initiated on 18 May, prior to disease development. Subsequent 14-d treatments were made on 31 May, 15 June, 29 June, 12 July, and 28 July. Subsequent 21-d treatments were made on 7 June, 29 June, and 20 July. y Treatment means followed by the same letter, within each column, are not significantly different based on Fisher s protected least significant difference test (α = 0.05). 17 Table of Contents
28 PREVENTIVE BROWN PATCH CONTROL WITH FUNGICIDES ON A COLONIAL BENTGRASS FAIRWAY TURF, 2016 K. Miele, J. Dunnack, Z. Esponda, S. Vose, and J. Inguagiato Department of Plant Science and Landscape Architecture University of Connecticut, Storrs INTRODUCTION Brown patch, caused by Rhizoctonia solani is characterized by round patches of diffusely-blighted, thinned turf. It is a summer disease that is most active under warm (nighttime temps 65 F) and humid conditions. On golf course fairways it is commonly controlled using cultural practices such as avoiding excess nitrogen and improving air movement, as well as through the use of preventative fungicides. The objective of this study was to evaluate the effectiveness of new and existing fungicides at controlling brown patch in a colonial bentgrass fairway turf. MATERIALS & METHODS A field study was conducted on an SR-7150 colonial bentgrass (Agrostis capillaris) turf grown on a Paxton fine sandy loam at the Plant Science Research and Education Facility in Storrs, CT. Turf was mowed three days wk -1 at a bench setting of 0.5-inches. A total of 1.2 lb N 1000-ft -2 was applied as water soluble sources from April through August. Overhead irrigation was applied as needed to prevent drought stress. Treatments consisted of fungicides applied individually, or as tank mixes. Initial applications were made on 8 June prior to disease developing in the trial area. Subsequent applications were made at specified treatment intervals through 16 August. All treatments were applied using a hand held CO 2 powered spray boom outfitted with a single AI9504E flat fan nozzle calibrated to deliver 1.0 gal 1000-ft -2 at 40 psi. Brown patch was assessed visually as a percentage of the plot area blighted by Rhizoctonia solani. Turf quality was visually assessed on a 1 to 9 scale; where 9 represented the best quality turf and 6 was the minimum acceptable level. Phytotoxicity was also assessed visually where 0 was equal to no discoloration and 2 represented the maximum acceptable level. Plots measured 3 x 6 ft and were arranged in a randomized complete block design with four replications. All data were subjected to an analysis of variance and means were separated using Fisher s protected least significant difference test. RESULTS AND DISCUSSION Brown Patch Incidence Conditions conducive to disease development first occurred in mid-july, and by 28-July the brown patch epidemic was quite severe in untreated plots, averaging 35% blighted area (Table 1a + 1b). Most treatments provided good to excellent levels of disease control as of this date. Kabuto + TebuStar (all rates and intervals), performed very well. Kabuto applied alone was less effective than when tank-mixed with TebuStar. The addition of Transfilm, a surfactant, to this mix did not have any impact on efficacy. When applied alone, Transfilm showed moderate (>10%) levels of disease. Fame+T, Heritage WG, Heritage Action, Affirm, Compass, Exteris Stressgard, and Interface also controlled disease well as of this date. There was no difference in control between the different formulations of Heritage. Disease continued to progress, and as of 16 August, untreated plots reached almost 40% plot area blighted. Most treatments continued to provide good disease control, with the exception of Kabuto or Transfilm applied alone, which were largely no different than the untreated control. Kabuto is a new SDHI fungicide, and like many SDHI fungicides has a relatively narrow spectrum of disease control activity. Kabuto is currently only labeled for dollar spot control. Turf Quality and Phytotoxicity Turf quality (Table 2) was primarily affected by disease severity. In general, the trial area was well fertilized and conducive to high-quality turf, leading to high turf quality ratings for most treatments. Poor turf quality (<6) was observed on Kabuto and Transfilm (applied alone) treated plots, as well as untreated plots at the height of the epidemic on 16 August. There was little to no phytotoxicity caused by any of the treatments for the duration of the trial (Table 3.) 18 Table of Contents
29 Table 1a. Effect of various fungicides on preventative brown patch control on a colonial bentgrass fairway turf at the Plant Science Research and Education Facility in Storrs, CT during Brown Patch Severity Treatment Rate per 1000ft 2 Int z 24 Jun 8 Jul 15 Jul 22 Jul 28 Jul % plot area blighted Kabuto fl.oz. 14-d y cd x 1.7 b-e 2.3 b-e + TebuStar fl.oz. Kabuto fl.oz. 28-d d 1.5 b-e 3.5 b-e + TebuStar fl.oz. Kabuto fl.oz. 14-d d 0.9 b-e 0.0 e + TebuStar fl.oz. Kabuto fl.oz. 28-d d 0.3 de 0.0 e + TebuStar fl.oz. Kabuto fl.oz. 14-d d 1.3 b-e 0.7 e + TebuStar fl.oz. + Transfilm fl.oz. Kabuto fl.oz. 28-d bc 1.5 b-e 0.6 e + TebuStar fl.oz. + Transfilm fl.oz. Kabuto fl.oz. 14-d d 0.3 de 0.0 e + TebuStar fl.oz. Kabuto fl.oz. 28-d d 0.3 de 0.0 e + TebuStar fl.oz. Fame+T fl.oz. 28-d d 0.6 cde 0.6 e Heritage WG oz. 21-d d 0.0 e 0.7 e Heritage Action oz. 21-d d 0.7 cde 0.6 e Heritage WG oz. 21-d d 0.0 e 0.7 e Heritage Action oz. 28-d d 0.6 cde 2.3 b-e Affirm oz. 14-d d 0.6 cde 0.6 e Kabuto fl.oz. 14-d ab 10.8 a 12.8 ab Kabuto fl.oz. 21-d ab 9.5 a 3.5 b-e Kabuto fl.oz. 21-d bcd 5.1 ab 9.3 a-d + Transfilm fl.oz. 21-d ab 3.7 abc 11.0 abc Compass 50WG oz. 21-d cd 1.7 b-e 2.0 cde Exteris Stressgard fl.oz. 21-d d 1.1 b-e 1.4 de Interface fl.oz. 21-d cd 2.7 a-d 0.8 e Untreated a 11.4 a 35.2 a ANOVA: Treatment (P > F) Days after treatment 14-d d d z Treatments were initiated on 19-May, prior to disease development, and were reapplied at specified intervals. y Brown patch data were automatically log-transformed. Means are de-transformed for presentation. x Means followed by the same letter, within each column, are not significantly different based on Fisher s protected least significant difference test (α = 0.05) 19 Table of Contents
30 Table 1b. Effect of various fungicides on preventative brown patch control on a colonial bentgrass fairway turf at the Plant Science Research and Education Facility in Storrs, CT during Brown Patch Severity Treatment Rate per 1000ft 2 Int z 1 Aug 5 Aug 16 Aug 19 Aug % plot area blighted Kabuto fl.oz. 14-d 0.0 y d x 1.8 bcd 0.0 c 0.0 e + TebuStar fl.oz. Kabuto fl.oz. 28-d 1.6 bcd 1.6 bcd 0.0 c 0.7 de + TebuStar fl.oz. Kabuto fl.oz. 14-d 0.0 d 0.6 cd 0.0 c 0.0 e + TebuStar fl.oz. Kabuto fl.oz. 28-d 0.0 d 0.7 cd 0.0 c 0.0 e + TebuStar fl.oz. Kabuto fl.oz. 14-d 0.0 d 0.0 d 0.0 c 0.0 e + TebuStar fl.oz. + Transfilm fl.oz. Kabuto fl.oz. 28-d 0.0 d 0.6 cd 1.1 c 0.5 e + TebuStar fl.oz. + Transfilm fl.oz. Kabuto fl.oz. 14-d 0.0 d 0.0 d 0.0 c 0.0 e + TebuStar fl.oz. Kabuto fl.oz. 28-d 0.0 d 0.0 d 0.0 c 0.0 e + TebuStar fl.oz. Fame+T fl.oz. 28-d 0.0 d 0.0 d 0.0 c 0.0 e Heritage WG oz. 21-d 0.0 d 0.0 d 0.0 c 0.0 e Heritage Action oz. 21-d 0.0 d 0.0 d 0.0 c 0.0 e Heritage WG oz. 21-d 0.0 d 0.0 d 0.0 c 0.0 e Heritage Action oz. 28-d 0.0 d 0.0 d 0.0 c 0.7 de Affirm oz. 14-d 0.7 cd 1.2 bcd 0.0 c 0.0 e Kabuto fl.oz. 14-d 27.9 a 32.4 a 49.9 a 56.1 ab Kabuto fl.oz. 21-d 5.0 b 0.6 cd 15.8 b 27.6 c Kabuto fl.oz. 21-d 22.8 a 30.2 a 39.9 a 53.2 ab + Transfilm fl.oz. 21-d 28.6 a 35.7 a 54.4 a 67.1 a Compass 50WG oz. 21-d 0.4 d 0.0 d 0.0 c 0.0 e Exteris Stressgard fl.oz. 21-d 1.2 bcd 2.2 bc 1.3 c 1.8 de Interface fl.oz. 21-d 3.8 bc 5.3 b 1.8 c 5.6 d Untreated a 40.3 a 39.4 a 43.4 bc ANOVA: Treatment (P > F) Days after treatment 14-d d d z Treatments were initiated on 19-May, prior to disease development, and were reapplied at specified intervals. y Brown patch data were automatically log-transformed. Means are de-transformed for presentation. x Means followed by the same letter, within each column, are not significantly different based on Fisher s protected least significant difference test (α = 0.05) 20 Table of Contents
31 Table 2. Effect of various fungicides on turf quality on a colonial bentgrass fairway turf at the Plant Science Research and Education Facility in Storrs, CT during Turf Quality Treatment Rate per 1000ft 2 Int z 24 Jun 8 Jul 22 Jul 5 Aug 16 Aug ; 6=min acceptable Kabuto fl.oz. 14-d c-f y 7.8 abc 7.3 b + TebuStar fl.oz. Kabuto fl.oz. 28-d abc 8.0 abc 7.3 b + TebuStar fl.oz. Kabuto fl.oz. 14-d abc 8.3 abc 8.3 ab + TebuStar fl.oz. Kabuto fl.oz. 28-d abc 8.3 abc 7.8 ab + TebuStar fl.oz. Kabuto fl.oz. 14-d a-d 8.3 abc 7.3 b + TebuStar fl.oz. + Transfilm fl.oz. Kabuto fl.oz. 28-d abc 7.8 abc 7.8 ab + TebuStar fl.oz. + Transfilm fl.oz. Kabuto fl.oz. 14-d ab 8.5 ab 7.3 b + TebuStar fl.oz. Kabuto fl.oz. 28-d abc 8.0 abc 7.5 ab + TebuStar fl.oz. Fame+T fl.oz. 28-d abc 8.3 abc 7.8 ab Heritage WG oz. 21-d abc 9.0 a 8.3 ab Heritage Action oz. 21-d abc 8.5 ab 8.5 a Heritage WG oz. 21-d a 8.5 ab 8.5 a Heritage Action oz. 28-d b-e 8.3 abc 8.5 a Affirm oz. 14-d ab 8.3 abc 8.3 ab Kabuto fl.oz. 14-d ef 4.3 d 4.0 d Kabuto fl.oz. 21-d ef 8.0 abc 5.5 c Kabuto fl.oz. 21-d def 4.3 d 4.0 d + Transfilm fl.oz. 21-d c-f 4.5 d 3.3 d Compass 50WG oz. 21-d abc 9.0 a 8.0 ab Exteris Stressgard fl.oz. 21-d ab 6.8 c 7.8 ab Interface fl.oz. 21-d abc 7.0 bc 7.3 b Untreated f 4.3 d 3.8 d ANOVA: Treatment (P > F) Days after treatment 14-d d d z Treatments were initiated on 19-May, prior to disease development, and were reapplied at specified intervals. y Means followed by the same letter, within each column, are not significantly different based on Fisher s protected least significant difference test (α = 0.05) 21 Table of Contents
32 Table 3. Effect of various fungicides on phytotoxicity on a colonial bentgrass fairway turf at the Plant Science Research and Education Facility in Storrs, CT during Phytotoxicity Treatment Rate per 1000ft 2 Int z 24 Jun 8 Jul - 0-5; 2=max acceptable - Kabuto fl.oz. 14-d TebuStar fl.oz. Kabuto fl.oz. 28-d TebuStar fl.oz. Kabuto fl.oz. 14-d TebuStar fl.oz. Kabuto fl.oz. 28-d TebuStar fl.oz. Kabuto fl.oz. 14-d TebuStar fl.oz. + Transfilm fl.oz. Kabuto fl.oz. 28-d TebuStar fl.oz. + Transfilm fl.oz. Kabuto fl.oz. 14-d TebuStar fl.oz. Kabuto fl.oz. 28-d TebuStar fl.oz. Fame+T fl.oz. 28-d Heritage WG oz. 21-d Heritage Action oz. 21-d Heritage WG oz. 21-d Heritage Action oz. 28-d Affirm oz. 14-d Kabuto fl.oz. 14-d Kabuto fl.oz. 21-d Kabuto fl.oz. 21-d Transfilm fl.oz. 21-d Compass 50WG oz. 21-d Exteris Stressgard fl.oz. 21-d Interface fl.oz. 21-d Untreated ANOVA: Treatment (P > F) Days after treatment 14-d d d 16 2 z Treatments were initiated on 19-May, prior to disease development, and were reapplied at specified intervals. 22 Table of Contents
33 PREVENTIVE BROWN PATCH CONTROL WITH FUNGICIDES ON A TALL FESCUE LAWN TURF, 2016 K. Miele, J. Dunnack, Z. Esponda, S. Vose, and J. Inguagiato Department of Plant Science and Landscape Architecture University of Connecticut, Storrs INTRODUCTION Brown patch of turfgrass, caused by Rhizoctonia solani is characterized by round patches of diffusely-blighted, thinned turf. It is a summer disease that is most active under warm (nighttime temperatures 65 F) and humid conditions. It is commonly controlled using cultural practices such as avoiding excess nitrogen and improving air movement, as well as through the use of preventative fungicides. In residential turf maintenance granular fungicide formulations are sometimes preferable over sprayable formulations for their ease of use. However, questions arise as to whether disease control between fungicide formulations is equivalent based on the differences in converage that may result during the application. The objectives of this study was to compare efficacy of various formulations of commonly used residential turf fungicides and to evaluate the effectiveness of new and existing fungicides at controlling brown patch in a tall fescue lawn turf. MATERIALS & METHODS A field study was conducted on a Crossfire 3 tall fescue (Lolium arundinaceum) turf grown on a Paxton fine sandy loam at the Plant Science Research and Education Facility in Storrs, CT. Turf was mowed two days wk -1 at a cutting height of 3- inches. Nitrogen was applied to the study area to encourage brown patch development. A total of 1.25 lb N 1000-ft -2 was applied as water soluble sources from April through July. Overhead irrigation was applied daily each evening during the trial to extend leaf wetness period and encourage disease development. RESULTS AND DISCUSSION Brown Patch Incidence Disease was developed throughout the trial area by 1 August, with untreated plots averaging 17% brown patch as of this date (Table 1). Disease levels on untreated plots remained unacceptable (>10%) through 16 August. Headway TL, a premix of azoxystrobin and propiconazole, was applied at 3 rates (1.5, 2.25, and 3.0 fl.oz ft -2 ) and three application intervals (14, 21, and 28-d). All combinations adequately (<10% plot area blighted) controlled disease on 1 August, and all provided total control of disease on 16 August (Table 1). Heritage G, a granular formulation of azoxystrobin, and Heritage TL, a liquid formulation, provided near total control of disease at all rates and intervals as of 16 August (Table 1). Conversely, differences between formulations of other fungicides were observed. Banner MAXX, a sprayable formulation of propiconazole, maintained adequate control throughout the trial. Whereas, Prophesy, a granular formulation of propiconazole, applied at the same interval and rate of active ingredient, initially provided comparable control as the sprayable formulation (i.e., Banner MAXX) 4 DAT (days after treatment), but was less effective 19 DAT (16 August). Similarly, Pillar G, a granular premix of pyraclostrobin and triticonazole, provided comparable control to equivalent rates and intervals of sprayable Insignia Intrinsic + Trinity tank mixes initially (1 August), although was less effective than the sprayable tank mix on 16 August, reaching an unacceptable level. Treatments consisted of granular or sprayable fungicides. Initial applications were made on 16 June prior to disease developing in the trial area. Subsequent applications were made at specified treatment intervals through 16 August. Liquid treatments were applied using a hand held CO 2 powered spray boom outfitted with a single AI9504E flat fan nozzle calibrated to deliver 1.0 gal 1000-ft -2 at 40 psi. Granular treatments were applied using a hand-held shaker jar. Following treatment application, granular treatments received 0.1 inch of water delivered with a watering can. On 22 July the trial area was inoculated with 6.1 oz 1000 ft -2 of sterile, dried Kentucky bluegrass seed infested with Rhizoctonia solani to aid in uniform development of disease symptoms. Brown patch was assessed visually as a percentage of the plot area blighted by Rhizoctonia solani. Plots measured 3 x 6 ft and were arranged in a randomized complete block design with four replications. All data were subjected to an analysis of variance and means were separated using Fisher s protected least significant difference test. The SDHI fungicides Velista, Xzemplar, and Kabuto were each applied at 21- and 28-d intervals. Velista provided adequate control of disease at all dates, although the 28-d interval had slightly more (albeit acceptable) disease as of 16 August. Xzemplar (21-d) provided good (<5%) control of disease, but failed to adequately control brown patch at the 28- d interval. Kabuto did not adequately control disease at either interval after 1 August. Differences in the efficacy of granular formulated fungicides versus their sprayable equivalent were observed. Heritage G provided equivalent control as Heritage TL; whereas Prophesy and Pillar G did not seem to provide as effective control as there sprayable equivalent. This may be due to differences in fungicide coverage, carrier technology, phytomobility of the fungicide, and the inherent activity of the fungicide, among other considerations. Headway applied at 2.25 to 3.0 fl.oz. every 21- to 28-d provided very good brown patch control in this trial. New SDHI fungicides Velista and Xzemplar were also effective and provide new options for brown patch control in residential lawn turf. 23 Table of Contents
34 Table 1. Brown patch severity influenced by various fungicides on a tall fescue lawn turf at the Plant Science Research and Education Facility in Storrs, CT during Brown Patch Severity Treatment Rate per 1000ft 2 Int z 1 Jul 28 Jul 1 Aug 16 Aug % plot area blighted Headway TL fl.oz. 14-d y 6.8 a-f x 0.0 e Headway TL fl.oz. 21-d efg 0.0 e Headway TL fl.oz. 21-d b-g 0.0 e Headway TL fl.oz. 28-d a-g 0.0 e Headway TL fl.oz. 28-d b-g 0.0 e Heritage G lb. 21-d fg 0.8 de Heritage G lb. 28-d a-f 0.0 e Heritage TL fl.oz. 21-d c-g 0.0 e Heritage TL fl.oz. 28-d b-g 0.0 e Prophesy lb. 21-d a-f 25.5 a Banner Maxx fl.oz. 21-d a-f 4.8 bcd Pillar G lb. 21-d a-d 14.9 abc Pillar G lb. 28-d a-f 18.3 ab Insignia Intrinsic fl.oz. 21-d d-g 0.0 e + Trinity fl.oz. Insignia Intrinsic fl.oz. 28-d d-g 0.0 e + Trinity fl.oz. Velista oz. 21-d c-g 0.0 e Velista oz. 21-d a-e 0.0 e Velista oz. 28-d g 4.2 cd Xzemplar fl.oz. 21-d b-g 0.0 e Xzemplar fl.oz. 28-d a-d 11.9 abc Kabuto fl.oz. 21-d a-d 12.6 abc Kabuto fl.oz. 28-d a 26.4 a Untreated ab 10.7 abc ANOVA: Treatment (P > F) Days after treatment 14-d d d z Treatments were initiated on 16 June, prior to disease development. Treatments were reapplied at specified intervals through 11 August. y Brown Patch data were log transformed for ANOVA and mean separation tests, although means presented are de-transformed values. x reatment means followed by the same letter, within each column, are not significantly different based on Fisher s protected least significant difference test (α = 0.05). 24 Table of Contents
35 PREVENTIVE COPPER SPOT CONTROL USING VARIOUS SDHI FUNGICIDES APPLIED WITH AND WITHOUT SECURE ON A CREEPING BENTGRASS PUTTING GREEN TURF, 2016 K. Miele, J. Dunnack, Z. Esponda, S. Vose, and J. Inguagiato Department of Plant Science and Landscape Architecture University of Connecticut, Storrs INTRODUCTION Copper spot disease of cool-season turfgrasses caused by the Gloeocercospora sorghi fungal pathogen. On golf course putting greens it is characterized by small, copper-colored spots. The fungus produces abundant spores which may be tracked by turf equipment leaving linear patterns on the putting surface as the disease spreads. It is particularly active during periods of hot daytime temperatures (85 F), warm nighttime temperatures (65 F), and high humidity. Excessive nitrogen and low ph can also enhance disease growth. Copper spot can be controlled by a wide range of fungicides, and because it typically develops later in the summer than other diseases, control is often achieved as part of an already-in-place fungicide rotation program. The objective of this study was to evaluate the efficacy of various SDHI fungicides in controlling copper spot on a creeping bentgrass putting green turf. MATERIALS & METHODS A field study was conducted on a Penn A-4 creeping bentgrass (Agrostis stolonifera) turf grown on a Paxton fine sandy loam at the Plant Science Research and Education Facility in Storrs, CT. Turf was mowed five days wk -1 at a bench setting of inch. Nitrogen was applied at a total of 2.0 lb N 1000-ft -2 as water soluble sources from April through September. Dylox 80 was applied on 27 May for control of white grubs. Quicksilver was applied on 6 August and 20 August for control of silvery-thread moss. Scimitar was applied on 27 August for control of cutworms. To help alleviate dry surface conditions, the wetting agent Dispatch was applied on 18 June and Revolution was applied on 23 July. Overhead irrigation was applied as needed to prevent drought stress. Treatments consisted of various SDHI fungicides, applied individually or tank-mixed with Secure. Initial applications were made prior to the onset of disease symptoms on 30 June. Subsequent applications were made on a 14-d interval through 25 August. All treatments were applied using a hand held CO 2 powered spray boom outfitted with a single AI9508E flat fan nozzle calibrated to deliver 2.0 gal 1000-ft -2 at 40 psi. Plots measured 3 x 6 ft and were arranged in a randomized complete block design with four replications. RESULTS AND DISCUSSION Copper Spot Incidence Copper spot symptoms first developed on 28 July from a natural infestation, increasing slowly to 16 spots 18 ft -2 in untreated plots by 19 August (Table 1). Disease continued to increase through 2 September, when untreated plots reached a maximum of 53 spots 18 ft -2. Secure applied alone or as a tank-mix with an SDHI fungicide provided complete or near-complete control of disease on all observation dates. Lexicon Intrinsic, a premix of fluxapuroxad (an SDHI and the active ingredient in Xzemplar) plus pyraclostrobin, also provided complete control of disease regardless of the addition of Secure. SDHI fungicides applied alone generally failed to control copper spot (i.e., no different from control), except Kabuto. Kabuto-alone treated turf consistently maintained acceptable levels of copper spot (i.e., < 5 spots 18 ft -2 ) and reduced disease compared to untreated control. However, the Kabuto + Secure tank mix reduced copper spot greater than Kabuto-alone as disease increased in late-august and September. This is the first year where Kabuto has been evaluated for copper spot control at this location. SDHI fungicides tested in this trial generally did not provide control of copper spot unless another, non-sdhi fungicide was present either as a premix or tank-mix, with the exception of Kabuto. It remains unclear whether Kabuto has unique activity among SDHI fungicides to control copper spot, or whether disease was not sufficiently distributed in the field to adequately test Kabuto. These results should be confirmed with an additional year of observation. While it is likely that copper spot will be controlled by a typical fungicide rotation, SDHI s alone should not be relied upon for copper spot control when conditions are conducive for this disease. Copper spot incidence was assessed as a count of individual disease foci within each plot. All data were subjected to an analysis of variance and means were separated using Fisher s protected least significant difference test. Copper spot incidence data were log transformed for ANOVA and mean separation tests, although means presented are de-transformed values. 25 Table of Contents
36 Table 1. Copper spot incidence influenced by various SDHI fungicides and Secure on a creeping bentgrass putting green turf at the Plant Science Research and Education Facility in Storrs, CT during Copper Spot Incidence Treatment Rate per 1000ft 2 Int z 28 Jul 11 Aug 19 Aug 26 Aug 2 Sep # copper spot foci 18ft Kabuto fl.oz. 14-d y bc x 0.6 c 4.7 c 4.6 b Kabuto fl.oz. 14-d bc 0.0 c 0.0 d 0.0 c + Secure fl.oz. Velista oz. 14-d a 46.1 a 97.5 a 77.1 a Velista oz. 14-d bc 0.0 c 1.8 cd 0.4 c + Secure fl.oz. Emerald oz. 14-d ab 5.4 b 19.3 b 24.0 a Emerald oz. 14-d c 0.0 c 1.6 cd 0.6 c + Secure fl.oz. Xzemplar fl.oz. 14-d ab 16.4 ab 47.4 ab 31.9 a Xzemplar fl.oz. 14-d c 0.0 c 0.8 cd 0.0 c + Secure fl.oz. Lexicon Intrinsic fl.oz. 14-d c 0.0 c 0.6 d 0.0 c Lexicon Intrinsic fl.oz. 14-d c 0.0 c 0.0 d 0.0 c + Secure fl.oz. Secure fl.oz. 14-d bc 0.0 c 0.3 d 0.0 c Untreated a 16.1 ab 35.3 ab 53.8 a ANOVA: Treatment (P > F) Days after treatment z Treatments were initiated on 30 June, prior to disease development. Treatments were reapplied on a 14-d basis through 25 August. y Copper spot data were log transformed for ANOVA and mean separation tests, although means presented are de-transformed values. x Treatment means followed by the same letter, within each column, are not significantly different based on Fisher s protected least significant difference test (α = 0.05). 26 Table of Contents
37 PREVENTIVE DOLLAR SPOT CONTROL WITH PINPOINT AND SDHI FUNGICIDES APPLIED AT VARIOUS RATES AND INTERVALS ON A CREEPING BENTGRASS FAIRWAY TURF, 2016 K. Miele, J. Dunnack, Z. Esponda, S. Vose, and J. Inguagiato Department of Plant Science and Landscape Architecture University of Connecticut, Storrs INTRODUCTION Dollar spot is a common disease of cool-season turfgrasses caused by the fungal pathogen Sclerotinia homoeocarpa. On golf course fairways it is characterized by light, straw-colored spots that may coalesce into larger irregularly shaped areas. It is particularly active during periods of warm daytime temperatures (80 F), warm nighttime temperatures (60 F), and high humidity. It can be managed in part with cultural practices such as maintaining moderate nitrogen fertility and reducing leaf wetness period. However, the use of fungicides is often still necessary on high priority areas such as greens, tees and fairways. The objective of this study was to evaluate the efficacy of new and existing fungicides in controlling dollar spot on a creeping bentgrass fairway turf. MATERIALS & METHODS A field study was conducted on a Nintey-six Two creeping bentgrass (Agrostis stolonifera) turf grown on a Paxton fine sandy loam at the Plant Science Research and Education Facility in Storrs, CT. Turf was mowed three days wk -1 at a bench setting of 0.5-inches. Minimal nitrogen was applied to the study area to encourage dollar spot development. A total of 0.45 lb N 1000-ft -2 was applied as water soluble sources from April through September. The study area was inoculated with Sclerotinia homoeocarpa infested, dried Kentucky bluegrass seed at 3.6 oz ft -2 on 29 June. Overhead irrigation was applied as needed to prevent drought stress. Treatments consisted of new fungicide formulations, currently available products applied individually, as tank mixes, and/or in rotational programs, and nutritional programs. Initial applications for most treatments were made on 19 May prior to disease developing in the trial area. Fourteen day intervals of Pinpoint, UC16-15 and UC16-16 were initially applied on 1 June. Twenty-one day intervals of Pinpoint, UC16-16, and UC16-8 (21-d) were applied initiallyon 10 June. Subsequent applications were made at specified intervals through 11 August. All treatments were applied using a hand held CO 2 powered spray boom outfitted with a single AI9504E flat fan nozzle calibrated to deliver 1.0 gal 1000-ft -2 at 40 psi. Plots measured 3 x 6 ft and were arranged in a randomized complete block design with four replications. using Fisher s protected least significant difference test. Dollar spot data were log-transformed, and means were detransformed for presentation. RESULTS AND DISCUSSION Dollar Spot Incidence Dollar spot developed from a natural infestation on 3 June and increased slowly throughout the month with 62 dollar spot infection centers (DISC) in untreated control plots forming by 1 July (Table 1a). All treatments provided good dollar spot control during this time except, UC16-8, Pinpoint, UC16-15, and UC16-16 since initial applications of these products did not occur until 1 June (14-d interval) or 10 June (21-d interval). Following inoculation and favorable environmental conditions for disease, dollar spot incidence increased dramatically during July (80 to 213 DISC in untreated) and August (250 to 326 DISC in untreated plots) (Tables 1a and 1b). Kabuto + TebuStar tank mixes were evaluated at various rates and intervals; with and without Transfilm, a surfactant. Kabuto + TebuStar applied every 14-d generally provided acceptable dollar spot control (~30 DISC plot -1 ) throughout July and August regardless of fungicide rate (Table 1b). However, when applied every 28-d these same tank mixes and rates failed to consistently provide acceptable dollar spot control during the height of the epidemic in July and August. The addition of Transfilm had little effect on dollar spot incidence. All currently commercially available SDHI fungicides labeled for dollar spot control were applied at various rates and intervals to assess duration of control of these products. Xzemplar applied at 0.21 fl.oz. every 21-d or 0.26 fl.oz. every 28-d routinely provided good dollar spot control through July and August (Table 1b). Velista applied at 0.3 oz. every 14-d generally provided acceptable disease control. However applications at 0.3 to 0.5 oz. at 21 to 28-d intervals did not provide adequate dollar spot control, particularly during August. Emerald applied at 0.13 oz. or 0.18 oz. every 21- or 28-d, respectively consistently provided acceptable disease control. Kabuto applied alone did not provide acceptable disease control regardless of rate or application interval under the high disease pressure experienced in this trial during July and August. Dollar spot incidence was assessed as a count of individual dollar spot infection centers within each plot from 3 June to 2 September. Turf quality was visually assessed on a 1 to 9 scale; where 9 represented the best quality turf and 6 was the minimum acceptable level. Phytotoxicity was also assessed visually where 0 was equal to no discoloration and 2 represented the maximum acceptable level. All data were subjected to an analysis of variance and means were separated Secure, UC16-8, UC16-7, Pinpoint (14-d interval), UC16-15, UC16-16, and the Plant Food Program (a rotating tank mix consisting of various nutrients and a low rate of Tebuconazole) all provided good to acceptable dollar spot control during July and August. Pinpoint is a new strobilurin (Q o I) fungicide which is unique among other fungicides in this chemical class due to its significant activity against the causal agent of dollar spot. However, it has a slightly reduced spectrum activity against 27 Table of Contents
38 other turf diseases compared to most currently used strobilurin fungicides. Turf Quality and Phytotoxicity There was little to no phytotoxicity caused by any of the treatments for the duration of the study. As such, turf quality was primarily influenced by disease incidence. On 8 July, most treatments showed acceptable levels of turf quality, with the exception of Kabuto (0.5 oz.) + TebuStar (0.68 oz) (28-d), Kabuto (0.5 oz, 21-d), and Interface (2.0 oz). Due to the inclusion of various nutrients, the Plant Food Program yielded exceptionally good quality as of this date, and was consistently the highest performer in terms of quality on a field that was otherwise fairly nitrogen-deficient. Although quality continued to deteriorate on plots with severe disease breakthrough as of 28 July, plots treated with Kabuto + TebuStar, Xzemplar, Velista (0.5 oz), Emerald (0.18 oz), UC16-8, Secure, UC16-7, UC16-16 (14-d), UC16-15, and the Plant Food Program showed very good-excellent turf quality on this date. CONCLUSION Numerous fungicide options exist for dollar spot control in golf course fairways. Data presented in this study demonstrate that optimal disease control is dependent not only on product selection, but also application rate and interval. When selecting fungicides for use, superintendents should consider first your preferred spray interval and evaluate appropriate fungicide products and rates accordingly. Keep in mind that there are very few fungicides which will reliably provide 28 days of dollar spot control. Targeting an extended application interval such as this may result in periodic disease breakthrough, and limit the number of fungicide options available to rotate among. Fewer rotation options will contribute to resistance development. 28 Table of Contents
39 Table 1a. Dollar spot incidence influenced by various fungicides on a creeping bentgrass fairway turf at the Plant Science Research and Education Facility in Storrs, CT during Dollar Spot Incidence Treatment Rate per 1000ft 2 Int y 3 Jun 9 Jun 17 Jun 24 Jun 1 Jul 8 July 15 July # of dollar spot infection centers 18 ft Kabuto fl.oz. 14-d 0.0 x e w 0.0 f 0.6 fgh 0.0 e 0.3 hi 1.2 gl 2.7 l-o + TebuStar fl.oz. Kabuto fl.oz. 28-d 0.3 e 1.4 b-f 1.7 c-g 0.5 cde 0.2 hi 3.0 f-j 12.9 c-h + TebuStar fl.oz. Kabuto fl.oz. 14-d 0.0 e 0.0 f 0.2 gh 0.2 e 0.0 i 0.0 l 7.0 g-n + TebuStar fl.oz. Kabuto fl.oz. 28-d 0.0 e 0.3 ef 0.2 gh 0.0 e 0.0 i 5.7 d-g 12.0 d-i + TebuStar fl.oz. Kabuto fl.oz. 14-d 0.0 e 0.0 f 0.3 fgh 0.3 de 0.8 f-i 0.2 kl 1.7 no + TebuStar fl.oz. + Transfilm % v/v Kabuto fl.oz. 28-d 0.0 e 2.1 b-f 3.4 b-e 0.4 de 0.2 hi 2.3 g-l 8.7 f-l + TebuStar fl.oz. + Transfilm % v/v Kabuto fl.oz. 14-d 0.0 e 0.0 f 0.3 fgh 0.0 e 0.0 i 0.0 l 2.9 j-o + TebuStar fl.oz. Kabuto fl.oz. 28-d 3.8 bc 4.0 bcd 7.9 b 2.8 b 10.5 bc 19.0 bcd 52.8 ab + TebuStar fl.oz. Fame+T fl.oz. 28-d 0.3 e 1.3 b-f 1.5 d-h 0.7 cde 3.7 c-f 12.8 b-e 35.9 bcd Xzemplar fl.oz. 21-d 0.0 e 0.2 ef 0.9 e-h 0.2 e 0.0 i 0.2 kl 2.8 k-o Xzemplar fl.oz. 28-d 0.3 e 0.4 ef 0.2 gh 0.2 e 0.0 i 2.7 f-k 10.8 e-i Xzemplar fl.oz. 28-d 0.0 e 0.0 f 0.9 e-h 0.3 de 0.0 i 1.0 h-l 11.6 d-i Velista oz. 14-d 0.0 e 0.6 def 0.7 e-h 0.2 e 0.0 i 0.2 kl 5.1 g-n Velista oz. 21-d 0.0 e 0.2 ef 0.3 fgh 0.0 e 0.2 hi 0.0 l 3.6 i-o Velista oz. 21-d 0.0 e 0.7 c-f 0.7 e-h 0.0 e 0.5 ghi 0.9 i-l 7.4 g-m Velista oz. 28-d 0.0 e 0.0 f 1.1 e-h 0.2 e 0.0 i 0.6 jkl 5.2 g-n Emerald oz. 21-d 0.0 e 0.3 ef 0.4 fgh 0.6 cde 2.2 d-h 2.4 g-k 13.1 c-h Emerald oz. 28-d 0.0 e 0.0 f 1.4 d-h 0.0 e 1.2 f-i 4.9 e-i 15.3 c-g Emerald oz. 28-d 0.0 e 1.1 b-f 0.0 e 0.0 e 0.7 f-i 1.1 g-l 10.3 e-j Kabuto fl.oz. 14-d 0.6 e 0.6 def 0.0 e 0.0 e 3.1 c-g 1.9 g-l 13.9 c-h Kabuto fl.oz. 21-d 0.0 e 0.9 b-f 0.3 de 0.3 de 5.4 b-e 10.4 c-f 61.2 ab Kabuto fl.oz. 21-d 1.0 e 3.9 bcd 0.0 e 0.0 e 9.8 bc 37.5 ab a Interface fl.oz. 14-d 0.0 e 0.2 ef 0.0 e 0.0 e 5.7 b-e 15.4 b-e 40.3 bc Interface fl.oz. 21-d 0.0 e 1.8 b-f 0.6 cde 0.6 cde 14.6 b 23.2 bc 66.4 ab Interface fl.oz. 21-d 0.0 e 0.9 b-f 0.0 e 0.0 e 0.0 i 4.8 e-i 29.7 b-e UC fl.oz. 21-d 11.5 a 20.7 a 1.7 bcd 1.7 bcd 1.4 e-i 1.2 g-l 4.3 h-n Headway fl.oz. 21-d 0.0 e 2.8 b-e 0.0 e 0.0 e 1.9 d-h 1.0 h-l 10.1 e-k Secure fl.oz. 14-d 0.0 e 0.6 def 0.3 de 0.3 de 0.0 i 0.0 l 1.9 mno UC fl.oz. 14-d 0.0 e 0.0 f 0.0 e 0.0 e 0.0 i 1.2 g-l 5.9 g-n Pinpoint fl.oz. 14-d 13.6 a 4.7 b 2.1 bc 2.1 bc 3.7 c-f 1.7 g-l 10.7 e-i Pinpoint fl.oz. 21-d 2.4 cd 4.6 bc 0.3 de 0.3 de 6.5 bcd 5.5 d-h 26.3 b-f UC fl.oz. 21-d 7.7 ab 21.2 a 0.0 e 0.0 e 1.9 d-h 1.4 g-l 5.8 g-n UC fl.oz. 14-d 6.7 abc 0.6 def 0.0 e 0.0 e 0.2 hi 0.0 l 0.6 o UC fl.oz. 14-d 5.5 abc 2.0 b-f 0.6 cde 0.6 cde 0.3 hi 1.9 g-l 1.8 mno Plant Foods Program z d 0.0 e 0.0 f 0.0 e 0.0 e 0.3 hi 0.3 jkl 1.8 no Untreated ab 28.0 a 28.3 a 30.6 a 61.7 a 80.1 a a ANOVA: Treatment (P > F) Days after treatment 14-d d d z The Plant Food program consists of (6.0 fl.oz.), Impulse (3.0 fl.oz.), Phosphite 30 (2.0 fl.oz.), Green Blade (0.36 fl.oz.), and Torque (0.36 fl.oz.) tank-mixed and applied every 14-d. y Most treatments were initiated on 19-May, prior to disease development, and were reapplied at specified intervals. Pinpoint, UC16-15 and UC16-16 (14-d) received their initial application on 1 June. Pinpoint, UC16-16, and UC16-8 (21-d) received their initial application on 10 June. x Dollar spot data were automatically log-transformed. Means are de-transformed for presentation. w Means followed by the same letter, within each column, are not significantly different based on Fisher s protected least significant difference test (α = 0.05) 29 Table of Contents
40 Table 1b. Dollar spot incidence influenced by various fungicides on a creeping bentgrass fairway turf at the Plant Science Research and Education Facility in Storrs, CT during Dollar Spot Incidence Treatment Rate per 1000ft 2 Int y 22 Jul 28 Jul 11 Aug 19 Aug 26 Aug 2 Sep # of dollar spot infection centers 18 ft Kabuto fl.oz. 14-d 0.0 x n w 0.0 o 2.0 n 3.0 l 26.4 n-q 77.8 j-o + TebuStar fl.oz. Kabuto fl.oz. 28-d 1.6 k-n 7.2 e-j 72.8 i-l 69.6 fgh d-g bcd + TebuStar fl.oz. Kabuto fl.oz. 14-d 1.4 lmn 1.0 l-o 14.0 mn 7.3 kl 59.2 j-o g-k + TebuStar fl.oz. Kabuto fl.oz. 28-d 2.2 j-m 10.6 d-i f-i 91.2 d-g d-g e-h + TebuStar fl.oz. Kabuto fl.oz. 14-d 0.8 mn 2.2 j-o 3.0 n 6.4 kl 39.5 k-q i-n + TebuStar fl.oz. + Transfilm % v/v Kabuto fl.oz. 28-d 2.8 i-m 3.7 h-m 74.0 i-l 76.0 fg e-h e-i + TebuStar fl.oz. + Transfilm % v/v Kabuto fl.oz. 14-d 0.0 n 3.7 h-m 6.5 n 5.9 kl 63.2 i-n g-n + TebuStar fl.oz. Kabuto fl.oz. 28-d 16.0 efg 30.7 bcd def cd c-f cde + TebuStar fl.oz. Fame+T fl.oz. 28-d 7.3 f-j 19.3 d-g e-h def d-g e-i Xzemplar fl.oz. 21-d 9.1 e-i 3.0 i-n 38.3 j-n 14.1 jkl 19.5 opq 62.7 k-p Xzemplar fl.oz. 28-d 1.2 lmn 1.7 j-o 65.0 i-m 32.0 hij 43.8 k-q 49.9 m-p Xzemplar fl.oz. 28-d 0.8 mn 0.7 l-o 20.8 lmn 8.8 jkl 16.7 pq 20.4 p Velista oz. 14-d 0.6 mn 2.4 i-o 30.0 k-n 54.0 ghi d-g e-i Velista oz. 21-d 6.8 f-k 4.8 g-l 73.0 i-l 93.4 d-g e-h e-i Velista oz. 21-d 28.0 b-e 14.6 d-h 78.5 h-k 88.5 efg f-i e-i Velista oz. 28-d 1.2 lmn 2.9 i-n 76.0 h-l 89.4 efg c-f efg Emerald oz. 21-d 21.9 c-f 7.5 e-j 5.8 n 6.8 kl 26.7 n-q 49.1 nop Emerald oz. 28-d 3.8 h-m 7.5 e-j 90.5 g-j 80.0 efg g-j g-k Emerald oz. 28-d 0.9 mn 2.2 j-o 25.5 k-n 19.4 jkl 25.1 n-q 32.7 op Kabuto fl.oz. 14-d 8.9 e-i 25.8 c-f 78.0 h-k 71.4 fgh e-h efg Kabuto fl.oz. 21-d a 93.2 abc cd cd bcd bcd Kabuto fl.oz. 21-d a a a b ab ab Interface fl.oz. 14-d 55.7 a-d 95.7 ab cd bc bc bcd Interface fl.oz. 21-d a a bc bc bc abc Interface fl.oz. 21-d 68.2 abc 96.2 ab cde cde cde bcd UC fl.oz. 21-d 5.7 g-l 1.9 j-o 8.0 n 7.4 kl 21.9 n-q 48.7 nop Headway fl.oz. 21-d 20.6 def 22.1 def 96.3 ghi 67.4 fgh 75.3 h-m h-n Secure fl.oz. 14-d 0.0 n 2.4 i-o 7.0 n 6.8 kl 36.7 l-q 89.4 i-o UC fl.oz. 14-d 0.0 n 1.7 j-o 9.0 n 10.9 jkl 85.8 g-l f-j Pinpoint fl.oz. 14-d 2.5 i-m 6.6 f-k 38.3 j-n 25.7 ijk 55.4 j-p e-i Pinpoint fl.oz. 21-d 79.5 ab 27.2 b-e d-g def c-f def UC fl.oz. 21-d 13.1 e-h 4.2 h-l 32.3 k-n 23.9 ijk 91.4 g-k g-l UC fl.oz. 14-d 0.0 n 0.4 mno 2.5 n 2.7 l 14.5 q 52.6 m-p UC fl.oz. 14-d 0.0 n 0.2 no 8.8 n 10.8 jkl 55.0 j-p g-m Plant Foods Program z d 1.8 j-n 1.3 k-o 8.5 n 7.1 kl 32.0 m-q 55.5 l-p Untreated a a ab a a a ANOVA: Treatment (P > F) Days after treatment 14-d d d z The Plant Food program consists of (6.0 fl.oz.), Impulse (3.0 fl.oz.), Phosphite 30 (2.0 fl.oz.), Green Blade (0.36 fl.oz.), and Torque (0.36 fl.oz.) tank-mixed and applied every 14-d. y Most treatments were initiated on 19-May, prior to disease development, and were reapplied at specified intervals. Pinpoint, UC16-15 and UC16-16 (14-d) received their initial application on 1 June. Pinpoint, UC16-16, and UC16-8 (21-d) received their initial application on 10 June. xdollar spot data were automatically log-transformed. Means are de-transformed for presentation. w Means followed by the same letter, within each column, are not significantly different based on Fisher s protected least significant difference test (α = 0.05) 30 Table of Contents
41 Table 2a. Turf quality influenced by various fungicides on a creeping bentgrass fairway turf at the Plant Science Research and Education Facility in Storrs, CT during Turf Quality Treatment Rate per 1000ft 2 Int y 3 Jun 17 Jun 24 Jun 1 Jul 8 Jul ; 6 is min acceptable Kabuto fl.oz. 14-d 6.5 bcd x 7.3 b-e 6.8 def 6.5 c-f 6.5 c-f + TebuStar fl.oz. Kabuto fl.oz. 28-d 7.0 b 7.3 b-e 6.8 def 6.5 c-f 6.3 d-g + TebuStar fl.oz. Kabuto fl.oz. 14-d 6.5 bcd 7.5 bcd 6.8 def 6.8 cde 6.5 c-f + TebuStar fl.oz. Kabuto fl.oz. 28-d 6.5 bcd 6.8 c-g 7.0 c-f 6.8 cde 6.3 d-g + TebuStar fl.oz. Kabuto fl.oz. 14-d 6.0 cde 7.3 b-e 6.5 ef 6.3 def 6.8 b-e + TebuStar fl.oz. + Transfilm % v/v Kabuto fl.oz. 28-d 6.0 cde 6.5 d-g 7.0 c-f 6.5 c-f 6.5 c-f + TebuStar fl.oz. + Transfilm % v/v Kabuto fl.oz. 14-d 6.3 bcd 7.3 b-e 6.5 ef 6.3 def 6.8 b-e + TebuStar fl.oz. Kabuto fl.oz. 28-d 6.0 cde 6.3 efg 6.8 def 6.0 ef 5.3 h + TebuStar fl.oz. Fame+T fl.oz. 28-d 6.8 bc 6.8 c-g 7.0 c-f 6.8 cde 5.8 fgh Xzemplar fl.oz. 21-d 6.8 bc 6.5 d-g 7.3 b-e 6.8 cde 6.5 c-f Xzemplar fl.oz. 28-d 6.5 bcd 7.0 b-f 7.0 c-f 7.0 bcd 6.8 b-e Xzemplar fl.oz. 28-d 6.8 bc 7.0 b-f 7.0 c-f 6.8 cde 6.5 c-f Velista oz. 14-d 6.8 bc 6.5 d-g 6.8 def 7.3 bc 7.0 bcd Velista oz. 21-d 6.5 bcd 7.0 b-f 7.0 c-f 6.5 c-f 6.5 c-f Velista oz. 21-d 6.5 bcd 7.0 b-f 7.3 b-e 6.8 cde 6.8 b-e Velista oz. 28-d 6.8 bc 6.5 d-g 7.3 b-e 6.5 c-f 6.8 b-e Emerald oz. 21-d 7.0 b 7.5 bcd 7.0 c-f 6.5 c-f 6.0 e-h Emerald oz. 28-d 7.0 b 7.0 b-f 7.0 c-f 6.5 c-f 6.5 c-f Emerald oz. 28-d 7.0 b 7.3 b-e 7.5 a-d 7.0 bcd 6.5 c-f Kabuto fl.oz. 14-d 7.0 b 7.0 b-f 6.5 ef 6.3 def 6.3 d-g Kabuto fl.oz. 21-d 6.5 bcd 6.8 c-g 6.8 def 6.3 def 6.0 e-h Kabuto fl.oz. 21-d 6.5 bcd 6.3 efg 7.0 c-f 6.0 ef 5.3 h Interface fl.oz. 14-d 7.0 b 8.0 ab 7.8 abc 6.3 def 5.8 fgh Interface fl.oz. 21-d 6.8 bc 7.5 bcd 8.0 ab 5.8 f 5.5 gh Interface fl.oz. 21-d 6.8 bc 7.8 bc 7.5 a-d 7.8 b 6.3 d-g UC fl.oz. 21-d 5.0 f 6.3 efg 7.0 c-f 7.0 bcd 6.8 b-e Headway fl.oz. 21-d 6.5 bcd 7.5 bcd 7.3 b-e 6.5 c-f 6.3 d-g Secure fl.oz. 14-d 6.5 bcd 7.0 b-f 7.3 b-e 7.0 bcd 7.3 bc UC fl.oz. 14-d 6.8 bc 7.3 b-e 7.3 b-e 7.0 bcd 7.0 bcd Pinpoint fl.oz. 14-d 5.3 ef 5.8 g 6.3 f 6.5 c-f 6.3 d-g Pinpoint fl.oz. 21-d 6.0 cde 6.3 efg 7.8 abc 6.0 ef 6.3 d-g UC fl.oz. 21-d 5.8 def 6.0 fg 7.0 c-f 6.0 ef 6.3 d-g UC fl.oz. 14-d 5.3 ef 7.5 bcd 7.5 a-d 7.3 bc 6.5 c-f UC fl.oz. 14-d 6.0 cde 6.8 c-g 7.0 c-f 7.0 bcd 7.5 ab Plant Foods Program z d 8.0 a 9.0 a 8.3 a 8.8 a 8.3 a Untreated def 4.5 h 5.3 g 4.5 g 3.5 i ANOVA: Treatment (P > F) Days after treatment 14-d d d z The Plant Food program consists of (6.0 fl.oz.), Impulse (3.0 fl.oz.), Phosphite 30 (2.0 fl.oz.), Green Blade (0.36 fl.oz.), and Torque (0.36 fl.oz.) tank-mixed and applied every 14-d. y Most treatments were initiated on 19-May, prior to disease development, and were reapplied at specified intervals. Pinpoint, UC16-15 and UC16-16 (14-d) received their initial application on 1 June. Pinpoint, UC16-16, and UC16-8 (21-d) received their initial application on 10 June. x Means followed by the same letter, within each column, are not significantly different based on Fisher s protected least significant difference test (α = 0.05) 31 Table of Contents
42 Table 2b. Turf quality influenced by various fungicides on a creeping bentgrass fairway turf at the Plant Science Research and Education Facility in Storrs, CT during Turf Quality Treatment Rate per 1000ft 2 Int y 15 Jul 22 Jul 28 Jul 19 Aug ; 6 is min acceptable Kabuto fl.oz. 14-d 7.5 a-d x 7.5 abc 7.8 abc 7.5 abc + TebuStar fl.oz. Kabuto fl.oz. 28-d 6.0 e-i 7.3 abc 7.3 a-e 5.8 e-h + TebuStar fl.oz. Kabuto fl.oz. 14-d 6.8 b-g 7.3 abc 6.8 c-g 7.3 abc + TebuStar fl.oz. Kabuto fl.oz. 28-d 5.5 g-k 6.5 cde 6.0 fgh 4.8 h-k + TebuStar fl.oz. Kabuto fl.oz. 14-d 7.5 a-d 7.5 abc 7.3 a-e 7.5 abc + TebuStar fl.oz. + Transfilm % v/v Kabuto fl.oz. 28-d 6.0 e-i 6.8 bcd 7.0 b-f 5.3 ghi + TebuStar fl.oz. + Transfilm % v/v Kabuto fl.oz. 14-d 7.0 b-f 7.3 abc 7.3 a-e 7.0 bcd + TebuStar fl.oz. Kabuto fl.oz. 28-d 4.3 klm 5.8 def 5.3 hi 3.8 kl + TebuStar fl.oz. Fame+T fl.oz. 28-d 5.0 h-l 6.0 def 5.8 gh 4.3 i-l Xzemplar fl.oz. 21-d 7.3 b-e 6.0 def 7.3 a-e 6.8 b-e Xzemplar fl.oz. 28-d 6.5 c-g 7.3 abc 8.0 ab 6.5 c-f Xzemplar fl.oz. 28-d 6.0 e-i 7.3 abc 7.3 a-e 7.5 abc Velista oz. 14-d 7.5 a-d 7.8 ab 6.8 c-g 5.8 e-h Velista oz. 21-d 7.0 b-f 6.0 def 6.8 c-g 5.0 g-j Velista oz. 21-d 6.3 d-h 5.3 fg 6.8 c-g 5.0 g-j Velista oz. 28-d 7.8 abc 7.5 abc 7.8 abc 5.0 g-j Emerald oz. 21-d 6.5 c-g 5.5 efg 6.3 e-h 7.5 abc Emerald oz. 28-d 5.8 f-j 6.5 cde 6.8 c-g 5.3 ghi Emerald oz. 28-d 6.5 c-g 7.3 abc 7.0 b-f 7.0 bcd Kabuto fl.oz. 14-d 6.5 c-g 6.5 cde 5.8 gh 5.5 fgh Kabuto fl.oz. 21-d 4.5 j-m 3.8 h 4.3 ijk 3.3 l Kabuto fl.oz. 21-d 3.3 mn 2.5 i 3.3 kl 3.3 l Interface fl.oz. 14-d 4.8 i-l 4.0 h 4.3 ijk 3.5 l Interface fl.oz. 21-d 3.8 lm 3.8 h 3.8 jk 3.3 l Interface fl.oz. 21-d 6.0 e-i 4.5 gh 4.5 ij 3.8 kl UC fl.oz. 21-d 7.0 b-f 6.5 cde 7.0 b-f 7.3 abc Headway fl.oz. 21-d 6.0 e-i 5.5 efg 6.5 d-g 5.0 g-j Secure fl.oz. 14-d 7.8 abc 7.8 ab 8.0 ab 7.8 ab UC fl.oz. 14-d 7.5 a-d 7.5 abc 7.0 b-f 7.3 abc Pinpoint fl.oz. 14-d 5.8 f-j 6.5 cde 6.5 d-g 6.8 b-e Pinpoint fl.oz. 21-d 5.5 g-k 4.0 h 5.3 hi 4.0 jkl UC fl.oz. 21-d 6.3 d-h 5.8 def 6.5 d-g 6.0 d-g UC fl.oz. 14-d 8.0 ab 7.8 ab 7.5 ad 8.3 a UC fl.oz. 14-d 7.5 a-d 7.8 ab 7.5 a-d 7.0 bcd Plant Foods Program z d 8.8 a 8.3 a 8.3 a 7.3 abc Untreated n 2.3 i 2.3 l 1.5 m ANOVA: Treatment (P > F) Days after treatment 14-d d d z The Plant Food program consists of (6.0 fl.oz.), Impulse (3.0 fl.oz.), Phosphite 30 (2.0 fl.oz.), Green Blade (0.36 fl.oz.), and Torque (0.36 fl.oz.) tank-mixed and applied every 14-d. y Most treatments were initiated on 19-May, prior to disease development, and were reapplied at specified intervals. Pinpoint, UC16-15 and UC16-16 (14-d) received their initial application on 1 June. Pinpoint, UC16-16, and UC16-8 (21-d) received their initial application on 10 June. x Means followed by the same letter, within each column, are not significantly different based on Fisher s protected least significant difference test (α = 0.05) 32 Table of Contents
43 Table 3. Phytotoxicity influenced by various fungicides on a creeping bentgrass fairway turf at the Plant Science Research and Education Facility in Storrs, CT during Phytotoxicity Treatment Rate per 1000ft 2 Int y 24 Jun 1 Jul 19 Aug ; 2=max acceptable Kabuto fl.oz. 14-d TebuStar fl.oz. Kabuto fl.oz. 28-d TebuStar fl.oz. Kabuto fl.oz. 14-d TebuStar fl.oz. Kabuto fl.oz. 28-d TebuStar fl.oz. Kabuto fl.oz. 14-d TebuStar fl.oz. + Transfilm % v/v Kabuto fl.oz. 28-d TebuStar fl.oz. + Transfilm % v/v Kabuto fl.oz. 14-d TebuStar fl.oz. Kabuto fl.oz. 28-d TebuStar fl.oz. Fame+T fl.oz. 28-d Xzemplar fl.oz. 21-d Xzemplar fl.oz. 28-d Xzemplar fl.oz. 28-d Velista oz. 14-d Velista oz. 21-d Velista oz. 21-d Velista oz. 28-d Emerald oz. 21-d Emerald oz. 28-d Emerald oz. 28-d Kabuto fl.oz. 14-d Kabuto fl.oz. 21-d Kabuto fl.oz. 21-d Interface fl.oz. 14-d Interface fl.oz. 21-d Interface fl.oz. 21-d UC fl.oz. 21-d Headway fl.oz. 21-d Secure fl.oz. 14-d UC fl.oz. 14-d Pinpoint fl.oz. 14-d Pinpoint fl.oz. 21-d UC fl.oz. 21-d UC fl.oz. 14-d UC fl.oz. 14-d Plant Food Program z d Untreated ANOVA: Treatment (P > F) Days after treatment 14-d d d z The Plant Food program consists of (6.0 fl.oz.), Impulse (3.0 fl.oz.), Phosphite 30 (2.0 fl.oz.), Green Blade (0.36 fl.oz.), and Torque (0.36 fl.oz.) tank-mixed and applied every 14-d. y Most treatments were initiated on 19-May, prior to disease development, and were reapplied at specified intervals. Pinpoint, UC16-15 and UC16-16 (14-d) received their initial application on 1 June. Pinpoint, UC16-16, and UC16-8 (21-d) received their initial application on 10 June. 33 Table of Contents
44 CURATIVE DOLLAR SPOT CONTROL WITH VARIOUS FUNGICIDES ON A CREEPING BENTGRASS FAIRWAY TURF, 2016 K. Miele, J. Dunnack, Z. Esponda, S. Vose, and J. Inguagiato Department of Plant Science and Landscape Architecture University of Connecticut, Storrs INTRODUCTION Dollar spot (caused by Sclerotinia homoeocarpa) is a common disease of golf course fairway turf occurring from May to October throughout New England. Control of this disease is achieved through integrated management utilizing improved bentgrass varieties, cultural, and chemical approaches. However, when environmental conditions are particularly favorable for dollar spot development, the disease may occur despite preventive management. In these cases, curative fungicide applications are required to arrest the disease and prevent further turf loss. The objective of this study was to evaluate the curative efficacy of commercially avaliable fungicides against S. homoeocarpa. MATERIALS & METHODS A field study was conducted on a Ninety-Six Two creeping bentgrass (Agrostis stolonifera) turf grown on a Paxton fine sandy loam at the Plant Science Research and Education Facility in Storrs, CT. Turf was mowed three days wk -1 at a bench setting of 0.5-inches. Minimal nitrogen was applied to the study area to encourage dollar spot development. A total of 0.45 lb N 1000-ft -2 was applied as water soluble sources prior to trial initiation. 0.5 lbs N 1000-ft -2 was applied on 12 July following initial treatment application to assist with turf recovery. The study area was inoculated with dried Kentucky bluegrass seed infected with Sclerotinia homoeocarpa on 29 June at a rate of 3.62 oz ft -2. Overhead irrigation was applied as needed to prevent drought stress. Treatments consisted of various fungicides applied curatively. Initial applications were made on 11 July after a severe epidemic had established in the trial area. Subsequent applications were made as detailed in Table 1. All treatments were applied using a hand held CO 2 powered spray boom outfitted with a single AI9504E flat fan nozzle calibrated to deliver 1.0 gal 1000-ft -2 at 40 psi. Nitrogen was applied at a rate of 0.5 lbs 1000-ft -2 on 12 July to assist with turf recovery. Plots measured 3 x 6 ft and were arranged in a randomized complete block design with four replications. RESULTS AND DISCUSSION Dollar Spot Incidence A severe epidemic of dollar spot was evident throughout the trial area at the beginning of the study [average = 113 dollar spot infection centers (DSIC) plot -1 ]. No treatments provided acceptable dollar spot control (i.e., 25) 7 days after initial treatment (DAIT) on 18 Jul, although all treatments reduced disease compared to untreated control (Table 1). Plots treated with Xzemplar, Interface, Velista or Secure applied alone generally showed the greatest reduction in disease on this date. By 11 DAIT (22 Jul) nearly all treatments had provided acceptable dollar spot control with few differences among treated turf. However, at 16 DAIT (27 Jul), disease was greater in Secure-alone and Interface treated plots than all other treatments, albeit still less than untreated control. Both of these treatments provided good curative control in the days following initial application; although did not continue to suppress disease at the end of their intended application interval. Therefore, it is possible that a shorter re-application interval may be necessary for curative control with these fungicides. As of 5 Aug, 9 days after the second application of 14-d treatments was made, all treated plots provided near complete disease control, whereas disease had continued to increase in untreated controls (229 DSIC plot -1 ). Aerial Mycelium High humidity and warm overnight temperatures provided an opportunity to assess aerial mycelium production 4 DAIT (15 Jul). Faint to no visible aerial mycelium was observed in Xzemplar, Emerald, Secure, 26GT, and Velista + Secure; which may suggest that these treatments may act quickly to arrest fungal growth. Dollar spot incidence was assessed as a count of individual disease foci within each plot from 11 July to 5 August. Mycelium intensity was assessed on a 0-5 scale, with 0 representing no visible mycelium and 5 representing a dense, cotton-like mass of mycelium on 15 July. All data were subjected to an analysis of variance and means were separated using Fisher s protected least significant difference test. 34 Table of Contents
45 Table 1. Effect of various fungicides on applied curatively on dollar spot incidence and mycelium intensity on a creeping bentgrass fairway turf at the Plant Science Research and Education Facility in Storrs, CT during Dollar Spot Incidence Mycelium Treatment Rate per 1000ft 2 Int z 11 Jul 15 Jul 18 Jul 20 Jul 22 Jul 27 Jul 5 Aug 15 Jul # of dollar spot foci 18ft ; 0=none--- Xzemplar fl.oz. 14-d w 44.9 w 33.6 v bcd u 28.8 b 22.8 bc 13.4 w d 2.4 w de 0.2 v ef Emerald oz. 14-d b 33.0 b 24.0 bc 19.5 cd 2.3 de 0.4 def Velista oz. 14-d bcd 38.5 b 28.5 bc 30.3 c 3.9 cde 1.5 bc Secure fl.oz. 14-d d 22.5 b 17.0 c 61.3 b 3.2 de 0.0 f 26GT fl.oz. 14-d bc 33.0 b 24.8 bc 21.9 cd 2.4 de 0.6 de Interface fl.oz. 14-d bcd 34.0 b 39.0 b 66.9 b 10.6 bc 2.2 b Velista oz. 14-d cd 24.8 b 17.8 c 15.2 d 1.1 e 0.0 f + Secure fl.oz. Velista oz. 11 Jul y bc 40.5 b 35.0 bc 31.5 c 4.7 bcd 1.0 cd - Secure fl.oz. 26 Jul y Velista oz. 11 Jul x bcd 36.0 b 26.5 bc 18.3 cd 12.5 b 1.7 bc - Secure fl.oz. 18 Jul x Untreated a a a a a 4.2 a ANOVA: Treatment (P > F) Days after treatment initial d d z Treatments were initiated on 11 July, after disease had developed within the trial area. Subsequent applications were made 15-d later on 26 July, or as otherwise specified. y Velista (0.5 oz.) was applied on 11 July. Secure (0.5 oz) was applied on 26 July. x Velista (0.5 oz.) was applied on 11 July. Secure (0.5 oz) was applied on 18 July. w Data were automatically log transformed. Means are de-transformed for presentation. v Data were automatically square-root transformed. Means are de-transformed for presentation. u Means followed by the same letter, within each column, are not significantly different based on Fisher s protected least significant difference test (α = 0.05) 35 Table of Contents
46 PREVENTIVE DOLLAR SPOT CONTROL WITH VARIOUS FUNGICIDES ON A CREEPING BENTGRASS PUTTING GREEN TURF, 2016 K. Miele, J. Dunnack, Z. Esponda, S. Vose, and J. Inguagiato Department of Plant Science and Landscape Architecture University of Connecticut, Storrs INTRODUCTION Dollar spot is a common disease of cool-season turfgrasses caused by the fungal pathogen Sclerotinia homoeocarpa. On golf course fairways it is characterized by light, straw-colored spots that may coalesce into larger irregularly shaped areas. It is particularly active during periods of warm daytime temperatures (80 F), cool nighttime temperatures (60 F), and high humidity. It can be managed in part with cultural practices such as maintaining moderate nitrogen fertility, reducing leaf wetness period. However, the use of fungicides is often still necessary on high priority areas such as greens, tees and fairways. The objective of this study was to evaluate the efficacy of rotational fungicide programs as well as using new and existing fungicides in controlling dollar spot on a creeping bentgrass fairway turf. MATERIALS & METHODS Dollar spot incidence was assessed as a count of individual disease foci within each plot. Turf quality was visually assessed on a 1 to 9 scale; where 9 represented the best quality turf and 6 was the minimum acceptable level. Phytotoxicity was also assessed visually where 0 was equal to no discoloration and 2 represented the maximum acceptable level. NDVI measurements were taken with a FieldScout TCM 500 NDVI meter (Spectrum Technologies, Aurora, IL). Brown Patch incidence was assessed as a percentage of plot area blighted by disease. Aeration recovery was assessed on a 1 to 9 scale where 9 represented completely grown-in aeration holes and 6 represented the minimum acceptable level. All data were subjected to an analysis of variance and means were separated using Fisher s protected least significant difference test. Dollar spot incidence data were square-root or log transformed for ANOVA and mean separation tests, although means presented are de-transformed values. A field study was conducted on a Penn A-4 creeping bentgrass (Agrostis stolonifera) turf grown on a Paxton fine sandy loam at the Plant Science Research and Education Facility in Storrs, CT. Turf was mowed five days wk -1 at a bench setting of inches. Nitrogen was applied at a total of 2.0 lb N 1000-ft -2 as water soluble sources from April through September. Dylox 80 was applied on 27-May for control of white grubs. Quicksilver was applied on 6 August and 20 August for control of silvery-thread moss. Scimitar was applied on 27 August for control of cutworms. To help alleviate dry surface conditions, the wetting agent Dispatch was applied on 18 June and Revolution was applied on 23 July. Overhead irrigation was applied as needed to prevent drought stress. The trial area was aerated using inch diameter hollow-tines at 1.5 by 2.0 inch spacing on 30 August. Cores were removed and filled with topdressing. The study area was inoculated with Sclerotinia homoeocarpa on 29 June at a rate of 1.1 g m -2. Treatments consisted of new fungicide formulations and currently available products applied individually, as tank mixes, and/or in rotational program. Initial applications for Bayer Programs 1-2 were made on 12 May prior to disease developing in the trial area and when soil temperatures reached 55 F over 5 days at a 2-inch depth. The following application of these treatments, as well as the initial application of Rotational Programs 1-2 took place on 10 June. Individually applied and/or tank-mixed treatments were initiated on 26 May with the exception of Pinpoint, which was first applied on 10 June. Subsequent applications were made on a 14-d or 21-d interval through 2 September. All treatments were applied using a hand held CO 2 powered spray boom outfitted with a single AI9508E flat fan nozzle calibrated to deliver 2.0 gal 1000-ft -2 at 40 psi. Plots measured 3 x 6 ft and were arranged in a randomized complete block design with four replications. RESULTS AND DISCUSSION Dollar Spot Incidence Dollar spot pressure was high throughout the duration of the trial. As of the first observation date (3 June, Table 1a) untreated control plots averaged 50 disease foci per plot. This increased steadily through June, reaching over 100 foci by 1 July. The epidemic reached its peak in mid-august, with untreated plots averaging over 230 foci on 11 August. Though it remained high, disease pressure slowly declined through the remainder of the trial, averaging 180 disease foci for untreated control plots on 16 September. Bayer Programs 1 and 2 were initiated on 12 May when soil temperatures reached 55 F; subsequent applications were withheld 30 days after initial treatment to assess the ability of fungicides applied for fairy ring control to influence dollar spot control. Bayer Programs 1-2 failed to reduce dollar spot compared to untreated control plots at the onset of symptoms on 3 Jun (22 days after treatment, DAT; Table 1a), averaging over 30 disease foci per plot. This is likely due to favorable environmental conditions for disease coinciding with an extended application interval. Disease continued to increase on these plots through 9 June (28 DAT), before receiving a followup application of Mirage on 10 June, after which disease slowly decreased before returning to acceptable levels ( 20 disease foci per plot) on 24 June. Rotations 1 and 2, are identical to the Bayer programs, except they did not receive the initial Tartan application on 12 May. Disease remained high in these plots (>70 foci per plot) through 17 June, before showing a reduction (~30 foci per plot) in disease on the 24 June observation date. 36 Table of Contents
47 Bayer Programs 1 and 2, as well as Rotation 1, generally provided good (<10 foci per plot) control of disease through 8 July, although plots treated with Bayer Program 2 every 21-d had greater disease than Bayer Program 1 and Rotation 1applied every 14-d, most likely due to a longer (21-d vs. 14-d) application interval. Rotation 2 failed to control disease to acceptable levels for the remainder of the trial. Although disease incidence in all four rotational programs reached unacceptable (>20 foci per plot) levels by mid-august (11 August, Table 1b), disease was generally lower in Bayer Program 1 and Rotational Program 1, indicating that a 14-d application interval is more effective at controlling dollar spot on putting greens than a 21-d interval, especially under high disease pressure. Signature XTRA, a new fungicide containing fosetyl-al (60%) and a new formulation of StressGard, was tank-mixed and applied with Lexicon Intrinsic, Briskway, Exteris Stressgard, and Secure. All four combinations provided excellent (<5 foci per plot) control of disease through 1 July, although Briskway + Signature XTRA was less effective (10 foci per plot) compared to Signature XTRA tank-mixes with Lexicon Intrinsic, Exteris StressGard, or Secure on 1 July, albeit still acceptable. From 8 July through the end of the trial, Lexicon Intrinsic + Signature XTRA, Exteris StressGard + Signature XTRA, and Secure + Signature XTRA provided acceptable levels of disease control, with Lexicon and Exteris treated plots providing near complete control of disease. Briskway + Signature XTRA failed to provide acceptable disease control from 8 July forward, peaking at over 180 disease foci per plot on 19 August. Exteris Stressgard, a new fungicide containing fluopyram (SDHI) and trifloxystrobin (Q O I),applied alone provided excellent (<5 foci per plot) control of disease on all dates..secure applied alone provided acceptable dollar spot control on 11 of 15 observation dates, although it was less effective than when tank mixed with Signature XTRA. Tourney (0.37 oz.) provided acceptable dollar spot throughout the trial except on 19 August, when disease reached almost 30 disease foci per plot. Lower rate applications of Tourney (0.28 oz.) failed to provide acceptable dollar spot control with disease foci per plot reaching 40 foci on 9 June and peaking at 96 foci on 19 August. When tank-mixed with Pinpoint, a new Q O I fungicide, the lower rate of Tourney the combination provided acceptable disease control, except on 19 August. On plots where Pinpoint was applied alone, disease tended to fluctuate between acceptable and unacceptable levels. It is not clear whether delaying initial applications until 10 June may have contributed to poor control. Daconil Action and Daconil Weather Stik failed to provide acceptable levels of control at any point during the trial, with both treatments reaching over 100 disease foci per plot as of 28 July, and over 300 foci per plot for Daconil Weather Stik (more than untreated control plots) on 19 August. Daconil Weather Stik treated plots remained at higher levels of disease than untreated plots from this date through the end of the trial, while Daconil Action showed no control of disease relative to untreated plots. Brown Patch Incidence Brown patch developed throughout the trial during late-july reaching 21% plot area blighted in untreated controls by early- August (Table 2). Most treatments provided complete control of the disease. However, brown patch developed in plots (2 to 7% plot area blighted) treated with Pinpoint alone regardless of rate, Daconil Weather Stik and Daconil Action. These treatments still reduced brown patch compared to untreated control. Secure applied alone (16% plot area blighted) failed to reduce brown patch compared to untreated, although the addition of Signature XTRA (4% plot area blighted) slightly improved brown patch control. Turf Quality, NDVI, and Phytotoxicity None of the treatments caused any phytotoxicity (Table 4) at any point during the trial. As such, turf quality (Table 3a + 3b) was primarily influenced by disease incidence. On 8 July, high levels of disease resulted in poor quality (< 6 out of 9) on plots treated with Rotational Program 2, Briskway + Signature XTRA, Pinpoint (0.28 fl.oz.), Secure, Daconil Weather Stik, and Daconil Action. Turf quality was exceptionally high (>8.5 out of 9) on plots treated with Lexicon Intrinsic + Signature XTRA and Exteris Stressgard + Signature XTRA due to improved color, uniformity and excellent disease control. Aeration Recovery The trial area received a routine aeration on 30 August. Plots were assessed for aeration recovery 10 and 17 days after aeration. Several treatments appeared to contribute to improved aeration recovery, resulting in an acceptable recovery level (i.e., 6) 10 days after aeration (9 Sep). An acceptable rate of recovery was observed in plots receiving Bayer Program 1, Rotational Program 1, Lexicon Intrinsic + Signature XTRA, Exteris StressGard, alone or tank mixed with Signature XTRA, and Tourney regardless of application rate. By 17 days after aeration nearly all treatments had reached an accpteable level of recovery except Rotational Program 2, Daconil Weather Stik, Daconil Action, and untreated control. It is likely that severe dollar spot damage to the turf canopy at this time reduced the recuperative ability of these treatments. 37 Table of Contents
48 Table 1a. Effect of various fungicides on dollar spot incidence in a creeping bentgrass putting green at the Plant Science Research and Education Facility in Storrs, CT during Dollar Spot Incidence Treatment Rate per 1000ft 2 Int v 3 Jun 9 Jun 17 Jun 24 Jun 1 Jul 8 Jul 15 Jul 22 Jul # dollar spot foci 18ft Bayer Program 1... pgm z 14-d 30.2 u a-d t 62.3 cd 29.3 cd 6.2 de 2.0 fg 3.8 fg 4.6 fg 17.1 def Bayer Program 2... pgm y 21-d 36.3 a-d 48.5 de 37.4 bcd 6.2 de 31.9 bc 6.6 ef 29.0 d 51.3 c Rotational Program 1... pgm x 14-d 74.6 a 94.3 ab 74.6 a 28.1 abc 8.4 de 8.1 def 15.9 de 51.0 c Rotational Program 2... pgm w 21-d 69.2 ab 86.3 abc 73.0 a 31.6 abc 60.8 ab 77.9 ab 97.2 b b Lexicon Intrinsic fl.oz. 14-d 0.0 g 0.3 g 0.0 g 0.0 g 0.0 h 0.0 h 0.0 h 0.0 g + Signature XTRA oz. Briskway fl.oz. 14-d 4.0 e 15.8 fg 2.4 fg 0.4 g 10.9 de 33.4 bc 29.7 d 66.9 c + Signature XTRA oz. Exteris Stressgard fl.oz. 14-d 0.3 g 1.8 g 1.5 fg 0.2 g 0.2 gh 0.4 h 0.0 h 0.0 g + Signature XTRA oz. Secure fl.oz. 14-d 0.2 g 2.3 g 0.5 g 0.2 g 0.7 gh 1.1 gh 0.0 h 15.1 ef + Signature XTRA oz. Tourney oz. 14-d 2.4 ef 9.0 g 0.6 g 0.0 g 0.7 gh 3.0 fg 3.1 fgh 14.7 ef Tourney oz. 14-d 21.2 cd 40.5 def 25.5 cd 6.3 de 7.3 de 18.8 cd 29.3 d 67.4 c Tourney oz. 14-d 3.7 e 21.3 efg 8.8 ef 1.0 fg 0.7 gh 6.0 ef 1.4 gh 10.0 f + Pinpoint fl.oz. Pinpoint fl.oz. 14-d 34.3 a-d 52.0 d 44.3 bc 3.6 ef 12.7 cd 29.7 c 8.8 ef 29.7 d Pinpoint fl.oz. 14-d 19.3 d 46.0 de 26.0 cd 7.1 de 9.2 de 14.8 cde 7.8 efg 20.4 def Exteris Stressgard fl.oz. 14-d 0.0 g 1.8 g 0.0 g 0.0 g 0.6 gh 0.3 h 0.0 h 0.0 g Secure fl.oz. 14-d 0.6 fg 11.5 g 21.5 de 17.3 cd 3.7 ef 17.9 cd 5.8 fg 27.0 de Daconil Weather Stik fl.oz. 14-d 44.5 a-d 99.8 a 57.9 ab 59.0 ab a a a a Daconil Action fl.oz. 14-d 28.0 bcd 66.3 bcd 39.9 bcd 22.6 bc 66.0 ab 88.2 a 57.3 c b Untreated abc 66.8 bcd 74.4 a 68.1 a a a ab b ANOVA: Treatment (P > F) Days after treatment 14-d 8 s 14 r d z Treatments in Bayer Program 1 were applied as follows. 12 May: Tartan Stressgard (1.5 fl.oz.), 10 June: Mirage (1.5 fl.oz.), 23 June: Fiata Stressgard (5.0 fl.oz.) + Exteris Stressgard (4.0 fl.oz), 7 July: Mirage (1.0 fl.oz), 21 July: Fiata Stressgard (5.0 fl.oz.) + Exteris Stressgard (4.0 fl.oz) + Daconil Ultrex (3.2 oz.), 4 August: Interface (3.0 fl.oz), 18 Aug: Fiata Stressgard (5.0 fl.oz.) + Exteris Stressgard (4.0 fl.oz), 2 September: Mirage (1.0 fl.oz) + 26GT (2.0 fl.oz). All rates are per 1000ft 2. y Treatments in Bayer Program 2 were applied as follows. 12 May: Tartan Stressgard (1.5 fl.oz.), 10 June: Mirage (1.5 fl.oz) + Fiata Stressgard (5.0 fl.oz.), 30 June: Fiata Stressgard (5.0 fl.oz.) + Exteris Stressgard (4.0 fl.oz), 21 July: Mirage (1.5 fl.oz) + Fiata Stressgard (5.0 fl.oz.), 11 August: Fiata Stressgard (5.0 fl.oz.), 2 September: Mirage (1.5 fl.oz) + Fiata Stressgard (5.0 fl.oz.) + 26GT (2.0 fl.oz). All rates are per 1000ft 2. x Treatments in Rotational Program 1 were applied as follows: 10 June: Mirage (1.5 fl.oz.), 23 June: Fiata Stressgard (5.0 fl.oz.) + Exteris Stressgard (4.0 fl.oz), 7 July: Mirage (1.0 fl.oz), 21 July: Fiata Stressgard (5.0 fl.oz.) + Exteris Stressgard (4.0 fl.oz) + Daconil Ultrex (3.2 oz.), 4 August: Interface (3.0 fl.oz), 18 Aug: Fiata Stressgard (5.0 fl.oz.) + Exteris Stressgard (4.0 fl.oz), 2 September: Mirage (1.0 fl.oz) + 26GT (2.0 fl.oz). All rates are per 1000ft 2. w Treatments in Rotational Program 2 were applied as follows. 10 June: Mirage (1.5 fl.oz) + Fiata Stressgard (5.0 fl.oz.), 30 June: Fiata Stressgard (5.0 fl.oz.) + Exteris Stressgard (4.0 fl.oz), 21 July: Mirage (1.5 fl.oz) + Fiata Stressgard (5.0 fl.oz.), 11 August: Fiata Stressgard (5.0 fl.oz.), 2 September: Mirage (1.5 fl.oz) + Fiata Stressgard (5.0 fl.oz.) + 26GT (2.0 fl.oz). All rates are per 1000ft 2. v Except for Pinpoint, which did not receive its first application until 10 June, treatments other than the rotational programs described above were initiated on 26 May, prior to disease development in the trial area. Treatments were reapplied every 14-d. u Dollar spot data were log transformed for the following rating dates: 3 June, 24 June, 1 July, 8 July and 28 July. Dollar spot data were square-root transformed for the following rating dates: 17 June, 15 July, 22 July, 5 August, 11 August, 19 August, 26 August, 9 September, and 16 September. t Treatment means followed by the same letter, within each column, are not significantly different based on Fisher s protected least significant difference test (α = 0.05). s Bayer Programs 1-2 were last treated on 12 May, 22 days before this rating date. Rotational programs 1-2 did not yet receive an initial application as of this rating date. r Bayer Programs 1-2 were last treated on 12 May, 28 days before this rating date. Rotational programs 1-2 did not yet receive an initial application as of this rating date. 38 Table of Contents
49 Table 1b. Effect of various fungicides on dollar spot incidence in a creeping bentgrass putting green at the Plant Science Research and Education Facility in Storrs, CT during Dollar Spot Incidence Treatment Rate per 1000ft 2 Int v 28 Jul 5 Aug 11 Aug 19 Aug 26 Aug 9 Sep 16 Sep # dollar spot foci 18ft Bayer Program 1... pgm z 14-d 0.3 u g t 13.4 gh 47.0 de 58.8 e 35.2 fgh 13.2 fg 7.4 efg Bayer Program 2... pgm y 21-d 15.5 de 63.0 de c 98.1 d 67.9 d 35.8 de 12.6 def Rotational Program 1... pgm x 14-d 9.4 ef 24.7 fg 57.2 d 53.5 ef 40.9 ef 21.6 ef 12.1 def Rotational Program 2... pgm w 21-d 53.7 bc bc b c 87.2 d 53.2 cd 21.8 d Lexicon Intrinsic fl.oz. 14-d 0.0 g 0.0 i 0.0 h 0.0 i 0.0 j 0.0 h 1.7 g + Signature XTRA oz. Briskway fl.oz. 14-d 51.4 bc 97.8 cd b bc c 78.1 c 45.3 c + Signature XTRA oz. Exteris Stressgard fl.oz. 14-d 0.0 g 0.0 i 0.0 h 0.0 i 0.0 j 0.0 h 3.2 fg + Signature XTRA oz. Secure fl.oz. 14-d 0.4 g 0.6 i 0.5 h 15.0 h 11.7 i 0.4 h 4.0 fg + Signature XTRA oz. Tourney oz. 14-d 5.2 f 14.2 gh 19.6 fg 28.4 gh 18.3 hi 17.7 ef 8.2 d-g Tourney oz. 14-d 39.9 cd 51.0 ef 90.5 c 96.3 d 59.3 de 42.9 d 16.3 de Tourney oz. 14-d 1.0 g 5.8 hi 11.4 g 22.5 gh 14.4 i 1.3 h 5.4 efg + Pinpoint fl.oz. Pinpoint fl.oz. 14-d 5.3 f 25.4 fg 34.7 ef 50.9 ef 37.0 efg 5.3 gh 1.5 g Pinpoint fl.oz. 14-d 4.7 f 22.2 g 33.6 ef 35.8 fg 19.0 hi 4.2 gh 4.9 efg Exteris Stressgard fl.oz. 14-d 0.2 g 0.2 i 0.2 h 0.4 i 0.2 j 0.2 h 5.5 efg Secure fl.oz. 14-d 13.0 ef 11.8 gh 9.0 g 30.7 g 21.1 ghi 2.8 h 4.2 fg Daconil Weather Stik fl.oz. 14-d a a a a a a a Daconil Action fl.oz. 14-d 87.3 abc bc b b b b b Untreated ab abc a b b b b ANOVA: Treatment (P > F) Days after treatment 14-d d z Treatments in Bayer Program 1 were applied as follows. 12 May: Tartan Stressgard (1.5 fl.oz.), 10 June: Mirage (1.5 fl.oz.), 23 June: Fiata Stressgard (5.0 fl.oz.) + Exteris Stressgard (4.0 fl.oz), 7 July: Mirage (1.0 fl.oz), 21 July: Fiata Stressgard (5.0 fl.oz.) + Exteris Stressgard (4.0 fl.oz) + Daconil Ultrex (3.2 oz.), 4 August: Interface (3.0 fl.oz), 18 Aug: Fiata Stressgard (5.0 fl.oz.) + Exteris Stressgard (4.0 fl.oz), 2 September: Mirage (1.0 fl.oz) + 26GT (2.0 fl.oz). All rates are per 1000ft 2. y Treatments in Bayer Program 2 were applied as follows. 12 May: Tartan Stressgard (1.5 fl.oz.), 10 June: Mirage (1.5 fl.oz) + Fiata Stressgard (5.0 fl.oz.), 30 June: Fiata Stressgard (5.0 fl.oz.) + Exteris Stressgard (4.0 fl.oz), 21 July: Mirage (1.5 fl.oz) + Fiata Stressgard (5.0 fl.oz.), 11 August: Fiata Stressgard (5.0 fl.oz.), 2 September: Mirage (1.5 fl.oz) + Fiata Stressgard (5.0 fl.oz.) + 26GT (2.0 fl.oz). All rates are per 1000ft 2. x Treatments in Rotational Program 1 were applied as follows: 10 June: Mirage (1.5 fl.oz.), 23 June: Fiata Stressgard (5.0 fl.oz.) + Exteris Stressgard (4.0 fl.oz), 7 July: Mirage (1.0 fl.oz), 21 July: Fiata Stressgard (5.0 fl.oz.) + Exteris Stressgard (4.0 fl.oz) + Daconil Ultrex (3.2 oz.), 4 August: Interface (3.0 fl.oz), 18 Aug: Fiata Stressgard (5.0 fl.oz.) + Exteris Stressgard (4.0 fl.oz), 2 September: Mirage (1.0 fl.oz) + 26GT (2.0 fl.oz). All rates are per 1000ft 2. w Treatments in Rotational Program 2 were applied as follows. 10 June: Mirage (1.5 fl.oz) + Fiata Stressgard (5.0 fl.oz.), 30 June: Fiata Stressgard (5.0 fl.oz.) + Exteris Stressgard (4.0 fl.oz), 21 July: Mirage (1.5 fl.oz) + Fiata Stressgard (5.0 fl.oz.), 11 August: Fiata Stressgard (5.0 fl.oz.), 2 September: Mirage (1.5 fl.oz) + Fiata Stressgard (5.0 fl.oz.) + 26GT (2.0 fl.oz). All rates are per 1000ft 2. v Except for Pinpoint, which did not receive its first application until 10 June, treatments other than the rotational programs described above were initiated on 26 May, prior to disease development in the trial area. Treatments were reapplied every 14-d. u Dollar spot data were log transformed for the following rating dates: 3 June, 24 June, 1 July, 8 July and 28 July. Dollar spot data were square-root transformed for the following rating dates: 17 June, 15 July, 22 July, 5 August, 11 August, 19 August, 26 August, 9 September, and 16 September. t Treatment means followed by the same letter, within each column, are not significantly different based on Fisher s protected least significant difference test (α = 0.05). 39 Table of Contents
50 Table 2. Effect of various fungicides program on brown patch incidence in a creeping bentgrass putting green at the Plant Science Research and Education Facility in Storrs, CT during Brown Patch Severity Treatment Rate per 1000ft 2 Int v 28 Jul 1 Aug % plot area blighted Bayer Program 1... pgm z 14-d 0.0 b u 0.0 d Bayer Program 2... pgm y 21-d 0.0 b 0.0 d Rotational Program 1... pgm x 14-d 0.0 b 0.0 d Rotational Program 2... pgm w 21-d 0.0 b 0.0 d Lexicon Intrinsic fl.oz. 14-d 0.0 b 0.0 d + Signature XTRA oz. Briskway fl.oz. 14-d 0.0 b 0.0 d + Signature XTRA oz. Exteris Stressgard fl.oz. 14-d 0.0 b 0.0 d + Signature XTRA oz. Secure fl.oz. 14-d 0.0 b 3.7 c + Signature XTRA oz. Tourney oz. 14-d 0.0 b 0.0 d Tourney oz. 14-d 0.0 b 0.0 d Tourney oz. 14-d 1.5 b 0.0 d + Pinpoint fl.oz. Pinpoint fl.oz. 14-d 0.8 b 6.8 bc Pinpoint fl.oz. 14-d 1.8 b 5.6 bc Exteris Stressgard fl.oz. 14-d 0.0 b 0.0 d Secure fl.oz. 14-d 0.0 b 15.6 ab Daconil Weather Stik fl.oz. 14-d 0.8 b 2.0 cd Daconil Action fl.oz. 14-d 0.0 b 2.8 cd Untreated a 21.4 a ANOVA: Treatment (P > F) Days after treatment 14-d d 7 11 z Treatments in Bayer Program 1 were applied as follows. 12 May: Tartan Stressgard (1.5 fl.oz.), 10 June: Mirage (1.5 fl.oz.), 23 June: Fiata Stressgard (5.0 fl.oz.) + Exteris Stressgard (4.0 fl.oz), 7 July: Mirage (1.0 fl.oz), 21 July: Fiata Stressgard (5.0 fl.oz.) + Exteris Stressgard (4.0 fl.oz) + Daconil Ultrex (3.2 oz.), 4 August: Interface (3.0 fl.oz), 18 Aug: Fiata Stressgard (5.0 fl.oz.) + Exteris Stressgard (4.0 fl.oz), 2 September: Mirage (1.0 fl.oz) + 26GT (2.0 fl.oz). All rates are per 1000ft 2. y Treatments in Bayer Program 2 were applied as follows. 12 May: Tartan Stressgard (1.5 fl.oz.), 10 June: Mirage (1.5 fl.oz) + Fiata Stressgard (5.0 fl.oz.), 30 June: Fiata Stressgard (5.0 fl.oz.) + Exteris Stressgard (4.0 fl.oz), 21 July: Mirage (1.5 fl.oz) + Fiata Stressgard (5.0 fl.oz.), 11 August: Fiata Stressgard (5.0 fl.oz.), 2 September: Mirage (1.5 fl.oz) + Fiata Stressgard (5.0 fl.oz.) + 26GT (2.0 fl.oz). All rates are per 1000ft 2. x Treatments in Rotational Program 1 were applied as follows: 10 June: Mirage (1.5 fl.oz.), 23 June: Fiata Stressgard (5.0 fl.oz.) + Exteris Stressgard (4.0 fl.oz), 7 July: Mirage (1.0 fl.oz), 21 July: Fiata Stressgard (5.0 fl.oz.) + Exteris Stressgard (4.0 fl.oz) + Daconil Ultrex (3.2 oz.), 4 August: Interface (3.0 fl.oz), 18 Aug: Fiata Stressgard (5.0 fl.oz.) + Exteris Stressgard (4.0 fl.oz), 2 September: Mirage (1.0 fl.oz) + 26GT (2.0 fl.oz). All rates are per 1000ft 2. w Treatments in Rotational Program 2 were applied as follows. 10 June: Mirage (1.5 fl.oz) + Fiata Stressgard (5.0 fl.oz.), 30 June: Fiata Stressgard (5.0 fl.oz.) + Exteris Stressgard (4.0 fl.oz), 21 July: Mirage (1.5 fl.oz) + Fiata Stressgard (5.0 fl.oz.), 11 August: Fiata Stressgard (5.0 fl.oz.), 2 September: Mirage (1.5 fl.oz) + Fiata Stressgard (5.0 fl.oz.) + 26GT (2.0 fl.oz). All rates are per 1000ft 2. v Except for Pinpoint, which did not receive its first application until 10 June, treatments other than the rotational programs described above were initiated on 26 May, prior to disease development in the trial area. Treatments were reapplied every 14-d. u Treatment means followed by the same letter, within each column, are not significantly different based on Fisher s protected least significant difference test (α = 0.05). 40 Table of Contents
51 Table 3a. Effect of various rotational fungicide programs on turf quality in a creeping bent grass putting green at the Plant Science Research and Education Facility in Storrs, CT during Turf Quality Treatment Rate per 1000ft 2 Int v 3 Jun 17 Jun 24 Jun 1 Jul 8 Jul 15 Jul 28 Jul ; 6=min acceptable Bayer Program 1... pgm z 14-d 4.8 ef u 5.5 bc 7.0 cd 7.5 cd 7.8 bcd 7.8 bc 8.3 ab Bayer Program 2... pgm y 21-d 4.5 fg 5.5 bc 6.8 cde 5.8 f 7.0 def 5.5 ef 7.3 bc Rotational Program 1... pgm x 14-d 4.8 ef 4.0 d 5.5 fgh 6.3 ef 6.5 fgh 6.5 de 7.3 bc Rotational Program 2... pgm w 21-d 3.5 g 4.5 cd 5.0 h 4.8 g 4.3 k 3.3 g 4.3 de Lexicon Intrinsic fl.oz. 14-d 7.5 a 8.5 a 9.0 a 8.8 a 9.0 a 8.8 ab 8.8 a + Signature XTRA oz. Briskway fl.oz. 14-d 6.3 bc 8.0 a 9.0 a 6.3 ef 5.3 ij 5.0 f 4.8 d + Signature XTRA oz. Exteris Stressgard fl.oz. 14-d 7.3 ab 7.8 a 8.5 ab 8.5 ab 8.5 ab 9.0 a 9.0 a + Signature XTRA oz. Secure fl.oz. 14-d 7.3 ab 8.3 a 8.8 a 8.3 abc 8.0 bc 8.8 ab 9.0 a + Signature XTRA oz. Tourney oz. 14-d 5.8 cde 6.3 b 6.8 cde 6.8 de 6.8 efg 7.3 cd 7.0 c Tourney oz. 14-d 4.5 fg 5.3 bc 6.3 d-g 6.0 ef 6.0 ghi 5.5 ef 5.0 d Tourney oz. 14-d 5.8 cde 6.3 b 7.5 bc 6.8 de 6.5 fgh 7.5 cd 8.3 ab + Pinpoint fl.oz. Pinpoint fl.oz. 14-d 4.8 ef 5.0 cd 6.5 c-f 5.8 f 5.0 jk 7.0 cd 6.8 c Pinpoint fl.oz. 14-d 5.0 def 5.3 bc 6.3 d-g 6.0 ef 6.0 ghi 7.0 cd 6.8 c Exteris Stressgard fl.oz. 14-d 6.5 abc 7.8 a 8.5 ab 7.8 bc 7.5 cde 8.8 ab 8.5 a Secure fl.oz. 14-d 6.0 cd 5.5 bc 5.8 e-h 6.0 ef 5.8 hij 7.0 cd 7.0 c Daconil Weather Stik fl.oz. 14-d 4.8 ef 4.8 cd 4.8 hi 4.3 g 3.0 l 3.0 g 2.3 f Daconil Action fl.oz. 14-d 4.8 ef 5.5 bc 5.3 gh 4.8 g 4.3 k 4.5 f 3.3 ef Untreated fg 4.0 d 3.8 i 4.0 g 3.3 l 3.3 g 2.5 f ANOVA: Treatment (P > F) Days after treatment 14-d 8 t d z Treatments in Bayer Program 1 were applied as follows. 12 May: Tartan Stressgard (1.5 fl.oz.), 10 June: Mirage (1.5 fl.oz.), 23 June: Fiata Stressgard (5.0 fl.oz.) + Exteris Stressgard (4.0 fl.oz), 7 July: Mirage (1.0 fl.oz), 21 July: Fiata Stressgard (5.0 fl.oz.) + Exteris Stressgard (4.0 fl.oz) + Daconil Ultrex (3.2 oz.), 4 August: Interface (3.0 fl.oz), 18 Aug: Fiata Stressgard (5.0 fl.oz.) + Exteris Stressgard (4.0 fl.oz), 2 September: Mirage (1.0 fl.oz) + 26GT (2.0 fl.oz). All rates are per 1000ft 2. y Treatments in Bayer Program 2 were applied as follows. 12 May: Tartan Stressgard (1.5 fl.oz.), 10 June: Mirage (1.5 fl.oz) + Fiata Stressgard (5.0 fl.oz.), 30 June: Fiata Stressgard (5.0 fl.oz.) + Exteris Stressgard (4.0 fl.oz), 21 July: Mirage (1.5 fl.oz) + Fiata Stressgard (5.0 fl.oz.), 11 August: Fiata Stressgard (5.0 fl.oz.), 2 September: Mirage (1.5 fl.oz) + Fiata Stressgard (5.0 fl.oz.) + 26GT (2.0 fl.oz). All rates are per 1000ft 2. x Treatments in Rotational Program 1 were applied as follows: 10 June: Mirage (1.5 fl.oz.), 23 June: Fiata Stressgard (5.0 fl.oz.) + Exteris Stressgard (4.0 fl.oz), 7 July: Mirage (1.0 fl.oz), 21 July: Fiata Stressgard (5.0 fl.oz.) + Exteris Stressgard (4.0 fl.oz) + Daconil Ultrex (3.2 oz.), 4 August: Interface (3.0 fl.oz), 18 Aug: Fiata Stressgard (5.0 fl.oz.) + Exteris Stressgard (4.0 fl.oz), 2 September: Mirage (1.0 fl.oz) + 26GT (2.0 fl.oz). All rates are per 1000ft 2. w Treatments in Rotational Program 2 were applied as follows. 10 June: Mirage (1.5 fl.oz) + Fiata Stressgard (5.0 fl.oz.), 30 June: Fiata Stressgard (5.0 fl.oz.) + Exteris Stressgard (4.0 fl.oz), 21 July: Mirage (1.5 fl.oz) + Fiata Stressgard (5.0 fl.oz.), 11 August: Fiata Stressgard (5.0 fl.oz.), 2 September: Mirage (1.5 fl.oz) + Fiata Stressgard (5.0 fl.oz.) + 26GT (2.0 fl.oz). All rates are per 1000ft 2. v Except for Pinpoint, which did not receive its first application until 10 June, treatments other than the rotational programs described above were initiated on 26 May, prior to disease development in the trial area. Treatments were reapplied every 14-d. u Treatment means followed by the same letter, within each column, are not significantly different based on Fisher s protected least significant difference test (α = 0.05). t Bayer Programs 1-2 were last treated on 12 May, 22 days before this rating date. Rotational programs 1-2 did not yet receive an initial application as of this rating date. 41 Table of Contents
52 Table 3b. Effect of various fungicides on turf quality in a creeping bentgrass putting green at the Plant Science Research and Education Facility in Storrs, CT during Turf Quality Treatment Rate per 1000ft 2 Int v 11 Aug 19 Aug 26 Aug 9 Sep 16 Sep ; 6=min acceptable Bayer Program 1... pgm z 14-d 5.7 cd u 5.0 ef 5.5 de 6.5 b-e 7.5 bc Bayer Program 2... pgm y 21-d 4.4 de 4.3 fg 4.8 ef 5.3 e-f 6.8 cd Rotational Program 1... pgm x 14-d 5.9 c 5.0 ef 5.5 de 6.0 c-f 7.5 bc Rotational Program 2... pgm w 21-d 3.7 ef 3.5 ghi 4.8 ef 5.5 def 5.8 ef Lexicon Intrinsic fl.oz. 14-d 8.7 a 8.8 a 8.3 ab 7.3 abc 8.3 ab + Signature XTRA oz. Briskway fl.oz. 14-d 3.7 ef 3.3 hi 4.0 f 4.8 f 5.0 f + Signature XTRA oz. Exteris Stressgard fl.oz. 14-d 9.0 a 9.0 a 8.8 a 8.5 a 8.3 ab + Signature XTRA oz. Secure fl.oz. 14-d 7.7 ab 7.3 b 7.3 bc 8.0 ab 8.0 ab + Signature XTRA oz. Tourney oz. 14-d 6.5 bc 5.8 cde 7.0 c 6.3 c-f 7.5 bc Tourney oz. 14-d 4.5 de 3.8 gh 4.8 ef 5.3 ef 6.3 de Tourney oz. 14-d 7.7 ab 6.5 bc 7.0 c 7.0 a-d 7.8 b + Pinpoint fl.oz. Pinpoint fl.oz. 14-d 6.5 bc 5.3 de 5.5 de 7.3 abc 8.8 a Pinpoint fl.oz. 14-d 6.2 c 5.8 cde 6.5 cd 7.0 a-d 7.8 b Exteris Stressgard fl.oz. 14-d 8.5 a 8.5 a 8.5 a 8.5 a 8.0 ab Secure fl.oz. 14-d 6.5 bc 6.0 cd 6.8 c 7.0 a-d 8.0 ab Daconil Weather Stik fl.oz. 14-d 2.2 g 1.8 k 1.8 g 2.0 g 2.8 g Daconil Action fl.oz. 14-d 2.7 fg 2.8 ij 2.5 g 2.5 g 3.5 g Untreated fg 2.0 jk 2.0 g 1.8 g 3.3 g ANOVA: Treatment (P > F) Days after treatment 14-d d z Treatments in Bayer Program 1 were applied as follows. 12 May: Tartan Stressgard (1.5 fl.oz.), 10 June: Mirage (1.5 fl.oz.), 23 June: Fiata Stressgard (5.0 fl.oz.) + Exteris Stressgard (4.0 fl.oz), 7 July: Mirage (1.0 fl.oz), 21 July: Fiata Stressgard (5.0 fl.oz.) + Exteris Stressgard (4.0 fl.oz) + Daconil Ultrex (3.2 oz.), 4 August: Interface (3.0 fl.oz), 18 Aug: Fiata Stressgard (5.0 fl.oz.) + Exteris Stressgard (4.0 fl.oz), 2 September: Mirage (1.0 fl.oz) + 26GT (2.0 fl.oz). All rates are per 1000ft 2. y Treatments in Bayer Program 2 were applied as follows. 12 May: Tartan Stressgard (1.5 fl.oz.), 10 June: Mirage (1.5 fl.oz) + Fiata Stressgard (5.0 fl.oz.), 30 June: Fiata Stressgard (5.0 fl.oz.) + Exteris Stressgard (4.0 fl.oz), 21 July: Mirage (1.5 fl.oz) + Fiata Stressgard (5.0 fl.oz.), 11 August: Fiata Stressgard (5.0 fl.oz.), 2 September: Mirage (1.5 fl.oz) + Fiata Stressgard (5.0 fl.oz.) + 26GT (2.0 fl.oz). All rates are per 1000ft 2. x Treatments in Rotational Program 1 were applied as follows: 10 June: Mirage (1.5 fl.oz.), 23 June: Fiata Stressgard (5.0 fl.oz.) + Exteris Stressgard (4.0 fl.oz), 7 July: Mirage (1.0 fl.oz), 21 July: Fiata Stressgard (5.0 fl.oz.) + Exteris Stressgard (4.0 fl.oz) + Daconil Ultrex (3.2 oz.), 4 August: Interface (3.0 fl.oz), 18 Aug: Fiata Stressgard (5.0 fl.oz.) + Exteris Stressgard (4.0 fl.oz), 2 September: Mirage (1.0 fl.oz) + 26GT (2.0 fl.oz). All rates are per 1000ft 2. w Treatments in Rotational Program 2 were applied as follows. 10 June: Mirage (1.5 fl.oz) + Fiata Stressgard (5.0 fl.oz.), 30 June: Fiata Stressgard (5.0 fl.oz.) + Exteris Stressgard (4.0 fl.oz), 21 July: Mirage (1.5 fl.oz) + Fiata Stressgard (5.0 fl.oz.), 11 August: Fiata Stressgard (5.0 fl.oz.), 2 September: Mirage (1.5 fl.oz) + Fiata Stressgard (5.0 fl.oz.) + 26GT (2.0 fl.oz). All rates are per 1000ft 2. v Except for Pinpoint, which did not receive its first application until 10 June, treatments other than the rotational programs described above were initiated on 26 May, prior to disease development in the trial area. Treatments were reapplied every 14-d. u Treatment means followed by the same letter, within each column, are not significantly different based on Fisher s protected least significant difference test (α = 0.05). 42 Table of Contents
53 Table 4. Effect of various fungicides on phytotoxicity in a creeping bentgrass putting green at the Plant Science Research and Education Facility in Storrs, CT during Phytotoxicity Treatment Rate per 1000ft 2 Int v 3 Jun 24 Jun 1 Jul 8 Jul ; 2=max acceptable Bayer Program 1... pgm z 14-d Bayer Program 2... pgm y 21-d Rotational Program 1... pgm x 14-d Rotational Program 2... pgm w 21-d Lexicon Intrinsic fl.oz. 14-d Signature XTRA oz. Briskway fl.oz. 14-d Signature XTRA oz. Exteris Stressgard fl.oz. 14-d Signature XTRA oz. Secure fl.oz. 14-d Signature XTRA oz. Tourney oz. 14-d Tourney oz. 14-d Tourney oz. 14-d Pinpoint fl.oz. Pinpoint fl.oz. 14-d Pinpoint fl.oz. 14-d Exteris Stressgard fl.oz. 14-d Secure fl.oz. 14-d Daconil Weather Stik fl.oz. 14-d Daconil Action fl.oz. 14-d Untreated ANOVA: Treatment (P > F) Days after treatment 14-d 8 t d z Treatments in Bayer Program 1 were applied as follows. 12 May: Tartan Stressgard (1.5 fl.oz.), 10 June: Mirage (1.5 fl.oz.), 23 June: Fiata Stressgard (5.0 fl.oz.) + Exteris Stressgard (4.0 fl.oz), 7 July: Mirage (1.0 fl.oz), 21 July: Fiata Stressgard (5.0 fl.oz.) + Exteris Stressgard (4.0 fl.oz) + Daconil Ultrex (3.2 oz.), 4 August: Interface (3.0 fl.oz), 18 Aug: Fiata Stressgard (5.0 fl.oz.) + Exteris Stressgard (4.0 fl.oz), 2 September: Mirage (1.0 fl.oz) + 26GT (2.0 fl.oz). All rates are per 1000ft 2. y Treatments in Bayer Program 2 were applied as follows. 12 May: Tartan Stressgard (1.5 fl.oz.), 10 June: Mirage (1.5 fl.oz) + Fiata Stressgard (5.0 fl.oz.), 30 June: Fiata Stressgard (5.0 fl.oz.) + Exteris Stressgard (4.0 fl.oz), 21 July: Mirage (1.5 fl.oz) + Fiata Stressgard (5.0 fl.oz.), 11 August: Fiata Stressgard (5.0 fl.oz.), 2 September: Mirage (1.5 fl.oz) + Fiata Stressgard (5.0 fl.oz.) + 26GT (2.0 fl.oz). All rates are per 1000ft 2. x Treatments in Rotational Program 1 were applied as follows: 10 June: Mirage (1.5 fl.oz.), 23 June: Fiata Stressgard (5.0 fl.oz.) + Exteris Stressgard (4.0 fl.oz), 7 July: Mirage (1.0 fl.oz), 21 July: Fiata Stressgard (5.0 fl.oz.) + Exteris Stressgard (4.0 fl.oz) + Daconil Ultrex (3.2 oz.), 4 August: Interface (3.0 fl.oz), 18 Aug: Fiata Stressgard (5.0 fl.oz.) + Exteris Stressgard (4.0 fl.oz), 2 September: Mirage (1.0 fl.oz) + 26GT (2.0 fl.oz). All rates are per 1000ft 2. w Treatments in Rotational Program 2 were applied as follows. 10 June: Mirage (1.5 fl.oz) + Fiata Stressgard (5.0 fl.oz.), 30 June: Fiata Stressgard (5.0 fl.oz.) + Exteris Stressgard (4.0 fl.oz), 21 July: Mirage (1.5 fl.oz) + Fiata Stressgard (5.0 fl.oz.), 11 August: Fiata Stressgard (5.0 fl.oz.), 2 September: Mirage (1.5 fl.oz) + Fiata Stressgard (5.0 fl.oz.) + 26GT (2.0 fl.oz). All rates are per 1000ft 2. v Except for Pinpoint, which did not receive its first application until 10 June, treatments other than the rotational programs described above were initiated on 26 May, prior to disease development in the trial area. Treatments were reapplied every 14-d. u Treatment means followed by the same letter, within each column, are not significantly different based on Fisher s protected least significant difference test (α = 0.05). Bayer Programs 1-2 were last treated on 12 May, 22 days before this rating date. Rotational programs 1-2 did not yet receive an initial application as of this rating date. 43 Table of Contents
54 Table 5. Effect of various fungicides on normalized difference vegetative index in a creeping bentgrass putting green at the Plant Science Research and Education Facility in Storrs, CT during NDVI Treatment Rate per 1000ft 2 Int v 17 Jun 1 Jul 8 Jul 12 Aug Vegetation Index Bayer Program 1... pgm z 14-d def u bc a-d de Bayer Program 2... pgm y 21-d c-f abc a-d cd Rotational Program 1... pgm x 14-d cd abc abc abc Rotational Program 2... pgm w 21-d cde c cde bcd Lexicon Intrinsic fl.oz. 14-d a a a a-d + Signature XTRA oz. Briskway fl.oz. 14-d ab abc a-d bcd + Signature XTRA oz. Exteris Stressgard fl.oz. 14-d bcd ab ab a-d + Signature XTRA oz. Secure fl.oz. 14-d cde abc a abc + Signature XTRA oz. Tourney oz. 14-d def abc de a-d Tourney oz. 14-d f abc a-d cd Tourney oz. 14-d ef abc a-d a-d + Pinpoint fl.oz. Pinpoint fl.oz. 14-d cde c b-e a-d Pinpoint fl.oz. 14-d def abc a-d ab Exteris Stressgard fl.oz. 14-d cd abc a-d abc Secure fl.oz. 14-d abc abc abc a Daconil Weather Stik fl.oz. 14-d abc abc de a-d Daconil Action fl.oz. 14-d abc abc a-d bcd Untreated c-f d e e ANOVA: Treatment (P > F) Days after treatment 14-d d z Treatments in Bayer Program 1 were applied as follows. 12 May: Tartan Stressgard (1.5 fl.oz.), 10 June: Mirage (1.5 fl.oz.), 23 June: Fiata Stressgard (5.0 fl.oz.) + Exteris Stressgard (4.0 fl.oz), 7 July: Mirage (1.0 fl.oz), 21 July: Fiata Stressgard (5.0 fl.oz.) + Exteris Stressgard (4.0 fl.oz) + Daconil Ultrex (3.2 oz.), 4 August: Interface (3.0 fl.oz), 18 Aug: Fiata Stressgard (5.0 fl.oz.) + Exteris Stressgard (4.0 fl.oz), 2 September: Mirage (1.0 fl.oz) + 26GT (2.0 fl.oz). All rates are per 1000ft 2. y Treatments in Bayer Program 2 were applied as follows. 12 May: Tartan Stressgard (1.5 fl.oz.), 10 June: Mirage (1.5 fl.oz) + Fiata Stressgard (5.0 fl.oz.), 30 June: Fiata Stressgard (5.0 fl.oz.) + Exteris Stressgard (4.0 fl.oz), 21 July: Mirage (1.5 fl.oz) + Fiata Stressgard (5.0 fl.oz.), 11 August: Fiata Stressgard (5.0 fl.oz.), 2 September: Mirage (1.5 fl.oz) + Fiata Stressgard (5.0 fl.oz.) + 26GT (2.0 fl.oz). All rates are per 1000ft 2. x Treatments in Rotational Program 1 were applied as follows: 10 June: Mirage (1.5 fl.oz.), 23 June: Fiata Stressgard (5.0 fl.oz.) + Exteris Stressgard (4.0 fl.oz), 7 July: Mirage (1.0 fl.oz), 21 July: Fiata Stressgard (5.0 fl.oz.) + Exteris Stressgard (4.0 fl.oz) + Daconil Ultrex (3.2 oz.), 4 August: Interface (3.0 fl.oz), 18 Aug: Fiata Stressgard (5.0 fl.oz.) + Exteris Stressgard (4.0 fl.oz), 2 September: Mirage (1.0 fl.oz) + 26GT (2.0 fl.oz). All rates are per 1000ft 2. w Treatments in Rotational Program 2 were applied as follows. 10 June: Mirage (1.5 fl.oz) + Fiata Stressgard (5.0 fl.oz.), 30 June: Fiata Stressgard (5.0 fl.oz.) + Exteris Stressgard (4.0 fl.oz), 21 July: Mirage (1.5 fl.oz) + Fiata Stressgard (5.0 fl.oz.), 11 August: Fiata Stressgard (5.0 fl.oz.), 2 September: Mirage (1.5 fl.oz) + Fiata Stressgard (5.0 fl.oz.) + 26GT (2.0 fl.oz). All rates are per 1000ft 2. v Except for Pinpoint, which did not receive its first application until 10 June, treatments other than the rotational programs described above were initiated on 26 May, prior to disease development in the trial area. Treatments were reapplied every 14-d. u Treatment means followed by the same letter, within each column, are not significantly different based on Fisher s protected least significant difference test (α = 0.05). 44 Table of Contents
55 Table 6. Effect of various fungicides on Aeration Recovery in a creeping bent grass putting green at the Plant Science Research and Education Facility in Storrs, CT during Aeration Recovery Treatment Rate per 1000ft 2 Int v 9 Sept 16 Sept -1-9; 1=no recovery, 6=min acceptable- Bayer Program 1... pgm z 14-d 7.5 a u 7.8 ab Bayer Program 2... pgm y 21-d 5.3 bcd 7.8 ab Rotational Program 1... pgm x 14-d 6.5 ab 8.5 ab Rotational Program 2... pgm w 21-d 3.5 def 5.8 cd Lexicon Intrinsic fl.oz. 14-d 7.3 a 8.0 ab + Signature XTRA oz. Briskway fl.oz. 14-d 5.8 abc 7.3 bc + Signature XTRA oz. Exteris Stressgard fl.oz. 14-d 7.3 a 9.0 a + Signature XTRA oz. Secure fl.oz. 14-d 5.3 bcd 7.8 ab + Signature XTRA oz. Tourney oz. 14-d 6.0 abc 8.3 ab Tourney oz. 14-d 5.8 abc 8.0 ab Tourney oz. 14-d 6.5 ab 8.5 ab + Pinpoint fl.oz. Pinpoint fl.oz. 14-d 5.0 b-e 7.5 ab Pinpoint fl.oz. 14-d 5.0 b-e 7.3 bc Exteris Stressgard fl.oz. 14-d 6.8 ab 8.3 ab Secure fl.oz. 14-d 5.0 b-e 7.8 ab Daconil Weather Stik fl.oz. 14-d 4.5 cde 5.5 de Daconil Action fl.oz. 14-d 3.3 ef 5.5 de Untreated f 4.0 e ANOVA: Treatment (P > F) Days after treatment 14-d d 7 14 z Treatments in Bayer Program 1 were applied as follows. 12 May: Tartan Stressgard (1.5 fl.oz.), 10 June: Mirage (1.5 fl.oz.), 23 June: Fiata Stressgard (5.0 fl.oz.) + Exteris Stressgard (4.0 fl.oz), 7 July: Mirage (1.0 fl.oz), 21 July: Fiata Stressgard (5.0 fl.oz.) + Exteris Stressgard (4.0 fl.oz) + Daconil Ultrex (3.2 oz.), 4 August: Interface (3.0 fl.oz), 18 Aug: Fiata Stressgard (5.0 fl.oz.) + Exteris Stressgard (4.0 fl.oz), 2 September: Mirage (1.0 fl.oz) + 26GT (2.0 fl.oz). All rates are per 1000ft 2. y Treatments in Bayer Program 2 were applied as follows. 12 May: Tartan Stressgard (1.5 fl.oz.), 10 June: Mirage (1.5 fl.oz) + Fiata Stressgard (5.0 fl.oz.), 30 June: Fiata Stressgard (5.0 fl.oz.) + Exteris Stressgard (4.0 fl.oz), 21 July: Mirage (1.5 fl.oz) + Fiata Stressgard (5.0 fl.oz.), 11 August: Fiata Stressgard (5.0 fl.oz.), 2 September: Mirage (1.5 fl.oz) + Fiata Stressgard (5.0 fl.oz.) + 26GT (2.0 fl.oz). All rates are per 1000ft 2. x Treatments in Rotational Program 1 were applied as follows: 10 June: Mirage (1.5 fl.oz.), 23 June: Fiata Stressgard (5.0 fl.oz.) + Exteris Stressgard (4.0 fl.oz), 7 July: Mirage (1.0 fl.oz), 21 July: Fiata Stressgard (5.0 fl.oz.) + Exteris Stressgard (4.0 fl.oz) + Daconil Ultrex (3.2 oz.), 4 August: Interface (3.0 fl.oz), 18 Aug: Fiata Stressgard (5.0 fl.oz.) + Exteris Stressgard (4.0 fl.oz), 2 September: Mirage (1.0 fl.oz) + 26GT (2.0 fl.oz). All rates are per 1000ft 2. w Treatments in Rotational Program 2 were applied as follows. 10 June: Mirage (1.5 fl.oz) + Fiata Stressgard (5.0 fl.oz.), 30 June: Fiata Stressgard (5.0 fl.oz.) + Exteris Stressgard (4.0 fl.oz), 21 July: Mirage (1.5 fl.oz) + Fiata Stressgard (5.0 fl.oz.), 11 August: Fiata Stressgard (5.0 fl.oz.), 2 September: Mirage (1.5 fl.oz) + Fiata Stressgard (5.0 fl.oz.) + 26GT (2.0 fl.oz). All rates are per 1000ft 2. v Except for Pinpoint, which did not receive its first application until 10 June, treatments other than the rotational programs described above were initiated on 26 May, prior to disease development in the trial area. Treatments were reapplied every 14-d. The trial area was aerated using inch hollow-tines at 1.5 by 2.0 inch spacing on 30 August u Treatment means followed by the same letter, within each column, are not significantly different based on Fisher s protected least significant difference test (α = 0.05). 45 Table of Contents
56 INFLUENCE OF FIATA ON PHYTOSAFETY OF PLANT GROWTH REGULATORS ON CREEPING BENTGRASS PUTTING GREEN TURF, 2016 K. Miele, J. Dunnack, Z. Esponda, S. Vose, and J. Inguagiato Department of Plant Science and Landscape Architecture University of Connecticut, Storrs ONJECTIVE The objective of this study was to evaluate the phytosafety of various plant growth regulators applied with and without Fiata StressGard. MATERIALS & METHODS A field study was conducted on a Penn A-4 creeping bentgrass (Agrostis stolonifera) turf grown on a Paxton fine sandy loam at the Plant Science Research and Education Facility in Storrs, CT. Turf was mowed five days wk -1 at a bench setting of inch. Nitrogen was applied at a total of 2.0 lb N 1000-ft -2 as water soluble sources from April through September. Dylox 80 was applied on 27 May for control of white grubs. Quicksilver was applied on 6 August and 20 August for control of silvery-thread moss. Scimitar was applied on 27 August for control of cutworms. To help alleviate dry surface conditions, the wetting agent Dispatch was applied on 18 June and Revolution was applied on 23 July. For control of turf disease, Secure was applied on 4 June and 19 August, Prostar was applied on 18 June and 15 July, Curalan was applied on 18 June, 15 July, and 27 August, and Xzemplar was applied on 2 July. Overhead irrigation was applied as needed to prevent drought stress. Treatments consisted of various plant growth regulators applied with and without Fiata StressGard. Initial applications were made on 20 May and subsequent applications were made every 14-d or every 200 or 300 growing degree days as specified in tables. All treatments were applied using a hand held CO 2 powered spray boom outfitted with a single AI9508E flat fan nozzle calibrated to deliver 2 gal 1000-ft -2 at 40 psi. Plots measured 3 x 6 ft and were arranged in a randomized complete block design with four replications. Phytotoxicity was also assessed visually on a 0 to 5 scale, where 0 was equal to no discoloration and 2 represented the maximum acceptable level of injury. Turf quality was visually assessed on a 1 to 9 scale; where 9 represented the best possible quality turf and 6 was the minimum acceptable level. Normalized difference vegetative index (NDVI) was calculated as the mean of 10 subsamples taken randomly throughout the plot area (NDVI 500, Spectrum Technologies). Algae severity was visually assessed on a 0 to 5 scale, where 0 was equal to no surface algae and 2 represented the maximum acceptable level of algae colonization. All data were subjected to an analysis of variance and means were separated using Fisher s Protected Least Significant Difference Test. RESULTS AND DISCUSSION Phytotoxicity and Turf Quality Phytotoxic symptoms characteristic of PGR application were apparent shortly after the initiation of treatments (Table 1). Plots treated with Trimmit and Cutless were off color (bluegray in appearance) on 31 May (11 DAIT), and worsened in appearance through mid-june through mid-july, occasionally becoming unacceptable (>2.0) during this time. Plots treated with Primo Maxx exhibited less severe phytotoxic symptoms, and never reached unacceptable levels. The addition of Fiata StressGard to the above materials resulted in less phytotoxicity, particularly during the mid-june through mid-july timeframe mentioned above. Fiata tankmixes never reached unacceptable levels of phytotoxicity for the duration of the trial, and on 24 June, the addition of Fiata reduced phytotoxicty by 40% for Trimmit treated plots and 60% for Cutless treated plots. Turf quality (Table 2) was also influenced by the addition of Fiata, and quality was improved from unacceptable (<6.0) to acceptable levels for Cutless + Fiata treated plots vs. Cutless alone on 17 and 24 June. Except for the last observation date (26 August) there was no difference in turf quality for Trimmit + Fiata vs. Trimmit alone. While there was generally no difference between Primo Maxx treated plots that were applied on a 14-d or 200 GDD basis, 200 GDD plots exhibited no phytotoxicity on 17 June whereas the 14-d plots exhibited some, albeit acceptable, phytotoxicity. There was no difference in turf quality for Primo Maxx + Fiata vs. Primo Maxx applied alone except on 17 June. Except for a 6.5 rating on 10 June for Appear treated plots, turf quality was high (>7.8) and there was no phytotoxicty for the entirety of the trial for plots treated with either Fiata StressGard alone or Appear. Anuew-treated plots exhibited unacceptable levels of phytoxicity from 31 May through 24 June, however Anuew treatments were applied at 10x the label rate in this trial. Algae Intensity Algae deveoled in the trial area in late-june and early-july (Table 3). Algae was more intense on Trimmit + Fiata and Cutless + Fiata plots compared to either Trimmit or Cutless applied alone. No differences were observed between Primo treatments. 46 Table of Contents
57 Table 1. Phytosafety of PGRs with and without Fiata StressGard on a creeping bentgrass putting green at the Plant Science Research Facility in Storrs, CT during Phytotoxicity Treatment Rate per 1000ft 2 Int z 31 May 10 Jun 17 Jun 24 Jun 1 Jul 15 Jul 28 Jul 4 Aug 26 Aug ; 2=maximum acceptable Primo Maxx fl.oz. 14-d 0.0 c 0.0 d 1.1 cd 0.3 e 0.0 d 0.0 c Primo Maxx fl.oz. 14-d 0.0 c 0.0 d 0.0 f 0.3 e 0.0 d 0.0 c Fiata Stressgard fl.oz 14-d Trimmit 2SC fl.oz. 14-d 0.3 bc 1.0 c 1.9 bc 3.0 ab 1.5 ab 1.2 a Trimmit 2SC fl.oz. 14-d 0.3 bc 0.5 cd 0.4 def 1.8 c 0.4 cd 0.2 bc Fiata Stressgard fl.oz. 14-d Cutless MEC fl.oz. 14-d 0.5 b 1.8 b 2.7 ab 2.5 b 1.7 a 0.2 bc Cutless MEC fl.oz. 14-d 0.0 c 0.3 d 0.2 ef 1.0 d 0.2 d 0.0 c Fiata Stressgard fl.oz. 14-d Fiata Stressgard fl.oz. 14-d 0.0 c 0.0 d 0.0 f 0.0 e 0.0 d 0.0 c Appear fl.oz. 14-d 0.0 c 0.0 d 0.0 f 0.0 e 0.0 d 0.0 c Primo Maxx fl.oz. GDD200 y 0.0 c 0.5 cd 0.0 f 0.0 e 0.0 d 0.0 c Anuew oz. 14-d 3.0 a 3.5 a 3.7 a 3.5 a 0.9 bc 1.1 a Anuew oz. GDD300 x 3.0 a 2.0 b 3.7 a 1.5 cd 0.2 d 0.6 ab Untreated c 0.0 d 0.8 de 0.0 e 0.0 d 0.0 c ANOVA: Treatment (P > F) Days after treatment 14-d GDD GDD z Treatments were initiated on 20 May and reapplied on a 14-d basis. y Primo Maxx GDD200 was applied on 20 May, 1 June, 15 June, 28 Jun, 7 Jul, 20 Jul, 28 Jul, 8 Aug, 18 Aug, 31 Aug. x Anuew GDD300 was applied on 20 May, 7 June, 28 Jun, 13 Jul, 26 Jul, 11 Aug, 24 Aug. w Treatment means followed by the same letter, within each column, are not significantly different based on Fisher s protected least significant difference test (α = 0.05). 47 Table of Contents
58 Table 2. Turf Quality of PGRs with and without Fiata StressGard on a creeping bentgrass putting green at the Plant Science Research Facility in Storrs, CT during Turf Quality Treatment Rate per 1000ft 2 Int z 31 May 10 Jun 17 Jun 24 Jun 1 Jul 15 Jul 28 Jul 4 Aug 26 Aug ; 6 min acceptable Primo Maxx fl.oz. 14-d 6.5 cd cde 7.3 a-d 6.5 bcd 6.8 bc 7.5 bc 8.3 ab 7.8 cde Primo Maxx fl.oz. 14-d 7.3 abc ab 7.5 abc 6.8 bcd 7.8 ab 8.5 ab 8.5 a 8.3 bc + Fiata Stressgard fl.oz 14-d Trimmit 2SC fl.oz. 14-d 7.3 abc de 6.0 def 5.8 d 6.5 c 7.3 c 7.3 bcd 8.0 bcd Trimmit 2SC fl.oz. 14-d 6.8 bcd cde 6.3 cde 5.8 d 6.8 bc 7.3 c 7.5 a-d 9.0 a + Fiata Stressgard fl.oz. 14-d Cutless MEC fl.oz. 14-d 6.3 d e 5.3 ef 5.5 d 6.3 c 7.3 c 7.0 cd 7.3 efg Cutless MEC fl.oz. 14-d 7.5 ab bc 6.8 bcd 6.3 cd 8.0 a 8.0 abc 8.0 abc 8.5 ab + Fiata Stressgard fl.oz. 14-d Fiata Stressgard fl.oz. 14-d 7.8 a w a 8.3 a 7.8 ab 7.8 ab 8.5 ab 8.3 ab 8.0 bcd Appear fl.oz. 14-d 7.8 a a 8.0 ab 8.3 a 8.0 a 8.8 a 8.5 a 8.5 ab Primo Maxx fl.oz. GDD200 y 7.3 abc bcd 7.3 a-d 7.3 abc 7.8 ab 8.5 ab 8.3 ab 7.5 def Anuew oz. 14-d 5.0 e f 4.8 f 6.0 cd 6.3 c 7.3 c 5.8 e 7.0 fg Anuew oz. GDD300 x 5.0 e f 6.0 def 6.5 bcd 6.8 bc 7.3 c 6.5 de 6.8 gh Untreated abc cde 7.3 a-d 6.8 bcd 7.0 abc 7.8 abc 7.3 bcd 6.3 h ANOVA: Treatment (P > F) Days after treatment 14-d GDD GDD z Treatments were initiated on 20 May and reapplied on a 14-d basis. y Primo Maxx GDD200 was applied on 20 May, 1 June, 15 June, 28 Jun, 7 Jul, 20 Jul, 28 Jul, 8 Aug, 18 Aug, 31 Aug. x Anuew GDD300 was applied on 20 May, 7 June, 28 Jun, 13 Jul, 26 Jul, 11 Aug, 24 Aug. w Treatment means followed by the same letter, within each column, are not significantly different based on Fisher s protected least significant difference test (α = 0.05). 48 Table of Contents
59 Table 3. NDVI, Etiolation, and Algae Intensity affected by PGRs with and without Fiata StressGard on a creeping bentgrass putting green at the Plant Science Research Facility in Storrs, CT during NDVI Algae Intensity Treatment Rate per 1000ft 2 Int z 17 Jun 1 Jul 8 Jul 28 Jul 12 Aug 24 June 1 July Vegetation Index ; 2=max acceptable Primo Maxx fl.oz. 14-d cd 1.0 cd Primo Maxx fl.oz. 14-d bcd 1.5 cd + Fiata Stressgard fl.oz 14-d Trimmit 2SC fl.oz. 14-d d 1.5 cd Trimmit 2SC fl.oz. 14-d a 3.0 ab + Fiata Stressgard fl.oz. 14-d Cutless MEC fl.oz. 14-d bcd 2.0 bc Cutless MEC fl.oz. 14-d a 3.5 a + Fiata Stressgard fl.oz. 14-d Fiata Stressgard fl.oz. 14-d d 1.0 cd Appear fl.oz. 14-d d 1.3 cd Primo Maxx fl.oz. GDD200 y bcd 1.3 cd Anuew oz. 14-d b 2.0 bc Anuew oz. GDD300 x bc 1.8 cd Untreated cd 0.8 d ANOVA: Treatment (P > F) Days after treatment 14-d GDD GDD z Treatments were initiated on 20 May and reapplied on a 14-d basis. y Primo Maxx GDD200 was applied on 20 May, 1 June, 15 June, 28 Jun, 7 Jul, 20 Jul, 28 Jul, 8 Aug, 18 Aug, 31 Aug. x Anuew GDD300 was applied on 20 May, 7 June, 28 Jun, 13 Jul, 26 Jul, 11 Aug, 24 Aug. w Treatment means followed by the same letter, within each column, are not significantly different based on Fisher s protected least significant difference test (α = 0.05). 49 Table of Contents

60 DETERMINING DISLODGEABLE FOLIAR RESIDUE LEVELS FOLLOWING THE APPLICATION OF TWO PESTICIDES USED TO MANAGE SPORTS TURF, 2016 G.L. Maxey 1, J.J. Henderson 1, J.C. Inguagiato 1 1 Department of Plant Science and Landscape Architecture University of Connecticut INTRODUCTION The safety of pesticides usage on athletic fields is a complicated issue. Pesticide fate post application largely determines the potential for human exposure (Clark, 2007). This means playing on treated turf could be a risk of exposure if those compounds remain on the surface. Connecticut has banned all pesticides on school grounds from Kindergarten through 8 th grade due to that concern that children are exposed to pesticide residues (State of Connecticut, 2009). By law, the labels for these products have re-entry periods or some designated amount of time before it is safe to re-enter the turfgrass area that received the application. Once this time has expired, the labels deem the turfgrass can return to normal fuction. Little research has been conducted regarding human exposure of pesticide residues on sports fields the days following an application. Quantification of residues post application may help lawmakers with science-based information concerning future legislation of minimizing pesticide exposure. The objective of this project is to quantify foliar residues on playing surfaces following the application of two herbicides in two formulations sampled at post application time intervals of 0, 1, 3, 5, 7, 9 & 14 days after treatment. MATERIALS AND METHODS The research area was a three-year-old monostand of Granite, Kentucky bluegrass (Poa pratensis). No pesticides were applied on this stand of turfgrass within three months of conducting the study. The experiment utilized a split block design arranged in a 2 x 2 x 8 factorial with three replications (Figure 1). The first factor, product, included Trimec and Dimension. The second factor, formulation, included granular and liquid. The third factor was days after treatment (DAT), 0,1, 3, 5, 7, 9 and 14. The granular form of Trimec was Ferti-lome Weed Out Broadleaf killer. The granular form of Dimension was Lesco Dimension 0.10%; plus fertilizer (0-0-7). The liquid formulations were Trimec Classic and Dimension 2EW. The laboratory testing for Trimec products included all three active ingredients; MCPP, Dicamba and 2,4-Dichlorophenoxyacetic acid (2,4-D). Dimension was tested for the only active incredient; Dithiopyr (DIT). Each product was applied according to their respective labels. The only modification to the application rates was matching the active ingredient levels across formulations. In other words, this avoided liquid formulation of 2,4-D being applied at a higher rate of active ingredient than the granual formulation. Figure 1. Wetting surface before Granular 2,4-D application with flow gauge. Per label instructions, granular Trimec was applied after watering the surface (0.25 ) so the granules would adhear to the leaf surface. Both granular and liquid Dimension was watered in after application (0.50 ). The amount of water was calculated beforehand and measured with a flow gauge. (Figure 1.) Initial sampling took place a week before any chemicals were applied to the turf. The initial testing represented our untreated control. Once the pesticides were applied, the stand was no longer mowed, irrigated, or traveled through on foot. Day 0 sampling took place from 2pm to 5pm. Samples were collected immediately once a single product was applied to all three replications. Strenuous efforts were taken on Day 0 to prevent chemicals from drying before sampling. The remainder of samples for the subsequent days after treatment were taken at 5am to ensure morning dew was present on the foliage. This timing was chosen based on previous research that showed a spike at 5am in liquid applied 2,4-D residues that gradually declined throughout the day and days after treatment (Gannon and Jeffries, 2014). The climate conditions during sampling are shown in table Table of Contents

61 results of a significant rain event between the sampling Days 1 & 3. Interestingly, despite these rain events, the liquid formulation of Trimec had a slight increase in foliar residue on day 9 & 14. This suggests a potential relationship between the residues getting absorbed into, then re-suspending into the solution on the leaf blades. The granular form of Trimec, however, had significantly less residues detected for total amounts and days after treatment and no statistical differences among days after treatment. Dithiopyr in granular and liquid formulations had low residues initially and were both non-detects one day after treatment. The only statistically different sample of Dithiopyr was the liquid formulation directly after sampling (Day 0) shown in Figure 3. Four consecutive non-detectible samples were considered no longer necessary to continue analyzing residue levels in the lab. Figure 2. Cloth sample after being rolled. Dew moisture visible on cloth. A modified California roller was used for sampling. The roller weighed 32 lbs and was foam wrapped to help conform to small undulations on the surface of the ground (Williams et al., 2008). This device was rolled on top of a percale cotton cloth covered with a plastic sheet to prevent contamination between samples. These were held down by a frame that clamped the edges of the sheets (Figure 2) (Williams et al., 2008). Each sample that was taken was rolled twenty times; down and back counted as two separate passes. After being rolled, the sample was carefully removed from the harness and placed in an amber colored jar, then placed directly into a cooler. Samples were frozen immediately following collection to ensure no active ingredients were compromised. Extreme precaution was taken to prevent any cross contamination between samples. An analysis of variance was completed to test for significant differences (p <0.05) among treatments using SAS statistical software 9.4 (SAS Institute. Cary, NC. 2004). The Mixed procedure and Fisher s least significant difference (LSD) test was conducted to separate the means when the appropriate F-test values were below the p-value of Dithiopyr had a minimum detectable residue level of 1.95 ug/sample. Any residue present that fell below this threshold was non-detectible. 2,4-D had a minimum detectable residue level of 0.39 ug/sample. It should be noted this experiment examined the worst-case scenario of pesticide exposure by sampling during the morning with optimum dew formation. Additional research is needed to determine how the solubility of 2,4-D and Dicamba can lead to residues dislodging into solution multiple days and weeks after treatment. According to these data, Day 0 & 1 showed all four active ingredients tested in granular formulations had significantly reduced detectable residues compared to liquid formulations. This suggests that granular forms of Trimec and Dimension would be preferred over liquid formulations to minimize field closure times following the use of pesticides; however, this suggestion does not consider the efficacy of the products tested, which is an important component to sports turf maintenance. These results can help improve recommendations for minimizing potential exposure risks and help lawmakers make science-base decisions concerning future legislation. LITERATURE CITED Clark, J.M., R. Putnam, and J. Doherty Determining golf exposure and hazard to pesticides. Green Section Record. Mar.-Apr.: RESULTS AND DISCUSSION The average dislodgeable pesticide residues extracted from each treatment are summarized in Table 2. Significant main effects were observed across all three factors; active ingredient, formulation, and days after treatment (DAT). Significant interactions were also observed across all combinations of the three factors. The results of the mean separation test are shown in Figures 3 and 4. Liquid 2,4-D residues for Day 0 and Day 1 were statistically different as were the remaining days after treatment. Table 2 shows that Trimec, in liquid form, had the most detectible residues in total, and the most residue detected days after treatment. The sharp decline on Day 3 (Table 2) residues may have been a State of Connecitcut An act concerning pesticide applications at child day care centers and schools. R00SB PA.PDF (accessed 1 March. 2017). Gannon, T. W., and M. D. Jeffries Dislodgaeable 2,4-D from Athletic Field Turfgrass. European Journal of Horticultural Science 79: Williams, Ryan L., Craig E. Bernard, Melinda Bigelow Dyk, John H. Ross, and Robert I. Krieger Measurement of Transferable Chemical Residue from Nylon Carpet Using the California Roller and a New Mega-California Roller. Journal of Environmental Science and Health, Part B 43.8: Table of Contents
62 Table 1. Climate Conditions during experimental days after treatment a DAT b Time Precipitation RH Air Temp Dew Point AT-DP (mm) d (%) ( C) ( C) ( C) Initial 14: c 14: : : : : : : a Climate conditions pulled from nearest weather station, Gurleyville Green (Gurleyville, Mansfield, CT) b Abbreviations: DAT, days after treatment; RH, relative humidity. c DAT of 0 is directly after application d Precipitation is the total amount accumulated since the previous sampling day. Table 2. Average dislodgeable residues days after treatment in granular and liquid forms. Days After Treatment formulation a.i Initial ug/sample L 2,4-D ND G 2,4-D ND ND ND ND 0.5 L MCPP ND G MCPP ND 6.0 ND 1.52 ND ND ND ND L Dicamba ND ND ND G Dicamba ND ND ND ND ND ND L Dithiopyr ND 26.4 ND ND ND ND - e - G Dithiopyr ND 3.9 ND ND ND ND - - a Abbreviations: DAT, Days after treatment; G/L, Granular/Liquid; a.i, active ingredient; ND, Non-detect b Dithiopyr samples had a detection limit of 1.95 ug/sample. c 2,4-D and MCPP had a detection limit of 0.39 ug/sample. d Dicamba had a detection limit of 3.9 ug/sample. e Dashes - indicate no laboratory sampling took place because of four consecutive non-detects 52 Table of Contents
63 Figure 3 & 4. The effect of formulation and time on dislodgeable foliar residue levels of 2,4-D and Dithiopyr. Data points with the same letter are not statistically different according to Fisher s protected LSD (p<0.05). 53 Table of Contents

64 ORGANIC TURF AND NO-PESTICIDE TURF DEMONSTRATION FOR HOME LAWNS AND ATHLETIC FIELDS 2016 G.L. Maxey 1, J.J. Henderson 1, T.F. Morris 1, K. Guillard 1, J.C. Inguagiato 1, S.L. Rackliffe 1, and V.H. Wallace 2 1 Department of Plant Science and Landscape Architecture 2 Department of Extension University of Connecticut INTRODUCTION As of July 1, 2010, the state of Connecticut banned the use of all lawn care pesticides at public and private schools that service pre-k through 8th grades. This legislation has caused great concern for athletic field managers due to the nature of the traffic athletic fields endure and the liability associated with their use. However, very little research based information is available regarding managing athletic fields without the use of pesticides. This demonstration site was established to evaluate various systems of management. Each system that is evaluated represents a specific type of management regime. The Integrated Pest Management (IPM) system utilizes thresholds for management of pests. The calendar based system follows a step by step program based on application timing. The Integrated System Management (ISM) is based on best management practices and places applications based on the principle of prevention and least potentially harmful applications. The pesticide-free applications are based on current Connecticut law and were managed without pesticides but utilize synthetic fertilizers. The Organic system utilized only organic treatments. Pesticide-free Low, 5) Calendar Based, 6) IPM, 7) ISM, 8) None (mow only control). Each management system received applications of fertilizer, insect and weed control appropriate for each treatment. The athletic field received 4 lbs N 1000ft -2 to the listed treatments; Calendar, Organic High, Pesticide-free High, IPM, and ISM. Treatments Organic Low and Pesticide-free Low received 2 lbs N1000ft -2. The home lawn s Organic Low and Pesticide-free low received 1 lb N 1000ft -2, while the Calendar, Organic High, Pesticide-free High, IPM, and ISM received 3 lbs N 1000ft -2. These totals were for the entire 2016 growing season. The athletic field was mowed at 2.5 inches twice per week and the home lawn was mowed once per week at 3.5 inches. Mowing began in late April and continued through November. Fields were irrigated with a watering reel as needed. The high and low treatments for the organic and pesticidefree treatments look at the two extremes of applications because many turf managers and homeowners are limited by budget or time. The best management practices are not always a realistic plan of action. The high and low systems demonstrate the difference between the intensity of management and provide feasible recommendations. This study was designed with the following objectives; 1) reduce nitrogen and phosphorus applications, 2) identify advantages and disadvantages of each management system, and 3) create a hands-on demonstration site and education resource for training industry professionals how to manage turfgrass without pesticides. MATERIALS AND METHODS The research area was divided into two separate studies athletic field and home lawn. The studies consisted of individual plots measuring 20ft x 30ft with eight treatments replicated three times. Both studies were arranged as a randomized complete block design with three replications. The athletic field section (190ft x 100ft) was seeded with a mix of 70% Kentucky bluegrass and 30% perennial ryegrass (% seed by weight). The home lawn section (190ft x 100ft) was seeded with a mix of 60% Kentucky bluegrass, 20% perennial ryegrass and 20% fine fescue (10% chewings and 10% creeping red) (% seed by weight). The treatments or systems evaluated are: 1) Organic High, 2) Organic Low, 3) Pesticide-free High, 4) Figure 1. Modified greens aerator used to simulate traffic on athletic playing fields A specially designed traffic machine (Figure 1) was used on the athletic field portion of the study to provide simulated athletic field wear to the field. The walk-behind aerator was converted from using aeration tines to steel plates with individual cleats underneath. This imposed wear simulates the intense traffic most athletic fields endure on a perennial basis. The athletic fields received traffic events two or three times per week with a total of 58.5 events from June to November. Each traffic event consisted of two perpendicular passes. Data collection for the home lawn study included; color ratings, quality ratings, percent green cover, volumetric water content (VWC) (Spectrum Technologies, Inc. Plainfield, IL), 54 Table of Contents

65 normalized difference vegetative index (NDVI) (Spectrum Technologies, Inc. Plainfield, IL), and percent weed cover. In addition to the previous measurements, the athletic field was tested for surface hardness and rotational traction. Both fields were rated for their overall color and quality based on a scale from 1 to 9, where 1 represented the lowest quality, 6 was the minimum acceptable quality, and 9 was the optimum quality. This qualitative assessment was done once per month. Digital image analysis (DIA) was used on both fields to quantify dark green color and percent green cover (Karcher and Richardson, 2005). These images were taken without interference of sunlight by using a light box that was wheeled to plots with a dolly. Three images were taken of each plot with the light box. The digital images were scanned by Sigma Scan software (Cranes Software International Ltd. Chicago, IL. 1991). NDVI data was collected by taking 15 readings per plot for data analysis. VMC data was collected by taking the average of 12 readings per plot for data analysis. The DIA, VWC, and NDVI were taken every month starting in June. Calendar, Pesticide-Free Low, Pesticide-Free High and IPM treatments. Home lawn results showed dramatic differences in percent weed cover (Figure 7). ISM, IPM and Calendar had nearly zero weeds. For these management strategies, it was often hard to spot more than one or two weeds per plot. None of the other treatments were statistically different. However, the athletic field study showed more statistical differences among treatments (Figure 8). Calendar, ISM, and IPM had the fewest weeds. The changes in percent weed cover was likey due to the changes in mowing height and from traffic. Organic High had the lowest Gmax value and ISM had the highest; however, all treatments fell well within a range that would be considered acceptable for a well-maintained sports field (Figure 9). ISM retained greater percent green Weed counts for each plot was obtained by using a metal frame that had clear fishing line in perpendicular directions to make a crossing pattern. The frame had 240 intersections. The sum of intersections with weeds below each intersection was calculated as a percentage based on the 240 total intersections. The frame was counted in six separate locations within each plot to get an accurate quantitative number of weeds. Weed counts were conducted five times throughout the year. Lastly, the Clegg Impact Soil Tester was used to measure the GMAX rating, which was a quantitative assessment of surface hardness (ASTM, 2008). The GMAX was measured 18 times per plot and the average was used for data analysis. Clegg measurements were taken three times during the year. Treatments were also assessed for rotational traction by measuring the resistance of twisting a weighted cleat on the surface. This was done six times per plot (Canaway and Bell, 1986). Analysis of variance was used to test for significant differences (p <0.05) between treatments using SAS statistical software 9.4 (SAS Institute. Cary, NC. 2004). Where appropriate F-test showed significance, mean separations were conducted using Fisher s least significant difference (LSD) test with a 0.05 proabability level. Figure 2. Athletic field Organic High on December 1 st. cover under trafficked conditions than Pesticide-Free Low, IPM and the mow only control (Figure 10). This data presented was for 2016 only. LITERATUER CITED American Society for Testing and Materials (ASTM) Standard test method for measuring shock attenuation characteristics of natural playing surface systems using lightweight portable apparatus. F (reapproved 2002). In: Annual Book of ASTM Standards, vol ASTM International, West Conshohocken, PA. pg RESULTS AND DISCUSSION The treatments in the home lawn study exhibiting the highest average color ratings were Calendar, ISM & IPM with ratings of 7.41, 7.28, and 6.88 respectively (Figure 3). Minimal differences were observed between Organic High, Organic Low, Pesticide Free High, and the mow only control. The average quality ratings showed a similar trend to the color rating across the management strategies. Calendar stood out statistically above the rest for quality at 7.57 overall (Figure 4). The athletic field study showed a different response across the management strategies regarding turfgrass quality ratings than the home lawn study. ISM remained a top performer, but Organic High (Figure 6) had higher turfgrass quality than the Canaway, P.M., and M.J. Bell Technical note: An apparatus for measuring tractions and friction on natural and artificial playing surfaces. J. Sports Turf Res. Inst. 62: Karcher, D.E., and M.D. Richardson Batch analysis of digital images to evaluate turfgrass characteristics. Crop Sci. 45: Table of Contents

.")
.")
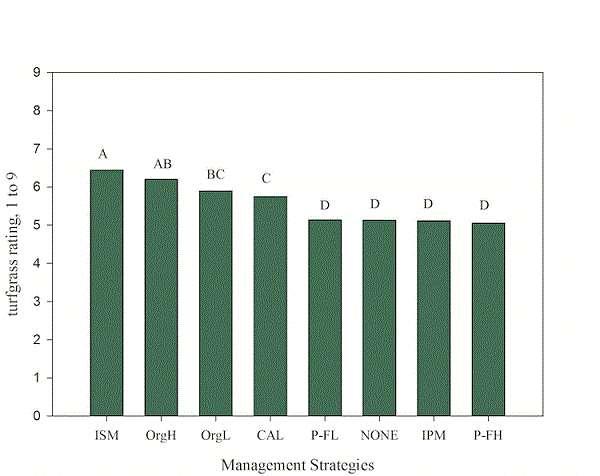
66 Figure 3. The effect of management strategies on home lawn qualitative turfgrass color. Data points with the same letter are not statistically different according to Fisher s protected LSD (p<0.05). Figure 5. The effect of management strategies on athletic field qualitative turfgrass color. Data points with the same letter are not statistically different according to Fisher s protected LSD (p<0.05). Figure 4. The effect of management strategies on home lawn turfgrass quality. Data points with the same letter are not statistically different according to Fisher s protected LSD (p<0.05). Figure 6. The effect of management strategies on athletic field turfgrass quality. Data points with the same letter are not statistically different according to Fisher s protected LSD (p<0.05). 56 Table of Contents
. Figure 8.")
. Figure 9.")
. Figure 10.")
67 Figure 7. The effect of management strategies on home lawn percent weed cover. Data points with the same letter are not statistically different according to Fisher s protected LSD (p<0.05). Figure 8. The effect of management strategies on athletic field percent weed cover. Data points with the same letter are not statistically different according to Fisher s protected LSD (p<0.05). Figure 9. The effect of management strategies on athletic field surface hardness. Data points with the same letter are not statistically different according to Fisher s protected LSD (p<0.05). Figure 10. The effect of management strategies on athletic field percent green cover in November. Data points with the same letter are not statistically different according to Fisher s protected LSD (p<0.05). 57 Table of Contents
68 SOLVITA SOIL TEST KITS TO CATEGORIZE TURFGRASS SITE RESPONSIVENESS TO NITROGEN FERTILIZATION 2016 RESULTS David Moore 1, Karl Guillard 1, and Will Brinton 2 1 Department of Plant Science and Landscape Architecture, University of Connecticut 2 Woods End Laboratories, Inc., Mt Vernon, ME INTRODUCTION Currently, there is no routine method of predicting nitrogen fertilization requirements for turfgrass areas. Nitrogen (N) is very transient in the soil, and routine soil tests for turf generally do not include a measure of N. N fertilizer is generally applied at a set rate regardless of soil characteristics. This is not ideal, as too little or too much fertilization can lead to problems related to turfgrass health and environmental pollution. The Solvita Company ( offers two simple soil tests kits that could improve our ability to accurately predict N fertilization requirements for turfgrass. The Solvita Labile Amino Nitrogen (SLAN) Test measures the biologically active fraction of N in the soil (also called the nitrogen mineralization potential of the soil); it measures the amount of ammonia gas that is released from the soil during a 24-hour incubation with 10 mls of 2 M NaOH. Presumably, the ammonia released is derived from the active, or labile, fraction of organic matter that contain easily-removable amine groups. The CO 2 -Burst Test measures the biologically active fraction of carbon (C) in the soil; it measures the CO 2 released from the soil during a 24-hour incubation with 20 mls of water. Presumably, the CO 2 released is the byproduct of microbial degradation of active organic matter. It is well-understood that the labile C fractions in the soil that the CO 2 -Burst Test measures are positively correlated with soil fertility and crop yield (Geng et al. 2014, Hurisso et al. 2016). These Solvita tests take 1 day and could be done on site without the need to send soil samples to a laboratory for processing. The objective of this research is to determine if these new commercially-available test kits can categorize turf soils as to their responsiveness to N fertilization. MATERIALS & METHODS In September of 2007, an organic composted fertilizer (Suståne 5-2-4, all natural fine grade) was incorporated into the 15-cm depth of 1 1 m plots at two adjacent sites at 23 different rates ranging from 0 to 400 kg available N ha 1 year 1. After compost incorporation, one site was seeded to tall fescue (Festuca arundinacea cvs. Shortstop II, Dynasty, Crossfire II), and the other was seeded to Kentucky bluegrass (Poa pratensis cv. America). The experiments were set out as randomized complete block designs with three replicates. In November of and , plots were solid-tined aerified and compost was applied again to the same plots using the same rates, and brushed into the aerification holes. Additional treatments in each year include urea in split applications (May, June, Sept., Oct.) at 49, 98, 147, and 196 kg N ha 1 year 1. The synthetic urea treatments were included so that response of the compost treatments could be matched to that of the synthetic N rate. Urea plots also received 98 kg of K 2 O and P 2 O 5 at the first urea application in the form of potassium sulfate and triple super phosphate. On April 25 th, 2016, before the first urea application, soil samples were collected from each plot to a depth of 10 cm below the thatch layer, oven-dried, then sieved to pass a 2-mm screen. These samples were analyzed with the Solvita CO 2 - Burst and SLAN test kits. Four grams of soil were used for the SLAN test and 40 grams of soil were used for the CO 2 -Burst test. Results are reported as mg kg 1 NH 3 -N for SLAN and mg kg 1 CO 2 -C for CO 2 -Burst. At approximately every two weeks during the growing season, turf color quality was measured using Spectrum FieldScout CM 1000 Chlorophyll and TCM 500 NDVI Turf Color meters (Spectrum Technologies, Inc., Aurora, IL). Grass clippings were harvested monthly from a 0.25-m 2 area in the center of each plot using a Toro push mower with a bagger. The clippings were dried in an oven between 60 and 70 C and weighed. The yearly sum of these monthly clipping weights was determined. Dried grass clippings were ground in a cyclone sample mill (Udy Corporation, Fort Collins, CO) and the ground tissue was analyzed using a LECO TruMac CN determinator (LECO Corporation, Saint Joseph, MI). Total N uptake was determined by multiplying the total N content of the tissue sample by the yearly sum of the harvested grass clippings. Linear regression models were applied to determine the response of Solvita CO 2 -Burst CO 2 -C and SLAN NH 3 -N concentrations as a function of organic fertilizer rates, and for mean NDVI readings, mean CM 1000 readings (Chlorophyll Index), sum of the clippings yields, clippings total N concentrations, and the sum of clippings total N uptake as a function of Solvita CO 2 -Burst CO 2 -C and SLAN NH 3 -N concentrations. The REG procedure of SAS 9.4 (SAS Institute, Cary, NC) was used for the linear models. Logistic curves of binary responses for the probabilities of organic fertilizer responses equaling or exceeding the mean responses obtained from the 150 and 200 kg N ha 1 urea treatments (which would typically be the maximum recommended rates of N for lawns in our climate) in relation to Solvita CO 2 -Burst CO 2 -C and SLAN NH 3 -N concentrations were determined with linear binary logistic models (a + bx = {ln[π/(1 π)]}, where π is the probability of the organic fertilizer response being equal to or exceeding the mean response from the 150 and 200 kg N ha 1 urea treatments) using the LOGISTIC procedure of SAS Table of Contents
69 RESULTS Soil CO2-C and NH3-N Concentrations as a Function of Organic Fertilizer Rate Increasing organic fertilizer rates were generally well correlated with increasing Solvita CO 2 -Burst CO 2 -C and SLAN NH 3 -N concentrations in a significant (P < 0.001) linear response (Figs. 1 and 2, panels A and B). The model fits were better for SLAN NH 3 -N than for CO 2 -Burst CO 2 -C. Turfgrass Color as a Function of Soil CO2-C and NH3-N Concentrations Turfgrass color, as measured by NDVI and CM 1000 meters, was significantly (P < 0.001) and linearly associated with Solvita CO 2 -Burst CO 2 -C and SLAN NH 3 -N concentrations for Kentucky bluegrass and tall fescue (Figs. 1 and 2, panels C, D, E, and F). The model fits were better for Kentucky bluegrass than for tall fescue. Turfgrass Clipping Yield as a Function of Soil CO2-C and NH3-N Concentrations Turfgrass clippings yield was significantly (P < 0.001) and linearly associated with Solvita CO 2 -Burst CO 2 -C and SLAN NH 3 -N concentrations for Kentucky bluegrass and tall fescue (Figs. 1 and 2, panels G and H). The model fits were better for Kentucky bluegrass than for tall fescue, and better for SLAN NH 3 -N than for CO 2 -Burst CO 2 -C. Turfgrass Tissue Total Nitrogen Concentration and Total Nitrogen Uptake as a Function of Soil CO2-C and NH3-N Concentrations Turfgrass tissue total N concentration and total N uptake were significantly (P < 0.001) and linearly associated with Solvita CO 2 -Burst CO 2 -C and SLAN NH 3 -N concentrations for Kentucky bluegrass and tall fescue (Figs. 1 and 2, panels I, J, K, and L). The model fits were better for Kentucky bluegrass than for tall fescue, and better for SLAN NH 3 -N than for CO 2 - Burst CO 2 -C. Predicting Turfgrass Response as a Function of Soil CO2-C and NH3-N Concentrations Inclusion of the urea treatments provide a convenient way to determine an equivalent response obtained from the organic fertilizer treatments, and to predict turfgrass response based on these equivalent responses. Using binary logistic regression, we were able to calculate the probability of equaling or exceeding the mean response of that obtained from the urea 150 and 200 kg N ha 1 year 1 rates. These urea rates are typically the maximum recommended seasonal N loading amounts for coolseason turfgrass lawns in our climate; N rates above 200 kg N ha 1 year 1 generally would not be recommended for established lawns. Estimates of the binary logistic regression coefficient parameters and their associated P-values are given in Table 1. As a guide for the reader, the Wald P-values are used to determine the significance of the slope for the logistic regression (considered significant when P < 0.05). The Hosmer-Lemeshow P-value indicates the significance of the goodness-of-fit test. The model is considered a good fit for the data when the Hosmer-Lemeshow P-value >0.05. Significant (P < 0.05) logistic regression models were found for nearly all variables (NDVI, Chlorophyll Index, clippings yield, total N, and N uptake) for both Kentucky bluegrass and tall fescue (with the exception of tall fescue NDVI versus SLAN NH 3 -N concentration) and when both species were combined as a function of soil CO 2 -Burst CO 2 -C and SLAN NH 3 -N concentrations (Table 1). Probability curves indicated that when mean soil CO 2 -Burst CO 2 -C concentrations were 93 and 84 mg kg 1, there was a low probability (P 0.33) of response equal to or exceeding that of kg N ha 1 from urea for Kentucky bluegrass and tall fescue, respectively, across the five measured variables (Fig. 3 panels A and B, and Table 2). When mean CO 2 -C concentrations were between 93 to 120 mg kg 1 for Kentucky bluegrass and between 84 to 122 mg kg 1 for tall fescue, there was a moderate probability (P > 0.33 to 0.67) of equaling or exceeding the response obtained from the kg N ha 1 urea treatments. Mean soil CO 2 -C concentrations 148 mg kg 1 and 162 mg kg 1 were associated with a high probability (P 0.90) of Kentucky bluegrass and tall fescue responses equaling or exceeding that of kg N ha 1 from urea, respectively. Probability curves indicated that when mean SLAN NH 3 - N concentrations were 142 and 177 mg kg 1, there was a low probability (P 0.33) of response equal to or exceeding that of kg N ha 1 from urea for Kentucky bluegrass and tall fescue, respectively (Fig.3 panels D and E, and Table 2). When mean NH 3 -N concentrations were between 142 to 156 mg kg 1 for Kentucky bluegrass and between 177 to 213 mg kg 1 for tall fescue, there was a moderate probability (P > 0.33 to 0.67) of equaling or exceeding the response obtained from the kg N ha 1 urea treatments. Mean soil SLAN NH 3 -N concentrations 172 mg kg 1 and 250 mg kg 1 were associated with a high probability (P 0.90) of Kentucky bluegrass and tall fescue responses equal to or exceeding that of kg N ha 1 from urea, respectively. When responses from both species were combined, there was a high probability (P 0.90) of Kentucky bluegrass and tall fescue responses equaling or exceeding that of the kg N ha 1 urea treatments when mean soil CO 2 -Burst CO 2 -C concentrations were 156 mg kg 1 and when mean SLAN NH 3 - N concentrations were 220 mg kg 1 (Fig. 3 panels C and F, and Table 2). 59 Table of Contents
70 Mean Chlorophyll Index Mean Chlorophyll Index Mean NDVI Mean NDVI Kentucky Bluegrass Tall Fescue 200 A 200 B CO 2 -C, mg kg y = x r² = *** Organic Fertilizer Available N Rate, kg ha 1 CO 2 -C, mg kg y = x r² = *** Organic Fertilizer Available N Rate, kg ha C y = x r² = *** D y = x r² = *** CO 2 -C, mg kg CO 2 -C, mg kg E F y = x r² = *** CO 2 -C, mg kg y = 0.902x r² = *** CO 2 -C, mg kg 1 Sum Clippings Yield, g m y = x r² = *** CO 2 -C, mg kg 1 G Sum Clippings Yield, g m y = x r² = *** CO 2 -C, mg kg 1 H 60 Cont. on next page Table of Contents
71 Kentucky Bluegrass (continued) Tall Fescue (continued) Total N, g kg y = x r² = *** CO 2 -C, mg kg 1 I Total N, g kg y = x r² = *** CO 2 -C, mg kg 1 J N Uptake, g m y = x r² = *** CO 2 -C, mg kg 1 K N Uptake, g m y = x r² = *** L CO 2 -C, mg kg 1 Figure 1. Effects of organic fertilizer rate on of CO2-C concentrations as measured with the Solvita CO2-Burst Test Kit (panels A and B); and relationship between Solvita CO2-Burst Test CO2-C concentrations and NDVI readings (panels C and D), chlorophyll meter readings (panels E and F), clippings yield (panels G and H), clippings total N concentration (panels I and J), and clippings total N uptake (panels K and L) from the organic fertilizer plots. The first column of panels corresponds to Kentucky bluegrass (Poa pratensis), and the second column of panels corresponds to tall fescue (Festuca arundinacea). Significance of the positive linear response: *** (P < 0.001). 61 Table of Contents
72 Mean Chlorophyll Index Mean Chlorophyll Index Mean NDVI Mean NDVI Kentucky Bluegrass Tall Fescue NH 3 -N, mg kg y = x r² = *** A NH 3 -N, mg kg y = x r² = *** B Organic Fertilizer Available N Rate, kg ha Organic Fertilizer Available N Rate, kg ha y = x r² = *** C y = x r² = *** D NH 3 -N, mg kg NH 3 -N, mg kg y = x r² = *** NH 3 -N, mg kg 1 E y = x r² = *** NH 3 -N, mg kg 1 F Sum Clippings Yield, g m y = x r² = 0.518*** NH 3 -N, mg kg 1 G Sum Clippings Yield, g m y = x r² = *** NH 3 -N, mg kg 1 H 62 Table of Contents
73 Kentucky Bluegrass (continued) Tall Fescue (continued) Total N, g kg y = x r² = *** NH 3 -N, mg kg 1 I Total N, g kg y = x r² = *** NH 3 -N, mg kg 1 J N Uptake, g m y = x r² = *** NH 3 -N, mg kg 1 K N Uptake, g m y = x r² = *** NH 3 -N, mg kg 1 L Figure 2. Effects of organic fertilizer rate on NH3-N concentrations as measured with the SLAN Test Kit (panels A and B); and relationship between SLAN NH3-N concentrations and NDVI readings (panels C and D), chlorophyll meter readings (panels E and F), clippings yield (panels G and H), clippings total N concentration (panels I and J), and clippings total N uptake (panels K and L) from the organic fertilizer plots. The first column of panels corresponds to Kentucky bluegrass (Poa pratensis), and the second column of panels corresponds to tall fescue (Festuca arundinacea). Significance of coefficient of for the positive linear response: *** (P < 0.001). 63 Table of Contents
74 Probability of Equaling or Exceeding the Benchmark Value Probability of Equaling or Exceeding the Benchmark Value Probability of Equaling or Exceeding the Benchmark Value Probability of Equaling or Exceeding the Benchmark Value Probability of Equaling or Exceeding the Benchmark Value Probability of Equaling or Exceeding the Benchmark Value CO2-Burst CO2-C Kentucky Bluegrass SLAN NH3-N A NDVI 0.4 CM Yield 0.2 Total N 0.1 N Uptake 0.0 NDVI CM 1000 Yield Total N N Uptake D CO 2 -C, mg kg 1 NH 3 -N, mg kg 1 Tall Fescue CO 2 -C, mg kg 1 B NDVI CM Yield 0.2 Total N 0.1 N Uptake NH 3 -N, mg kg 1 E NDVI CM 1000 Yield Total N N Uptake Both Species Combined NDVI CM 1000 Yield Total N N Uptake C NDVI CM 1000 Yield Total N N Uptake F CO 2 -C, mg kg 1 NH 3 -N, mg kg 1 Figure 3. Probability curves of equaling or exceeding the NDVI, CM1000 (Chlorophyll Index), clippings yield, total N, and N uptake values of that obtained from the mean response of urea at the 150 and 200 kg N ha 1 rates in relation to Solvita Soil CO2-Burst CO2-C concentrations (panels A, B, and C) and SLAN NH3-N concentrations (panels D, E, and F) for the 2014 growing season. Mean urea response at the 150 and 200 kg N ha 1 rates for NDVI, CM1000, sum of the monthly clippings yield (g m -2 ), total N (g N kg 1 ), and N uptake (g m - 2 ) values were 0.711, 371, 285.4, 37.5, and 11.0 for Kentucky bluegrass, respectively; 0.723, 406, 299.6, 36.6, and 11.0 for tall fescue, respectively; and 0.717, 389, 292.5, 37.0, and 11.0 across both species combined, respectively. 64 Table of Contents
75 Table 1. Logistic regression coefficients for binary response of NDVI, Chlorophyll Index (CM1000), clippings yield (Yield), Total N concentration, and N uptake (NUP) values being equal to or exceeding the mean response for the urea 150 and 200 kg ha 1 treatments for Kentucky bluegrass and tall fescue lawns in relation to Solvita CO2-Burst CO2-C and SLAN NH3-N concentrations for the 2016 growing season. CO 2 -Burst Test Kentucky Bluegrass Hosmer Lemeshow p-value Intercept Slope Tall Fescue Hosmer Lemeshow p-value Variable Intercept Slope Wald p- value Max. rescaled r 2 Wald p- value Max. rescaled r 2 NDVI CM < Yield < Total N NUP < Kentucky Bluegrass SLAN Test Hosmer Lemeshow p-value Intercept Slope Tall Fescue Hosmer Lemeshow p-value Variable Intercept Slope Wald p- value Max. rescaled r 2 Wald p- value Max. rescaled r 2 NDVI CM Yield < Total N NUP < CO2-Burst Test SLAN Test Kentucky Bluegrass and Tall Fescue Combined Kentucky Bluegrass and Tall Fescue Combined Hosmer Hosmer Variable Intercept Slope Wald p- value Max. rescaled r 2 Lemeshow p-value Intercept Slope Wald p- value Max. rescaled r 2 Lemeshow p-value NDVI < CM < < Yield < < Total N < < NUP < < Table of Contents
76 Table 2. Concentrations of Solvita CO2-Burst CO2-C and SLAN NH3-N at selected probabilities of equaling or exceeding the response of kg N ha 1 using urea for NDVI, Chlorophyll Index (CM1000), clippings yield (Yield), clippings Total N concentration, and N uptake (NUP) for Kentucky Bluegrass CO2-Burst CO2-C Concentrations, mg kg 1 SLAN NH3-N Concentrations, mg kg 1 P NDVI CM1000 Yield Total N NUP Mean NDVI CM1000 Yield Total N NUP Mean Tall Fescue CO2-Burst CO2-C Concentrations, mg kg 1 SLAN NH3-N Concentrations, mg kg 1 P NDVI CM1000 Yield Total N NUP Mean NDVI CM1000 Yield Total N NUP Mean Kentucky Bluegrass and Tall Fescue Combined CO2-Burst CO2-C Concentrations, mg kg 1 SLAN NH3-N Concentrations, mg kg 1 P NDVI CM1000 Yield Total N NUP Mean NDVI CM1000 Yield Total N NUP Mean SUMMARY AND CONCLUSIONS The third-year results of this study suggest that the Solvita CO 2 -Burst and SLAN Test kits show promise in estimating cool-season turfgrass lawn response as a function of CO 2 -C and NH 3 -N concentrations in soil samples collected in the spring prior to fertilization. Better fits of the data were obtained with the SLAN test kit compared to the results of the CO 2 -Burst test kit, but both did reasonably well. One objective of the research is to establish response categories (Low, Moderate, or High) that will guide N fertilization of turfgrass lawns based on concentrations of CO 2 - Burst CO 2 -C and SLAN NH 3 -N concentrations. Concentrations presented in Table 2 can be used as starting benchmark values for these categories for equaling or exceeding the response of kg N ha 1 urea treatments. When concentrations have P 0.33, then the category would be considered Low ; when concentrations have P > 0.33 to 0.67, then the category would be Moderate ; when concentrations have P > 0.67, then the category would be High ; when concentrations have P > 0.90, then the category would be Very High. Using Kentucky bluegrass NDVI response for turfgrass color as an example, it would be unlikely that much N fertilizer would be needed when soil CO 2 -C concentrations are 139 mg kg 1, or when SLAN NH 3 -N concentrations are 170 mg kg 1 (P 0.67, Table 2). When CO 2 -C and NH 3 -N concentrations exceed 163 and 187 mg kg 1, respectively, there would be only a 10% chance or less that the Kentucky bluegrass NDVI would increase in a response equivalent to kg N ha 1 to added N fertilization. In these cases, supplemental N should be withheld and applied only in special cases where turf response is less than optimum after growth is monitored before applying N. Application of supplemental N in areas when CO 2 -Burst and SLAN test kits read high increases the likelihood of N losses from the system and more problems with insect and disease pests. The 2016 CO 2 -Burst SLAN responses are very similar to the trends obtained in previous research on these same plots when predicting turfgrass response to the soil permanganateoxidizable carbon (POXC) and Illinois Soil N Test (ISNT)-N concentrations obtained from a spring soil sample across 5 years ( ; Geng et al., 2014). SLAN NH 3 -N concentrations obtained from archived soil samples from the Geng et al., 2014 study are highly correlated (P < 0.01) with the respective ISNT-N concentrations (data not shown). This suggests that the Solvita SLAN test may have similar predictive power in guiding N fertilization as does the ISNT. As more data are collected, different delineation ranges may come forth. However, we are encouraged with the results across three years, and think that the Solvita could provide an objective guide for N fertilization of cool-season turfgrass lawns. 66 Table of Contents
77 ACKNOWLEDGEMENTS Funding for this research is provided by The New England Regional Turfgrass Foundation and the Storrs Agricultural Experiment Station. Suståne all natural for the study was donated by Rich Hawkes of Suståne Natural Fertilizer, Inc. This project is being conducted in collaboration with Will Brinton and Woods End Laboratories. REFERENCES Geng, X., K. Guillard, and T.F. Morris Turfgrass growth and color correlated to spring Illinois soil N test and soil permanganate-oxidizable carbon concentrations. Crop Sci. 54: doi: /cropsci Hurisso, T. T., S. W. Culman, W. R. Horwath, J. Wade, D. Cass, J. W. Beniston, T. M. Bowles, A. S. Grandy, A. J. Franzluebbers, M. E. Schipanski, S. T. Lucas, and C. M. Ugarte Comparison of permanganate-oxidizable carbon and mineralizable carbon for assessment of organic matter stabilization and mineralization. Soil Sci. Soc. Am. J. 80: doi: /sssaj Table of Contents
78 CLIPPINGS SAP NITRATE-N CONCENTRATIONS AND RELATIONSHIP TO NDVI AND DGCI 2016 Xiaoling Wang 2, David Moore 1, and Karl Guillard 1 1 Department of Plant Science and Landscape Architecture, University of Connecticut 2 Henan University of Science and Technology, P.R. China INTRODUCTION Annual grasses usually store N as nitrate (NO 3 ) in the bases of stems and shoots, and this NO 3 pool is closely related to soil N availability. Perennial turfgrasses also store N as NO 3, but this pool is dynamic throughout the growing season. In the spring and summer, new leaf growth and frequent mowing lead to NO 3 being largely assimilated into leaf proteins. Consequently, the storage of NO 3 is generally low during these periods. In autumn, however, new leaf blade formation in perennial turfgrasses declines as the onset of winter dormancy begins. During this time, N storage as NO 3 increases since the amount of N assimilated into leaf proteins is reduced because overall leaf formation declines. A measure of this NO 3 pool could be useful in the N fertilizer management of turfgrasses. Nitrate-N concentrations in plant tissues are typically measured on a dry weight basis, which entails the drying and grinding of samples prior to extraction and analysis. The availability of field-use plant sap NO 3 meters has provided an alternative to drying and grinding of samples, which is a timeconsuming process and delays results. In other horticulturally important crops such as potatoes, cotton, and numerous vegetables, sap is expressed from fresh plant parts and analyzed directly for NO 3 or NO 3 -N. This then serves as a guide for N fertilization based on previous calibration studies with those crops. There are limited data that report on NO 3 -N concentrations in turfgrass clippings across the growing season. Therefore, the objective of this study was to determine the relationship between clippings sap NO 3 -N concentrations and Normalized Difference Vegetative Index (NDVI) and Dark Green Color Index (DCGI) of turfgrasses throughout the growing season in Connecticut. These reflectance readings serve as a measure of turfgrass color. If a relationship exists, this may be useful in guiding N fertilization. MATERIALS & METHODS This study was conducted during May through November 2016 on two separate cool-season turfgrass stands Kentucky bluegrass (Poa pratensis) (KBG) and tall fescue (Festuca arundinacea) (TF) established on a fine sandy-loam soil. The experiments were set out as randomized complete block designs with three replicates for each species. Plot size was m. Stands were fertilized every month from April to November with 11 N application rates (0, 5, 10, 15, 20, 25, 30, 35, 40, 45, 50 kg N ha 1 ), applied as a mixture of slow- and fast-release urea. In the middle of each month before mowing, NDVI of each plot was measured with a Spectrum TCM 500 NDVI Turf Color Meter (Spectrum Technologies, Inc., Aurora, IL) and DGCI was determined with Spectrum FieldScout GreenIndex+ mobile app (version 2.0) running on an Apple ipad. Clipping samples were collected once a month from each plot by using a Toro Personal Pace Recycler mower with a bagger set at a mowing height of 57 mm. Fresh clipping samples were taken as a random grab sample from the mower bag. Tree leaves or other debris were removed from the samples. Clippings were then placed in a Spectrum hydraulic plant press to expel the sap. The sap was placed into the sample well of a Spectrum LAQUA Twin Nitrate Meter, and measurements were made for concentrations of NO 3 -N. Sap measurements for all dates were taken between 1030 and 1600 hr with the N rates in order of low to high. The meter was recalibrated after each block was completed (11 samples). Mean clippings sap NO 3 -N concentrations were analyzed for treatment differences (N rates and dates) by using analysis of variance with Fisher s LSD for mean separation in the MIXED procedure of SAS 9.4 (SAS Institute, Cary, NC). The relationship between clippings sap NO 3 -N concentrations and N rate was modeled with a simple linear regression using the REG procedure in SAS. Linear response-plateau (LRP) models were applied to the NDVI and DGCI data to determine a critical level for sap NO 3 -N concentrations by using the NLIN procedure of SAS. The critical sap NO 3 -N value marks the concentration where no further change in NDVI or DCGI response is observed with increasing concentration of clippings sap NO 3 -N. The response value at this point and beyond the critical value is referred to as the plateau, which indicates the maximum response that will be observed in the relationship. If the LRP model was not applicable, then a simple linear regression model was used to analyze the data. RESULTS & DISCUSSION Monthly Clippings Sap Nitrate-N Concentrations Across the growing season, clippings sap NO 3 -N concentrations were relatively low and stable for both species during May, June, and July (Fig. 1). Significant (P < 0.05) differences among N rate treatments within each month were not observed until August in KBG and September in TF. Accumulation of NO 3 was greatest from September to November, and greater for the higher N rates. Averaged across N rates, monthly sap NO 3 -N concentrations were greatest for November followed by October in both species (Fig. 2). The greatest rates of increase for sap NO 3 -N concentrations across N rates was observed for September, October, and November (with November highest) for KBG, and for October and November (with November highest) for TF (Fig. 3 and Table 1). 68 Table of Contents

79 The lower clippings sap NO 3 -N concentrations at the beginning and middle of the growing season were probably a result of active leaf growth in late spring and summer months that assimilated a large amount of NO 3 within plant. Whereas, a rapid accumulation of NO 3 at the end of the growing season in September to November was most likely attributed to a decline in leaf growth and more storage of NO 3 at the onset of winter dormancy. The sap NO 3 -N concentration dynamics in the growing season could be divided into two different phases: the stable phase (May-August), and accumulation phase (September-November). Across the entire growing season for KBG and TF, clippings sap NO 3 -N concentrations showed considerable variation within each N rate. However, significant (P < 0.01) linear increases were observed in each month as N rates increased, except in June for TF (Fig. 3 and Table 1). Slopes of the regression model were lower in the stable phase (May-Aug.) when compared to the greater slope values in the accumulation stage (Sept.-Nov.) (Table 1). Response of NDVI and DGCI as a Function of Clippings Sap Nitrate-N Concentrations In all months for both species, NDVI response significantly (P < to P < 0.025) fit the LRP model (Fig. 4 and Table 1), except for TF NDVI response in May, which showed a significant (P < 0.01) linear response only. Critical levels across species ranged from 147 to 227 mg L 1 during the stable phase (May-August), and from 190 to 560 mg L 1 during the accumulation phase (Sept.-Nov.). Compared on a month-bymonth basis, the critical levels for KBG and TF in the stable or accumulation phases were relatively close to one another, and generally agreed. With DGCI, the LRP model was significant (P < to P < ) in 5 of the 7 months for KBG, and significant (P < to P < ) in 4 of the 7 months for TF (Fig. 4 and Table 1). Critical levels across species ranged from 170 to 220 mg L 1 during the stable phase (May-August), and from 173 to 405 mg L 1 during the accumulation phase (Sept.-Nov.). A plateau could not be established for KBG in June and July (linear response only), and neither for TF in May, June, July, and November (linear only, except for June no significant response). There was much greater variation for DGCI than for NDVI. However, when a critical level could be established, the response between species was relatively in agreement. *** *** *** *** *** ns ns ns *** ns ns ns ns *** Figure 1. Responses of mean clippings sap NO3-N concentrations for each N rate across the monthly sampling dates. Significance of the F-test for N rate means is shown above each date (ns, not significant; ***, P <0.001). 69 Table of Contents


80 a a b b d e d e d e c d c e e c d Figure 2. Responses of mean clippings sap NO3-N concentrations for each monthly sampling date averaged across N rates. Means with the same letters are not different according to Fisher s Protected LSD (α=0.05). Figure 3. Linear response of clippings sap NO3-N concentrations for each monthly sampling date across N rates. Model statistics and coefficients are presented in Table Table of Contents
81 Kentucky Bluegrass NDVI Tall Fescue NDVI Kentucky Bluegrass DGCI Tall Fescue DGCI Critical Level = 177 Critical Level=170 Critical Level = 158 Critical Level=207 Critical Level = 171 Critical Level = 147 Critical Level = 227 Critical Level = 150 Critical Level=220 Critical Level = 157 Critical Level = 190 Critical Level = 193 Critical Level=270 Critical Level = 173 Critical Level = 296 Critical Level = 332 Critical Level=285 Critical Level = 319 Critical Level = 326 Critical Level = 560 Critical Level = 405 Figure 4. Response of monthly Kentucky bluegrass and tall fescue NDVI and DGCI readings as function of clippings sap nitrate-n concentrations. 71 Table of Contents
82 Table 1. Model coefficients and statistics for Kentucky bluegrass (KBG) and tall fescue (TF) sap NO3-N concentrations as a function of N rates, and NDVI and DGCI responses to sap NO3-N concentrations, SUMMARY Month May June July Aug. Sept. Oct. Nov. KBG Sap NO3-N vs. N rate, Fig. 3 Intercept Slope R P value < < < < < < < TF Sap NO3-N vs. N rate, Fig.3 Intercept Slope R P value < < < < < KBG NDVI vs. Clippings Sap NO3-N, Fig.4 Plateau Intercept Slope Critical Level R P value < < < < TF NDVI vs. Clippings Sap NO3-N, Fig.4 Plateau NA Intercept Slope Critical Level NA R P value < < < < KBG DCGI vs. Clippings Sap NO3-N, Fig.4 Plateau NA NA Intercept Slope Critical Level 170 NA NA R P value < < < TF DCGI vs. Clippings Sap NO3-N, Fig.4 Plateau NA NA NA NA Intercept Slope Critical Level NA NA NA NA R P value < < < < The results of this preliminary study suggests that clippings sap NO 3 -N concentrations are relatively stable during the active leaf production periods of the growing season (May-Aug.). However, commencing at the onset of winter dormancy preparation, clippings sap NO 3 -N concentrations significantly increase from September to November. The data also suggest that NDVI is correlated to clippings sap NO 3 -N concentrations, and could potentially serve as a guide to N fertilization. DGCI was also correlated to clippings sap NO 3 -N concentrations, but showed more variability than NDVI. 72 Table of Contents
83 BENTGRASS CULTIVAR PERFORMANCE OF ONE-YEAR OLD FAIRWAY TURF IN CONNECTICUT, 2016 J. Inguagiato, K. Miele, J. Dunnack, Z. Esponda, and S. Vose Department of Plant Science and Landscape Architecture University of Connecticut, Storrs INTRODUCTION An increase in the number of creeping bentgrass cultivars has occurred in recent years. This increase is the result of significant efforts by turfgrass breeders to develop new cultivars with improved density and texture, but more importantly greater tolerance to heat, drought, and disease. Many of these newer creeping bentgrass cultivars generally exhibit superior performance over older industry standards such as Penncross. In addition to creeping bentgrass, colonial bentgrass cultivars have also increased for use in fairways. Colonial bentgrass is not as widely recognized as a fairway turf, but its upright growth habit, dollar spot tolerance, and recuperative potential from drought stress make this a desirable turf for low input fairways. The objective of this trial was to evaluate recently developed creeping bentgrass and colonial bentgrass cultivars to assess their performance as fairway turf in New England. MATERIALS & METHODS A field study was established as fairway turf on a Woodbridge fine sandy loam at the Plant Science Research and Education Facility in Storrs, CT in The field was mowed at 0.5 inch 3 times wk -1 with a triplex mower. A total of 1.0 lbs N 1000-ft -2 was applied from seeding through September 2015, and 2.9 lbs N 1000-ft -2 was applied as water soluble sources from March to November Minimal irrigation was applied from June through August to assess potential differences among cultivars. Annual bluegrass was suppressed with applications of Velocity at 6 oz A -1 on 6 and 25 July. Curative dollar spot and brown patch control was achieved with applications of Secure (0.5 fl oz) + Xzemplar (0.26 fl oz) on 20 August, Curalan (1.0 oz) on 27 August and Secure (0.5 fl oz) on 9 September. Cutworms were controlled with an application of Scimitar (0.169 fl oz) on 27 August. New commercially available cultivars of creeping bentgrass and colonial bentgrass were seeded individually or as colonial bentgrass-chewings fescue blends. All creeping bentgrass and colonial bentgrass single entry plots were seeded at 1.0 lbs 1000-ft -2, except PennTrio which was seeded at 2.0 lbs 1000-ft -2, to account for the 50% by weight of seed coating. Mixed stand seedings included colonial bentgrass at 0.2 lbs, with Chewings fescue at 4.0 lbs, or perennial ryegrass at 6.0 lbs 1000-ft -2. All plots were seeded on 24 Aug To ensure uniform dollar spot development throughout the trial the study area was inoculated with Sclerotinia homoeocarpa infested, dried Kentucky bluegrass seed at 3.6 oz ft -2 on 29 June. Turf quality was visually assessed on a 1 to 9 scale; where 9 represented the best quality turf and 6 was the minimum acceptable level. Leaf texture was also assessed visually on a 1 to 9 scale where 9 represented the finest textured turf. Dark green color index derived from digital images of plots taken under controlled lighting conditions was used to differentiate color differences among cultivars and percent green turf cover. Compressed thatch thickness was determined from two 2 inch diameter cores per plot. Dollar spot and brown patch severity were visually assessed by as the percent plot area blighted by each disease. Wilt severity was evaluated on a scale of 0 to 5 where 0 is no wilt symptoms, and 5 represented blighted dead turf. All data were subjected to an analysis of variance and means were separated using Fisher s protected least significant difference test. RESULTS & DISCUSSION Establishment All cultivars were relatively slow to establish due to limited fertility applied after seeding in However, plots filled in throughout the Spring of 2016 reaching near complete turf cover by 20 Jun. Cultivars differed in the rate of establishment with Proclamation, Greentime, Barracuda, Declaration, Luminary, and Pure Select among the entries with the greatest turf cover on 16 May 2016 (Table 1). Turf quality Turf quality was poor among all cultivars on 13 May due to incomplete turf cover during establishment (Table 1). Cultivars noted above which established more rapidly were among the only ones to have acceptable levels of turf quality (i.e., 6) at this time. Quality of all entries improved throughout the summer, although development of dollar spot or brown patch affected quality during July and August. An average of turf quality observations is reported to provide an overall perspective of cultivar visual performance throughout the season. Considerable differences among bentgrass cultivars were observed. 007, Proclamation, Barracuda, Luminary, and Declaration were among the highest turf quality grouping of creeping bentgrass cultivars throughout 2016 (Table 1). Similarly, colonial bentgrass cultivars Capri, Greentime, and the Capri + Radar Chewings fescue mix were also among the highest rated entries this year; with quality ratings comparable to the best creeping bentgrasses. As expected, Penncross plots ranked among the lowest turf quality, along with Tyee, Ninetysix Two, and Focus throughout the season. 73 Table of Contents
84 Thatch accumulation After one year of growth, limited differences in thatch accumulation were observed among varieties evaluated. Colonial bentgrass cultivars (e.g., Greentime and Capri) generally had the least amount of thatch in the trial, but were not less than some moderate thatch accumulating creeping bentgrass cultivars such as 007, 13-M, or Tyee. Creeping bentgrass cultivars Memorial and MacKenzie were among those with the least thatch accumulation. Similarly, Penncross and Focus also had less thatch, although this may be due to disease, wilt, or other factors reducing overall growth as evidenced by poor turf quality ratings. Dollar spot severity Dollar spot developed uniformly throughout the trial area on 1 Aug and severity increased to a very high level with the most severe entry reaching 66% plot area blighted on 19 Aug (Table 2). All colonial bentgrass single entries and mixtures had less dollar spot compared to any of the creeping bentgrass cultivars, with 5% plot area blighted on 19 Aug. Few differences in dollar spot severity were observed within the colonial bentgrass group, although Capri + Radar Chewings fescue did have slightly more dollar spot compared to Capri alone, likely due to the susceptibility of Chewings fescue to this disease. Within creeping bentgrass varieties, dollar spot ranged from 11 to 66% plot area blighted (Table 2). Declaration, 13- M, Memorial, and Proclamation were among the cultivars with the least dollar spot (i.e., 11 to 20%). Whereas, Penncross, Cobra II, PennTrio, Pure Select, and Tyee had the greatest dollar spot in the trial (i.e., 53 to 65%). Brown patch severity Brown patch developed from a natural infestation during July. Disease severity was low (i.e., 6%) in all creeping bentgrass cultivars at the peak of disease on 1 Aug (Table 2). No statistical differences were observed among any creeping bentgrass cultivars, except Declaration which contained 5.7% plot area blighted at the height of the epidemic (1 Aug). Colonial bentgrass single entries developed moderate to high levels of brown patch (i.e., 28 to 63% plot area blighted). Brown patch was greatest in Capri plots, sustaining 63% plot area blighted compared to FT-12 and Greentime with 28 and 31% disease, respectively. Interestingly, the addition of Radar Chewings fescue to Capri colonial bentgrass reduced the severity of brown patch observed 50% compared to plots seeded to Capri only. Drought tolerance Prolonged drought conditions and limited irrigation resulted in wilt symptoms throughout the trial area on 16 Sep. Greatest wilt stress symptoms were observed in Penncross seeded plots compared to all other entries (Table 2). Slight wilt stress was apparent in Memorial, PennTrio, and Focus. CONCLUSIONS Results from this trial demonstrate that newly developed creeping bentgrass cultivars exhibit improved performance over older varieties such as Penncross. Moreover, that considerable differences in turf quality, disease resistance, and drought tolerance exist even among recently developed commercially available creeping bentgrass cultivars. Distinct differences in turf quality and disease tolerance were observed among entries during this first year of what will be a multi-year trial. However, differences in thatch accumulation were limited after one year. It is anticipated that as cultivars continue to mature that differences in thatch accumulation may become more apparent. Potential differences in thatch accumulation should be an important consideration, in addition to quality and disease resistance, when selecting fairway turfgrasses. Challenges of managing thatch in fairways and the resulting impacts on turf drought, disease, and weed pressures make lesser thatch producing cultivars/species more desirable. This study will be continued to monitor thatch and organic matter accumulation for potential differences in subsequent years of this trial. Colonial bentgrass cultivars evaluated in this trial had comparable or better turf quality, dollar spot tolerance, and less thatch accumulation compared to top performing creeping bentgrass varieties. This species is not as commonly used on fairways in the United States at this time. Beneficial attributes of this species such as improved dollar spot tolerance and upright growth habit, and good recuperative potential may make it good option golf courses looking for more sustainable fairway turfgrasses. This study will be continued to provide additional information on long term performance on creeping and colonial bentgrass cultivars for fairway turf in New England. 74 Table of Contents
85 Table 1. Turf quality, turf cover, leaf texture, dark green color index, and thatch accumulation of creeping and colonial bentgrass cultivars and mixtures in a one-year old fairway turf at the Plant Science Research and Education Facility in Storrs, CT during Turf quality Turf cover Leaf texture Dark green color index Thatch accumulation Entry z Species 13 May 13 Jun 9 Jul 1 Aug 27 Sep Average 16 May Sep ; 6=min acceptable percent 1-9; 9=fine index mm 007 creeping 6.0 abc 8.0 a 7.8 a 5.5 b-e 8.8 a 7.2 a 47.3 cde 7.8 cd cd 23.8 a-f MacKenzie creeping 5.0 ef 7.0 bcd 6.3 de 3.8 ijk 6.8 fgh 5.8 ef 35.4 hi 7.0 efg f 22.8 def Memorial creeping 5.0 ef 7.0 bcd 6.0 def 5.8 bcd 6.8 fgh 6.1 de 37.7 gh 6.8 fg cde 22.8 c-f Penncross creeping 5.0 ef 6.0 ef 5.0 gh 3.3 k 4.8 j 4.8 hi 35.8 hi 5.3 i ef 22.6 ef PennTrio creeping 5.3 def 6.3 def 6.0 def 4.3 g-j 6.8 fgh 5.7 efg 38.4 fgh 6.5 gh ab 23.9 a-f Cobra II creeping 5.5 cde 7.5 abc 7.5 ab 4.8 e-h 7.5 c-f 6.6 bcd 44.9 def 7.5 cde ef 25.8 a 13-M creeping 5.5 cde 6.8 cde 6.0 def 5.3 c-f 7.3 d-g 6.2 de 35.2 hi 6.5 gh cde 23.9 a-f Tyee creeping 4.8 fg 6.0 ef 5.5 efg 4.0 h-k 6.3 hi 5.3 fgh 34.6 hi 6.0 h f 23.6 a-f Declaration creeping 5.8 bcd 6.8 cde 6.8 bcd 6.0 bc 8.5 ab 6.8 abc 53.9 abc 7.8 cd bc 25.2 abc Ninety-six Two creeping 4.3 gh 5.8 fg 5.3 fgh 4.3 g-j 6.5 ghi 5.2 gh 28.9 i 6.0 h de 23.4 a-f Pure Select creeping 5.8 bcd 6.3 def 7.3 abc 5.0 d-g 7.5 c-f 6.4 cd 52.5 bc 8.0 bc de 24.5 a-e Proclamation creeping 6.3 ab 7.5 abc 7.8 a 6.0 bc 8.3 abc 7.2 a 59.7 a 7.8 cd def 24.8 a-e Luminary creeping 6.0 abc 7.0 bcd 7.3 abc 5.8 bcd 7.8 b-e 6.8 abc 52.6 bc 7.0 efg a 25.0 a-d Barracuda creeping 6.0 abc 7.0 bcd 7.5 ab 6.3 b 8.3 abc 7.0 ab 54.6 ab 7.5 cde de 25.7 ab Focus creeping 4.0 h 5.0 g 4.5 h 3.5 jk 5.8 i 4.6 i 12.6 j 5.3 i g 22.9 c-f Greentime colonial 6.0 abc 7.8 ab 6.5 cd 6.3 b 7.0 bc 6.7 abc 54.9 ab 8.0 bc gh 22.0 f FT-12 colonial 6.3 ab 7.3 abc 6.0 def 5.5 b-e 8.0 a 6.6 bcd 51.7 bcd 9.0 a ij 24.7 a-e Capri colonial 6.5 a 8.0 a 7.3 abc 5.0 d-g 7.3 a 6.8 abc 47.0 cde 8.8 a k 22.5 ef Capri + Radar colonial Chewings fescue 6.0 abc 6.8 cde 6.3 de 7.3 a 7.8 ab 6.8 abc 43.7 efg 8.5 ab j 25.5 ab Capri + Karma colonial perennial ryegrass 6.0 abc 5.5 fg 5.3 fgh 4.5 f-i 6.5 ghi 5.6 fg 36.5 h 7.3 def hi 23.4 b-f ANOVA: Treatment (P > F) *** *** *** *** *** *** *** *** *** * z All entries were seeded on 24 Aug Table of Contents
86 Table 2. Dollar spot and brown patch severity and wilt symptom development of creeping and colonial bentgrass cultivars and mixtures in a one-year old fairway turf at the Plant Science Research and Education Facility in Storrs, CT during Dollar spot severity Brown patch severity Wilt symptoms Entry z Species 1 Aug 19 Aug 9 Jul 1 Aug 16 Sep percent plot area blighted ; 5=blighted 007 creeping 7.1 b-f 22.4 fg 0.0 b 5.4 def 0.0 d MacKenzie creeping 8.4 a-e 44.3 bcd 0.0 b 0.0 f 0.5 cd Memorial creeping 5.2 d-h 17.8 gh 0.0 b 0.0 f 1.3 b Penncross creeping 17.4 ab 65.8 a 0.5 b 0.0 f 3.3 a PennTrio creeping 21.5 a 52.5 abc 0.0 b 0.0 f 0.8 bc Cobra II creeping 18.2 ab 57.2 ab 0.0 b 0.5 ef 0.0 d 13-M creeping 4.3 d-i 16.4 gh 0.0 b 0.0 f 0.5 cd Tyee creeping 21.2 a 52.8 abc 0.0 b 0.0 f 0.5 cd Declaration creeping 2.5 f-j 11.0 hi 0.0 b 5.7 de 0.0 d Ninety-six Two creeping 15.3 abc 35.8 c-f 0.0 b 0.0 f 0.3 cd Pure Select creeping 16.2 ab 56.8 ab 0.0 b 0.0 f 0.5 cd Proclamation creeping 5.5 c-g 19.6 gh 0.0 b 3.5 def 0.3 cd Luminary creeping 6.8 b-f 25.7 efg 0.0 b 0.0 f 0.3 cd Barracuda creeping 9.7 a-d 33.1 def 0.0 b 1.0 ef 0.0 d Focus creeping 15.6 ab 38.1 cde 0.5 b 0.0 f 0.8 bc Greentime colonial 3.0 e-i 3.3 jk 5.0 a 30.5 b 0.3 cd FT-12 colonial 1.2 ij 2.2 jk 9.8 a 27.9 bc 0.3 cd Capri colonial 0.6 j 0.5 k 8.5 a 63.0 a 0.0 d Capri + Radar colonial Chewings fescue 1.4 hij 4.9 ij 0.3 b 12.6 cd 0.0 d Capri + Karma colonial perennial ryegrass 1.8 g-j 1.5 jk 0.0 b 5.1 def 0.0 d ANOVA: Treatment (P > F) *** *** *** *** *** z All entries were seeded on 24 Aug Table of Contents
87 NATIONAL TURFGRASS EVALUATION PROGRAM (NTEP) 2014 NATIONAL FINELEAF FESCUE ANCILLARY TEST 2016 RESULTS Steven Rackliffe, John Inguagiato, Karl Guillard, Victoria Wallace, and Jason Henderson Department of Plant Science and Landscape Architecture University of Connecticut INTRODUCTION Fineleaf fescues are fine leaf grasses that are medium to dark green in color. The leaves are narrow and needle like. Fine leaf fescues are often utilized for turf that is grown under low input (fertility, water, etc.) conditions. A few areas/locations where they are often planted would be home lawns, parks, commercial properties, golf course roughs, and roadsides. Desirable characteristics of fineleaf fescues are that they have fine leaf texture, high leaf density, good to excellent drought resistance, low fertility needs, and they exhibit good to excellent shade tolerance. Some of the disadvantages of fine leaf fescues are that they exhibit moderate to poor wear tolerance, become thatchy, and they are slow to recuperate from injury. Fine leaf fescues are typically maintained at mowing heights between 1 to 3 inches. Fine leaf fescues include hard fescue, sheep fescue, creeping red fescue and chewings fescue. Hard, sheep, and chewings fescues are considered bunch type grasses (without rhizomes) while the creeping red fescues (both strong and slender) are both rhizomatous. Golf course managers continue to face government restrictions and regulations regarding water and pesticide use on their golf course properties. An average eighteen hole golf course may have anywhere from 25 to 40 acres of fairways. Fairways are often irrigated and treated with pesticides. Most golf course fairways are maintained at mowing heights of one half inch. Typical grasses grown on fairways in northern climates are creeping bentgrass, perennial ryegrasses, and compact bluegrasses. The purpose of this study is to investigate the quality of fineleaf fescues maintained at lower mowing heights and subjected to simulated golf cart traffic. Cultivars or species of fineleaf fescues that can be successfully grown at fairway mowing heights, and that can survive under traffic conditions may be a good alternative to the conventional grasses that have higher water and fertilizer requirements. The National Turfgrass Evaluation Program (NTEP) is sponsored by the Beltsville Agriculture Research Center and the National Turfgrass Federation Inc. NTEP works with breeders and testing sites throughout the United States in evaluating turfgrass species and cultivars. Results from turfgrass evaluations can aid professionals in their selection of turfgrass species/cultivars that best meet their needs. Results also aid breeders in selecting new cultivars that they may put into production, as well as helping in marketing their varieties. In 2014 NTEP selected ten standard testing sites and eleven ancillary test locations for their 2014 National Fineleaf Fescue Test. The University of Connecticut, Plant Science Teaching and Research Facility in Storrs CT, was selected as an ancillary test site investigating simulated golf cart traffic tolerance of fineleaf fescue entries maintained at 0.5 mowing height. Evaluations will be made to both trafficked and non-trafficked test plots that are maintained with minimal inputs including supplemental water and fertility. MATERIALS AND METHODS Forty two fineleaf fescue plots were seeded on September 4, 2014 in Storrs Connecticut. Of the forty two fine fescue entries: 12 were hard fescues, 10 were strong creeping red fescues, 10 were chewings fescues, 6 were creeping red fescues, 3 were slender creeping red fescues, and 1 was a sheep fescue. A complete randomized block design with 3 replicates of each cultivar was utilized for this study. Plot size is 5 X 5. Sponsors and entries are listed in Table 1. As agreed upon by the cooperators of the ancillary traffic study, each plot was divided in half. One-half of each plot received simulated golf cart traffic and the other half of the plot was not subjected to traffic. The trafficked half of each plot received to two passes of simulated golf cart traffic three times per week for a total of 6 passes per week (figures 1 and 2). In 2016, traffic was intiated on plots beginning on 5/9/16 and continued throughout the season and concluded at the end of September Traffic will resume in the spring of Management Practices Since establishment, all plots and cultivars received the same management protocol throughout the study. Management practices for the 2014 grow-in and 2015 focused on establishment for the entire season. In 2016, plots received one pound of nitrogen per 1,000 ft 2. Water was applied as needed to relieve stress. Fertilizer and pesticide applications /22/16 - Pre-emergent 0.54 oz/1,000 ft 2 Prodiamine. 65 WDG 4/29/ % SCU at rate of 1#N/1,000 sq. 5/13/16 Acelepryn,.367 fl. Oz./1,000 ft 2 Mowing - Plots were maintained at a mowing height of 0.5 inches and mowed three times per week. Clippings were returned. Irrigation Irrigation was applied only to prevent severe drought stress. Supplmental irrigation was applied on only three occasions for the 2016 growing season. Spring Green-up Ratings Spring green-up ratings were taken and recorded (Table 2 non-trafficked and Table 3 trafficked) on March 24, Green-up measures the transition from winter dormancy to active spring growth. Ratings were based on a scale of 1-9, with 1 equaling brown turf and 9 equaling dark green turf. 77 Table of Contents
88 Quality Ratings Turfgrass quality ratings were taken on a monthly basis for overall turf quality (color / leaf texture / density) during the 2016 growing season. Overall turfgrass quality was determined using a visual rating system of 1-9. A score of 1 illustrates the poorest quality turf and 9 the highest quality. Monthly quality and mean quality ratings are provided in Table 2 for nontrafficked plots and Table 3 for trafficked plots. Percent Living Cover Ratings for percent living cover were taken on three separate dates; May 9 th, July 14 th and October 2 nd. The last rating for percent living cover coincided with the last seasonal traffic treatment. Perecnt living cover ratings are provided in Table 2 for non-trafficked plots and Table 3 for trafficked plots. Disease Ratings Ratings for percent red thread and dollarspot disease were taken on May 13 th and August 18 th respectively. Perecnt disease is provided in Table 2 for non-trafficked plots and Table 3 for trafficked plots. RESULTS & DISCUSSION The University of Connecticut was chosen as a site for the 2014 Fineleaf Fescue Ancillary trial that will be investing the effect of simulated golf cart traffic on fineleaf fescue species and cultivars that are maintained at 0.5. For the entire 2015 growing season, simulated golf cart traffic was withheld to allow for turf to mature. Beginning in April 2016 simulated golf cart traffic treatments began on one half of each plots. Results from both non-trafficked and trafficked treatments can be found in tables 2 qand 3. In 2016 there were two disease outbreaks one for red thread and one for dollarspot. While there was no significant difference among species for red thread disease it appeared that the hard fescues exhibited the least amount of red thread damage. For dollarspot, while there were a few instances of significant differences between entries, a distinction among species could not be determined. It should be pointed out that for dollarspot ratings in the table 3, some plots were damaged so severly by traffic that a distinction could not be made bewtween disease and traffic injury. Those plots are denoted with a period in table. Percent living cover ratings were taken on three separate occasions during the season, First, ratings were taken before traffic was intiated, the second rating was taken mid-season, and the third rating was when traffic concluded at the end of September. While percent cover ratings were taken for both trafficked and non-trafficked studies, the traffic effect is best noted in table 3. Of the fine leaf fescue species, the Chewings species appeared to perform best under traffic conditions. Nine of the top 12 species for percent cover at the conclusion of 2016 trafficking were chewings fescues. Rounding out the top-twelve were one slender creeping red fescue, one strong creeping red fescue and one hard fescue. In general, the hard fescues exhibited the least traffic tolerance. The bottom ten entries for percent living ground cover (trafficked) were all hard fescues. Overall visual turfgrass quality ratings for both trafficked and non-trafficked plots illustrated that the chewings, slender, and creeping red fescues often exhibited higher quality ratings when compared to the hard and sheep fescues. One exception was hard fescsue DLFPS-FRC/3060 which scored in the top ten for both quality and percent density. Lower turf quality ratings for hard fescue and sheep fescue were likely impacted by the lower mowing heights and traffic treatments. Quality for both species (hard and sheep) would most likely be higher if plots where maintained at mowing heights greater than 0.5 inches and traffic in minimal. The results of year one of this study are promising. There were cultivars and species that exhibited high quality turf even when subjected to traffic, reduced irrigation and reduced fertilizer. Many of the enties would be acceptable for playing surfaces such as golf course fairways. In 2016 Connecticut experienced one of the driest seasons on record. Plots received supplemental irrigation on only three separate occasions. Irrigation was applied when all plots began to show water stress. Perhaps the biggest key for success of these species in fairway turf would be to significantly reduce irrigation. This would require the manager to be diligent in scouting and monitoring the turf for drought symptoms as well as monitoring soil moisture levels. In 2016 many of the entries performed exceptional well on 1 pound of supplemnatl fertilization for the season. 78 Table of Contents
89 Table 1 Sponsors, Entries, and Species SPONSOR ENTRY SPECIES Landmark Turf and Native Seed Minimus Hard Fescue Landmark Turf and Native Seed Marvel Strong Creeping Red Brett Young Seeds Ltd 7C34 Strong Creeping Red DLF Pickseed USA DLFPS-FL/3066 Hard Fescue DLF Pickseed USA DLFPS-FRC/3060 Hard Fescue DLF Pickseed USA DLFPS-FL/3060 Hard Fescue DLF Pickseed USA DLFPS-FRR/3069 Strong Creeping Red University of Minnesota MNHD-14 Hard Fescue DLF Pickseed USA DLFPS-FRR/3068 Strong Creeping Red Standard Entry Quatro Sheep Standard Entry Boreal Strong Creeping Red Columbia River Seed TH456 Hard Fescue John Deere Landscapes 7H7 Hard Fescue Columbia River Seed Sword Hard Fescue Standard Entry Seabreeze GT Slender Creeping Red Standard Entry Radar Chewings Standard Entry Beacon Hard Fescue Standard Entry Navigator II Strong Creeping Red Mountain View Seeds PPG-FL 106 Hard Fescue The Scotts Company PPG-FRC 114 Chewings Mountain View Seeds PPG-FRT 101 Slender Creeping Red Mountain View Seeds PPG-FRR 111 Strong Creeping Red Mountain View Seeds PPG-FRC 113 Chewings Columbia Seeds Kent Strong Creeping Red Columbia Seeds RAD-FC32 Chewings Barenbrug USA BAR FRT 5002 Slender Creeping Red Barenbrug USA BAR VV-VP3-CT Chewings Barenbrug USA BAR 6FR126 Chewings The Scotts Company C14-OS3 Strong Creeping Red Brett-Young Seed LTD RAD-FR33R Strong Creeping Red Bailey Seed Company RAD-FC44 Chewings Bailey Seed Company RAD-FR47 Creeping Red Fescue Pure Seed Testing Inc. PST-4DR4 Creeping Red Fescue Pure Seed Testing Inc. PST-4RUE Creeping Red Fescue Pure Seed Testing Inc. PST-4BEN Creeping Red Fescue Pure Seed Testing Inc. PST-4BND Hard Fescue Pure Seed Testing Inc. PST-4ED4 Creeping Red Fescue DLF Pickseed USA DLFPS-FRC/3057 Chewings Standard Entry Cascade Chewings DLF Pickseed USA DLF-FRC Chewings DLF Pickseed USA DLF-FRR 6162 Creeping Red Fescue DLF Pickseed USA Beudin Hard Fescue 79 Table of Contents


90 Figure NTEP Fineleaf fescue ancillary low cut/traffic Trials, University of Connecticut (photo- July 2016) Figure 2 Golf cart traffic simulator Figure 3- FineFescue turf plots subjected to traffic and non-traffic treatments Photo taken September Table of Contents
91 Table results for non-trafficked fine fescue turfgrass plots. Ratings are for: spring green-up (ratings 1-9, where 9 equals darker green up), monthly turfgrass quality (rating 1-9, where 9 equals the highest turf quality), percent living ground cover on three separate dates, disease ratings for percent dollarspot and red thread.table is listed with highest mean quality cultivars listed first. Spring green up Red thread (% of plot) Dollar spot (% of plot) Percent Living cover Quality Entry 3/24 5/13 8/19 5/9 7/14 10/2 Mean 4/19 5/26 6/21 7/14 8/16 9/16 10/17 11/16 MeanQ Radar C14-OS DLFPS- FRC/ DLF-FRC PPG-FRC PPG-FRC RAD-FC BAR VV-VP3-CT BAR 6FR DLFPS- FRC/ RAD-FC PPG-FRT BAR FRT C DLF-FRR Cascade RAD-FR Marvel DLFPS- FRR/ PST-4BEN PPG-FRC Beudin Navigator II RAD-FR33R PST-4DR DLFPS-FL/ Table of Contents
92 DLFPS- FRR/ Seabreeze GT PST-4ED DLFPS-FL/ H Kent MNHD TH Boreal Quatro PST-4RUE Beacon Sword PPG-FL PST-4BND Minimus LSD CV% Table of Contents
93 Table results for trafficked fine fescue turfgrass plots. Ratings are for: spring green-up (ratings 1-9, where 9 equals darker green up), monthly turfgrass quality (rating 1-9, where 9 equals the highest turf quality), percent living ground cover on three separate dates, disease rating for percent dollarspot and red thread.table is listed with highest mean quality cultivars listed first. Spring green up Red thread (% of plot) Dollar spot (% of plot) Percent Living cover Quality Entry 3/24 5/13 8/19 5/9 7/14 10/2 Mean 4/19 5/26 6/21 7/14 8/16 9/16 10/17 11/16 Mean C14-OS PPG-FRC PPG-FRC BAR VV-VP3-CT Radar DLFPS-FRC/ DLF-FRC DLFPS-FRC/ RAD-FC PPG-FRT C RAD-FC Marvel DLF-FRR DLFPS-FRR/ RAD-FR33R RAD-FR BAR FRT Cascade PPG-FRC PST-4BEN DLFPS-FRR/ Beudin BAR 6FR Navigator II PST-4DR Kent Boreal PST-4ED Table of Contents
94 Seabreeze GT PST-4RUE Quatro DLFPS-FL/ MNHD PPG-FL H DLFPS-FL/ Sword Beacon TH PST-4BND Minimus LSD CV% No distinction could be made between disease and traffic injury Acknowledgements: This project is funded by the National Turfgrass Evaluation Program Traffic Simulator made possible through the New England Turfgrass Research Foundation 84 Table of Contents
95 NATIONAL TURFGRASS EVALUATION PROGRAM (NTEP) 2012 NATIONAL TALL FESCUE TEST 2016 RESULTS Steven Rackliffe, Karl Guillard, Jason Henderson, John Inguagiato, and Victoria Wallace Department of Plant Science and Landscape Architecture University of Connecticut INTRODUCTION Turf-type tall fescue has gained in popularity over the last decade. Characteristics that make turf-type tall fescue desirable are: it maintains a dense, dark green color, lower fertility requirements than conventional Kentucky bluegrass/ryegrass home lawns, and it has good traffic tolerance and shade tolerance. Turf-type tall fescue also exhibits excellent drought avoidance characteristics. When trying to reduce inputs such as fertilizer and water, turf-type tall fescue can be a good alternative. The National Turfgrass Evaluation Program (NTEP) is sponsored by the Beltsville Agriculture Research Center and the National Turfgrass Federation Inc. NTEP works with breeders and testing sites throughout the United States in evaluating turfgrass species and cultivars. Results from turfgrass evaluations can aid professionals in their selection of turfgrass species/cultivars that best meet their needs. Results also aid breeders in selecting new cultivars that they may put into production, as well as helping in marketing their varieties. In 2012 NTEP selected fifteen standard testing sites and eleven ancillary test locations for their 2012 Turf-type Tall Fescue Test. The University of Connecticut, Plant Science Teaching and Research Facility in Storrs CT, was selected as a standard site for the 2012 Turf-type Tall Fescue Test. MATERIALS AND METHODS One hundred and sixteen cultivars of Turf-type Tall fescue were seeded on September 11, 2012 in Storrs Connecticut. A complete randomized block design with 3 replicates of each cultivar was utilized for this study. Plot size is 5 X 5. Sponsors and entries are listed in Table 1. Management Practices Since establishment, all plots and cultivars received the same management protocol throughout the study. Management practices for 2015 were as follows: Mowing - Plots were maintained at a mowing height of 2.75 inches and mowed two times per week. Clippings were returned. Irrigation Although Connectcut experienced one of the driest summers in recent years, supplemental water through rrigation was not needed or applied Fertilizer and pesticide applications 4/22/16 - Pre-emergent 0.54 oz/1,000 ft 2 Prodiamine. 65 WDG, 4/29/16-1# N /1,000 ft 2, (60% SCU). 5/13/16 Acelepryn,.367 fl. Oz./1,000 ft 2 5/20/16 - TZone applied 1.4fl. oz /1,000 ft 2 9/15/16 1# N /1,000 ft 2, (60% SCU). Quality Ratings Turfgrass quality ratings were taken on a monthly basis for overall turf quality (color / leaf texture / density) during the 2016 growing season. Overall turfgrass quality was determined using a visual rating system of 1-9. A score of 1 illustrates the poorest quality turf and 9 the highest quality. Monthly quality and mean quality ratings are provided in table 2. Leaf Texture Ratings Visual leaf texture ratings were taken in the late spring (May 27, 2016) while the grass was actively growing and not under stress conditions. Texture ratings were made using a visual scale with 1 equaling coarse turf and 9 equaling fine (Table 2). Genetic Color Ratings Genetic color ratings (Table 2) were taken in the late spring (May 27, 2016) while the grass was actively growing and not under stress conditions. Ratings were based on visual color with 1 being light green and 9 being dark green. Areas of plots that contained browning tissue (chlorosis or necrotic) from outside factors such as disease were not considered for genetic color (Table 2). RESULTS & DISCUSSION Results for spring green up, genetic color, leaf texture, and monthly quality ratings, are provided in Table 2. A few general observations noted were: mean quality values for overall quality continue to illustrate that there is little diversity between cultivars. Pick-W43 had the highest mean quality ratings for the 2016 growing season. However, there were no significant differences in quality between Pick-W43 and the next 71 cultvars listed in table 2 and seen in figure 1. Kentucky 31 exhibited the poorest quality. In 2016 all plots exhibited excellent drought avoidance characteristics. Although Connecticut experienced one of the driest years in recent history, plots did not require irrigation. All cultivars maintained color and avoided dormancy. 85 Table of Contents
96 Table 1- Sponsors and Entries SPONSOR ENTRY SPONSOR ENTRY Semillas Fito S.A. Terrano DLF International Seed IS-TF-272 Standard Entry Ky-31 Pennington Seed ATF 1736 Landmark Turf and Native Seed Regenerate Brett-Young Seeds ATF 1754 Semillas Fito S.A Fesnova Burlingham Seeds Hemi Z Seeds ZW 44 Burlingham Seeds Firebird 2 Turf Merchants Inc. W45 Standard Entry Bullseye Turf Merchants Inc. U43 Pure-Seed Testing, Inc PST-5EV2 Turf Merchants Inc. LSD Pure-Seed Testing, Inc PST-5GRB Turf Merchants Inc. Aquaduct Pure-Seed Testing, Inc PST-5SALT Standard Entry Catalyst Pure-Seed Testing, Inc PST-5SDT Ledeboer Seed LLC Marauder Pure-Seed Testing, Inc PST-5DZP Ledeboer Seed LLC Warhawk Pure-Seed Testing, Inc PST-5RO5 Ledeboer Seed LLC Annihilator Pure-Seed Testing, Inc PST-5BPO Ledeboer Seed LLC Comp.Res. SST Pure-Seed Testing, Inc PST-5BRK Ledeboer Seed LLC 204 Res.Blk4 John Deere Landscapes DB1 Jacklin Seed by John Deere JS 819 Simplot Landscapes RZ2 Jacklin Seed by Simplot JS 818 Columbia Seeds LLC TD1 Jacklin Seed by Simplot JS 809 Columbia Seeds LLC DZ1 Jacklin Seed by Simplot JS 916 Landmark Turf and Native Seed T31 Jacklin Seed by Simplot JS 825 Pickseed West Inc. PSG-GSD The Scotts Company MET 1 Pickseed West Inc. PSG-8BP2 The Scotts Company F711 Pickseed West Inc. PSG-TT4 DLF International Seed IS-TF 291 Standard Entry Faith DLF International Seed IS-TF 276 M2 The Scotts Company K12-13 DLF International Seed IS-TF 305 SEL The Scotts Company K12-05 DLF International Seed IS-TF 269 SEL Peak Plant Genetics PPG-TF Table of Contents
97 Table 1 (continued) - Sponsors and Entries SPONSOR ENTRY SPONSOR ENTRY DLF International Seed IS-TF 282 M2 Columbia Seeds LLC PPG-TF-157 DLF International Seed IS-TF 284 M2 Columbia Seeds LLC PPG-TF-169 Great Basin Seed OR-21 Columbia Seeds LLC PPG-TF-170 Great Basin Seed TY 10 Lewis Seed Company PPG-TF-137 Great Basin Seed EXP TF-09 Ampac Seed Company PPG-TF-135 Seed Research Oregon SRX-TPC Lewis seed Company PPG-TF-115 Pickseed West Inc. PSG-WEI Lewis seed Company PPG-TF-105 Pickseed West Inc. Pick-W43 Peak Plant Genetics PPG-TF-172 Pickseed West Inc. Grade 3 Grassland Oregon PPG-TF-151 Pickseed West Inc. PSG-PO1 Peak Plant Genetics PPG-TF-152 Landmark Turf and Native Seed U45 Peak Plant Genetics PPG-TF-148 Pennington Seed B23 Columbia Seeds PPG-TF-150 Pennington Seed ATF 1612 Semillas Fito S.A. Bizem Peennington Seed ATF 1704 Proseeds Marketing CCR2 Burlingham Seed Burl TF-2 Proseeds Marketing Met-3 Burlingham Seed Burl TF-136 The Scotts Company W41 Lebanon Turf LTP-FSD Peak Plant Genetics PPG-TF-145 Products Lebanon Turf.Ampac Seed LTP-TWUU Products Company PPG-TF-138 Lebanon Turf Products LTP-F5DPDR Landmark Turf and Native Seed PPG-TF-139 DLF International Seed IS-TF-289 Landmark Turf and Native Seed PPG-TF-142 DLF International Seed MET 6 SEL Columbia Seeds LLC RAD-TF-89 Columbia Seeds LLC IS-TF-330 Radix Reasearch RAD-TF-92 Columbia Seeds LLC TF-287 Grasslands Oregon GO-DFR Columbia Seeds LLC IS-TF-307 SEL The Scotts Company K12-MCD Columbia Seeds LLC IS-TF 308 SEL Pure-Seed Testing Inc. PST-5EX2 Brett-Young Seeds IS-TF-311 Pure-Seed Testing Inc. PST-5MVD Brett-Young Seeds IS-TF-285 Oak Park Farms RAD-TF-83 Brett-Young Seeds IS-TLF 310 SEL Grassland Oregon RAD-TF 88 Barenbrug USA BAR Fa Pure-Seed testing Inc. PST-R5NW Barenbrug USA BAR Fa Burlingham Seeds Burl TF 69 Barenbrug USA BAR Fa Standard Entry Falcon IV Barenbrug USA BAR Fa Standard Entry Falcon V 87 Table of Contents
 88 Table")
98 Figure Turf-Type Tall Fescue NTEP Trial, University of Connecticut (photo- July 2016) 88 Table of Contents
99 Table 2. Tall Fescue NTEP results 2016 for genetic color (ratings 1-9, where 9 equals darker green), leaf texture (rating 1-9, where 9 equals the finest texture leaf blade), turfgrass quality (rating 1-9, where 9 equals the highest turf quality). Table is listed with highest mean quality cultivars listed first. Brown Genetic color Texture patch (% of plot) Quality Entry 05/31/16 05/31/16 05/27/15 04/19/16 05/26/16 06/27/16 07/14/16 08/16/16 09/16/16 10/17/16 11/16/16 mean Pick-W ZW U PPG-TF IS-TF 310 SEL PPG-TF PPG-TF W F PPG-TF RZ Regenerate U LTP-TWUU PPG-TF IS-TF PPG-TF Bullseye PPG-TF CCR Burl TF Hemi T PPG-TF PPG-TF IS-TF PSG-PO PPG-TF K12-MCD Table of Contents
100 LSD MET IS-TF 305 SEL PST-5BRK Bizem IS-TF 308 SEL Faith PPG-TF W Catalyst SRX-TPC LTP-FSD MET 6 SEL IS-TF LTP-F5DPDR IS-TF 284 M Grade B PST-5SALT Falcon IV Fesnova TF PST-5MVD Burl TF Falcon V PSG-WE IS-TF 307 SEL PPG-TF PPG-TF MET RAD-TF IS-TF 282 M IS-TF Table of Contents
101 Firebird PST-5EV PSG-GSD PPG-TF IS-TF 269 SEL ATF PST-5BPO PSG-TT PPG-TF IS-TF PST-5EX Burl TF PPG-TF IS-TF 276 M PST-5DZP DB JS ATF TD DZ PSG-8BP RAD-TF ATF JS ATF PST-5R Terrano PPG-TF RAD-TF IS-TF Annihilator JS K Table of Contents
102 PST-57DT TY RAD-TF OR Res. Blk Exp TF BAR Fa BAR Fa JS PST-5GRB GO-DFR BAR Fa PST-R5NW Comp. Res. SST K Aquaduct JS Marauder Warhawk BAR Fa Ky LSD CV% Acknowledgements: This project is funded by the National Turfgrass Evaluation Program 92 Table of Contents
103 NATIONAL TURFGRASS EVALUATION PROGRAM (NTEP) 2015 STANDARD AND ANCILLARY LOW INPUT COOL SEASON TEST 2016 RESULTS Steven Rackliffe, Karl Guillard, Victoria Wallace Department of Plant Science and Landscape Architecture University of Connecticut INTRODUCTION There has been increased interest to develop new plant management strategies, or to investigate new plant systems that require less input such as water, fertilizer, and pesticides. Overall quality and functionality are still desired. This trial is unique in that the maintenance of this trial, after the establishment period, will be minimal. There will be no water, fertilizer or pesticides applied after the establishment period. (Exception is the Ancillary Trial, which received one preemergent application in the first year of the study). Also unique about this trial is that it not only includes single cultivars, it includes, blends, mixtures and mixtures with grass and non-grass species. In 2015 the National Turfgrass Evaluation Program (NTEP) selected thirteen standard testing locations and thirteen ancillary test locations for their 2015 Low Input Cool-Season Trials. The University of Connecticut, Plant Science Teaching and Research Facility in Storrs CT, was selected for both a Standard and Ancillary site. The duration of this study is five years and will conclude in the fall of The National Turfgrass Evaluation Program (NTEP) is sponsored by the Beltsville Agriculture Research Center and the National Turfgrass Federation Inc. NTEP works with breeders and testing sites throughout the United States in evaluating turfgrass species and cultivars. This low input study differs from conventional NTEP trials in two ways. One is that many of the entries are not single cultivars or varieties being evaluated, they contain mixtures. The second difference is that many of the entries contain non-turfgrass species. Results from this trail may aid homeowners and professionals in their selection of low input species and mixtures that best meet their needs, and those that provide a suitable ground cover that will require less water, fertility and mowing. MATERIALS AND METHODS Two low-input trials were seeded on September 14, 2015 in Storrs Connecticut. One trial was a standard test while the second trial was an ancillary test. Each test consisted of thirty-two entries (Table 1) containing different species, different mixtures, and different compositions. Both, the ancillary and standard trial contained the same entries and received the same maintenance regimes.the only difference between the two trials was that the ancillary trial received a preemergent application for weeds in the spring of Sponsors and entries are listed in table 1. A complete randomized block design with 3 replicates of each cultivar was utilized for each study. Plot size is 5 X 5. Establishment and Management Practices- After seeding, plots were covered to aid in germination and to reduce any chances of seed migration. All plots for each study received the same management protocol since establishment. Mowing (Standard and Ancillary trials) - Plots are maintained at a mowing height of 3.25 inches and mowed when no more than 1/3 of the leaf is removed. Mowing dates are recorded. Irrigation Regime (Standard and Ancillary trials) - No irrigation Fertilizer and pesticide applications (2015/2016) Standard and Ancillary trials - Plots received a total of 1 pound of nitrogen. 4/22/16 Standard trial No Preemergent applied Ancillary Trial Preemergent applied on 4/29/16 (Prodiamine 4L at.5oz./1000 ft 2 ) Establishment Ratings- Seedling Emergence ratings were evaluated four weeks after planting on October 4, (table 2 standard test and table 3 ancillary test). Emergence ratings were based on percent emergence and seedling vigor. Percent Living Ground Cover- Percent living cover ratings are taken twice per year, once in the spring and once in the fall. In 2016, ratings were done on May 31 st and October 17 th (table 2 standard test and table 3 ancillary test). Quality Ratings- Quality ratings are taken on a monthly basis throughout the growing season for overall quality (color/density). Overall quality is determined using a visual rating system of 1-9. A score of 1 illustrates the poorest quality and 9 the highest quality.(table 2 standard test and table 3 ancillary test). Percent grassy and broadleaf weed encroachment Ratings Weed encroachment ratings are taken twice per year, once in the spring and once in the fall. In 2016, ratings were done on June 21 st and September 18 th (table 2 standard test and table 3 ancillary test). RESULTS & DISCUSSION The University of Connecticut was chosen as a site for the National Turfgrass Program 2015 Low Input Cool-Season Trials. This trial differs from the typical NTEP trials because each plot contained different grasses and species. Evaluating the different species and grasses for visual quality was challenging. This was especially true when comparing broadleaf entries such as clover with straight grass entries or grass and clover mixes. For visual ratings, heavier weight was placed on density. The purpose of this study is to investigate the use of different ground covers for low maintenance environments. The top entries for both the ancillary studies and 93 Table of Contents

104 the standard studies were 7H7 a hard fescue, DLFPS-TFAM a mixture of three tall fescues and microclover. Many of the clovers and fescues performed well (Figure 1). Yaak 100% western yarrow performed extremely well through the early part of the season but the overall quality began to deterioate towards the end of the season. Kenblue Kentucky bluegrass had the poorest rating in both trials. Visual differences between ancillary trial plots (receiving preemergent applications) and non- ancillary plots (not receiving preemergent applications) were minimal for the 2016 season. While difficult to predict, because it is early in the study, there appear to be good alternatives for low-input ground covers. Figure NTEP Low Input Cool Season Trials University of Connecticut Photo taken August Table of Contents
105 Table 1 Entries, Species, and Composition of the 2015 Standard and Ancillary Low Input Cool-Season Tests PLOT ENTRY SPECIES/COMPOSITION SPONSOR 1 Natural Knit PRG Mix 50% Mensa perennial ryegrass 50% Savant perennial ryegrass Ledeboer Seed LLC 2 Bullseye 100% Bullseye tall fescue Standard entry 3 Bewitched 100% Bewitched Ky. Bluegrass Standard entry 4 BGR-TF3 100% BGR-TF3 tall fescue Berger International LLC 5 MNHD % MNHD-15 hard fescue University of Minnesota 6 DLFPS TF-A 33% Mustang tall fescue DLF/Pickseed/Seed 33% Grande 3 tall fescue Research of Oregon 34% Fayette tall fescue DLFPS ChCrM 24% Longfellow 3 chewings fescue 24% Windward chewings fescue 7 24% Chantilly strong creeping red fescue DLF/Pickseed/Seed 25% Ruddy strong creeping red fescue Research of Oregon (CRF) 3% Microclover 8 9 DLFPS ShHM DLFPS TFAM 32% Quatro sheep fescue 32% Spartan II hard fescue 33% Eureka II hard fescue 3% Microclover 33% Mustang tall fescue 33% Grande 3 tall fescue 34% Fayette tall fescue 3% Microclover DLF/Pickseed/Seed Research of Oregon DLF/Pickseed/Seed Research of Oregon 10 Vitality Low Maintenance 80% VNS hard fescue Mixture 20% VNS chewings fescue Landmark Turf & Native Seed 11 Vitality Double Coverage 90% VNS tall fescue Mixture 10% VNS Kentucky bluegrass Landmark Turf & Native Seed 12 Chantilly 100% Chantilly strong creeping red fescue (CRF) Standard entry 13 Dutch White Clover 100% Dutch White Clover Standard entry DLFPS TFAStC 32% Mustang tall fescue 14 32% Grande 3 tall fescue DLF/Pickseed/Seed 33% Fayette tall fescue Research of Oregon 3% Strawberry clover 15 DLFPS ChCrSH 14% Longfellow 3 chewings fescue 14% Windward chewings fescue 14% Chantilly strong CRF 14% Ruddy strong CRF DLF/Pickseed/Seed Research of Oregon 16 Spartan II 100% Spartan II hard fescue Standard entry 17 Quatro 100% Quatro sheep fescue Standard entry 18 Ky-31E+ 100% Ky-31 tall fescue w/endophyte Standard entry CRS Mix #1 CRS Mix #2 CRS Mix #3 DTT Tall Fescue Mix 55% Gladiator hard fescue 45% 4GUD hard fescue 67% Gladiator hard fescue 33% NA13-14 Kentucky bluegrass 45% Gladiator hard fescue 45% Sword hard fescue 10% Dutch White Clover 50% DTT20 tall fescue 50% DTT43 tall fescue Columbia River Seed Columbia River Seed Columbia River Seed Allied Seed 95 Table of Contents
106 PLOT ENTRY SPECIES/COMPOSITION SPONSOR DTTHO TF/KBG Mix 45% DTT20 tall fescue 23 45% DTT43 tall fescue Allied Seed 10% Holiday lawn Ky. Bluegrass 24 A-SFT 100% A-SFT tall fescue Allied Seed 25 Kingdom 100% Kingdom tall fescue John Deere Landscapes 26 7H7 100% 7H7 hard fescue John Deere Landscapes 27 Northern Mixture 40% VNS perennial ryegrass 20% VNS Kentucky bluegrass 20% VNS chewings fescue Proseeds Marketing 20% VNS creeping red fescue 28 Southern Mixture 70% VNS tall fescue 10% VNS perennial ryegrass 10% VNS Kentucky bluegrass Proseeds Marketing 10% VNS chewings fescue 29 CS Mix 40% Castle chewings fescue 40% Sword hard fescue 10% Kent creeping red fescue Columbia Seeds LLC 10% B sheep fescue 30 Yaak 100% Yaak western yarrow Pacific NW Natives 31 Radar 100% Radar chewings fescue Standard entry 32 Kenblue 100% Kenblue Kentucky bluegrass Standard entry 96 Table of Contents
107 Table 2. NTEP Low Input Standard Test results 2016 Ratings for percent establishment, Percent Living cover for spring and fall, percent weed coverage for spring and fall, and monthly visual quality (rating 1-9, where 9 equals the highest turf quality) Establishment (%) Percent Living cover Percent weed coverage Quality Entry 10/4 5/31 10/17 Mean 6/21 9/18 Mean 4/19 5/26 6/21 7/14 8/16 9/18 10/17 11/16 Mean 7H CRS Mix # DLFPS-TFAM Yaak Vitality Low Maintenance Mix Southern Mixture CRS Mix # Bullseye MNHD DLFPS TF-A Spartan II DLFPS TFAStC Kingdom Quatro DTT Tall Fescue Mix CRS Mix # DLFPS-ChCrM Dutch White Clover DLFPS-ShHM Vitality Double Coverage Mix DLFPS ChCrSH BGR-TF Radar CS Mix DTTHO TF/KBG Mix Chantilly Ky-31 E Natural Knit PRG Mix Table of Contents
108 Northern Mixture Bewitched A-SFT Kenblue LSD CV% Table of Contents
109 Table 3. NTEP Low Input Ancillary Test results 2016 Ratings for percent establishment, Percent Living cover for spring and fall, percent weed coverage for spring and fall, and monthly visual quality (rating 1-9, where 9 equals the highest turf quality) Establishment (%) Percent Living cover Percent weed coverage Quality Entry 10/4 5/31 10/17 Mean 6/21 9/18 Mean 4/19 5/26 6/21 7/14 8/16 9/18 10/17 11/16 Mean DLFPS-TFAM DLFPS TFAStC DLFPS TF-A Bullseye MNHD CRS Mix # CRS Mix # Vitality Low Maintenance Mix Yaak Spartan II DTTHO TF/KBG Mix H CS Mix Kingdom Southern Mixture Radar CRS Mix # Vitality Double Coverage Mix DTT Tall Fescue Mix DLFPS ChCrSH A-SFT Natural Knit PRG Mix BGR-TF Chantilly Quatro DLFPS-ChCrM Ky-31 E DLFPS-ShHM Dutch White Clover Table of Contents
110 Northern Mixture Bewitched Kenblue LSD CV% Acknowledgements: This project is funded by the National Turfgrass Evaluation Program 100 Table of Contents
111 Efficacy Trials of EPA Minimum Exempt Products Victoria Wallace 1, Jason Henderson 2, John Inguagiato 2, Kevin Miele 2 and Scott Vose 2 Department of Extension 1 Dept. of Plant Science and Landscape Architecture 2 University of Connecticut INTRODUCTION On July 1, 2010, applications of federally registered lawn care pesticides were banned on the grounds of public and private schools from grades K-8 as a result of CT Public Act (P.A ). Since then, school grounds managers can only use pesticides that meet specific criteria for exemption from federal registration requirements as part of their maintenance programs for turfgrass athletic fields and school grounds. Manufacturers of exempt pesticides, also referred to as minimum risk or 25b pesticides are not required to provide information regarding the toxicity and efficacy of their products. Increased weed pressure affecting field quality and player safety is a primary concern for many school grounds managers. Turf managers often are challenged to identify products that actually control the target pests and regularly express frustration with product effectiveness. CT DEEP has provided a list of products that meet the requirements of minimum exempt pesticides and have been approved for use in Connecticut. However, there is a critical need to evaluate the efficacy of weed control products. The lack of product information often results in multiple or ineffective product applications. MATERIALS AND METHODS A field study was conducted at the Plant Science Research and Education Facility in Storrs, CT sq. ft. blocks of five weeds: crabgrass, white clover, dandelion, broadleaf plantain, and Stellar perennial ryegrass (PRG) were seeded in September Seeding rates of the weed species was 2 lb./m sq. ft. A 2 lb./m sq. ft. of Stellar PRG also was overseeded into the weed blocks to reduce erosion. The Stellar PRG block was seeded at 6 lb./m sq. ft. All blocks were maintained at a mowing height of 3 and mowed once a week. Clippngs were returned. The blocks of weeds and PRG were fertilized in May 2015, at the rate of 1 lb. N 1000-ft 2 of (Polyon). No supplemental irrigation was applied during establishment or in Treatment plots measuring 3 x 6 ft. were established on September 11, 2015 in each of the weed and perennial ryegrass blocks. The plots were set out as randomized complete block design with 3 replicates in each block. Treatments were identified as products that were included on the CT DEEP Pesticides Exempt from Federal Registration list or were commercially available with an EPA registration number. Treatments are listed in Table 1. CapSil, a non-ionic surfactant was included at a rate consistent with label recommendations for products that recommended the use of a surfactant. The broadleaf weed herbicide standard for the three broadleaf weed blocks (white clover, broadleaf plantain, and dandelion) was TZone (triclopyr). For the crabgrass weed block and the perennial ryegrass block, Acclaim (fenoxaprop-p-ethyl) was selected as the herbicide standard. Treatment plots were evaluated for percent weed cover before treatment evaluation was initiated. Treatments were applied at rates based on percent volume/volume. Plots were sprayed on September 11, 2015 and rated as visual percent weed affected and overall visual percent affected on 1DAT, 2DAT, 3DAT, 4DAT, 5DAT, 6DAT, 7DAT, 10DAT, 13DAT, 17DAT, and 20DAT. In April 2016, the PRG block was treated with prodiamine at the rate of.5 fl. oz./m. The PRG and crabgrass blocks were treated in May 2016 with 1.4 fl. oz. T-Zone. Also in May 2016,.5 lb./m was applied to all weed and ryegrass blocks. The crabgrass block was re-seeded with crabgrass seed in June 2016 at the rate of 2 lb./m. Treatment plots were re-randomized, and percent weed cover was noted before products were applied. Due to weed populations being eradicated or severely reduced in plots previously treated with T-Zone, a treatment was dropped with the re-randomization of the 2016 treatment plots (Table 2). The plots were sprayed on September 8, 2016 and rated as visual percent weed affected on 1DAT, 2DAT, 3DAT, 4DAT, 5DAT, 6DAT, 7DAT, 10DAT, 13DAT, 17DAT, and 20 DAT. Phytotoxicity was also assessed visually on a 0-5 scale, where 0 was equal to no discoloration and 5 represented complete injury to the vegetative canopy. RESULTS & DISCUSSION 2016 data is being analyzed. To date, no exempt minimum risk product trialed was selective in control of any of the weed blocks without causing injury to the turfgrass. In 2015, severe suppression of crabgrass, clover, dandelion, and plantain weed blocks, along with total suppression of the turfgrass, was exhibited 1-2DAT with Green Match, Nature s Avenger, and Phydura, which contained D-limonene (citric acid) as a component. BurnOut II also contained citric acid, but damage varied with the broadleaf weeds and was not as significant compared to the Green Match, Nature s Avenger, and Phydura. Treatments that contained clove oil has some burndown capacity, but the degree of damage to the vegetative canopy varied. TZone provided a gradual progressive suppression of broadleaf weeds, with control and visual impact after 10DAT (clover) to 17DAT (plantain). Fiesta and Whitney Farm, which both contained Fe HEDTA as a component, exhibited some selective suppression of white clover. However, re-growth of clover was observed after 10DAT for Fiesta and 5DAT for Whitney Farm. Fiesta also damaged the turfgrass in the crabgrass and broadleaf weed 101 Table of Contents


112 blocks, but not as severely as Green Match, Nature s Avenger and Phydura. Adios, BurnOut II, Weed Zap, and Matratec had varied degrees of suppression for all the broadleaf weeds. In general, BurnOut II had a higher degree of initial suppression for dandelion and plantain, although there was evidence of regrowth of the weeds after 7DAT. Comparing the ready-to-use products, Whitney Farm offered better suppression on dandelion than Ecosmart or Ecologic. However, all three offered less suppression and were less effective than the other burndown products on the broadleaf weeds. The strongest damage to the vegetative canopy of the broadleaf weeds occurred with Green Match, Phydura and Nature s Avenger. These products would serve temporarily to suppress weeds along fence rows, infields or other non-turf areas where glyphosate can no longer be used as the preferred option to reduce weeds on school properties. Regrowth of mature perennial broadleaf weeds would occur, but with frequent and repeated applications, it provides an alternative to physical removal. At the initiation of this project, products were selected that were approved and on the CT DEEP Pesticides Exempt from Federal Registration list, or were composed of minimum risk products, but were registered with a designated EPA registration number. Products were selected for the project based on distributor availability, as well as marketing and product recognition. All products were referenced to control broadleaf weeds. The intention of the project was to provide a vehicle for trialing minimum risk products in Connecticut as they are introduced to the turf and ornamental marketplace. However, vetting efficacy of new products approved by CT DEEP and available for commercial sale in CT, as well as adequately confirming the rate of recommended application, was found to have limitations. Few new weed control product introductions that would meet the requirements of inclusion for the CT DEEP Pesticides Exempt from Federal Registration list occurred during the course of the project. Moreover, shortly after the project began, it was observed that some products that had been promoted on the CT DEEP Pesticides Exempt from Federal Registration list had limitations with product availability. Some ready-to-use products (Whitney Farms, Ecologic, Ecosmart), formerly available at large home center box stores, had been discontinued by the manufacturer. Green Match and BurnOut II had been reformulated. The other products were available at only one or two distributors and would be a challenge to acquire if needed by a turf care professional. CONCLUSION Efficacy Trials of EPA Minimum Risk Exempt Pesticides The accelerated burndown of the crabgrass vegetative canopy would allow for an early fall overseeding advantage, if renovation without surface disruption of turfgrass areas was necessary. Turfgrass areas treated with burndown products could be scalped and overseeded into the areas treated with the non-selective burndown products with less competition for the new germinating seed. 102 Table of Contents
113 Table Minimum Risk Products Applied to Weed and PRG Blocks Treatment lbs. available # Product N/1000ft 2 /yr. 1 Adios-liquid Adios-granular w surfactant Matratec w surfactant Weed Zap w surfactant Green Match w surfactant Burn Out II-Conc Phydura Fiesta Nature s Avenger EcoSmart Whitney Farm Ecologic RTU T-Zone Untreated 2.6 Table Minimum Risk Products Applied to Weed and PRG Blocks Treatment lbs. available # Product N/1000ft 2 /yr. 1 Adios-liquid Adios-granular w surfactant Matratec w surfactant Weed Zap w surfactant Green Match w surfactant Burn Out II-Conc Phydura Fiesta Nature s Avenger Whitney Farm Ecologic RTU T-Zone Untreated Extra Plot 0 Product Active Ingredient On DEEP Approv ed List Adiosliquid 35.58% Sodium Yes Chloride, 64% other Adiosgranular 96.56% Sodium Yes Chloride BurnOut 24% Citric Acid, 8% Yes II-conc. Clove Oil, 68% Other Fiesta 26.52% Iron-HEDTA, No 73.48% Other Matratec 50% Clove Oil Yes Green 70% D-limonene Yes Match Ecologic Weed & Grass Killer- RTU EcoSma rt Weed & Grass Killer- RTU Nature's Avenger -Weed Killer (citric acid), 30% inert 5% Rosemary Oil, 5% Cinnamon oil, 5% Sodium Lauryl Sulfate, 85% Other 5% 2-Phenyl Propionate, 5% Eugenol, 0.05% Sodium Lauryl Sulfate, 89.95% Other 70% D-limonene (citric acid), 30% inert Phydura 20% Citric Acid, 15% Clove oil, 10% Malic Acid, Oleic Acid, Other Weed Zap Whitney Farm- RTU 45% Clove Oil, 45% Cinnamon Oil 1.5% Fe HEDTA, soybean oil Yes Yes No No Yes Yes 103 Table of Contents
114 TRANSCRIPTOME SEQUENCING OF THE shadow-1 PERENNIAL RYEGRASS (LOLIUM PERENNE, L.) MUTANT PROVIDES INSIGHT INTO GENETIC MECHANISMS LEADING TO DWARFISM AND SHADE TOLERANCE Lorenzo Katin-Grazzini, Wei Li, Rania El-Tanbouly, Huseyin Yer, Chandra S. Thammina, and Yi Li Department of Plant Science and Landscape Architecture University of Connecticut, Storrs INTRODUCTION Perennial ryegrass (Lolium perenne L.) is one of the most widely cultivated cool-season turfgrass species in the world. Known for its fast establishment, perennial ryegrass is favored for ornamental use, as well as for livestock grazing. While perennial ryegrass is incorporated into many seed mixtures due to its positive traits, it is seldom grown by itself because of its sensitivity to a number of environmental stressors (Stier 1999). Perennial ryegrass struggles to grow in overly shady environments, exhibiting the shade avoidance response (SAR), a condition characterized by weak growth, overly elongated leaves, and chlorosis (Franklin 2005). SAR, and other symptoms of shade stress, impact virtually all plant taxa, and high amounts of shade have a negative impact on the growth and development of all plants. Lack of light is a significant issue when growing plants in any context, from agricultural to ornamental. Low-light conditions greatly impede healthy plant growth, which is especially true for ornamental plants for which SAR can have a drastic impact on plant appearance. Furthermore, in congested areas, whether with buildings in urban areas or with trees in rural areas, it can be difficult to find growing space with adequate light exposure. Understanding the mechanisms behind shade tolerance would make it possible engineer solutions to the challenges of growing plants in low-light environments, thereby dramatically increasing the availability of potential growing spaces. shadow-1 is a dwarf, shade-tolerant perennial ryegrass mutant. When subjected to severe shade stress (95% light reduction) shadow-1 plants are significantly resistant to SAR in terms of leaf elongation and as well as their ability to maintain healthy color (Li and Katin-Grazzini 2016). The shadow-1 mutant line represents a valuable opportunity to study the shade response pathway in monocots. In an attempt to uncover the genetic mechanisms behind shade response in perennial ryegrass, we have sequenced and analyzed the transcriptome of the shadow-1 perennial ryegrass mutant. We have treated shadow-1 and wild-type plants with 95% shade and compared their transcriptomes to plants kept under full sunlight. Thorough examination of differential gene expression within the GA biosynthesis and response pathways of shadow-1 mutant plants, we demonstrated that a decrease in GA content was the likely mechanism for shade tolerance in these plants. These results provide some insight into the role that gibberellins may play in shade response, as well as possible strategies for the production of shade tolerant plants across all plant taxa. MATERIALS AND METHODS Plant Treatment and Tissue Sampling shadow-1 and wild-type plants were vegetatively propagated. Plant roots and shoots were first cut to a 2.5 cm length, and six groups of two tillers were evenly spread within each pot. Plants were maintained at a five cm height in full light for six weeks. Plants that were selected for shade-stress treatment were placed in a 95% shade environment in the greenhouse which was created by the use of black polyfiber cloth. Plants that were selected for full-sunlight treatment were left out in the open in the greenhouse. After growing for an additional two weeks under either full sunlight or 95% shade, leaf tissues were collected from six pots for each genotype (wild type and shadow-1) under each treatment (full sunlight and 95% shade), representing one biological replicate. Three replicates were collected for each genotype under each treatment. Tissues wre collected by cutting young leaves directly into a beaker of liquid nitrogen, in an effort to preserve mrna. For shadetreated plants, this was done in a darkroom environment to avoid light contamination, which might impact gene expression levels. RNA Extraction and Library Preparation Total plant RNA was extracted using the RNeasy Plant Mini Kit including RNase-Free DNase set (Qiagen, Valencia, CA, USA) according to the manufacturer's protocol. RNA purity and concentration were measured using the NanoDrop 2000 spectrophotometer (Thermo Fisher Scientific, Waltham, MA, USA). To further assess RNA quality, total RNA was analyzed on the Agilent TapeStation 2200 (Agilent Technologies, Santa Clara, CA, USA) using the RNA High Sensitivity assay. Ribosomal Integrity Numbers (RINe) were recorded for each sample. Only samples with RINe values above 7.0 were considered for library preparation. Total RNA samples were prepared for mrna-sequencing using the Illumina TruSeq Stranded mrna Sample Preparation kit following the manufacturer s protocol (Illumina, San Diego, CA, USA). Libraries were validated for length and adapter dimer removal using the Agilent TapeStation 2200 D1000 High Sensitivity assay (Agilent Technologies, Santa Clara, CA, USA) then quantified and normalized using the dsdna High Sensitivity Assay for Qubit 2.0 (Life Technologies, Carlsbad, CA, USA). Sample libraries were prepared for HiSeq2500 sequencing using version 4 sequencing chemistry in High Output mode (paired end 2 x 100bp read length). 104 Table of Contents
115 Differential Expression Analysis and Functional Annotation The generated clean reads were aligned to perennial ryegrass genome assembled by Byrne et al. (Bryne 2015) using Tophat software. Gene expression levels were identified by calculating reads per kilobase of transcript per million mapped reads (RPKM) values. Differentially expressed genes (DEGs) were defined as genes having a false discovery rate (FDR) 0.05 and an absolute log 2 fold change value 1. RESULTS Dwarfism and Shade Tolerance Analysis of shadow-1 Mutant Plants shadow-1 plants kept under full sunlight exhibited dwarfism, categorized by reduced canopy heights compared to wild type (Figure 1a). Following shade treatment, shadow-1 plants were found to be more tolerant to shade compared to wild type, as evidenced by a significant reduction in leaf elongation and the retention of healthy, green appearance (Figure 1b). These results are consistent with previously reported analysis of the shadow-1 mutant line. Differentially-Expressed Genes (DEGs) in the GA Biosynthesis Pathway We sequenced three replicates for each genetic background under each treatment. Transcriptome data were subject to four types of pairwise comparisons (WT-S/WT-L, S1-S/ S1-L, S1- L/WT-L, and S1-L/WT-L). WT-S/WT-L and S1-S/ S1-L showed differentially expressed genes (DEGs) identified by comparisons between shade treatment and full-light in wildtype or shadow-1 plants, respectively. S1-L/WT-L and S1- S/WT-S showed DEGs derived from comparisons between shadow-1 and wild-type plants under full-light and shade treatment, respectively Previously, we have found that the dwarfism and shade tolerance displayed in shadow-1 might be due to defects in GA pathway (Li et al., 2016). To uncover any potential differential gene expression within the GA biosynthesis pathway, we used sequence for the GA biosynthesis proteins from bread wheat (Triticum aestivum, a close relative of perennial ryegrass) in which GA biosynthesis genes are better categorized than in perennial ryegrass, and blasted them against the translated perennial ryegrass reference genome sequence. GA biosynthesis begins as an offshoot of the diterpenoid biosynthesis. Upstream GA biosynthesis begins with the successive editing of diterponoid products by the enzymes entcopalyl diphosphate synthase (CPS), which was downregulated 1.2x in S1-L/WT-L and 1.4x in S1-S/WT-S, followed by ent-kaurene synthase (KS), which was down-regulated 4.2x in S1-L/WT-L and 4.7x in S1-S/WT-S. The next steps of GA biosynthesis are goverened by ent-kaurene oxidase (KO), which was down-regulated 1.5x in S1-L/WT-L and 1.6x in S1-S/WT- S, followed ent-kaurenoic acid oxidase (KAO), which was down-regulated 1.6x in S1-L/WT-L and 1.9x in S1-S/WT-S. At this point, the GA biosynthesis splits into two pathways, one for GA 1 and another for GA 4, each of which are catalyzed by gibberellin 20 oxidase (GA20ox) followed by gibberellin 3 oxidase (GA3ox) (Figure 2). GA20ox was down-regulated 2.7x in S1-L/WT-L and 28.3x in S1-S/WT-S. We were unable to uncover putative homologs of GA3ox, as it has yet to be identified in bread wheat. These expression data demonstrate that all putative GA biosynthesis genes were down-regulated in shadow-1 plants compared to wild type for both S1-L/WT-L and S1-S/WT-S. In wild-type plants, GA levels are known to increase following exposure to shade stress, which was reflected in the up-regulation of KO, KAO, and GA20ox in wild-type following shade treatment. However, we identified a reduction in expression of both CPS and KS in wild-type plants treated with shade compared to wild-type kept under full sunlight (Figure 2). While these genes are a part of the GA-biosynthesis pathway, their activity is not unique to GA biosynthesis, therefore their down-regulation in shade-treated plants could be due to factors outside of the context of GA biosynthesis. The expression levels of GA biosynthesis genes varied wildly, with some, like KO, showing expression levels above 2000, and others, such as GA20ox, showing expression levels that never surpassed 100 (Figure 2). However, the expression of all of the GA biosynthesis genes identified in this study were lower in shadow-1 mutant plants compared to wild type for either treatment (full-sunlight or shade). These results suggest that there is a global degrease in GA biosynthesis within shadow-1 plants. This, combined with the results of previous publications, which demonstrate a direct link between decreased GA signaling and both dwarfism and shade tolerance, demonstrate that the reduced GA biosynthesis within shadow-1 plants is likely to play a role in the both the dwarf and shade tolerant phenotypes exhibited by these plants. DISCUSSION In this study, we used the Illumina HiSeq platform to explore the differential gene expression of shadow-1 mutant perennial ryegrass under shade stress to uncover the molecular mechanisms behind the shade tolerance exhibited by these plants. We found that all GA biosynthesis genes, with the exception of gibberellin 3 oxidase (GA3ox) which could not be identified through BLAST, were down-regulated in shadow-1 mutant plants compared to wild type regardless of light treatment. There were a number of interesting results generated in this study. The fact that there was a greater difference in gene expression between plants of the same genotype (shadow-1 or wild type) under different treatments (full-sunlight vs shade) than there was between plants of different genotypes under the same treatment suggests that the impact of mutagenesis was relatively small, compared to the impact of shade stress, for shadow-1 plants. Gamma radiation is known to have a dramatic impact on genomes, causing large deletions or rearrangements of DNA. This finding demonstrates the large-scale impact that shade stress has on plants, leading to substantially more differential gene expression than the impact of severe mutagenesis. This implies a great deal of complexity in the physiological responses perennial ryegrass to reduced light conditions, with broad-spectrum changes in gene expression implicating the participation of myriad gene pathways, even those outside of the umbrella of gibberellin signaling. 105 Table of Contents
116 The fact that there was a universal decrease in the expression of GA biosynthesis genes in shadow-1 mutant plants, under both full sunlight and shade conditions, strongly suggests that gibberellin signaling plays an important role for both dwarfism and shade tolerance in these plants. These results are not surprising, considering previous reports that both dwarfism and shade tolerance in shadow-1 plants can be abolished through exogenous application of gibberellic acid (GA 3 ) (Li et al., 2016). Interruption of GA biosynthesis, through the application of trinexapac-ethyl (TE), in wild type plants can lead to dwarfism and shade tolerance in these plants. TE blocks GA biosynthesis by disrupting the latter stages of GA biosynthesis, which has now been shown to be down-regulated in shadow-1 plants. The shadow-1 mutant line has a great deal of utility as a model plant for the study of molecular mechanisms leading to dwarfism and shade tolerance in plants. Both of these traits have utility for plant scientists and breeders in a number of fields, ranging from agriculture and horticulture to ornamental plant use. Dwarf plants have been shown to have increased crop yields in some cases, and could have reduced requirements for nutrients. Shade tolerant plants are able to thrive in environments that are traditionally unconducive to healthy plant growth, such as under tree canopies or in dense urban areas. Our transcriptome analysis uncovered a possible genetic mechanism behind both the dwarfism and shade tolerance displayed by shadow-1 mutant plants in the form of downregulation across the GA biosynthesis pathway. This information could be valuable to plant geneticists and breeders who are interested in developing new cultivars that have either, or both, of these traits. REFERENCES Colebrook, E.H., Thomas, S.G., Phillips, A.L. and Hedden, P., The role of gibberellin signalling in plant responses to abiotic stress. Journal of Experimental Biology, 217(1), pp Franklin, K.A. and Whitelam, G.C., Phytochromes and shade-avoidance responses in plants. Annals of Botany, 96(2), pp Li, W. and Katin-Grazzini, L., Krishnan, S., Thammina, C., El- Tanbouly, R., Yer, H., Merewitz, E., Guillard, K., Inguagiato, J., McAvoy, R.J. and Liu, Z., A novel two-step method for screening shade tolerant mutant plants via dwarfism. Frontiers in Plant Science, 7. Stier, J.C., Growing grass in shade. Cooperative Extension, University of Wisconsin--Extension. Toledo-Ortiz, G., Huq, E. and Rodríguez-Concepción, M., Direct regulation of phytoene synthase gene expression and carotenoid biosynthesis by phytochrome-interacting factors. Proceedings of the National Academy of Sciences, 107(25), pp Table of Contents
 Wild type (left) and shadow-1 plants (right) after two weeks under 95% artificial shade (~600 lux) in the greenhouse.")

117 RPKM RPKM A B Figure 1: shadow-1 plants exhibit a dual phenotype of dwarfism and shade tolerance. (A) Wild type (left) and shadow-1 plants (right) after two weeks under 95% artificial shade (~600 lux) in the greenhouse. (B) Wild type (left) and shadow-1 plants grown in the greenhouse under full sunlight (~12,000 lux). A GA biosynthesis genes [High Expression] B GA biosynthesis genes [Low Expression] CPS KO KAO 0 KS GA20ox WT-L M-L WT-S M-S WT-L M-L WT-S M-S Figure 2: GA biosynthesis genes were downregulated in shadow-1. Expression data is split into two graphs for ease of viewing. (A) High expression (~1000 reads). (B) Low expression (~100 reads). Bars represent the expression data (# of mapped reads) for GA biosynthesis genes averages across three replicates. M-L = mutant shadow-1 plants kept under full sunlight, M-S = mutant shadow-1 plants treated with 95% shade, WT-L = wild type plants kept under full sunlight, WT-S = wild type plants treated with 95% shade. CPS = ent-copalyl diphosphate synthase, KS = ent-kaurene synthase, KO = ent-kaurene oxidase, KAO = ent-kaurenoic acid oxidase. 107 Table of Contents
Eye-in-the-Sky: A Drone s View of the UConn Turfgrass Science Research Plots
 Eye-in-the-Sky: A Drone s View of the UConn Turfgrass Science Research Plots Cover photo: Looking south across the University of Connecticut, Department of Plant Science and Landscape Architecture s Research
Establishing Tall Fescue NTEP Trial
 Establishing Tall Fescue NTEP Trial Cover photo: UConn Turfgrass Science support staff, graduate students, and researchers preparing and seeding the tall fescue National Turfgrass Evaluation Program (NTEP)
Evaluating Season-Long Fungicide Programs for Dollar Spot Control on Creeping Bentgrass Putting Green Turf, 2017
 Evaluating Season-Long Fungicide Programs for Dollar Spot Control on Creeping Bentgrass Putting Green Turf, 2017 Principal Investigator Joseph Roberts Technical Assistant Getaneh Achenef 14 6 13 5 3 1
2015 Turfgrass Proceedings
 2015 Turfgrass Proceedings The New Jersey Turfgrass Association In Cooperation with Rutgers Center for Turfgrass Science Rutgers Cooperative Extension 2015 RUTGERS TURFGRASS PROCEEDINGS of the GREEN EXPO
Curative dollar spot control on a creeping bentgrass and annual bluegrass putting green, 2012.
 CREEPING BENTGRASS (Agrostis stolonifera L-93 ) ANNUAL BLUEGRASS (Poa annua) Dollar Spot; (Sclerotinia homoeocarpa) J. Popko and G. Jung Stockbridge School of Agriculture University of Massachusetts Amherst,
Objective: How it Was Done:
 Evaluation of Foliarly Applied Nutrient Sources, Primer Wetting Agent and Paclobutrazol for Creeping Bentgrass Fairway Management, 2003 Cale Bigelow, Glenn Hardebeck, and Kristie Walker Objective: How
Table 11. Brown Patch on Ryegrass Location: Hancock Turfgrass Research Center, E. Lansing, MI Rating Scale: Percent area infected with brown patch.
 Brown Patch (Rhizoctonia solani) A preventive brown patch study was set up on a ryegrass plot area at the Hancock Turfgrass Research Center, E. Lansing, MI. The study was set in a randomized complete block
2014 Turfgrass Proceedings
 2014 Turfgrass Proceedings The New Jersey Turfgrass Association In Cooperation with Rutgers Center for Turfgrass Science Rutgers Cooperative Extension 2014 RUTGERS TURFGRASS PROCEEDINGS of the GREEN EXPO
2015 Turfgrass Proceedings
 2015 Turfgrass Proceedings The New Jersey Turfgrass Association In Cooperation with Rutgers Center for Turfgrass Science Rutgers Cooperative Extension 2015 RUTGERS TURFGRASS PROCEEDINGS of the GREEN EXPO
20 Turfgrass Proceedings
 20 Turfgrass Proceedings The New Jersey Turfgrass Association In Cooperation with Rutgers Center for Turfgrass Science Rutgers Cooperative Extension 2010 RUTGERS TURFGRASS PROCEEDINGS of the GREEN EXPO
2012 Turfgrass Proceedings
 2012 Turfgrass Proceedings The New Jersey Turfgrass Association In Cooperation with Rutgers Center for Turfgrass Science Rutgers Cooperative Extension 2012 RUTGERS TURFGRASS PROCEEDINGS of the GREEN EXPO
Fungicide Report
 2008-2009 Fungicide Report Department of Plant Pathology Michigan State University Dr. J. M. Vargas, Jr., Nancy Dykema, Ron Detweiler, Kevin Bishop, Eric Largent, Michael Wandersee, Kyle Fischer, Kristen
Fungicide Research Report
 2006-2007 Fungicide Research Report Department of Plant Pathology Michigan State University J.M. Vargas, Jr., N.M. Dykema, and A.R. Detweiler, R. Hafer, D. Plemmons, E. Galbraith, K. Dykema, B. Doozan,
2008 Turfgrass Proceedings
 2008 Turfgrass Proceedings The New Jersey Turfgrass Association In Cooperation with Rutgers Center for Turfgrass Science Rutgers Cooperative Extension 2008 RUTGERS TURFGRASS PROCEEDINGS of the New Jersey
2013 UMass Snow Mold Data Summary
 2013 UMass Snow Mold Data Summary Turfgrass Pathology Lab Stockbridge School of Agriculture 100 French Hall 230 Stockbridge Road Amherst, MA 01003 SNOW MOLD TRIAL SUPPORTERS THANK YOU AMVAC Chemical Products
Objective: Procedures:
 Evaluation of Commercially Available Plant Growth Regulator Programs for Creeping Bentgrass Fairway Management, 2003 Cale Bigelow, Glenn Hardebeck, and Kristie Walker Objective: Procedures: To evaluate
2013 Turfgrass Proceedings
 2013 Turfgrass Proceedings The New Jersey Turfgrass Association In Cooperation with Rutgers Center for Turfgrass Science Rutgers Cooperative Extension 2013 RUTGERS TURFGRASS PROCEEDINGS of the GREEN EXPO
2008 Turfgrass Proceedings
 2008 Turfgrass Proceedings The New Jersey Turfgrass Association In Cooperation with Rutgers Center for Turfgrass Science Rutgers Cooperative Extension 2008 RUTGERS TURFGRASS PROCEEDINGS of the New Jersey
2013 Turfgrass Proceedings
 2013 Turfgrass Proceedings The New Jersey Turfgrass Association In Cooperation with Rutgers Center for Turfgrass Science Rutgers Cooperative Extension 2013 RUTGERS TURFGRASS PROCEEDINGS of the GREEN EXPO
2007 Turfgrass Proceedings
 2007 Turfgrass Proceedings The New Jersey Turfgrass Association In Cooperation with Rutgers Center for Turfgrass Science Rutgers Cooperative Extension 2007 RUTGERS TURFGRASS PROCEEDINGS of the New Jersey
Dollar Spot (Rutstroemia floccosum)
") Dollar Spot (Rutstroemia floccosum) This study was set up in 4 replicates of a random block design with 2 x 6 plots. Treatments were applied using a CO 2 backpack sprayer with a single nozzle boom at 34
Dollar Spot (Rutstroemia floccosum) This study was set up in 4 replicates of a random block design with 2 x 6 plots. Treatments were applied using a CO 2 backpack sprayer with a single nozzle boom at 34
E. Lyons, K. Jordan, and K. Carey. Department of Plant Agriculture and the Guelph Turfgrass Institute, University of Guelph, Ontario.
 Sponsor: Evaluation of turfgrass seed mixtures under low input and standard home lawn maintenance regimes E. Lyons, K. Jordan, and K. Carey Department of Plant Agriculture and the Guelph Turfgrass Institute,
OBJECTIVES METHODS. Site Characteristics
 APPLICATION OF CIVITAS IN LATE FALL IMPROVES TURF QUALITY IN THE SPRING Darrell Michael, Glen Obear, and Bill Kreuser, Ph.D. Department of Agronomy and Horticulture University of Nebraska Lincoln OBJECTIVES
EPA Reg. No (Except California) REVISED USE DIRECTIONS FOR CREEPING BENTGRASS, PERENNIAL RYEGRASS AND BERMUDAGRASS
 REVISED USE DIRECTIONS FOR CREEPING BENTGRASS, PERENNIAL RYEGRASS AND BERMUDAGRASS") Supplemental Label EPA Reg. No. 59639-136 (Except California) REVISED USE DIRECTIONS FOR CREEPING BENTGRASS, PERENNIAL RYEGRASS AND BERMUDAGRASS DIRECTIONS FOR USE It is a violation of Federal law to use
Supplemental Label EPA Reg. No. 59639-136 (Except California) REVISED USE DIRECTIONS FOR CREEPING BENTGRASS, PERENNIAL RYEGRASS AND BERMUDAGRASS DIRECTIONS FOR USE It is a violation of Federal law to use
Summer Stress Syndrome in Bentgrass
 Summer Stress Syndrome in Bentgrass This trial was conducted on a Penncross creeping bentgrass green at the Hancock Turfgrass Research Center, E. Lansing, MI. The plot area was mowed at 0.130. Fertility
2007 Evaluation of Fungicides and Fungicide Programs for the Control of Anthracnose on Annual Bluegrass Putting Greens
 2007 Evaluation of Fungicides and Fungicide Programs for the Control of Anthracnose on Annual Bluegrass Putting Greens Brian McDonald, Research Assistant Tom Cook, Associate Professor Oregon State University
Chemical control of brown ring patch
 Chemical control of brown ring patch Results from three trial locations show that some fungicides on the market provide control of brown ring patch disease. This research was funded in part by The Environmental
EVALUATION OF THE BIOFUNGICIDE ECOGUARD (BACILLUS LICHENIFORMIS) ON DOLLAR SPOT CONTROL WHEN USED ALONE OR IN COMBINATION WITH FUNGICIDES, 2010
 ON DOLLAR SPOT CONTROL WHEN USED ALONE OR IN COMBINATION WITH FUNGICIDES, 2010") EVLUTION OF THE IOFUNGIIE EOGUR (ILLUS LIHENIFORMIS) ON OLLR SPOT ONTROL WHEN USE LONE OR IN OMINTION WITH FUNGIIES, 2010 J.E. Kaminski and T. Lulis epartment of rop and Soil Science The Pennsylvania State
EVLUTION OF THE IOFUNGIIE EOGUR (ILLUS LIHENIFORMIS) ON OLLR SPOT ONTROL WHEN USE LONE OR IN OMINTION WITH FUNGIIES, 2010 J.E. Kaminski and T. Lulis epartment of rop and Soil Science The Pennsylvania State
Syngenta Fungicides to Control Snow Mold on Putting Greens in Montana and Washington
 Syngenta Fungicides to Control Snow Mold on Putting Greens in Montana and Washington 2012-2013 Syngenta protocol#: F12-DKM-T-16 and FDI803A3-2012US Charles T. Golob and William J. Johnston Dept. Crop and
UF IFAS COOPERATIVE FUNGICIDE EFFICACY PROGRAM Report. Philip F. Harmon, UF IFAS Plant Pathology
 UF IFAS COOPERATIVE FUNGICIDE EFFICACY PROGRAM Report Philip F. Harmon, UF IFAS Plant Pathology Distributed: North Central Florida Field Day July 17 and 18, 2007 Updates and future reports available on
Brian McDonald, Oregon State University, October 7 th, 2014 MICRODOCHIUM PATCH DISEASE MANAGEMENT IN PNW 10 YEARS OF RESEARCH
 Brian McDonald, Oregon State University, October 7 th, 2014 MICRODOCHIUM PATCH DISEASE MANAGEMENT IN PNW 10 YEARS OF RESEARCH Factors Affecting Development Microdochium Patch Mid September through mid
Influence of fungicides on the curative and preventive suppression of select diseases of golf course putting greens,
 Influence of fungicides on the curative and preventive suppression of select diseases of golf course putting greens, 2009-2010 J.E. Kaminski and T. Lulis Department of Crop and Soil Science The Pennslvania
Research Update: Disease Management by Christian Baldwin, Ph.D.
 Research Update: Disease Management by Christian Baldwin, Ph.D. L-93 is generally regarded by golf course superintendents as the gold standard in dollar spot resistance. For example, researchers at Rutgers
UF IFAS COOPERATIVE FUNGICIDE EFFICACY PROGRAM Report Philip F. Harmon, UF IFAS Plant Pathology
 UF IFAS COOPERATIVE FUNGICIDE EFFICACY PROGRAM Report 2007 Philip F. Harmon, UF IFAS Plant Pathology Distributed: North Central Florida Field Day May 21 and 22, 2008 Updates and future reports available
FUNGICIDE REPORT J.M. Vargas, Jr., A. R. Detweiler and N. M. Dykema Department of Botany and Plant Pathology Michigan State University
 1998-99 FUNGICIDE REPORT J.M. Vargas, Jr., A. R. Detweiler and N. M. Dykema Department of Botany and Plant Pathology Michigan State University Melting Out Fungicide Trial, 1999 The 1999 melting out (Dreschlera
TURF DISEASES (Commercial)
") TURF DISEASES (Commercial) Terry Spurlock Brown Patch 0.2 - Apply in 2-4 gals water/1,000 sq ft every 14-28 days as a preventative during warm, humid weather favorable for the disease. Use the higher rate
TURF DISEASES (Commercial) Terry Spurlock Brown Patch 0.2 - Apply in 2-4 gals water/1,000 sq ft every 14-28 days as a preventative during warm, humid weather favorable for the disease. Use the higher rate
Dedicated to fighting evils, StressGard TM Formulation Technology never rests.
 Dedicated to fighting evils, StressGard TM Formulation Technology never rests. 02 :::::::::::::::::::::::::::::::::::::::::::::::::::::::::::::::::::::::::::::::::::::::::::::::::::::::::::::::::::::::::::::::::::::::::::::::::::::::::::::::::::::::::::::
IR-4 Ornamental Horticulture Program Research Report Cover Sheet
 20160120q.pdf IR4 Ornamental Horticulture Program Research Report over Sheet Researcher(s) William Kirk Trial: 2015 MI Affiliation: Michigan State University PhoneNumber: Email: Lansing MI ProjectTitle:
Evaluation of Fungicides from Bayer to Control Pink and Gray Snow Mold on Putting Greens in Idaho and Washington
 Evaluation of Fungicides from Bayer to Control Pink and Gray Snow Mold on Putting Greens in Idaho and Washington 2006-07. Charles T. Golob, William J. Johnston, and Karine Paré Dept. Crop and Soil Sciences
The Biology & Management of Brown Ring Patch (aka Waitea Patch)
") The Biology & Management of Brown Ring Patch (aka Waitea Patch) Frank P. Wong Department of Plant Pathology & Microbiology University of California, Riverside 2011 Great Lakes Turf Trade Expo Grand Rapids,
The Biology & Management of Brown Ring Patch (aka Waitea Patch) Frank P. Wong Department of Plant Pathology & Microbiology University of California, Riverside 2011 Great Lakes Turf Trade Expo Grand Rapids,
Management of Poa annua on Overseeded Fairways
 Management of Poa annua on Overseeded Fairways Principal Investigators: Wendy Gelernter, Ph.D. and Larry J. Stowell, Ph.D., CPPP, CPAg Cooperator: Bill Kostes, Desert Dunes Golf Club Sponsors: AgrEvo,
2008 Turfgrass Proceedings
 2008 Turfgrass Proceedings The New Jersey Turfgrass Association In Cooperation with Rutgers Center for Turfgrass Science Rutgers Cooperative Extension 2008 RUTGERS TURFGRASS PROCEEDINGS of the New Jersey
Towards more sustainable use of pesticides on golf courses - Integrated disease management for turf
 Towards more sustainable use of pesticides on golf courses - Integrated disease management for turf NGF Conference 23 November 2011 Simon Watson Technical Manager Turf & Landscape EAME Integrated Turf
Evaluation of Syngenta products to control of pink and gray snow mold in Washington, Idaho, and Montana
 Evaluation of Syngenta products to control of pink and gray snow mold in Washington, Idaho, and Montana. 2003-2004. Charles T. Golob, M.S., and William J. Johnston, Ph.D. Crop & Soil Sciences Washington
1999 RUTGERS Turfgrass Proceedings
 1999 RUTGERS Turfgrass Proceedings Rutgers University THE NEW JERSEY TURFGRASS ASSOCIATION In Cooperation With RUTGERS COOPERATIVE EXTENSION NEW JERSEY AGRICULTURAL EXPERIMENT STATION RUTGERS, THE STATE
40 GENERAL SESSION - HIGHLIGHTS AND UPDATES
 40 GENERAL SESSION - HIGHLIGHTS AND UPDATES Treatment Ratell 000 tic I II III Avg OMR (.05)a GS/SM 92-17 65 80 75 73.3 B-H GS/SM 92-17 + 18-4-10 ---- + I Ib N 75 70 85 76.7 A-H IClA 5504 (JFI2795) 2.5
IR-4 Ornamental Horticulture Program Research Report Cover Sheet
 20151021b.pdf IR4 Ornamental Horticulture Program Research Report over Sheet Researcher(s) Gary hastagner Trial: 2015 WA Affiliation: Washington State University Pullayup WA PhoneNumber: (253) 4454528
2007 Turfgrass Research Report. In Cooperation With The
 2007 Turfgrass Research Report In Cooperation With The TABLE OF CONTENTS Page Disclaimer....................................................................1 HERBICIDE EVALUATIONS Creeping Bentgrass Conversion
TIMELY INFORMATION Agriculture & Natural Resources
 PLANT PATHOLOGY SERIES TIMELY INFORMATION Agriculture & Natural Resources Quash Fungicide Now Available for Foliar and Soil Control on Peanut A. K. Hagan Professor and Extension Plant Pathologist Newly
Enclosed are the tissue analysis results for the samples from the greens at Golf Club.
 Enclosed are the tissue analysis results for the samples from the greens at Golf Club. The results for nitrogen, phosphorus, potassium, calcium, magnesium, sulfur, and sodium are reported on a percent
CONTROL OF BLACK TURFGRASS ATAENIUS ADULTS AND GRUBS WITH ADULTICIDES AND LARVICIDES
 CONTROL OF BLACK TURFGRASS ATAENIUS ADULTS AND GRUBS WITH ADULTICIDES AND LARVICIDES Principal Investigators: Wendy Gelernter, Ph.D. and Larry J. Stowell, Ph.D. Cooperator: Bill Gallegos, Los Coyotes Country
Chapter 2. Perennial and Intermediate Ryegrass Varietal Effect on Overseeded Bermudagrass. Fairway Performance and Post Dormancy Transition
 Chapter 2 Perennial and Intermediate Ryegrass Varietal Effect on Overseeded Bermudagrass Fairway Performance and Post Dormancy Transition Introduction Conventional plant breeding as defined by Vogel and
Research Update: Effects of Alterna5ves to Tradi5onal Fungicide and Winter Fer5liza5on Prac5ces on Microdochium Patch
 Research Update: Effects of Alterna5ves to Tradi5onal Fungicide and Winter Fer5liza5on Prac5ces on Microdochium Patch Clint Ma)ox, Alec Kowalewski, and Brian McDonald Department of Hor
Research Update: Determining Soil Potassium Requirements of Sand Based Putting Greens
 Research Update: Determining Soil Potassium Requirements of Sand Based Putting Greens An interim report to the Canadian Allied Turfgrass Research Office, 15 Sept. 2015 Doug Soldat, Ph.D. University of
SNOW MOLDS AND BLIGHTS
 SNOW MOLDS AND BLIGHTS Pink Snow Mold Fusarium Patch Gray Snow Mold Sclerotinia Patch Cottony Snow Mold Frost Scorch Pythium Snow Blight Microdochium nivale Microdochium nivale Typhula incarnata, T. ishikariensis
Fungicide Alternatives for the Management of Microdochium Patch Introduction: Experiments 1 and 2 Experiments 3 and 4 Experiment 5 Experiment 6
 Fungicide Alternatives for the Management of Microdochium Patch Clint Mattox, Alec Kowalewski, and Brian McDonald Oregon State University May 2017 Introduction: Previous trials indicated promising results
Funding: (REVENUE) for three year study starting October September CTRF: $35,000/yr to Univ. Guelph [TF52548], total $105,000
![Funding: (REVENUE) for three year study starting October September CTRF: $35,000/yr to Univ. Guelph [TF52548], total $105,000](/thumbs/88/115782085.jpg "Funding: (REVENUE) for three year study starting October September CTRF: $35,000/yr to Univ. Guelph [TF52548], total $105,000") CTRF Annual Progress Report for Project CTRF 2015-2a (covering Oct 1, 2017 to March 1, 2018) RESEARCHER: Dr. Tom Hsiang, University of Guelph GRADUATE STUDENTS: Kate Stone and Matt Rudland PROJECT TITLE:
CTRF Annual Progress Report for Project CTRF 2015-2a (covering Oct 1, 2017 to March 1, 2018) RESEARCHER: Dr. Tom Hsiang, University of Guelph GRADUATE STUDENTS: Kate Stone and Matt Rudland PROJECT TITLE:
SO SIMPLE SO EFFECTIVE?
 888-982-2220 Progressive Turf How can something SO SIMPLE be SO EFFECTIVE? This is the question we are continually asked by golf course superintendents and turf managers. Simply stated, we capture nature
Turfgrass and Environmental Research Online
 Turfgrass and Environmental Research Online...Using Science to Benefit Golf This field study examined the impact of six products that contained cytokinians and other plant extracts, N or Fe and/or various
TURFGRASS FUNGICIDE RESEARCH REPORT J. M. Vargas, Jr., and R. Detweiler Department of Botany and Plant Pathology Michigan State University
 TURFGRSS FUNGC RESERCH REPORT - J. M. Vargas, Jr., and R. Detweiler Department of Botany and Plant Pathology Michigan State University Snow Mold Fungicide - Fertility Trials - - Boyne Highlands Resorts,
Evaluation of Fungicides from LESCO to Control of Pink and Gray Snow Mold on Putting Greens in Idaho and Washington
 Evaluation of Fungicides from LESCO to Control of Pink and Gray Snow Mold on Putting Greens in Idaho and Washington 2006-2007. Charles T. Golob, William J. Johnston, and Karine Paré Dept. Crop and Soil
2006- Foliar insecticide effects on soybean aphid and soybean yield. Summary Background Objective Site and application description
 2006- Foliar insecticide effects on soybean aphid and soybean yield. Bruce Potter, Jeff Irlbeck, Jodie Getting University of Minnesota Southwest Research and Outreach Center Summary Insecticides were applied
University of Georgia, Cooperative Extension Service
 Bermudagrass Cultivar Tolerance to : Seeded Cultivars Trial ID: HerbTol 02-06 Seeded Location: Griffin Study Director: Evans & Bennett Investigator: Clint Waltz General Trial Information Investigator:
EVALUATION OF THE PERFORMANCE OF HUMIC ACID PRODUCTS IN TURFGRASS MANAGEMENT. K. Carey and E. Gunn
 EVALUATION OF THE PERFORMANCE OF HUMIC ACID PRODUCTS IN TURFGRASS MANAGEMENT K. Carey and E. Gunn Guelph Turfgrass Institute and Dept. of Plant Agriculture, Horticulture Division Sponsor:Luscar Ltd. OBJECTIVE
PREVENTIVE CONTROL OF DOLLAR SPOT, RED LEAF SPOT, AND BROWN PATCH ON A CREEPING BENTGRASS RESEARCH PUTTING GREEN WITH VARIOUS BAYER FUNGICIDES
 PRVNTIV ONTROL O OLLAR SPOT, R LA SPOT, AN ROWN PATH ON A RPING NTGRASS RSARH PUTTING GRN WITH VARIOUS AYR UNGIIS INTROUTION T. Lulis,. Stephens, P. Rollo,. arroll, and J.. Kaminski epartment of Plant
Alternatives for turfgrass disease control without synthetic pesticides. Fusarium Patch Disease Management. Disease Management
 Alternatives for turfgrass control without synthetic pesticides The University of Guelph Canada Tom Hsiang University of Guelph Ontario, Canada thsiang@uoguelph.ca Greywolf GC, BC, Canada United States
2015 Evaluation of In-Furrow and Foliar Fungicides for Disease Control in Peanut, Jay, FL
 201 Evaluation of In-Furrow and Foliar Fungicides for Disease Control in Peanut, Jay, FL John Atkins and Barry Brecke This report includes a summary of the 201 in-furrow and foliar fungicide programs for
Crop Disease Management Row Crop Short Course March 1 st, 2018
 Crop Disease Management ---------------------------------------- Row Crop Short Course March 1 st, 2018 Nicholas S. Dufault Extension Specialist Row Crops & Vegetables Plant Pathology Department/IFAS University
Ohio Vegetable & Small Fruit Research & Development Program 2007 Report on Research
 Ohio Vegetable & Small Fruit Research & Development Program 2007 Report on Research Project Title: New Corn Earworm Management for Fresh Market Sweet Corn Principal Investigator(s): Jim Jasinski, Celeste
2003 Turfgrass Research Report. In Cooperation With The
 2003 Turfgrass Research Report In Cooperation With The TABLE OF CONTENTS Page Disclaimer... 1 2003 In-Kind Support... 2 2003 Financial Support... 3 TOPDRESSING, NTEP, and SOIL AMENDMENT EVALUATIONS Evaluation
WATERMELON 2006 Powdery Mildew Control Trial in Stanislaus County
 WATERMELON 2006 Powdery Mildew Control Trial in Stanislaus County University of California Cooperative Extension 3800 Cornucopia Way, Ste. A Modesto, CA 95358 ACKNOWLEDGEMENTS Many thanks to Ratto Bros.,
2015 Field Trials Report. GRDC Project: Australian Cereal Rust Control Programme (ACRCP) Integrated Fungicide Management (IFM) Programme
 Integrated Fungicide Management (IFM) Programme") 2015 Field Trials Report GRDC Project: Australian Cereal Rust Control Programme (ACRCP) Integrated Fungicide Management (IFM) Programme GRDC Project No: FAR00002 May 30 th 2016 Foundation for Arable Research
2015 Field Trials Report GRDC Project: Australian Cereal Rust Control Programme (ACRCP) Integrated Fungicide Management (IFM) Programme GRDC Project No: FAR00002 May 30 th 2016 Foundation for Arable Research
LYGUS BUG MANAGEMENT IN SEED ALFALFA. Eric T. Natwick and M. Lopez 1 ABSTRACT
 LYGUS BUG MANAGEMENT IN SEED ALFALFA Eric T. Natwick and M. Lopez 1 ABSTRACT Lygus bugs, Lygus spp., are a common pest of alfalfa grown for seed in California. Alfalfa seed producers and their pest control
CoRoN Enhancement of Pumpkin Fungicides: Effects on Foliar Diseases. Craig H. Canaday and Jim E. Wyatt, University of Tennessee
 CoRoN Enhancement of Pumpkin Fungicides: Effects on Foliar Diseases Craig H. Canaday and Jim E. Wyatt, University of Tennessee Kent Cushman, Mississippi State University Interpretative Summary The effect
Knockdown and Residual Control of Bagrada Bug With Foliar Insecticides in Broccoli: 2013 Efficacy Report
 Knockdown and Residual Control of Bagrada Bug With Foliar Insecticides in Broccoli: 2013 Efficacy Report John C. Palumbo, Yuma Agricultural Center Preventing adult Bagrada bugs, Bagrada hilaris, from feeding
2013 Johnsongrass Control Trials
 2013 Johnsongrass Control Trials Introduction Johnsongrass is a perennial warm season grass, listed as a noxious weed, and a common problem on right-of-way sites. There are a number of herbicides labeled
2012 Johnsongrass Control Trials
 2012 Johnsongrass Control Trials Introduction Johnsongrass is a perennial warm season grass, listed as a noxious weed, and a common problem on right-of-way sites. There are a number of herbicides labeled
Commercial Crop Production Turfgrass
 Integrated Disease Management Effective turfgrass disease management can be achieved by maintaining healthy and vigorously growing grass. Diseases can be avoided by selecting resistant cultivars and turfgrass
APPROVED LABEL TEXT May 2007 NAN 1503 of Water dispersible granule formulation containing 500g/kg azoxystrobin
 APPROVED LABEL TEXT NAN 1503 of 2007 HERITAGE Product registration number: MAPP 13536 F Water dispersible granule formulation containing 500g/kg azoxystrobin A systemic strobilurin fungicide for the control
The Response of Kentucky Bluegrass Turf to Varying Nitrogen Sources Christopher J. Blume, Nick Christians, and Y.K. Joo Iowa State University 2005
 The Response of Kentucky Bluegrass Turf to Varying Nitrogen Sources Christopher J. Blume, Nick Christians, and Y.K. Joo Iowa State University 2005 Introduction: The objectives of the 2005 nitrogen (N)
2016 FUNGICIDE GUIDE FOR BURLEY AND DARK TOBACCO
 PPFS-AG-T-08 PLANT PATHOLOGY FACT SHEET 2016 FUNGICIDE GUIDE FOR BURLEY AND DARK TOBACCO By Emily Pfeufer 1 and Bob Pearce 2 1 Extension Plant Pathologist Department of Plant Pathology 2 Extension Tobacco
T-NEX FOR TURF GROWTH MANAGEMENT
 T-NEX 1 AQ FOR TURF GROWTH MANAGEMENT Contains trinexapac-ethyl, the active ingredient used in Primo Maxx. Quali-Pro T-NEX 1 AQ is not manufactured or distributed by Syngenta Crop Protection, Inc. A microemulsion
Treatments protocol # Sponsor Materials Timing/interval FP/ac Tol 1 lab non-treated Y 2 lab Thiram 65WSB 14d 3.0 lb Y
 Cooperative Research Project, Doug Gubler, U.C. Davis Dept. of Plant Pathology Final Report Trial name... MBA Strawberry Anthracnose and Botrytis Fruit Rot and Powdery Mildew Trial, 2003 Location... Montery
Texas Panhandle Sorghum Hay Trial 2008
 Texas Panhandle Sorghum Hay Trial 2008 Brent Bean 1, Bob Villarreal 2, Jürg Blumenthal 3, Jake Robinson 2, Rex Brandon 2, Ted McCollum 4, Rex VanMeter 2, and Dennis Pietsch 5 Introduction This was the
R E S E A R C H. Cornell #5 Program: Plant Food 1. The Liquid Fertilizer Experts
 Cornell Update 2003 performance summary of competitive liquid programs Mixed stand of creeping bentgrass (Penn G-2) and annual bluegrass Subjected to 30,000 rounds of simulated non-metal spike traffic
Eggplant, Pepper, and Tomato. Early Blight. Identification and Life Cycle. Plant Response and Damage
 Eggplant, Pepper, and Tomato Early Blight Howard F. Schwartz and David H. Gent Identification and Life Cycle Early blight is a disease of tomato, pepper and eggplant caused by the fungus Alternaria solani,
Kern County Vegetable Crops
 Kern County Vegetable Crops November 2012 Flea Beetle Damage being Misdiagnosed as Cavity Spot in Carrots Joe Nunez and David Haviland UC Cooperative Extension, Kern Co. For the past few years carrot growers
Timing of Burn Down Herbicides Before Overseeding
 Timing of Burn Down Herbicides Before Overseeding Burn down herbicide trial at Toscana Country Club, Indian Wells, CA. Picture taken on 17 October 2012, one day before overseeding and prior to scalping
Foliar fungicide effects on soybean disease suppression, senescence and yield I.
 Foliar fungicide effects on soybean disease suppression, senescence and yield I. Bruce Potter, Jeff Irlbeck, Jodie Getting University of Minnesota Southwest Research and Outreach Center Summary Foliar
TURFGRASS SOIL MANAGEMENT RESEARCH REPORT P.E. Rieke and S. L. McBurney Crop and Soil Sciences, M.S.U.
 TURFGRASS SOIL MANAGEMENT RESEARCH REPORT - 1984 P.E. Rieke and S. L. McBurney Crop and Soil Sciences, M.S.U. This report summarizes turf research conducted at the Hancock Turfgrass Center in 1984 and
CONTENTS. Early Blight Fungicide Trials...2 o Early blight degree days o Early blight fungicide trial...4
 CONTENTS Early Blight Fungicide Trials.......2 o Early blight degree days - 2012...3 o Early blight fungicide trial...4 Root Knot Nematode Degree Days..... 18 SLV Late Blight Forecasting Data - 2011......20
Cotton Variety Guide 2017 UT Cotton Agronomy Department of Plant Sciences University of Tennessee
 W 285 Cotton Variety Guide 2017 UT Cotton Agronomy University of Tennessee TN Cotton Variety Guide 2017 Tyson B. Raper, Cotton and Small Grains Specialist Contributing Authors Ryan H. Blair Extension Area
APPROVED LABEL TEXT February 2010 NAN 3514 of Dispersible concentrate (DC) formulation containing 95g/l azoxystrobin
 formulation containing 95g/l azoxystrobin") APPROVED LABEL TEXT NAN 3514 of 2009 HERITAGE MAXX Product Registration Number: MAPP 14787 PCS 03978 Dispersible concentrate (DC) formulation containing 95g/l azoxystrobin F A systemic strobilurin fungicide
APPROVED LABEL TEXT NAN 3514 of 2009 HERITAGE MAXX Product Registration Number: MAPP 14787 PCS 03978 Dispersible concentrate (DC) formulation containing 95g/l azoxystrobin F A systemic strobilurin fungicide
GOLF ENVIRO SYSTEMS, INC. Spring Educational Seminar February 22 & 23, 2006
 GOLF ENVIRO SYSTEMS, INC. Spring Educational Seminar February 22 & 23, 2006 The Stabilized Nitrogen Difference John Meyer Regional Manager Agrotain International OBJECTIVES Introduce Agrotain International
Slide 1. Slide 2. 2 clicks each reg comes up separately.
 Slide 1 PRODUCTION RECORDS FOR SCHOOL NUTRITION PROGRAMS Good recordkeeping is part of any successful food service operation! Why are production records a good idea and important to maintain? Good recordkeeping
TUR FAX. Gray leaf spot is caused by the fungus Pyricularia. of the International Sports Turf Institute, Inc.
 TUR FAX of the International Sports Turf Institute, Inc. Volume 8, Number 4 July-August 2000 The International Newsletter about Current Developments in Turfgrass IN THIS ISSUE The Nature of Gray Leaf Spot
Phytotoxicity and Efficacy of Fascination (6-Benzyl Adenine + Gibberellic Acid) for Enhanced Branching of Catnip (Nepeta cataria)
 for Enhanced Branching of Catnip (Nepeta cataria)") Phytotoxicity and Efficacy of Fascination (6-Benzyl Adenine + Gibberellic Acid) for Enhanced Branching of Catnip (Nepeta cataria) By Heiner Lieth, Director Linda Dodge Ron Lane Jackie Fortunko Project:
Phytotoxicity and Efficacy of Fascination (6-Benzyl Adenine + Gibberellic Acid) for Enhanced Branching of Catnip (Nepeta cataria) By Heiner Lieth, Director Linda Dodge Ron Lane Jackie Fortunko Project:
Update on Black Leg Disease of Canola John Damicone, Extension Plant Pathologist
 Entomology and Plant Pathology, Oklahoma State University 127 Noble Research Center, Stillwater, OK74078 405.744.5527 Vol. 10, No. 3 http://entoplp.okstate.edu/pddl/ Mar 3, 2011 Update on Black Leg Disease
May 2008 AG/Soils/ pr Understanding Your Soil Test Report Grant E. Cardon Jan Kotuby-Amacher Pam Hole Rich Koenig General Information
 May 2008 AG/Soils/2008-01pr Understanding Your Soil Test Report Grant E. Cardon, USU Extension Soil Specialist Jan Kotuby-Amacher, Coordinator for North American Proficiency Testing Program Pam Hole, Supervisor
98 GENERAL SESSION. Dollar Spot Fungicide Trial Hancock Turfgrass Research Center. Michigan State University, East Lansing, MI
 98 GENERAL SESSION Dollar Spot Fungicide Trial - 1995 Hancock Turfgrass Research Center Michigan State University, E. Lansing, MI The 1995 dollar spot (Sclerotinia homoeocarpa fungicide trial was conducted