Dissociable signatures of visual salience and behavioral relevance across attentional priority maps in human cortex
|
|
|
- Augusta Rogers
- 5 years ago
- Views:
Transcription
1 Dissociable signatures of visual salience and behavioral relevance across attentional priority maps in human cortex Thomas C Sprague 1,2,*, Sirawaj Itthipuripat 2,3,4, Vy A Vo 2, John T Serences 2,5,6* 1 New York University, Department of Psychology (present address), 6 Washington Place, New York, NY, Neurosciences Graduate Program, University of California, San Diego, 9500 Gilman Drive, La Jolla, CA, Learning Institute, King Mongkut's University of Technology Thonburi, 126 Pracha Uthit Rd, Bangmod, Thung Kru, Bangkok, Thailand 4 Department of Psychology, Vanderbilt University, st Ave South, Nashville, Tennessee, 37235, USA 5 Department of Psychology, University of California, San Diego, 9500 Gilman Drive, La Jolla, CA, Kavli Institute for Brain and Mind, University of California, San Diego, La Jolla, CA *corresponding authors (tsprague@nyu.edu, lead contact, or jserences@ucsd.edu) ABSTRACT Computational models posit that visual attention is guided by activity within spatial maps that index the imagecomputable salience and the behavioral relevance of objects in the scene. These spatial maps are theorized to be instantiated as activation patterns across a series of retinotopic visual regions in occipital, parietal, and frontal cortex. While previous research has identified sensitivity to either the behavioral relevance or the imagecomputable salience of different scene elements, the simultaneous influence of these factors on neural attentional priority maps in human cortex is not well understood. We tested the hypothesis that visual salience and behavioral relevance independently impact the activation profile across retinotopically-organized cortical regions by quantifying attentional priority maps measured in human brains using functional MRI while participants attended one of two differentially-salient stimuli. We found that the topography of activation in priority maps, as reflected in the modulation of region-level patterns of population activity, independently indexed the physical salience and behavioral relevance of each scene element. Moreover, salience strongly impacted activation patterns in early visual areas, whereas later visual areas were dominated by relevance. This suggests that prioritizing spatial locations relies on distributed neural codes containing graded representations of salience and relevance across the visual hierarchy NEW & NOTEWORTHY We tested a theory which supposes that neural systems represent scene elements according to both their salience and their relevance in a series of priority maps by measuring fmri activation patterns across human brains and 1
2 reconstructing spatial maps of the visual scene. We found that different regions indexed either the salience or the relevance of scene items, but not their interaction, suggesting an evolving representation of salience and relevance across different visual areas INTRODUCTION In a typical visual environment, some portions of the scene are visually salient by virtue of their imagecomputable properties, such as luminance, contrast, color saturation, and local feature contrast (Usher and Niebur 1996; Parkhurst et al. 2002; Masciocchi et al. 2009). Many computational models emphasize the importance of salience in guiding spatial attention (Koch and Ullman 1985; Theeuwes 1994, 2010; Wolfe 1994; Itti and Koch 2001; Stigchel et al. 2009; Veale et al. 2017). However, visually salient portions of the scene do not necessarily contain behaviorally relevant information. For example, the flashing lights of a police car are relevant if they appear in the rear-view mirror, but less so if they appear in oncoming traffic. Accordingly, other models emphasize behavioral relevance in guiding attention, with relevant objects overriding even highly salient scene elements (Yantis and Johnson 1990; Folk et al. 1992, 2002; Egeth and Yantis 1997; Zelinsky and Bisley 2015; Veale et al. 2017). One unifying framework posits that both visual salience and behavioral relevance dissociably influence the activity profile across retinotopic cortex to compute an attentional priority map within each region, which can be read out to guide decisions and actions (Fig 1; (Itti and Koch 2001; Fecteau and Munoz 2006; Serences and Yantis 2006). This predicts that the topography of activation across an individual retinotopic map (e.g., V1) will reflect the spatial profile of visual salience and/or behavioral relevance of items throughout the scene, and each region s priority map will weight these factors to varying degrees. Moreover, because representations of visual salience are more closely aligned with retinal input, we predict that attentional priority maps should transition from salience-driven to relevance-driven across the processing hierarchy. Previous human neuroimaging studies have identified representations of visual salience in the absence of relevance manipulations (Buracas and Boynton 2007; Serences and Yantis 2007; Murray 2008; Bogler et al. 2011, 2013; Pestilli et al. 2011; Zhang et al. 2012; Gouws et al. 2014; Poltoratski et al. 2017; Mo et al. 2018; Yildirim et al. 2018), representations of behavioral relevance under conditions of constant salience (Somers et al. 1999; Gandhi et al. 1999; Silver et al. 2005; Buracas and Boynton 2007; Serences and Yantis 2007; Murray 2008; Pestilli et al. 2011; Jerde et al. 2012; Sprague and Serences 2013; de Haas et al. 2014; Gouws et al. 2014; Klein et al. 2014; Sheremata and Silver 2015; Kay et al. 2015; Vo et al. 2017) and representations of behavioral relevance in the absence of sensory inputs during attention (Kastner et al. 1999) and working memory (Rahmati et al. date 2
3 unknown; Jerde et al. 2012; Sprague et al. 2014, 2016; Saber et al. 2015). While these studies have demonstrated strong preliminary evidence for the existence of representations of attentional priority in retinotopic cortical regions, less is known about how these factors interact when both salience and relevance are parametrically manipulated. For instance, how is an extremely salient, yet behaviorally-irrelevant distractor stimulus represented within region-level attentional priority maps spanning occipital, parietal, and frontal cortex? Additionally, many previous studies have required subjects to search for a target stimulus (e.g., letter or line) among an array of distractors, with one stimulus marked as salient either by virtue of a unique feature or the abrupt onset of an array element (Thompson et al. 1997; Gottlieb et al. 1998; Balan and Gottlieb 2006; Ipata et al. 2006; Bertleff et al. 2016; Poltoratski et al. 2017; Yildirim et al. 2018). In such visual search tasks, the participant explores the scene freely before making a response, and so the most relevant location is updated moment-by-moment, rather than being at a controlled location. Finally, previous single-unit neurophysiology experiments assaying the effects of visual salience and behavioral relevance on neural firing rates have highlighted the necessity of assaying the activity levels of all neurons within a region in order to infer properties of neural priority maps, as opposed to just measuring those neurons with receptive fields overlapping the relevant stimulus location (Bisley and Goldberg 2003a). Here, we addressed these issues by parametrically manipulating the salience (luminance contrast) and relevance (attended or unattended) of two visual stimuli and by reconstructing neural priority maps from BOLD activation profiles across entire retinotopic regions. By quantifying aspects of these maps, we could identify how salience and relevance interact to determine population-level representations of attentional priority (Fig. 1). We found that early visual areas (e.g., V1) were sensitive to salience, while both earlier and later visual areas (e.g., IPS0) were sensitive to relevance. These results demonstrate a transition from salience-dominated attentional priority maps in early visual cortex to representations dominated by behavioral relevance in higher stages of the visual system. 83 MATERIALS AND METHODS EXPERIMENTAL DESIGN We recruited 8 participants (1 male, all right-handed, 26.5±1.15 yrs age, mean ± SEM), including 1 author (subject ID: AP). Two of these participants had never participated in visual functional neuroimaging experiments before (subject IDs: BA and BF). All others have participated in other experiments in the lab (Sprague and Serences 2013; Sprague et al. 2014, 2016; Ester et al. 2015; Vo et al. 2017). All procedures were approved by the UCSD Institutional Review Board, all participants gave written informed consent before participating, and all 3
4 participants were compensated for their time ($20/hr for scanning sessions, $10/hr for behavioral sessions; participant AP, who was an author, was not compensated). Each participant performed a 1-hr training session before scanning during which they were familiarized with all tasks performed inside the scanner. We also used this session to establish initial behavioral performance thresholds by manipulating task difficulty across behavioral blocks. We scanned participants for a single 2-hr main task scanning session comprising at least 4 mapping task runs, used to independently estimate encoding models for each voxel (Fig. 3A), and 4 selective attention task runs (broken into 2 sub-runs each, see below; used to independently select voxels for inclusion in all analyses). All participants also underwent additional localizer and retinotopic mapping scanning sessions to independently identify ROIs (see Region of interest definition ). We presented stimuli using the Psychophysics toolbox (Brainard 1997; Pelli 1997) for MATLAB (The Mathworks, Natick, Mass). During scanning sessions, we rear-projected visual stimuli onto a 110 cm-wide screen placed ~370 cm from the participant s eyes at the foot of the scanner bore using a contrast-linearized LCD projector ( , 60 Hz). In the behavioral familiarization session, we presented stimuli on a contrast-linearized LCD monitor ( , 60 Hz) 62 cm from participants, who were comfortably seated in a dimmed room and positioned using a chin rest. For all sessions and tasks (main selective attention task, mapping task, and localizer), we presented all stimuli on a neutral gray 6.82 circular aperture, surrounded by black (only aperture shown in Fig. 2A) SELECTIVE ATTENTION TASK We instructed participants to attend to one of two random line stimuli (RLS), each appearing at one of three contrasts (, 40%, 80%). On each trial, each RLS stimulus would cohere into a spiral form and participants responded with one of two button presses indicating which direction of spiral they detected in the cued RLS. We designed this stimulus to minimize the allocation of non-spatial feature-based attention, as well as to minimize the influence of potential radial biases in orientation preference in visual cortex as a function of preferred polar angle (Freeman et al. 2011, 2013). Each trial began with a 500 ms attention cue at fixation indicating which of the two stimuli to attend, followed by appearance of both stimuli simultaneously. Because this task required participants identify the locations of both stimuli, then select one based on the color of the attention cue, we chose contrasts based on pilot testing such that participants could easily localize even the lowest-contrast stimulus. Moreover, other types of stimuli 4
5 presented at these contrasts (Gabors and/or gratings) result in dynamic responses across early visual cortex in human fmri (Gandhi et al. 1999; Buracas and Boynton 2007; Murray 2008; Pestilli et al. 2011; Gouws et al. 2014). While it is possible that responses in other regions, such as the retinotopic IPS regions, could saturate at much lower contrasts, using lower stimulus contrast and the purely endogenous, non-spatial attention cue would have resulted in participants attending to the incorrect location on some trials when one of the two stimuli was lowcontrast. Both stimuli remained onscreen for 3,000 ms, during which time a 1,000 ms spiral target appeared independently and instantaneously at each stimulus position. The target onset was randomly chosen on each trial for each stimulus (attended and unattended) from a uniform distribution spanning 500-1,500 ms. Both stimuli always appeared along an invisible iso-eccentric ring 3.5 from fixation, and had a radius of On each trial, the two stimuli appeared either 72 or 144 degrees polar angle apart (4.11 and 6.66 distance between centers, respectively). We randomly rotated the stimulus array on each trial (0-72 polar angle) around fixation, so the positions of the stimuli on each trial were entirely unique. The color of the attention cue presented at fixation indicated with 100% validity whether to attend to the clockwise (blue) or the counterclockwise (red) stimulus (Fig. 2A). Each trial was separated by an inter-trial interval (ITI) drawn from a uniform distribution spanning s at.09 s steps (distribution of ITIs was computed with MATLAB s linspace command as ITIs=linspace(2.5,6.5,45) ), resulting in an average trial duration of 8 s. Both stimuli flickered in-phase at 15 Hz (2 frames on, 2 frames off, monitor refresh rate of 60Hz). Each stimulus consisted of 35 light and 35 dark lines, each 0.3 long and thick, which were replotted during each flicker period centered at random coordinates drawn from a uniform disc 0.9 in radius. On flicker periods with no targets, the orientation of each line was drawn from a uniform distribution. On flicker periods with targets, the orientation of a random subset of lines (defined by the target coherence) was either incremented (i.e., adjusted counter-clockwise; Type 1 spiral ) or decremented (i.e., adjusted clockwise, Type 2 spiral ) from the Cartesian angle of each line relative to stimulus center (see Fig. 2A). Participants responded with a left button press to report a Type 1 spiral target or a right button press to indicate a Type 2 spiral target. We counterbalanced the attended and unattended stimuli based on contrast (, 40%, or 80%; Fig. 2B), stimulus separation distance (72 or 144 polar angle; Fig. 2C), and approximate position of the attended stimulus (1 of 5 base positions). Accordingly, for a single repetition of all trial types, we acquired 90 trials, broken up into 2 sub-runs, each lasting 382 s (45 trials, 8 s each, 12 s blank screen at beginning of scan, 10 s blank screen at end of each scan). Participants performed 8 sub-runs, resulting in a full dataset of 360 trials per participant. 5
6 To keep performance below ceiling and at an approximately fixed level (at ~80%), we adjusted the coherence of targets (defined as the percentage of lines forming a spiral target on each flicker cycle; Fig. 2F) independently for, 40%, and 80% contrast targets before the start of each full run (i.e. 2 sub-runs) SPATIAL MAPPING TASK To estimate a spatial encoding model for each voxel (see below), we presented a flickering checkerboard stimulus at different positions across the screen on each trial. Participants attended these stimuli to identify rare target events (changes in checkerboard contrast on 10 of 47 (21.2%) of trials, evenly split between increments & decrements). During each run, we chose the position of each trial s checkerboard (0.9 radius, 70% contrast, 6 Hz full-field flicker) from a triangular grid of 37 possible positions and added a random uniform circular jitter (0.5 radius; Fig 2C). As in a previous report, we rotated the base position of the triangular grid on each scanner run to increase the spatial sampling density (Sprague et al. 2016). Accordingly, every mapping trial was unique. The base triangular grid of stimulus positions separated stimuli by 1.5, and extended 4.5 from fixation (3 steps). This, combined with random jitter and the radius of the mapping stimulus, resulted in a visual field of view (region of the visual field stimulated) of 5.9 from fixation for our spatial encoding model. On trials in which the checkerboard stimulus overlapped the fixation point, we drew a small aperture around fixation (0.8 diameter). Each trial consisted of a 3,000 ms stimulus presentation period followed by a 2,000-6,000 ms ITI (uniformly sampled). On trials with targets, the checkerboard was dimmed or brightened for 500 ms, beginning at least 500 ms after stimulus onset and ending at least 500 ms before stimulus offset. We instructed participants to only respond if they detected a change in checkerboard contrast and to minimize false alarms. We discarded all targetpresent trials when estimating spatial encoding models. To ensure participants performed below ceiling we adjusted the task difficulty between each mapping run by changing the percentage contrast change for target trials. Each run consisted of 47 trials (10 of which included targets), a 12 s blank period at the beginning of the run, and a 10 s blank period at the end of the run, totaling 352 s VISUAL ATTENTION LOCALIZER TASK To identify voxels responsive to the region of the screen subtended by the mapping and selective attention stimuli, all participants performed several runs of a visual localizer task reported previously (Sprague et al. 2016). Participants performed between 3 and 8 runs of this task in total. For one participant, we used data from the same task, acquired for a different experiment (Sprague et al. 2016) at a different scanning resolution (participant AS, mm voxel size), resampled to the resolution used here. For four participants, including the one scanned 6
7 with a different protocol, the entire background of the screen (18.2 by rectangle) was gray (no circular aperture). Each trial consisted of a flickering radial checkerboard hemi-annulus presented on the left or right half of fixation subtending 0.8 to 6.0 eccentricity around fixation (6 Hz contrast reversal flicker, 100% contrast, 10.0 s duration). On each trial, participants performed a demanding spatial working memory (WM) task in which they carefully maintained the position of a target stimulus (red dot presented over the stimulus, 500 ms) over a 3,000 ms delay interval, after which a probe stimulus (green dot, 750 ms) appeared near the remembered target position. Participants reported whether the green probe dot appeared to the left of or right of the remembered position; or above or below the remembered position, as prompted by the appearance of a 1.0 -long bar at fixation (horizontal bar: left vs. right; vertical bar: above vs. below; 1.5 s response window). We manipulated the targetprobe separation distance between runs to ensure performance was below ceiling. WM trials could occur beginning 1.0 s after checkerboard onset and ended at latest 2.5 s before checkerboard offset. All trials were separated by a 3 5 s ITI (uniformly spaced across trials), and we included 4 null trials in which no checkerboard or WM stimuli appeared (10 s long each). Each run featured 16 total stimulus-present trials, a 14 s blank screen at the beginning of the run and a 10 s blank screen at the end of the run, totaling 304 s FUNCTIONAL MRI ACQUISITION We scanned all participants on a 3 T research-dedicated GE MR750 scanner located at the UCSD Keck Center for Functional Magnetic Resonance Imaging with a 32 channel send/receive head coil (Nova Medical, Wilmington, MA). We acquired functional data using a gradient echo planar imaging (EPI) pulse sequence ( cm field of view, matrix size, 35 3-mm-thick slices with 0-mm gap, axial orientation, TR = 2,000 ms, TE = 30 ms, flip angle = 90, voxel size 3 mm isotropic). To anatomically coregister images across sessions, and within each session, we also acquired a high resolution anatomical scan during each scanning session (FSPGR T1-weighted sequence, TR/TE = 11/3.3 ms, TI = 1,100 ms, 172 slices, flip angle = 18, 1 mm 3 resolution). For all sessions but one, anatomical scans were acquired with ASSET acceleration. For the remaining session, we used an 8 channel send/receive head coil and no ASSET acceleration to acquire anatomical images with minimal signal inhomogeneity near the coil surface, which enabled improved segmentation of the gray-white matter boundary. We transformed these anatomical images to Talairach space and then reconstructed the gray/white matter surface boundary in BrainVoyager (BrainInnovations, The Netherlands) which we used for identifying ROIs. 7
8 FMRI PREPROCESSING We preprocessed fmri data as described in our previous reports (Sprague et al. 2014, 2016). We coregistered functional images to a common anatomical scan across sessions (used to identify gray/white matter surface boundary as described above) by first aligning all functional images within a session to that session s anatomical scan, then aligning that session s scan to the common anatomical scan. We performed all preprocessing using FSL (Oxford, UK) and BrainVoyager (BrainInnovations). Preprocessing included unwarping the EPI images using routines provided by FSL, then slice-time correction, three-dimensional motion correction (six-parameter affine transform), temporal high-pass filtering (to remove first-, second- and third-order drift), transformation to Talairach space (resampling to mm resolution) in BrainVoyager, and finally normalization of signal amplitudes by converting to Z-scores separately for each run using custom MATLAB scripts. We did not perform any spatial smoothing beyond the smoothing introduced by resampling during the co-registration of the functional images, motion correction and transformation to Talairach space. All subsequent analyses were computed using custom code written in MATLAB (release 2015a) REGION OF INTEREST DEFINITION Based on our previous work (Sprague et al. 2014, 2016), we identified 10 a priori ROIs using independent scanning runs from those used for all analyses reported in the text. For retinotopic ROIs (V1-V3, hv4, V3A, IPS0-IPS3), we utilized a combination of retinotopic mapping techniques. Each participant completed several scans of meridian mapping in which we alternately presented flickering checkerboard bowties along the horizontal and vertical meridians. Additionally, each participant completed several runs of an attention-demanding polar angle mapping task in which they detected brief contrast changes of a slowly-rotating checkerboard wedge (described in detail in (Sprague and Serences 2013)). We used a combination of maps of visual field meridians and polar angle preference for each voxel to identify retinotopic ROIs (Engel et al. 1994; Swisher et al. 2007). Polar angle maps computed using the attention-demanding mapping task for several participants are available in previous publications (AI: (Sprague and Serences 2013); AL and AP: (Ester et al. 2015)). We combined left- and righthemispheres for all ROIs, as well as dorsal and ventral aspects of V2 and V3 for all analyses by concatenating voxels. We defined superior precentral sulcus (spcs), the putative human homolog of macaque frontal eye field (FEF; Mackey et al., 2017; Srimal and Curtis, 2008) by plotting voxels active during either the left or right conditions of the localizer task described above (FDR corrected, q = 0.05) on the reconstructed gray/white matter boundary of each participant s brain and manually identifying clusters appearing near the superior portion of the precentral sulcus, following previous reports (Srimal and Curtis 2008). Though retinotopic maps have previously been 8
9 reported in this region (Hagler and Sereno 2006; Mackey et al. 2017), we did not observe topographic visual field representations. We anticipate this is due to the substantially limited visual field of view we could achieve inside the scanner (maximum eccentricity: ~7 ) INVERTED ENCODING MODEL To reconstruct images of salience and/or relevance maps carried by activation patterns measured over entire regions of interest, we implemented an inverted encoding model (IEM) for spatial position (Sprague and Serences 2013). This analysis involves first estimating an encoding model (sensitivity profile over the relevant feature dimension(s) as parameterized by a small number of modeled information channels) for each voxel in a region using a training set of data reserved for this purpose (four spatial mapping runs). Then, the encoding models across all voxels within a region are inverted to estimate a mapping used to transform novel activation patterns from a test set (selective attention task runs) into activation in the modeled set of information channels. Adopting analysis procedures from previous work, we built an encoding model for spatial position based on a linear combination of spatial filters (Sprague and Serences 2013; Sprague et al. 2014, 2015). Each voxel s response was modeled as a weighted sum of 37 identically-shaped spatial filters arrayed in a triangular grid (Fig. 3). Centers were spaced by 1.59 and each filter was a Gaussian-like function with full-width half-maximum of 1.75 : 253 Equation 1: f(r) = ( cos 2πr s )7 for r < s; 0 otherwise Where r is the distance from the filter center and s is a size constant reflecting the distance from the center of each spatial filter at which the filter returns to 0. Values greater than this are set to 0, resulting in a single smooth round filter at each position along the triangular grid (s = ; see Fig. 3 for illustration of filter layout and shape; see also (Sprague and Serences 2013; Sprague et al. 2014, 2016)). This triangular grid of filters forms the set of information channels for our analysis. Each mapping task stimulus is converted from a contrast mask (1 s for each pixel subtended by the stimulus, 0 s elsewhere) to a set of filter activation levels by taking the dot product of the vectorized stimulus mask and the sensitivity profile of each filter. This results in each mapping stimulus being described by 37 filter activation levels rather than 1, = 786,432 pixel values. Once all filter activation levels are estimated, we normalize so that the maximum filter activation is 1. 9
10 Following previous reports (Brouwer and Heeger 2009; Sprague and Serences 2013), we model the response in each voxel as a weighted sum of filter responses (which can loosely be considered as hypothetical discrete neural populations, each with spatial RFs centered at the corresponding filter position). 267 Equation 2: B 1 = C 1 W Where B 1 (n trials m voxels) is the observed BOLD activation level of each voxel during the spatial mapping task (averaged over two TRs, s after mapping stimulus onset), C 1 (n trials k channels) is the modeled response of each spatial filter, or information channel, on each non-target trial of the mapping task (normalized from 0 to 1), and W is a weight matrix (k channels m voxels) quantifying the contribution of each information channel to each voxel. Because we have more stimulus positions than modeled information channels, we can solve for W using ordinary least-squares linear regression: Equation 3: W = (C T 1 C 1 ) 1 C T 1 B 1 This step is univariate and can be computed for each voxel in a region independently. Next, we used all estimated voxel encoding models within a ROI (W ) and a novel pattern of activation from the WM task (each TR from each trial, in turn) to compute an estimate of the activation of each channel (C 2, n trials k channels) which gave rise to that observed activation pattern across all voxels within that ROI (B 2, n trials m voxels): 279 Equation 4: C 2 = B 2 W T (W W T ) Once channel activation patterns are computed (Equation 4), we compute spatial reconstructions by weighting each filter s spatial profile by the corresponding channel s reconstructed activation level and summing all weighted filters together. This step aids in visualization, quantification, and coregistration of trials across stimulus positions, but does not confer additional information. We used 4 mapping task runs to estimate the encoding model for each voxel, then inverted that encoding model to reconstruct visual field images during all main spatial attention task runs. Because stimulus positions were unique on each trial of the selective attention task (Fig. 2C), direct comparison of image reconstructions on each trial is not possible without coregistration of reconstructions so that stimuli appeared at common positions across trials. To accomplish this, we adjusted the center position of the spatial filters on each trial such that we could rotate the resulting reconstruction. For Figure 4, we rotated each trial such that one target (the non-attended stimulus, Fig. 2B) was centered at x = 3.5 and y = 0 and the other stimulus was in the upper visual hemifield, which required flipping ½ of reconstructions across the horizontal meridian. 10
11 QUANTIFYING STIMULUS REPRESENTATIONS To quantify the strength of stimulus representations within each reconstruction, we averaged the pixels within each reconstruction located within a 0.9 radius disc centered at each stimulus known position. This gives us a single value for each stimulus (attended & unattended) on each trial. We then sorted these measurements, which we call map activation values as they reflect linear transformations of BOLD activation levels, based on the contrast of the attended and the unattended stimuli (Fig. 5; Fig. 6) STATISTICAL ANALYSIS For all statistical tests, we used parametric tests (repeated measures ANOVAs and T-tests, where appropriate), followed up by 1,000 iterations of a randomized version of the test to derive an empirical null statistic distribution, given our data, from which we compute p-values reported throughout the text. If our limited sample satisfies the assumptions of these parametric tests, the p-values derived from the empirical null statistic distribution should closely approximate the derived value given assumptions. Especially because of our relatively small sample size, we prefer to rely on the empirical null for recovering p-values. For behavioral analyses (Fig. 2), we computed a 2-way repeated-measures analysis of variance (ANOVA) with attended stimulus contrast and unattended stimulus contrast as factors for each of behavioral accuracy and response time. As a first analysis of BOLD responses, to determine whether it was possible to collapse over sets of trials in which the irrelevant stimulus contrast varied (see Fig. 6), we computed a 2-way repeated-measures ANOVA with attended stimulus contrast and unattended stimulus contrast as factors for each of the stimulus representation activation values for each ROI. We were primarily interested in whether there were any interactions between attended and unattended stimulus contrast, which would have precluded us from collapsing over non-sorted stimulus contrasts. For completeness, p-values from our shuffling procedure for both main effects and the interaction for each ROI are presented in the Tables S1 and S2. For a subsequent BOLD analysis testing the effects of salience and relevance on map activation across ROIs, we first conducted a 3-way ANOVA with factors of stimulus contrast, stimulus identity (attended vs. unattended), and ROI to identify whether there was a difference in attention-related changes in stimulus reconstructions across ROIs (as indicated by interactions between ROI and any other factor). Then, we performed a follow-up analysis on each ROI by computing a 2-way ANOVA with factors of stimulus contrast and stimulus identity (attended vs unattended) for each ROI. On each iteration of our shuffling procedure, we shuffled the data values for each participant individually and recomputed the test statistic of interest. To derive p-values, we computed the percentage of shuffling iterations in which the null test statistic was greater than or equal to the measured test statistic (with intact, unshuffled 11
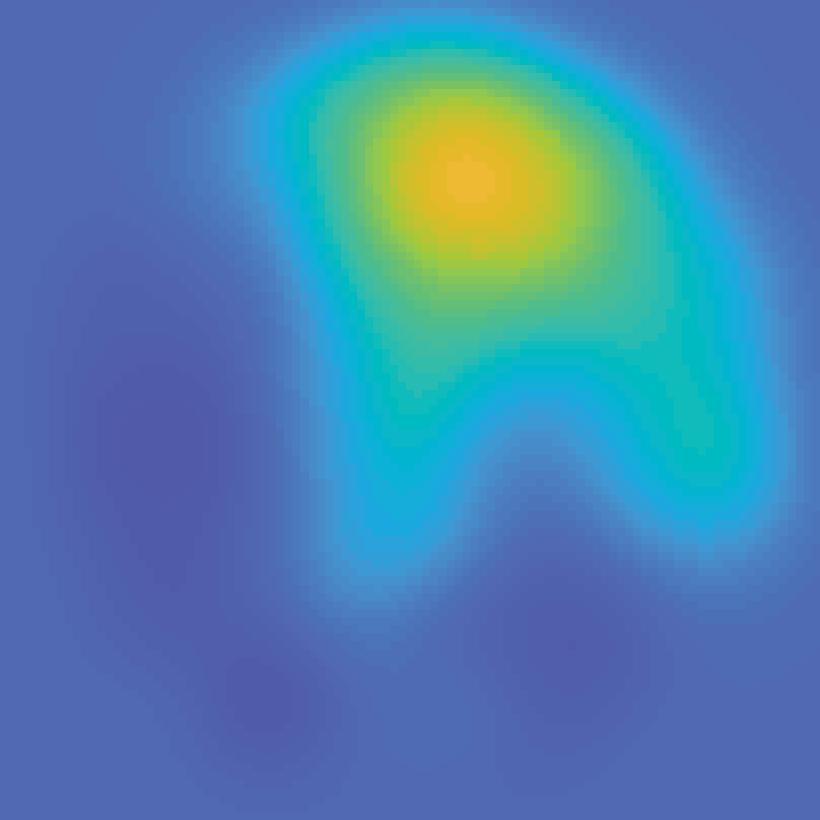
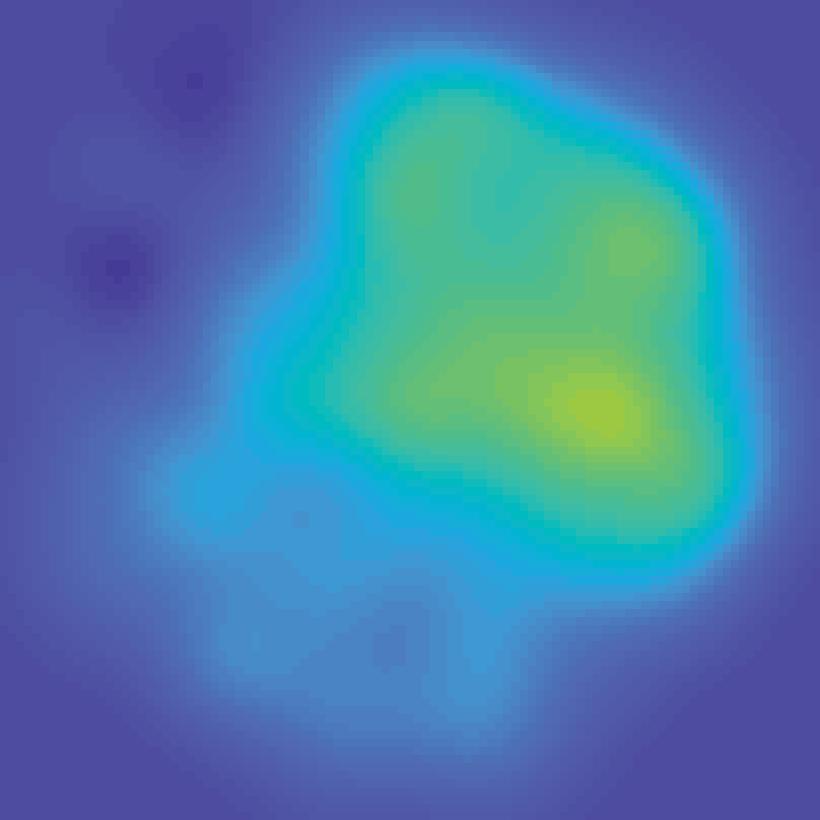
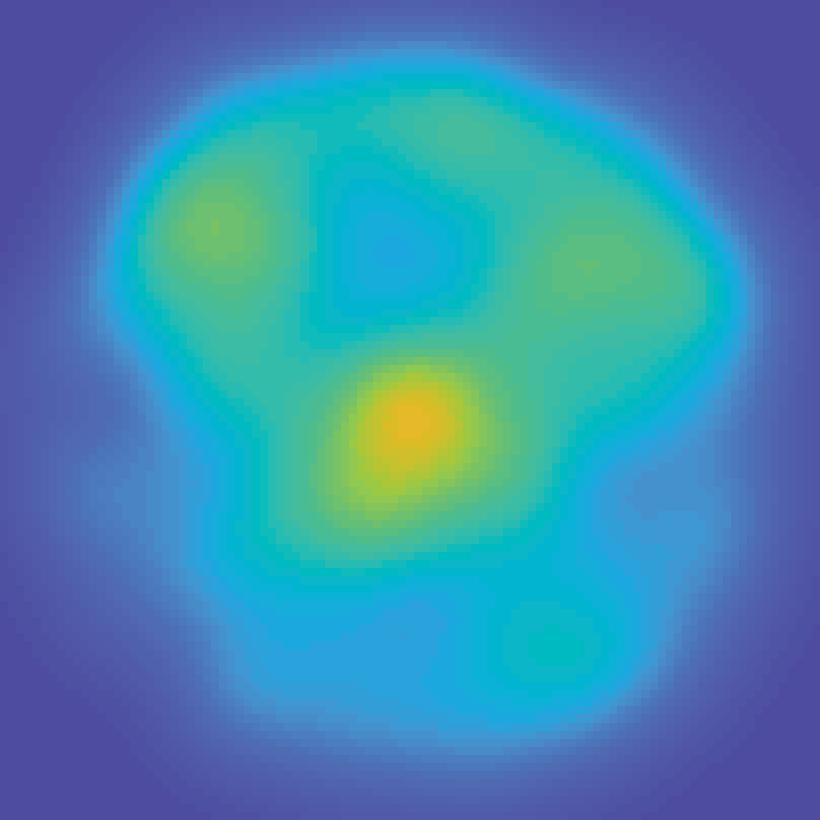
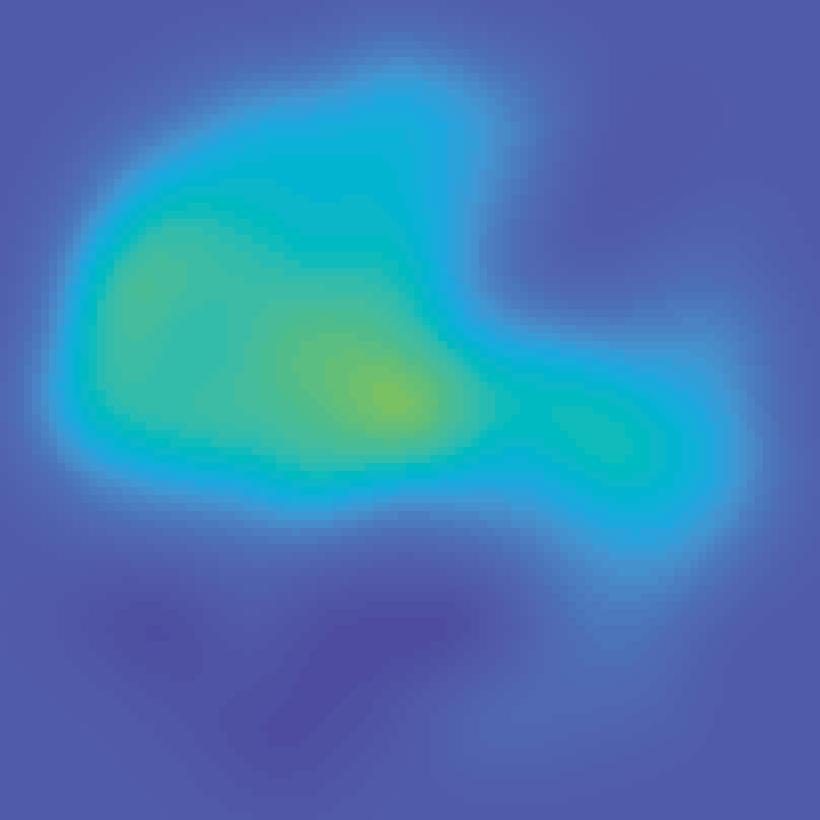
12 labels). The random number generator was seeded with a single value for all analyses (derived by asking a colleague for a random string of numbers over instant messenger). For ROI analyses, trials were shuffled identically for each ROI. When appropriate (Fig. 5, Fig. 6), we controlled for multiple comparisons using the false discovery rate (Benjamini and Yekutieli 2001) across all comparisons within an analysis. All error bars reflect standard error of the mean, unless indicated otherwise DATA AND CODE AVAILABILITY All data (behavioral data and extracted trial-level BOLD signal from each ROI after preprocessing) and stimulus presentation and data analysis code necessary to produce figures supporting findings reported here is freely accessible online in an Open Science Framework repository (osf.io/svuzt), and code posted on GitHub at author TCS s profile (github.com/tommysprague/pri2stim_mfiles) RESULTS We measured blood oxygenation level dependent (BOLD) activation patterns from each independently-identified retinotopic region using functional magnetic resonance imaging (fmri) while participants covertly attended one of two visual stimuli (two patches of randomly oriented dark and light lines), each presented at one of three luminance contrast levels (, 40%, and 80%; Fig. 2A-B), to identify a brief target stimulus (coherent lines that formed a spiral) at the attended location. We maintained behavioral performance at a constant accuracy level of ~80% (Fig. 2D; 2-way permuted repeated-measures ANOVA, p-values for main effect of attended contrast, unattended contrast and interaction: 0.359, 0.096, and 0.853, respectively), so that any activation changes we observed did not reflect differences in task difficulty or engagement across experimental conditions. Additionally, response time did not vary with attended or unattended stimulus contrast, or their interaction (Fig. 2E; p = 0.926, 0.143, and 0.705, respectively), and the threshold coherence did not vary with the attended stimulus contrast (Fig. 2F; 1-way permuted repeated-measures ANOVA, main effect of attended contrast, p = 0.153). We used a multivariate fmri image reconstruction technique (an inverted encoding model or IEM) to visualize spatial maps of the visual scene using activation patterns from several cortical regions in visual, parietal and fontal cortex (Sprague and Serences 2013). First, we estimated the spatial sensitivity profile of each voxel within a region of interest (ROI) using data measured from a separate set of mapping scans. Then, we used the resulting sensitivity profiles across all voxels to reconstruct a map of retinotopic space in visual field coordinates from single-trial activation patterns measured during the covert visual attention task (Fig. 3). The spatial profile of activation within these maps can be used to infer whether a given ROI is sensitive to visual salience (i.e., does the 12
13 spatial profile scale with contrast?, Fig. 1B) and whether it is sensitive to behavioral relevance (i.e., does the spatial profile scale with attention?, Fig. 1D). In principle, both visual salience and behavioral relevance could independently alter the landscape of responses in each ROI. While this technique involves, as a first step, estimating the spatial sensitivity profile of each fmri voxel (its receptive field), it is important to note that the goals of this analysis are categorically different from those of more typical voxel receptive field (or population receptive field, prf) analysis methods (Dumoulin and Wandell 2008). Here, our goal is to characterize how the activation pattern across all voxels, given an independently-estimated spatial encoding model, supports a regionlevel attentional priority map of the visual scene on each trial. Because an RF profile requires many trials to estimate (all visual field positions must be stimulated within a condition), and because we aimed to understand how large-scale activation patterns support attentional priority maps, we focused all analyses on the IEM-based map reconstructions. We found that image reconstructions systematically tracked the locations of stimuli in the visual field (Fig. 4). Qualitatively, the reconstructions from primary visual cortex (V1) reflected both stimulus salience and behavioral relevance: the reconstructed map activations at stimulus locations scaled both with increasing contrast and with the behavioral relevance of each stimulus. This pattern can be seen in Fig. 4: along the diagonal, where visual salience is equal between the two stimuli, map locations near the attended stimulus are more strongly active than locations near the unattended stimulus. However, in posterior parietal cortex (IPS0), only locations near the attended location were substantially active, with little activation associated with the irrelevant item s location. Additionally, map activation in posterior parietal cortex did not scale with stimulus contrast. Importantly, even when the unattended stimulus was much more salient than the attended stimulus, only the attended stimulus location was strongly active. This demonstrates that behavioral relevance dominates activation profiles in this area. Overall, occipital retinotopic ROIs (V1-hV4, V3A) show a qualitative pattern similar to that observed in V1, and parietal and frontal ROIs show a pattern similar to that in IPS0. To quantify these effects, we extracted the mean activation level in each reconstructed map at the known position of each stimulus and then evaluated the main effect of visual salience, the main effect of behavioral relevance, and their interaction using a repeated-measures 2-way ANOVA (with p-values computed using a randomization test and corrected for multiple comparisons via the false discovery rate, FDR, see Materials and methods: Statistical analyses). If visual salience and behavioral relevance independently contribute to representations of attentional priority, we would expect to find a main effect of salience (contrast) and/or relevance (attention) on map activation in any given ROI, but no interactions between the two. 13
14 Reconstructed map activation increased significantly with visual salience in V1-hV4 (Fig. 5; p 0.003; see also Fig. 6), with no evidence for sensitivity to salience in parietal or frontal regions. On the other hand, map activation increased significantly with behavioral relevance not only in V1-hV4, but also in V3A and IPS0-1 (p 0.011), with a trend observed in spcs (p = 0.038, trend defined at ɑ = 0.05 without correction for multiple comparisons). There was no interaction between salience and relevance in any visual area that we evaluated (p 0.062, minimum p- value for V1). Additionally, a 3-way repeated-measures ANOVA with factors for salience, relevance, and ROI established that the influence of salience and relevance on map activation significantly varied across ROIs (interaction between salience and ROI: p < 0.001, interaction between relevance and ROI: p < 0.001; all p-values for 2- and 3-way ANOVAs available in Table 1). We also tested whether the map activation near one stimulus location depended on the contrast of the other stimulus. A 2-way repeated-measures ANOVA within each ROI on attended and unattended stimulus map activation, each with factors of attended and unattended contrast, yielded no significant interactions (p 0.124, minimum p-value spcs; though trends emerged in V3A, defined as ɑ = 0.05 without correction for multiple comparisons; Fig. 6; all p-values available in Table 2). Thus, the unattended stimulus contrast did not impact reconstructed map activation near the attended stimulus, and vice versa. This rules out a potential alternative operationalization of salience in our dataset: one could be interested in defining stimulus salience as how different the two stimuli are (that is, the difference between their relative contrasts). Under such a definition of salience, we would expect to see an interaction between the attended and unattended stimulus contrasts on reconstructed map activation (map activation depends on both the contrast at that location and the contrast of the other stimulus). For example, if the high-contrast stimulus was considered more salient when paired with a low-contrast stimulus, then we would expect to see reconstructed map activation for the high contrast stimulus increasing as its paired stimulus contrast decreases; we do not see this qualitatively in any ROI (Fig. 4; Fig. 6) DISCUSSION We tested the hypothesis that attentional priority is guided by dissociable neural representations of the visual salience and the behavioral relevance of different spatial locations in the visual scene. While previous work has demonstrated sensitivity to bottom-up stimulus salience and/or top-down behavioral relevance in visual (Johannes et al. 1995; Kastner et al. 1999; Somers et al. 1999; Gandhi et al. 1999; Kim et al. 2007; Buracas and Boynton 2007; Murray 2008; Burrows and Moore 2009; Bogler et al. 2011, 2013; Pestilli et al. 2011; Zhang et al. 2012; Sprague and Serences 2013; Klein et al. 2014; de Haas et al. 2014; Gouws et al. 2014; Itthipuripat et al. 2014a, 2014b, 2017; Kay et al. 2015; Poltoratski et al. 2017; Vo et al. 2017; Mo et al. 2018; Yildirim et al. 2018), parietal (Gottlieb et al. 1998; Bisley and Goldberg 2003b; Constantinidis and Steinmetz 2005; Balan and Gottlieb 14
15 ; Ipata et al. 2006; Serences and Yantis 2007; Sprague and Serences 2013; Klein et al. 2014; Sheremata and Silver 2015) and frontal (Thompson et al. 1997; Bichot and Schall 1999; Serences and Yantis 2007; Katsuki and Constantinidis 2012) cortex, it remains unexplored how each of these factors interact with one another when parametrically manipulated, as well as how large-scale priority maps subtended by entire visual retinotopic regions support representations of salience, relevance, and their interaction. Here, we identified representations of visual salience within reconstructed attentional priority maps measured from early visual regions, where map activation scaled with image-computable visual salience. Additionally, we identified representations of behavioral relevance across visual and posterior parietal cortex, with some regions, such as IPS0, exhibiting activation profiles which only index the location of a relevant object, even when an irrelevant but salient object was simultaneously present in the display. These results provide evidence for a distributed representation of attentional priority, with each retinotopic region supporting a combination of independent representations of the visual salience and behavioral relevance of scene elements (Itti and Koch 2001; Fecteau and Munoz 2006; Serences and Yantis 2006). Models of attentional priority have implemented layers corresponding to image-computable visual salience and task-driven behavioral relevance, but large-scale spatial maps of such features have only been documented in isolation (i.e., manipulations of relevance given equal image-computable salience (Kastner et al. 1999; Somers et al. 1999; Silver et al. 2005, 2007; Serences and Yantis 2007; Pestilli et al. 2011; Jerde et al. 2012; Sprague and Serences 2013; de Haas et al. 2014), or of salience given equal behavioral relevance (Bogler et al. 2011, 2013; Zhang et al. 2012; Poltoratski et al. 2017; White et al. 2017; Yildirim et al. 2018) or at a local physiological scale (i.e., measurements of single neurons in isolation during manipulation of item salience and/or relevance (Thompson et al. 1997; Gottlieb et al. 1998; Bichot and Schall 1999; Bisley and Goldberg 2003b, 2010; Mazer and Gallant 2003; Constantinidis and Steinmetz 2005; Balan and Gottlieb 2006; Ipata et al. 2006; Burrows and Moore 2009; White et al. 2017)). Here, we independently manipulated the salience and relevance of multiple scene elements and reconstructed large-scale spatial maps using all voxels within a retinotopic region. Because spatial attention has nuanced and multifaceted effects on voxels tuned to locations across the visual field (Sprague and Serences 2013; de Haas et al. 2014; Klein et al. 2014; Kay et al. 2015; Sheremata and Silver 2015; Vo et al. 2017), it was necessary to apply the population-level IEM analysis technique to measure the joint effect of all task-related modulations on spatial maps supported by entire regions. This allowed us to demonstrate that salience and relevance each independently contribute to the representation of attentional priority, and that maps become less sensitive to salience across the visual processing hierarchy (Fig. 5). It would be challenging to infer how large-scale activation patterns across entire regions support representations of salience and relevance using forward-modeling techniques, such as population or voxel receptive field modeling (Dumoulin and Wandell 2008), as an estimate of 15
16 a receptive field requires stimulation across the entire visual display over many trials, as in our mapping task (Fig. 3A). Here, we recovered priority maps given independently-estimated encoding models on each trial given activation patterns across all voxels within a region. These priority maps necessarily take into account the encoding properties of all voxels used for the analysis under the assumption that selectivity is stable across conditions (see (Sprague and Serences 2013; de Haas et al. 2014; Klein et al. 2014; Kay et al. 2015; Sheremata and Silver 2015; Vo et al. 2017). While this assumption may not be rigidly satisfied, it provides a sufficient first-pass approach for characterizing region-level stimulus representations during cognitive tasks on single trials, and is similar to the common practice of selecting voxels based on retinotopic selectivity (e.g., using stimulus localizers or visual field quadrants). In our stimulus setup, image-computable salience could only be defined based on the luminance contrast of each stimulus no other stimulus features were parametrically varied. Other studies have defined stimulus salience based on sudden stimulus onsets, or based on distinct stimulus features among a field of distractors ( singletons ). In these previous studies, neural activity in macaque LIP and FEF exhibited properties consistent with a salience map: neurons respond to abrupt-onset stimuli, but not to stable features of the environment (Gottlieb et al. 1998; Kusunoki et al. 2000; Balan and Gottlieb 2006), and they respond strongly to singleton items among uniform distractors (Thompson et al. 1997; Bichot and Schall 1999). While we did not see responses in parietal cortex consistent with an image-computable salience map (Fig. 4-5), it remains possible that other stimulus manipulations could result in salience representations in parietal and frontal cortex. Several recent fmri studies presented participants with orientation or motion singletons and found responses consistent with salience maps in visual cortex, similar to our observations here, although neither reported any parietal cortex data (Poltoratski et al. 2017; Yildirim et al. 2018). Indeed, results from other studies suggest that the type of salience manipulation may have a substantial impact on modulations measured in humans with fmri. In a study in which local contrast dimming among patterned patches was used to define a salient region, activation in early visual field maps reflected the decrease in contrast (but increase in salience by virtue of the high-contrast background) with a decrease in activation, rather than the increase in activation expected if these regions detect salience (Betz et al. 2013). This conflicts with another study in which briefly-presented and masked orientation texture patches induced salience-related responses in early visual cortex ((Zhang et al. 2012), but see (Bogler et al. 2013)). Finally, in our study, we only observed saliencerelated activation profiles in occipital regions of visual cortex (Figs. 4-5; V1-hV4). Future studies should compare how different types of bottom-up salience manipulations alter activation profiles of putative priority maps across visual, parietal, and frontal cortex. 16
17 Additionally, many other studies examining the interaction between behavioral relevance and visual salience use visual search tasks, in which the locus of spatial attention must explore the visual scene on each trial to identify a target stimulus. For example, an animal or human may be required to report the orientation of a bar presented within a green square among a field of bars, each surrounded by green circles. As a salient distractor, one circle might be red. In such a task, the relevant location cannot be known ahead of time by the subject. We designed our study to manipulate the spatial location of covert attention via an endogenous cue (Bisley and Goldberg 2003b; Carrasco 2011), as well as the location of a distracting stimulus of varying levels of salience. Accordingly, we could sort trials based on the location where attention was instructed, which allowed us to quantify changes in map activation levels according to behavioral relevance. When attention is free to roam during a visual search task, all locations may be sampled during a trial, which would be impossible to pull apart using hemodynamic measures. However, recent application of IEM analyses to visual covert attention tasks may enable hightemporal-resolution studies into the wandering spotlight of attention during such visual search tasks (Garcia et al. 2013; Samaha et al. 2016; Foster et al. 2017). While our observation of no sensitivity to stimulus salience in parietal and frontal cortex is consistent with the interpretation that these regions act as relevance maps, there are several other possibilities worth consideration. First, it might be the case that these regions are sensitive to stimulus contrast outside the range used in this study (20-80%). For example, IPS regions may respond in a graded fashion to contrasts between 5% and 15%, but have a flat or step function response function if sampled only outside that range. Because we wanted complete control over the locus of visual spatial attention without using spatial cues, which could interfere with the spatial reconstructions of relevance and salience maps, we used above-threshold stimuli that could be quickly and unambiguously localized by participants. Perhaps presenting lower contrasts would result in more graded response profiles in parietal and frontal cortex. However, this explanation still requires that spatial attention gives rise to a substantial offset in either the threshold or baseline of neural contrast response functions in these regions. Such a pronounced shift in either of these parameters acts, in effect, as a relevance signal within this stimulus range, since most of the variance across trials is described by changes in the relevant stimulus location rather than the salience of the scene at the stimulus locations. Even so, we emphasize that our results remain consistent with an account whereby contrast sensitivity differs between visual and parietal cortex, which could mask our ability to observe sensitivity to salience signals more generally. As described above, future studies using alternative image manipulations to modify salience, such as feature contrast, can further resolve the role of parietal and frontal cortex in representing salience and relevance (Zhang et al. 2012; Poltoratski et al. 2017; Yildirim et al. 2018). 17
18 Second, anterior regions could pool over a greater spatial extent of the screen, given larger RFs in these areas, and this pooling may compress the strength of responses to stimuli at higher contrasts (Kay et al. 2013; Mackey et al. 2017). This explanation would only account for the feedforward, stimulus-driven responses, and must still allow for the additional contribution of an additional signal highlighting relevant regions of the screen (Kay and Yeatman 2017). That is, the compressive summation would not apply to putatively top-down signals related to spatial attention, only to bottom-up signals scaling with image contrast. Moreover, because we used a single stimulus size in this experiment, it is difficult to unambiguously resolve whether compressive spatial summation or a more general compressive contrast nonlinearity contributes to the lack of contrast sensitivity observed in these regions. The relative balance of stimulus salience and behavioral relevance within a region may shift under additional task conditions, such as manipulations of cue validity or reward magnitude (Chelazzi et al. 2014; Kahnt et al. 2014; Klyszejko et al. 2014; MacLean and Giesbrecht 2015a, 2015b; MacLean et al. 2016), or when participants are cued to attend to different feature values rather than spatial positions. We speculate that when behavioral goals are illdefined, maps that are more sensitive to image-computable salience will primarily determine attentional priority and guide behavior (Egeth and Yantis 1997). In contrast, when an observer is highly focused on a specific behavioral goal, maps with stronger representations of behavioral relevance will dominate the computation of attentional priority ACKNOWLEDGEMENTS This work was supported by NEI R01-EY and a James S McDonnell Foundation Scholar Award to JTS, NEI F32-EY to TCS, a HHMI Graduate Student Fellowship and a Royal Thai Scholarship from Ministry of Science and Technology, Thailand to SI, and a NSF Graduate Research Fellowship to VAV. DECLARATION OF INTERESTS The authors declare no conflict of interest AUTHOR CONTRIBUTIONS TCS, SI, VAV, and JTS conceived and designed the research. TCS, SI, and VAV acquired data, TCS analyzed data and wrote the first draft of the manuscript, SI, VAV and JTS provided comments & critical edits to the manuscript. JTS supervised all aspects of the research REFERENCES Balan PF, Gottlieb J. Integration of exogenous input into a dynamic salience map revealed by perturbing attention. J Neurosci 26: ,
19 Benjamini Y, Yekutieli D. The control of the false discovery rate in multiple testing under dependency [Online]. Ann Stat 29: , [29 Mar. 2013]. Bertleff S, Fink GR, Weidner R. The Role of Top-Down Focused Spatial Attention in Preattentive Salience Coding and Salience-based Attentional Capture. J Cogn Neurosci 28: , Betz T, Wilming N, Bogler C, Haynes J-D, König P. Dissociation between saliency signals and activity in early visual cortex. J Vis 13: 6 6, Bichot NP, Schall JD. Effects of similarity and history on neural mechanisms of visual selection [Online]. Nat Neurosci 2: , Bisley JW, Goldberg ME. Neuronal Activity in the Lateral Intraparietal Area and Spatial Attention. Science (80- ) 299: 81 86, 2003a. Bisley JW, Goldberg ME. Neuronal activity in the lateral intraparietal area and spatial attention. [Online]. Science (80- ) 299: 81 86, 2003b. ks. Bisley JW, Goldberg ME. Attention, intention, and priority in the parietal lobe. [Online]. Annu Rev Neurosci 33: 1 21, ks. Bogler C, Bode S, Haynes J-D. Decoding Successive Computational Stages of Saliency Processing. Curr Biol 21: , Bogler C, Bode S, Haynes J-D. Orientation pop-out processing in human visual cortex. Neuroimage 81: 73 80, Brainard DH. The Psychophysics Toolbox. Spat Vis 10: , Brouwer G, Heeger D. Decoding and Reconstructing Color from Responses in Human Visual Cortex. J Neurosci 29: , Buracas GT, Boynton GM. The effect of spatial attention on contrast response functions in human visual cortex. [Online]. J Neurosci 27: 93 97, ks. Burrows BE, Moore T. Influence and limitations of popout in the selection of salient visual stimuli by area V4 neurons. J Neurosci 29: , Carrasco M. Visual attention: the past 25 years. Vision Res 51: , Chelazzi L, Eštočinová J, Calletti R, Lo Gerfo E, Sani I, Della Libera C, Santandrea E. Altering spatial priority maps via reward-based learning. J Neurosci 34: , Constantinidis C, Steinmetz MA. Posterior parietal cortex automatically encodes the location of salient stimuli. J Neurosci 25: 233 8,
20 Dumoulin S, Wandell B. Population receptive field estimates in human visual cortex. Neuroimage 39: , Egeth HE, Yantis S. Visual attention: control, representation, and time course. Annu Rev Psychol 48: , Engel SA, Rumelhart DE, Wandell BA, Lee AT, Glover GH, Chichilnisky E-J, Shadlen MN. fmri of human visual cortex [Online]. Nature 369: 525, Ester EF, Sprague TC, Serences JT. Parietal and Frontal Cortex Encode Stimulus-Specific Mnemonic Representations during Visual Working Memory. Neuron 87: , Fecteau JH, Munoz DP. Salience, relevance, and firing: a priority map for target selection. Trends Cogn Sci 10: , Folk CL, Leber AB, Egeth HE. Made you blink! Contingent attentional capture produces a spatial blink. [Online]. Percept Psychophys 64: , [7 Feb. 2017]. Folk CL, Remington RW, Johnston JC. Involuntary covert orienting is contingent on attentional control settings. [Online]. J Exp Psychol Hum Percept Perform 18: , [7 Feb. 2017]. Foster JJ, Sutterer DW, Serences JT, Vogel EK, Awh E. Alpha-Band Oscillations Enable Spatially and Temporally Resolved Tracking of Covert Spatial Attention. Psychol Sci 28: , Freeman J, Brouwer GJ, Heeger DJ, Merriam EP. Orientation decoding depends on maps, not columns. [Online]. J Neurosci 31: , ks. Freeman J, Heeger DJ, Merriam EP. Coarse-scale biases for spirals and orientation in human visual cortex. J Neurosci 33: , Gandhi SP, Heeger DJ, Boynton GM. Spatial attention affects brain activity in human primary visual cortex. [Online]. Proc Natl Acad Sci 96: , Garcia J, Srinivasan R, Serences J. Near-Real-Time Feature-Selective Modulations in Human Cortex [Online]. Curr Biol 23: , Gottlieb JP, Kusunoki M, Goldberg ME. The representation of visual salience in monkey parietal cortex. Nature 391: 481 4, Gouws AD, Alvarez I, Watson DM, Uesaki M, Rogers J, Morland AB. On the Role of Suppression in Spatial Attention: Evidence from Negative BOLD in Human Subcortical and Cortical Structures. J Neurosci 34: , de Haas B, Schwarzkopf DS, Anderson EJ, Rees G. Perceptual load affects spatial tuning of neuronal populations in human early visual cortex. Curr Biol 24: R66 R67, Hagler DJ, Sereno MI. Spatial maps in frontal and prefrontal cortex. Neuroimage 29: ,
21 Ipata AE, Gee AL, Gottlieb J, Bisley JW, Goldberg ME. LIP responses to a popout stimulus are reduced if it is overtly ignored. Nat Neurosci 9: , Itthipuripat S, Cha K, Byers A, Serences JT. Two different mechanisms support selective attention at different phases of training. PLOS Biol 15: e , Itthipuripat S, Ester EF, Deering S, Serences JT. Sensory gain outperforms efficient readout mechanisms in predicting attention-related improvements in behavior. J Neurosci 34: , 2014a. Itthipuripat S, Garcia JO, Rungratsameetaweemana N, Sprague TC, Serences JT. Changing the spatial scope of attention alters patterns of neural gain in human cortex. J Neurosci 34: , 2014b. Itti L, Koch C. Computational modelling of visual attention [Online]. Nat Rev Neurosci 2: , Jerde TA, Merriam EP, Riggall AC, Hedges JH, Curtis CE. Prioritized Maps of Space in Human Frontoparietal Cortex. J Neurosci 32: , Johannes S, Münte TF, Heinze HJ, Mangun GR. Luminance and spatial attention effects on early visual processing. [Online]. Brain Res Cogn Brain Res 2: , [10 Jan. 2018]. Kahnt T, Park SQ, Haynes J-D, Tobler PN. Disentangling neural representations of value and salience in the human brain. Proc Natl Acad Sci 111: , Kastner S, Pinsk MA, De Weerd P, Desimone R, Ungerleider LG. Increased activity in human visual cortex during directed attention in the absence of visual stimulation. [Online]. Neuron 22: , ks. Katsuki F, Constantinidis C. Early involvement of prefrontal cortex in visual bottom-up attention [Online]. Nat. Neurosci. Kay KN, Weiner KS, Grill-Spector K. Attention reduces spatial uncertainty in human ventral temporal cortex. Curr. Biol. (2015). doi: /j.cub Kay KN, Winawer J, Mezer A, Wandell BA. Compressive spatial summation in human visual cortex. J Neurophysiol 110: , Kay KN, Yeatman JD. Bottom-up and top-down computations in word- and face-selective cortex. Elife 6, Kim YJ, Grabowecky M, Paller KA, Muthu K, Suzuki S. Attention induces synchronization-based response gain in steady-state visual evoked potentials. Nat Neurosci 10: , Klein BP, Harvey BM, Dumoulin SO. Attraction of position preference by spatial attention throughout human visual cortex. Neuron 84: , Klyszejko Z, Rahmati M, Curtis CE. Attentional priority determines working memory precision. Vision Res 105: 70 6, Koch C, Ullman S. Shifts in selective visual attention: towards the underlying neural circuitry. [Online]. Hum Neurobiol 4: , [7 Feb. 2017]. 21
22 Kusunoki M, Gottlieb J, Goldberg ME. The lateral intraparietal area as a salience map: the representation of abrupt onset, stimulus motion, and task relevance. [Online]. Vision Res 40: , [28 Sep. 2017]. Mackey WE, Winawer J, Curtis CE. Visual field map clusters in human frontoparietal cortex. Elife 6, MacLean MH, Diaz GK, Giesbrecht B. Irrelevant learned reward associations disrupt voluntary spatial attention. Atten Percept Psychophys 78: , MacLean MH, Giesbrecht B. Irrelevant reward and selection histories have different influences on task-relevant attentional selection. Atten Percept Psychophys 77: , 2015a. MacLean MH, Giesbrecht B. Neural evidence reveals the rapid effects of reward history on selective attention. Brain Res 1606: 86 94, 2015b. Masciocchi CM, Mihalas S, Parkhurst D, Niebur E. Everyone knows what is interesting: salient locations which should be fixated. J Vis 9: , Mazer JA, Gallant JL. Goal-related activity in V4 during free viewing visual search. Evidence for a ventral stream visual salience map. [Online]. Neuron 40: , ks. Mo C, He D, Fang F. Attention Priority Map of Face Images in Human Early Visual Cortex. J Neurosci 38: , Murray SO. The effects of spatial attention in early human visual cortex are stimulus independent. [Online]. J Vis 8: , ks. Parkhurst D, Law K, Niebur E. Modeling the role of salience in the allocation of overt visual attention. [Online]. Vision Res 42: , [7 Feb. 2017]. Pelli DG. The VideoToolbox software for visual psychophysics: transforming numbers into movies. Spat. Vis. 10: , Pestilli F, Carrasco M, Heeger DJ, Gardner JL. Attentional enhancement via selection and pooling of early sensory responses in human visual cortex. Neuron 72: , Poltoratski S, Ling S, McCormack D, Tong F. Characterizing the effects of feature salience and top-down attention in the early visual system. J Neurophysiol 118: , Rahmati M, Saber GT, Curtis CE. Population dynamics of early visual cortex during working memory. J. Cogn. Neurosci.. Saber GT, Pestilli F, Curtis CE. Saccade planning evokes topographically specific activity in the dorsal and ventral streams. J Neurosci 35: , Samaha J, Sprague TC, Postle BR. Decoding and Reconstructing the Focus of Spatial Attention from the Topography of Alpha-band Oscillations. J. Cogn. Neurosci. ( March 2016). doi: /jocn_a_
23 Serences JT, Yantis S. Selective visual attention and perceptual coherence. Trends Cogn Sci 10: 38 45, Serences JT, Yantis S. Spatially selective representations of voluntary and stimulus-driven attentional priority in human occipital, parietal, and frontal cortex. Cereb cortex 17: , Sheremata SL, Silver MA. Hemisphere-Dependent Attentional Modulation of Human Parietal Visual Field Representations. J Neurosci 35: , Silver MA, Ress D, Heeger DJ. Topographic maps of visual spatial attention in human parietal cortex. [Online]. J Neurophysiol 94: , ks. Silver MA, Ress D, Heeger DJ. Neural correlates of sustained spatial attention in human early visual cortex. [Online]. J Neurophysiol 97: , ks. Somers DC, Dale AM, Seiffert AE, Tootell RB. Functional MRI reveals spatially specific attentional modulation in human primary visual cortex. [Online]. Proc Natl Acad Sci U S A 96: , [29 Sep. 2017]. Sprague TC, Ester EF, Serences JT. Reconstructions of Information in Visual Spatial Working Memory Degrade with Memory Load. Curr. Biol. ( September 3, 2014). doi: /j.cub Sprague TC, Ester EF, Serences JT. Restoring Latent Visual Working Memory Representations in Human Cortex. Neuron 91: , Sprague TC, Saproo S, Serences JT. Visual attention mitigates information loss in small- and large-scale neural codes. Trends Cogn Sci 19: , Sprague TC, Serences JT. Attention modulates spatial priority maps in the human occipital, parietal and frontal cortices. Nat Neurosci 16: , Srimal R, Curtis CE. Persistent neural activity during the maintenance of spatial position in working memory [Online]. Neuroimage 39: , Stigchel S Van der, Belopolsky A V., Peters JC, Wijnen JG, Meeter M, Theeuwes J. The limits of top-down control of visual attention. Acta Psychol (Amst) 132: , Swisher JD, Halko MA, Merabet LB, McMains SA, Somers DC. Visual topography of human intraparietal sulcus. [Online]. J Neurosci 27: , ks. Theeuwes J. Endogenous and exogenous control of visual selection. Perception 23: , Theeuwes J. Top down and bottom up control of visual selection. Acta Psychol (Amst) 135: 77 99, Thompson KG, Bichot NP, Schall JD. Dissociation of visual discrimination from saccade programming in macaque frontal eye field. [Online]. J Neurophysiol 77: , [7 Feb. 2017]. 23
24 Usher M, Niebur E. Modeling the Temporal Dynamics of IT Neurons in Visual Search: A Mechanism for Top- Down Selective Attention. J Cogn Neurosci 8: , Veale R, Hafed ZM, Yoshida M. How is visual salience computed in the brain? Insights from behaviour, neurobiology and modelling. Philos Trans R Soc B Biol Sci 372: , Vo VA, Sprague TC, Serences JT. Spatial Tuning Shifts Increase the Discriminability and Fidelity of Population Codes in Visual Cortex. J Neurosci 37: , White BJ, Berg DJ, Kan JY, Marino RA, Itti L, Munoz DP. Superior colliculus neurons encode a visual saliency map during free viewing of natural dynamic video. Nat Commun 8: 14263, Wolfe JM. Guided Search 2.0 A revised model of visual search. Psychon Bull Rev 1: , Yantis S, Johnson DN. Mechanisms of attentional priority. [Online]. J Exp Psychol Hum Percept Perform 16: , [7 Feb. 2017]. Yildirim F, Carvalho J, Cornelissen FW. A second-order orientation-contrast stimulus for population-receptivefield-based retinotopic mapping. Neuroimage 164: , Zelinsky GJ, Bisley JW. The what, where, and why of priority maps and their interactions with visual working memory. Ann N Y Acad Sci 1339: , Zhang X, Zhaoping L, Zhou T, Fang F. Neural activities in v1 create a bottom-up saliency map. Neuron 73: , FIGURE CAPTIONS FIGURE 1: IDENTIFYING MAPS OF VISUAL SALIENCE AND BEHAVIORAL RELEVANCE (A) We define a salience map as a map of the visual scene where each position on the map indexes the importance of the corresponding location within the scene based on image-computable features, such as contrast, motion, or distinctness from the background or other scene items. Accordingly, activity within a salience map should scale with the visual salience of local scene elements. For an example scene, in which two stimuli of differing contrast are presented and a participant is cued to attend to one (dashed yellow circle), a salience map would show higher activation at visual field positions corresponding to higher contrast, even if those elements of the scene are not relevant for behavior. (B) For a given location in the scene, activation in a pure salience map would scale only with image-computable features, such as contrast (shown here). (C) We define a relevance map as a map of the visual scene where each position on the map indexes the behavioral relevance of the corresponding location. In this example scene, the relevance map would only show activation at locations relevant to the behavior of the observer, independent of their visual salience. This requires that visual locations corresponding to highly-salient but irrelevant stimuli are not reflected in a pure relevance map. (D) A location 24
25 within a pure relevance map would show high activity when the corresponding position is relevant for behavior, and low activity when it is irrelevant. Importantly, a cortical map of visual space can reflect a combination of both visual salience and behavioral relevance by virtue of its position within the visual processing hierarchy FIGURE 2: MEASURING SPATIAL MAPS OF VISUAL SALIENCE AND BEHAVIORAL RELEVANCE (A) On each trial, a fixation cue (red or blue dot) indicated whether participants (n = 8) should attend the clockwise or counterclockwise of two stimuli which appeared 500 ms after cue onset. We presented stimuli at 3.5 eccentricity separated by 144 or 72 polar angle, and for each trial we randomly rotated the display such that each polar angle was equally-likely to be stimulated on a given trial. Clockwise and anticlockwise are with respect to the polar angle between the two stimuli (this was always unambiguous, as the stimuli were never 180 apart). Stimuli, which consisted of randomly-oriented light and dark lines, flickered at 15 Hz for 3,000 ms (left inset). On every trial, a target appeared within each stimulus stream (colored border in stimulus stream inset). Targets (1,000 ms) were variable-coherence spirals called Type 1 (line angle counter-clockwise from radial) or Type 2 (shown; line angle clockwise from radial) targets. Participants responded with a button press to indicate which type of spiral appeared in the cued stimulus. (B) We presented the attended stimulus (yellow dashed circle) and unattended stimulus each at one of three logarithmically-spaced contrast levels, fully crossed. (C) On each trial, two stimuli appeared at 3.5 eccentricity, and could be either 72 or 144 polar angle apart. The attended stimulus (yellow for this example arrangement) could be any of the 5 base positions. The attended stimulus could appear clockwise (CW; solid lines) or counter-clockwise (CCW; dashed lines) with respect to the unattended stimulus. The entire stimulus display was rotated randomly about fixation on each trial, so each and every trial involved a distinct stimulus display. (D) Behavioral performance and (E) response time did not reliably vary as a function of attended or unattended stimulus contrast, or their interaction (2-way permuted repeated-measures ANOVA, p-values for main effect of attended, unattended contrast and interaction for accuracy: 0.359, 0.096, 0.853; for response time: 0.926, 0.143, 0.705). (F) Average coherence used for each contrast to achieve performance in B-C. Though qualitatively the coherence decreases with increasing contrast, there is no main effect of target contrast on mean coherence (1-way permuted repeated-measures ANOVA, p = 0.153). Error bars SEM across participants, n = FIGURE. 3: MEASURING SALIENCE AND RELEVANT MAPS WITH INVERTED ENCODING MODEL (A) We estimated a spatial encoding model using data from a spatial mapping task in which participants viewed flickering checkerboard discs presented across a triangular grid of positions spanning a hexagonal region of the screen with spatial jitter (see (Sprague et al. 2016)). We modeled each voxel s spatial sensitivity (i.e., receptive field or RF) as a weighted sum of smooth functions centered at each point in a triangular grid spanning the 25
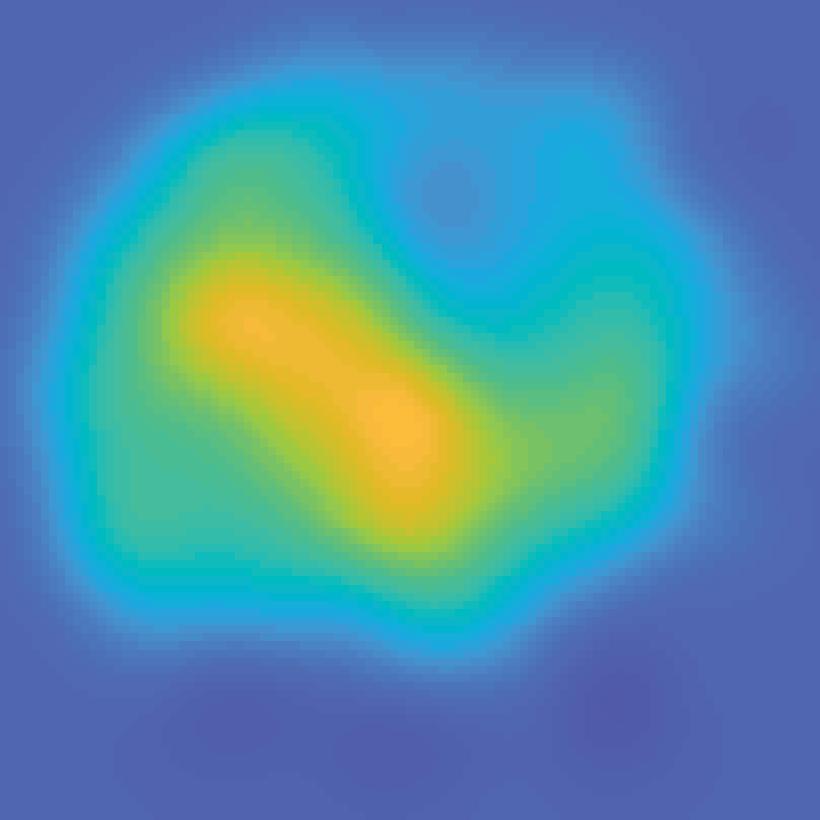
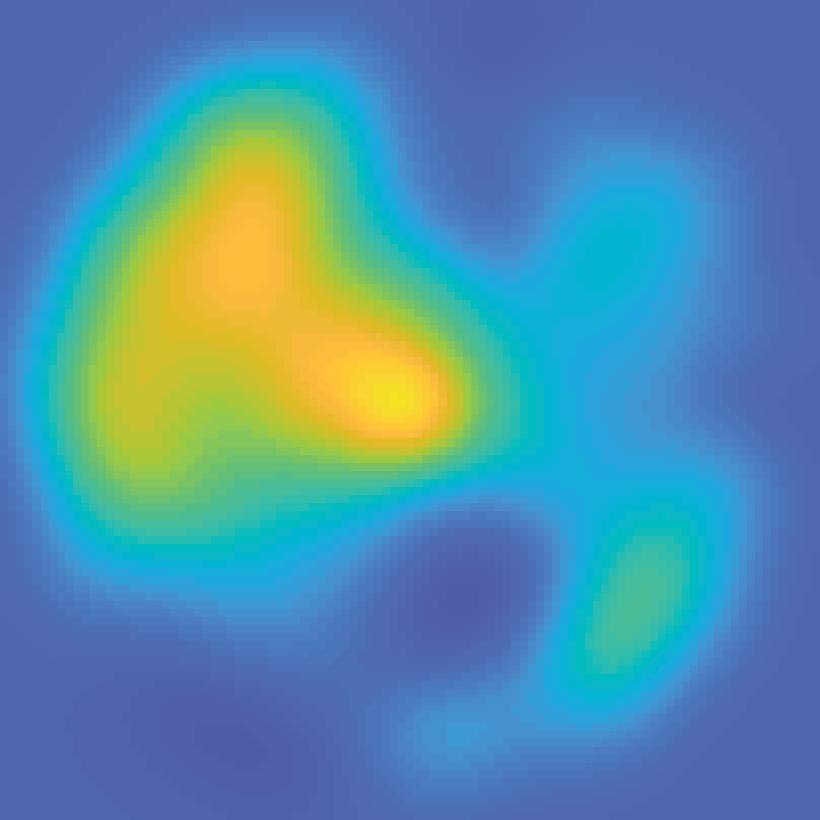
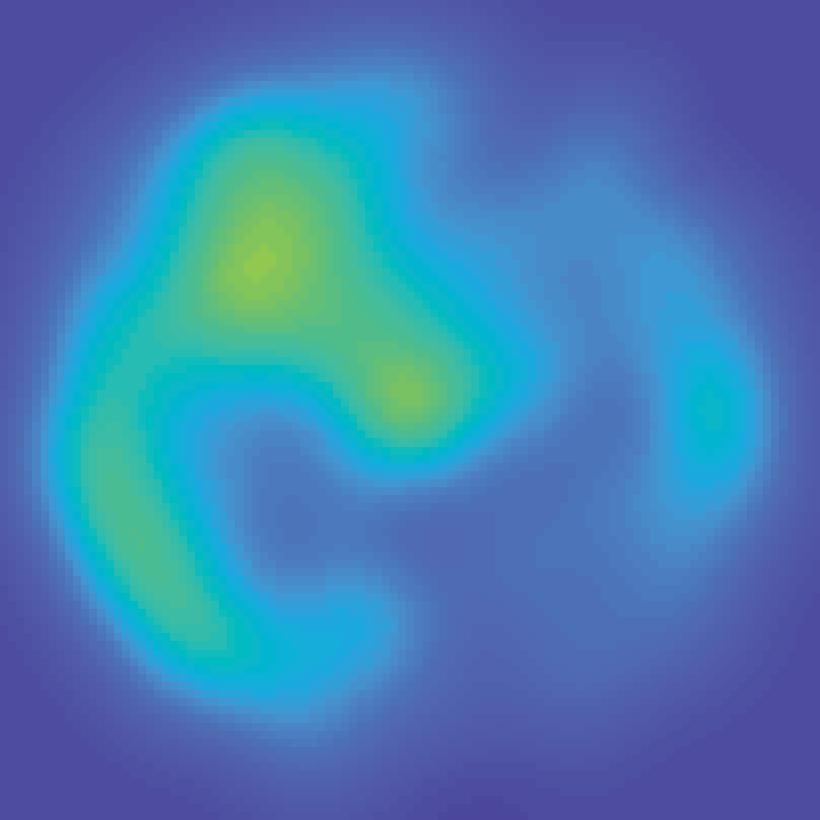
26 stimulus display visible inside the scanner. By knowing the stimulus on each trial (contrast mask) and the sensitivity profile of each modeled spatial information channel (spatial filter), we could predict how each modeled information channel should respond to each stimulus. We then solve for the contribution of each channel to the measured signal in each voxel. This step amounts to solving the standard general linear model typical in fmri analyses, and is univariate (each voxel can be estimated independently). (B) Then, we used all voxels within a region to compute an inverted encoding model (IEM). This step is multivariate; all voxels contribute to the IEM. This IEM allows us to transform activation patterns measured during the main spatial attention task (Fig. 2A) to activations of modeled information channels. Then, we compute a weighted sum of information channels based on their computed activation in the spatial attention task. These images of the visual field index the activation across the entire cortical region transformed into visual field coordinates. To quantify activation in the map, we extract the mean signal over the map area corresponding to the known stimulus positions on that trial (red dashed circle: attended stimulus position; black dashed circle: unattended stimulus position). For visualization of spatial maps averaged across trials, we rotated reconstructions as though stimuli were presented at positions indicated in cartoons (e.g., Fig. 2C). See (Sprague et al. 2016) for detailed methods on image alignment and coregistration FIGURE. 4: RECONSTRUCTED SPATIAL MAPS INDEX STIMULUS SALIENCE AND RELEVANCE Image reconstructions computed for each stimulus separation condition (grouped rows) and each stimulus contrast pair (entries within each 3x3 group of reconstructions). Within each group of reconstructions, the diagonal (top left to bottom right) are trials with matched contrasts, and are useful for visualizing the qualitative effect of behavioral relevance (spatial attention) on map profiles. Even in V1, locations near attended stimuli are represented more strongly than those near unattended stimuli. Going top-to-bottom (unattended stimulus) and left-to-right (attended stimulus) within each group of reconstructions steps through increasing stimulus contrast levels, and can be used to infer the sensitivity of each visual field map to visual salience. Color mapping scaled within each ROI independently (see inset, center left). Range subtended by vertical line for each ROI indicates color range (see color bar) for that ROI FIGURE 5: QUANTIFYING SENSITIVITY TO VISUAL SALIENCE AND BEHAVIORAL RELEVANCE ACROSS CORTEX For each stimulus, we averaged the reconstruction activation on all trials where each stimulus appeared at a given contrast (see also Fig. 6). In V1, V2, V3, and hv4, reconstructed map activation increased with stimulus salience, regardless of whether the stimulus was attended. In all ROIs except for IPS2, IPS3, and spcs, reconstructed map activation also reflected behavioral relevance, such that the attended location was more active than the unattended location. Error bars SEM across participants (n = 8). Lines indicate best-fit linear contrast response 26
27 function, and all data is plotted on a log scale. All p-values available in Table 1. Black symbols indicate significant main effects or interaction (FDR-corrected across all ROIs), and gray symbols indicate trend (p 0.05, uncorrected) FIGURE 6 ATTENDED STIMULUS REPRESENTATION DOES NOT DEPEND ON DISTRACTOR STIMULUS CONTRAST (A) Reconstructed map activation for attended stimulus location across all salience combinations. Within each plot, linked points correspond to the contrast of the attended stimulus, and the individual linked points indicate the attended stimulus activation at each unattended stimulus contrast level (, 40%, 80%, left-to-right). Error bars SEM across participants. We observed no significant interactions (2-way permuted repeated-measures ANOVA within each ROI, factors of attended and unattended stimulus contrast, p 0.041, minimum p-value V3A), so we collapse across unattended stimulus salience within each attended stimulus salience level (Fig. 5). (B) Same, but for unattended stimulus activation, as sorted by attended stimulus contrast within each unattended stimulus contrast level. Again, we did not observe any significant interactions (p 0.026, minimum p-value V3A) so these are collapsed (Fig. 5). Error bars SEM. All p-values available in Table 2. Black symbols indicate significant main effects or interactions, FDR-corrected for multiple comparisons across ROIs. Gray symbols indicate trends, defined as p 0.05, uncorrected 27

28 A Salience map C Relevance map Activity B X position Y position X position D Y position Neural response Stimulus: Attended Unattended Neural response Contrast Contrast
29 A Stimulus stream (15 Hz)... Time... Cue (500 ms) Stimuli (3,000 ms) 15 Hz flicker Target appears at each position for 1,000 ms ITI (3,000-7,000 ms) Targets: Type 1 Type 2 B Unattended stimulus contrast 40% 80% 40% 80% Attended stimulus contrast Stimulus arrangement C D E F (radius) (eccentricity) Attend: Rotate stimuli on each trial Polar angle separation CW CCW Accuracy (%) Unattn: Attn: 80% 40% 80% 40% 80% 40% 40% 80% Contrast Response time (s) Unattn: Attn: 80% 40% 80% 40% 80% 40% 40% 80% Contrast Coherence (%) Attended contrast
 Encoding model (weights) Extract each voxel s signal on each mapping trial fmri activation (each voxel; all trials) B Stimulus arrangement (spatial attn task)")
30 A Estimate encoding model for each voxel (training data) Mapping stimulus Example trial Predicted channel Information channels responses (spatial filters) (regressors) All mapping trials Estimate channel weights in each voxel (GLM) Encoding model (weights) Extract each voxel s signal on each mapping trial fmri activation (each voxel; all trials) B Stimulus arrangement (spatial attn task) Invert encoding model across voxels to reconstruct spatial map (test data) ROI activation pattern from each trial fmri activation pattern (each trial) Map activation pattern to channel space Inverted encoding model (IEM) Invert encoding model (multivariate) Computed channel responses Spatial map reconstruction (weighted sum of spatial filters) Unattended stimulus representation AI151, trial 41, V1 Attended stimulus representation


31 V1 V2 V3 V3A hv4 IPS0 IPS1 IPS2 IPS3 spcs V1 V2 V3 V3A hv4 IPS0 IPS1 IPS2 IPS3 spcs 80% 40% Unattended stimulus contrast 72 apart 40% 80% Attended stimulus contrast 0.4 Max S C sp 3 S IP 2 S IP 1 S IP 0 S IP V4 A V3 V3 V2-0.2 V1 BOLD Z-score Color range (scaled by ROI) Min 40% 80% Unattended stimulus contrast 144 apart 40% 80% Attended stimulus contrast
Attention modulates spatial priority maps in the human occipital, parietal and frontal cortices
 Attention modulates spatial priority maps in the human occipital, parietal and frontal cortices Thomas C Sprague 1 & John T Serences 1,2 Computational theories propose that attention modulates the topographical
Supplementary materials for: Executive control processes underlying multi- item working memory
 Supplementary materials for: Executive control processes underlying multi- item working memory Antonio H. Lara & Jonathan D. Wallis Supplementary Figure 1 Supplementary Figure 1. Behavioral measures of
Report. Reconstructions of Information in Visual Spatial Working Memory Degrade with Memory Load
 Current Biology 24, 2174 218, September 22, 214 ª214 Elsevier Ltd All rights reserved Reconstructions of Information in Visual Spatial Working Memory Degrade with Memory Load http://dx.doi.org/1.116/j.cub.214.7.66
Supplemental Information
 Current Biology, Volume 22 Supplemental Information The Neural Correlates of Crowding-Induced Changes in Appearance Elaine J. Anderson, Steven C. Dakin, D. Samuel Schwarzkopf, Geraint Rees, and John Greenwood
Attention Response Functions: Characterizing Brain Areas Using fmri Activation during Parametric Variations of Attentional Load
 Attention Response Functions: Characterizing Brain Areas Using fmri Activation during Parametric Variations of Attentional Load Intro Examine attention response functions Compare an attention-demanding
Disparity- and velocity- based signals for 3D motion perception in human MT+ Bas Rokers, Lawrence K. Cormack, and Alexander C. Huk
 Disparity- and velocity- based signals for 3D motion perception in human MT+ Bas Rokers, Lawrence K. Cormack, and Alexander C. Huk Supplementary Materials fmri response (!% BOLD) ).5 CD versus STS 1 wedge
Decoding the future from past experience: learning shapes predictions in early visual cortex
 J Neurophysiol 113: 3159 3171, 2015. First published March 5, 2015; doi:10.1152/jn.00753.2014. Decoding the future from past experience: learning shapes predictions in early visual cortex Caroline D. B.
Twelve right-handed subjects between the ages of 22 and 30 were recruited from the
 Supplementary Methods Materials & Methods Subjects Twelve right-handed subjects between the ages of 22 and 30 were recruited from the Dartmouth community. All subjects were native speakers of English,
Classification and Statistical Analysis of Auditory FMRI Data Using Linear Discriminative Analysis and Quadratic Discriminative Analysis
 International Journal of Innovative Research in Computer Science & Technology (IJIRCST) ISSN: 2347-5552, Volume-2, Issue-6, November-2014 Classification and Statistical Analysis of Auditory FMRI Data Using
Supplementary Note Psychophysics:
 Supplementary Note More detailed description of MM s subjective experiences can be found on Mike May s Perceptions Home Page, http://www.senderogroup.com/perception.htm Psychophysics: The spatial CSF was
Introduction to Computational Neuroscience
 Introduction to Computational Neuroscience Lecture 11: Attention & Decision making Lesson Title 1 Introduction 2 Structure and Function of the NS 3 Windows to the Brain 4 Data analysis 5 Data analysis
Perceptual Learning of Motion Direction Discrimination with Suppressed and Unsuppressed MT in Humans: An fmri Study
 Perceptual Learning of Motion Direction Discrimination with Suppressed and Unsuppressed MT in Humans: An fmri Study Benjamin Thompson 1 *, Bosco S. Tjan 2, Zili Liu 3 1 Department of Optometry and Vision
Supplementary information Detailed Materials and Methods
 Supplementary information Detailed Materials and Methods Subjects The experiment included twelve subjects: ten sighted subjects and two blind. Five of the ten sighted subjects were expert users of a visual-to-auditory
Object Substitution Masking: When does Mask Preview work?
 Object Substitution Masking: When does Mask Preview work? Stephen W. H. Lim (psylwhs@nus.edu.sg) Department of Psychology, National University of Singapore, Block AS6, 11 Law Link, Singapore 117570 Chua
Attention Improves Encoding of Task-Relevant Features in the Human Visual Cortex
 8210 The Journal of Neuroscience, June 1, 2011 31(22):8210 8219 Behavioral/Systems/Cognitive Attention Improves Encoding of Task-Relevant Features in the Human Visual Cortex Janneke F. M. Jehee, 1,2 Devin
Control of visuo-spatial attention. Emiliano Macaluso
 Control of visuo-spatial attention Emiliano Macaluso CB demo Attention Limited processing resources Overwhelming sensory input cannot be fully processed => SELECTIVE PROCESSING Selection via spatial orienting
Neural Strategies for Selective Attention Distinguish Fast-Action Video Game Players
 Neural Strategies for Selective Attention Distinguish Fast-Action Video Game Players - Online First - Springer 7/6/1 1:4 PM Neural Strategies for Selective Attention Distinguish Fast-Action Video Game
Supplementary Information Methods Subjects The study was comprised of 84 chronic pain patients with either chronic back pain (CBP) or osteoarthritis
 or osteoarthritis") Supplementary Information Methods Subjects The study was comprised of 84 chronic pain patients with either chronic back pain (CBP) or osteoarthritis (OA). All subjects provided informed consent to procedures
Supplementary Information Methods Subjects The study was comprised of 84 chronic pain patients with either chronic back pain (CBP) or osteoarthritis (OA). All subjects provided informed consent to procedures
Optimal Deployment of Attentional Gain during Fine Discriminations
 The Journal of Neuroscience, May 30, 2012 32(22):7723 7733 7723 Behavioral/Systems/Cognitive Optimal Deployment of Attentional Gain during Fine Discriminations Miranda Scolari, 1 Anna Byers, 1 and John
Orientation Selectivity of Motion-Boundary Responses in Human Visual Cortex
 J Neurophysiol 104: 2940 2950, 2010. First published September 22, 2010; doi:10.1152/jn.00400.2010. Orientation Selectivity of Motion-Boundary Responses in Human Visual Cortex Jonas Larsson, 1 David J.
Retinotopy & Phase Mapping
 Retinotopy & Phase Mapping Fani Deligianni B. A. Wandell, et al. Visual Field Maps in Human Cortex, Neuron, 56(2):366-383, 2007 Retinotopy Visual Cortex organised in visual field maps: Nearby neurons have
WHAT DOES THE BRAIN TELL US ABOUT TRUST AND DISTRUST? EVIDENCE FROM A FUNCTIONAL NEUROIMAGING STUDY 1
 SPECIAL ISSUE WHAT DOES THE BRAIN TE US ABOUT AND DIS? EVIDENCE FROM A FUNCTIONAL NEUROIMAGING STUDY 1 By: Angelika Dimoka Fox School of Business Temple University 1801 Liacouras Walk Philadelphia, PA
Supplementary Information
 Supplementary Information The neural correlates of subjective value during intertemporal choice Joseph W. Kable and Paul W. Glimcher a 10 0 b 10 0 10 1 10 1 Discount rate k 10 2 Discount rate k 10 2 10
Resistance to forgetting associated with hippocampus-mediated. reactivation during new learning
 Resistance to Forgetting 1 Resistance to forgetting associated with hippocampus-mediated reactivation during new learning Brice A. Kuhl, Arpeet T. Shah, Sarah DuBrow, & Anthony D. Wagner Resistance to
Functional topography of a distributed neural system for spatial and nonspatial information maintenance in working memory
 Neuropsychologia 41 (2003) 341 356 Functional topography of a distributed neural system for spatial and nonspatial information maintenance in working memory Joseph B. Sala a,, Pia Rämä a,c,d, Susan M.
SUPPLEMENTARY INFORMATION
 doi: doi:10.1038/nature08103 10.1038/nature08103 Supplementary Figure 1. Sample pictures. Examples of the natural scene pictures used in the main experiment. www.nature.com/nature 1 Supplementary Figure
Encoding of graded changes in spatial specificity of prior cues in human visual cortex
 J Neurophysiol 112: 2834 2849, 214. First published September 3, 214; doi:1.1152/jn.729.213. Encoding of graded changes in spatial specificity of prior cues in human visual cortex Yuko Hara and Justin
Are In-group Social Stimuli more Rewarding than Out-group?
 University of Iowa Honors Theses University of Iowa Honors Program Spring 2017 Are In-group Social Stimuli more Rewarding than Out-group? Ann Walsh University of Iowa Follow this and additional works at:
Vision Research 49 (2009) Contents lists available at ScienceDirect. Vision Research. journal homepage:
 Contents lists available at ScienceDirect. Vision Research. journal homepage:") Vision Research 49 (29) 29 43 Contents lists available at ScienceDirect Vision Research journal homepage: www.elsevier.com/locate/visres A framework for describing the effects of attention on visual responses
Vision Research 49 (29) 29 43 Contents lists available at ScienceDirect Vision Research journal homepage: www.elsevier.com/locate/visres A framework for describing the effects of attention on visual responses
Individual differences in attention strategies during detection, fine discrimination, and coarse discrimination
 Individual differences in attention strategies during detection, fine discrimination, and coarse discrimination David A. Bridwell, Elizabeth A. Hecker, John T. Serences and Ramesh Srinivasan J Neurophysiol
M Cells. Why parallel pathways? P Cells. Where from the retina? Cortical visual processing. Announcements. Main visual pathway from retina to V1
 Announcements exam 1 this Thursday! review session: Wednesday, 5:00-6:30pm, Meliora 203 Bryce s office hours: Wednesday, 3:30-5:30pm, Gleason https://www.youtube.com/watch?v=zdw7pvgz0um M Cells M cells
(Visual) Attention. October 3, PSY Visual Attention 1
 Attention. October 3, PSY Visual Attention 1") (Visual) Attention Perception and awareness of a visual object seems to involve attending to the object. Do we have to attend to an object to perceive it? Some tasks seem to proceed with little or no attention
(Visual) Attention Perception and awareness of a visual object seems to involve attending to the object. Do we have to attend to an object to perceive it? Some tasks seem to proceed with little or no attention
NeuroImage 53 (2010) Contents lists available at ScienceDirect. NeuroImage. journal homepage: www. elsevier. com/ locate/ ynimg
 Contents lists available at ScienceDirect. NeuroImage. journal homepage: www. elsevier. com/ locate/ ynimg") NeuroImage 53 (2010) 526 533 Contents lists available at ScienceDirect NeuroImage journal homepage: www. elsevier. com/ locate/ ynimg Spatial attention improves reliability of fmri retinotopic mapping
NeuroImage 53 (2010) 526 533 Contents lists available at ScienceDirect NeuroImage journal homepage: www. elsevier. com/ locate/ ynimg Spatial attention improves reliability of fmri retinotopic mapping
Group-Wise FMRI Activation Detection on Corresponding Cortical Landmarks
 Group-Wise FMRI Activation Detection on Corresponding Cortical Landmarks Jinglei Lv 1,2, Dajiang Zhu 2, Xintao Hu 1, Xin Zhang 1,2, Tuo Zhang 1,2, Junwei Han 1, Lei Guo 1,2, and Tianming Liu 2 1 School
Changing expectations about speed alters perceived motion direction
 Current Biology, in press Supplemental Information: Changing expectations about speed alters perceived motion direction Grigorios Sotiropoulos, Aaron R. Seitz, and Peggy Seriès Supplemental Data Detailed
Sum of Neurally Distinct Stimulus- and Task-Related Components.
 SUPPLEMENTARY MATERIAL for Cardoso et al. 22 The Neuroimaging Signal is a Linear Sum of Neurally Distinct Stimulus- and Task-Related Components. : Appendix: Homogeneous Linear ( Null ) and Modified Linear
fmri and visual brain function Dr. Tessa Dekker UCL Institute of Ophthalmology
 fmri and visual brain function Dr. Tessa Dekker UCL Institute of Ophthalmology 6 th February 2018 Brief history of brain imaging 1895 First human X-ray image 1950 First human PET scan - uses traces of
Nature Neuroscience doi: /nn Supplementary Figure 1. Characterization of viral injections.
 Supplementary Figure 1 Characterization of viral injections. (a) Dorsal view of a mouse brain (dashed white outline) after receiving a large, unilateral thalamic injection (~100 nl); demonstrating that
Theta sequences are essential for internally generated hippocampal firing fields.
 Theta sequences are essential for internally generated hippocampal firing fields. Yingxue Wang, Sandro Romani, Brian Lustig, Anthony Leonardo, Eva Pastalkova Supplementary Materials Supplementary Modeling
Key questions about attention
 Key questions about attention How does attention affect behavioral performance? Can attention affect the appearance of things? How does spatial and feature-based attention affect neuronal responses in
Measuring the attentional effect of the bottom-up saliency map of natural images
 Measuring the attentional effect of the bottom-up saliency map of natural images Cheng Chen 1,3, Xilin Zhang 2,3, Yizhou Wang 1,3, and Fang Fang 2,3,4,5 1 National Engineering Lab for Video Technology
A Neural Measure of Precision in Visual Working Memory
 A Neural Measure of Precision in Visual Working Memory Edward F. Ester 1, David E. Anderson 2, John T. Serences 1, and Edward Awh 2 Abstract Recent studies suggest that the temporary storage of visual
CS/NEUR125 Brains, Minds, and Machines. Due: Friday, April 14
 CS/NEUR125 Brains, Minds, and Machines Assignment 5: Neural mechanisms of object-based attention Due: Friday, April 14 This Assignment is a guided reading of the 2014 paper, Neural Mechanisms of Object-Based
Models of Attention. Models of Attention
 Models of Models of predictive: can we predict eye movements (bottom up attention)? [L. Itti and coll] pop out and saliency? [Z. Li] Readings: Maunsell & Cook, the role of attention in visual processing,
Supplemental Material
 1 Supplemental Material Golomb, J.D, and Kanwisher, N. (2012). Higher-level visual cortex represents retinotopic, not spatiotopic, object location. Cerebral Cortex. Contents: - Supplemental Figures S1-S3
Toward the neural causes of human visual perception and behavior
 Toward the neural causes of human visual perception and behavior Kaoru Amano Center for Information and Neural Networks (CiNet) National Institute of Information and Communications Technology (NICT) Graduate
Chapter 5. Summary and Conclusions! 131
 ! Chapter 5 Summary and Conclusions! 131 Chapter 5!!!! Summary of the main findings The present thesis investigated the sensory representation of natural sounds in the human auditory cortex. Specifically,
Attention: Neural Mechanisms and Attentional Control Networks Attention 2
 Attention: Neural Mechanisms and Attentional Control Networks Attention 2 Hillyard(1973) Dichotic Listening Task N1 component enhanced for attended stimuli Supports early selection Effects of Voluntary
Enhanced attentional gain as a mechanism for generalized perceptual learning in human visual cortex
 Enhanced attentional gain as a mechanism for generalized perceptual learning in human visual cortex Anna Byers and John T. Serences J Neurophysiol 112:1217-1227, 2014. First published 11 June 2014; doi:10.1152/jn.00353.2014
Stimulus-Driven Attentional Capture and Attentional Control Settings
 Journal of Experimental Psychology: Human Perception and Performance 1993, Vol. 19, No. 3, 676-681 Copyright 1993 by the American Psychological Association. Inc. (XW6-152VJ.VS3.00 OBSERVATIONS Stimulus-Driven
Frank Tong. Department of Psychology Green Hall Princeton University Princeton, NJ 08544
 Frank Tong Department of Psychology Green Hall Princeton University Princeton, NJ 08544 Office: Room 3-N-2B Telephone: 609-258-2652 Fax: 609-258-1113 Email: ftong@princeton.edu Graduate School Applicants
Topographic Organization in and near Human Visual Area V4
 11896 The Journal of Neuroscience, October 31, 2007 27(44):11896 11911 Behavioral/Systems/Cognitive Topographic Organization in and near Human Visual Area V4 Kathleen A. Hansen, Kendrick N. Kay, and Jack
Procedia - Social and Behavioral Sciences 159 ( 2014 ) WCPCG 2014
 WCPCG 2014") Available online at www.sciencedirect.com ScienceDirect Procedia - Social and Behavioral Sciences 159 ( 2014 ) 743 748 WCPCG 2014 Differences in Visuospatial Cognition Performance and Regional Brain Activation
Available online at www.sciencedirect.com ScienceDirect Procedia - Social and Behavioral Sciences 159 ( 2014 ) 743 748 WCPCG 2014 Differences in Visuospatial Cognition Performance and Regional Brain Activation
fmri and visual brain function
 fmri and visual brain function Dr Elaine Anderson (presented by Dr. Tessa Dekker) UCL Institute of Ophthalmology 28 th February 2017, NEUR3001 Brief history of brain imaging 1895 First human X-ray image
Table 1. Summary of PET and fmri Methods. What is imaged PET fmri BOLD (T2*) Regional brain activation. Blood flow ( 15 O) Arterial spin tagging (AST)
 Regional brain activation. Blood flow ( 15 O) Arterial spin tagging (AST)") Table 1 Summary of PET and fmri Methods What is imaged PET fmri Brain structure Regional brain activation Anatomical connectivity Receptor binding and regional chemical distribution Blood flow ( 15 O)
Table 1 Summary of PET and fmri Methods What is imaged PET fmri Brain structure Regional brain activation Anatomical connectivity Receptor binding and regional chemical distribution Blood flow ( 15 O)
Spatially Global Representations in Human Primary Visual Cortex during Working Memory Maintenance
 15258 The Journal of Neuroscience, December 2, 2009 29(48):15258 15265 Behavioral/Systems/Cognitive Spatially Global Representations in Human Primary Visual Cortex during Working Memory Maintenance Edward
The Role of Color and Attention in Fast Natural Scene Recognition
 Color and Fast Scene Recognition 1 The Role of Color and Attention in Fast Natural Scene Recognition Angela Chapman Department of Cognitive and Neural Systems Boston University 677 Beacon St. Boston, MA
The role of cognitive effort in subjective reward devaluation and risky decision-making
 The role of cognitive effort in subjective reward devaluation and risky decision-making Matthew A J Apps 1,2, Laura Grima 2, Sanjay Manohar 2, Masud Husain 1,2 1 Nuffield Department of Clinical Neuroscience,
Functional MRI Mapping Cognition
 Outline Functional MRI Mapping Cognition Michael A. Yassa, B.A. Division of Psychiatric Neuro-imaging Psychiatry and Behavioral Sciences Johns Hopkins School of Medicine Why fmri? fmri - How it works Research
Comparing event-related and epoch analysis in blocked design fmri
 Available online at www.sciencedirect.com R NeuroImage 18 (2003) 806 810 www.elsevier.com/locate/ynimg Technical Note Comparing event-related and epoch analysis in blocked design fmri Andrea Mechelli,
Functional Elements and Networks in fmri
 Functional Elements and Networks in fmri Jarkko Ylipaavalniemi 1, Eerika Savia 1,2, Ricardo Vigário 1 and Samuel Kaski 1,2 1- Helsinki University of Technology - Adaptive Informatics Research Centre 2-
Visual Mental Imagery Induces Retinotopically Organized Activation of Early Visual Areas
 Cerebral Cortex October 2005;15:1570--1583 doi:10.1093/cercor/bhi035 Advance Access publication February 2, 2005 Visual Mental Imagery Induces Retinotopically Organized Activation of Early Visual Areas
Report. Decoding Successive Computational Stages of Saliency Processing
 Current Biology 21, 1667 1671, October 11, 2011 ª2011 Elsevier Ltd All rights reserved DOI 10.1016/j.cub.2011.08.039 Decoding Successive Computational Stages of Saliency Processing Report Carsten Bogler,
SUPPLEMENTARY MATERIAL. Comparisons between V4 and previous schemes that do not involve conceptual
 SUPPLEMENTARY MATERIAL Comparisons between V4 and previous schemes that do not involve conceptual conflict V4v (field-sign-defined): In 1995, a region called V4v (Figure 11) was defined by its non-mirror-reversed
On the implementation of Visual Attention Architectures
 On the implementation of Visual Attention Architectures KONSTANTINOS RAPANTZIKOS AND NICOLAS TSAPATSOULIS DEPARTMENT OF ELECTRICAL AND COMPUTER ENGINEERING NATIONAL TECHNICAL UNIVERSITY OF ATHENS 9, IROON
Interaction between Bottom-up Saliency and Top-down Control: How Saliency Maps Are Created in the Human Brain
 Cerebral Cortex December 2012;22:2943 2952 doi:10.1093/cercor/bhr384 Advance Access publication January 16, 2011 Interaction between Bottom-up Saliency and Top-down Control: How Saliency Maps Are Created
Feature-Independent Neural Coding of Target Detection during Search of Natural Scenes
 The Journal of Neuroscience, July 11, 2012 32(28):9499 9510 9499 Behavioral/Systems/Cognitive Feature-Independent Neural Coding of Target Detection during Search of Natural Scenes Fei Guo, Tim J. Preston,
The Optimality of Sensory Processing during the Speed Accuracy Tradeoff
 7992 The Journal of Neuroscience, June 6, 2012 32(23):7992 8003 Behavioral/Systems/Cognitive The Optimality of Sensory Processing during the Speed Accuracy Tradeoff Tiffany Ho, 1 Scott Brown, 3 Leendert
BRAIN STATE CHANGE DETECTION VIA FIBER-CENTERED FUNCTIONAL CONNECTIVITY ANALYSIS
 BRAIN STATE CHANGE DETECTION VIA FIBER-CENTERED FUNCTIONAL CONNECTIVITY ANALYSIS Chulwoo Lim 1, Xiang Li 1, Kaiming Li 1, 2, Lei Guo 2, Tianming Liu 1 1 Department of Computer Science and Bioimaging Research
Functional Fixedness: The Functional Significance of Delayed Disengagement Based on Attention Set
 In press, Journal of Experimental Psychology: Human Perception and Performance Functional Fixedness: The Functional Significance of Delayed Disengagement Based on Attention Set Timothy J. Wright 1, Walter
Modeling the Deployment of Spatial Attention
 17 Chapter 3 Modeling the Deployment of Spatial Attention 3.1 Introduction When looking at a complex scene, our visual system is confronted with a large amount of visual information that needs to be broken
NeuroImage. Relationship between BOLD amplitude and pattern classification of orientation-selective activity in the human visual cortex
 NeuroImage 63 (2012) 1212 1222 Contents lists available at SciVerse ScienceDirect NeuroImage journal homepage: www.elsevier.com/locate/ynimg Relationship between BOLD amplitude and pattern classification
Visual Selection and Attention
 Visual Selection and Attention Retrieve Information Select what to observe No time to focus on every object Overt Selections Performed by eye movements Covert Selections Performed by visual attention 2
A Neurally-Inspired Model for Detecting and Localizing Simple Motion Patterns in Image Sequences
 A Neurally-Inspired Model for Detecting and Localizing Simple Motion Patterns in Image Sequences Marc Pomplun 1, Yueju Liu 2, Julio Martinez-Trujillo 2, Evgueni Simine 2, and John K. Tsotsos 2 1 Department
Voxel-based Lesion-Symptom Mapping. Céline R. Gillebert
 Voxel-based Lesion-Symptom Mapping Céline R. Gillebert Paul Broca (1861) Mr. Tan no productive speech single repetitive syllable tan Broca s area: speech production Broca s aphasia: problems with fluency,
QUANTIFYING CEREBRAL CONTRIBUTIONS TO PAIN 1
 QUANTIFYING CEREBRAL CONTRIBUTIONS TO PAIN 1 Supplementary Figure 1. Overview of the SIIPS1 development. The development of the SIIPS1 consisted of individual- and group-level analysis steps. 1) Individual-person
Visual Context Dan O Shea Prof. Fei Fei Li, COS 598B
 Visual Context Dan O Shea Prof. Fei Fei Li, COS 598B Cortical Analysis of Visual Context Moshe Bar, Elissa Aminoff. 2003. Neuron, Volume 38, Issue 2, Pages 347 358. Visual objects in context Moshe Bar.
Supporting Information
 Supporting Information Daitch et al. 1.173/pnas.13794711 SI Experimental Procedures Subject-Specific Methods. Patients 3 and 4. Patients 3 and 4 had vagal nerve stimulators, which are incompatible with
Neural Population Tuning Links Visual Cortical Anatomy to Human Visual Perception
 Article Neural Population Tuning Links Visual Cortical Anatomy to Human Visual Perception Highlights d Variability in cortical thickness and surface area has opposite functional impacts Authors Chen Song,
Irrelevant features at fixation modulate saccadic latency and direction in visual search
 VISUAL COGNITION, 0000, 00 (0), 111 Irrelevant features at fixation modulate saccadic latency and direction in visual search Walter R. Boot Department of Psychology, Florida State University, Tallahassee,
Dissociation of Response Variability from Firing Rate Effects in Frontal Eye Field Neurons during Visual Stimulation, Working Memory, and Attention
 2204 The Journal of Neuroscience, February 8, 2012 32(6):2204 2216 Behavioral/Systems/Cognitive Dissociation of Response Variability from Firing Rate Effects in Frontal Eye Field Neurons during Visual
Supporting Online Material for
 www.sciencemag.org/cgi/content/full/324/5927/646/dc1 Supporting Online Material for Self-Control in Decision-Making Involves Modulation of the vmpfc Valuation System Todd A. Hare,* Colin F. Camerer, Antonio
Cortical Representation of Space Around the Blind Spot
 J Neurophysiol 94: 3314 3324, 2005. First published July 20, 2005; doi:10.1152/jn.01330.2004. Cortical Representation of Space Around the Blind Spot Holger Awater, 1,2 Jess R. Kerlin, 1,2 Karla K. Evans,
Validating the Visual Saliency Model
 Validating the Visual Saliency Model Ali Alsam and Puneet Sharma Department of Informatics & e-learning (AITeL), Sør-Trøndelag University College (HiST), Trondheim, Norway er.puneetsharma@gmail.com Abstract.
Neural Networks: Tracing Cellular Pathways. Lauren Berryman Sunfest 2000
 Neural Networks: Tracing Cellular Pathways Lauren Berryman Sunfest 000 Neural Networks: Tracing Cellular Pathways Research Objective Background Methodology and Experimental Approach Results and Conclusions
Attentional Capture Under High Perceptual Load
 Psychonomic Bulletin & Review In press Attentional Capture Under High Perceptual Load JOSHUA D. COSMAN AND SHAUN P. VECERA University of Iowa, Iowa City, Iowa Attentional capture by abrupt onsets can be
Behavioral Task Performance
 Zacks 1 Supplementary content for: Functional Reorganization of Spatial Transformations After a Parietal Lesion Jeffrey M. Zacks, PhD *, Pascale Michelon, PhD *, Jean M. Vettel, BA *, and Jeffrey G. Ojemann,
The Effect of Spatial Attention on Contrast Response Functions in Human Visual Cortex
 The Journal of Neuroscience, January 3, 2007 27(1):93 97 93 Brief Communications The Effect of Spatial Attention on Contrast Response Functions in Human Visual Cortex Giedrius T. Buracas and Geoffrey M.
Hallucinations and conscious access to visual inputs in Parkinson s disease
 Supplemental informations Hallucinations and conscious access to visual inputs in Parkinson s disease Stéphanie Lefebvre, PhD^1,2, Guillaume Baille, MD^4, Renaud Jardri MD, PhD 1,2 Lucie Plomhause, PhD
Encoding model of temporal processing in human visual cortex
 Encoding model of temporal processing in human visual cortex Anthony Stigliani a, Brianna Jeska a, and Kalanit Grill-Spector a,b, PNAS PLUS a Department of Psychology, Stanford University, Stanford, CA
Rules of apparent motion: The shortest-path constraint: objects will take the shortest path between flashed positions.
 Rules of apparent motion: The shortest-path constraint: objects will take the shortest path between flashed positions. The box interrupts the apparent motion. The box interrupts the apparent motion.
Department of Computer Science, University College London, London WC1E 6BT, UK;
 vision Article Ocularity Feature Contrast Attracts Attention Exogenously Li Zhaoping Department of Computer Science, University College London, London WCE 6BT, UK; z.li@ucl.ac.uk Received: 7 December 27;
COMPUTATIONAL NEUROIMAGING OF HUMAN VISUAL CORTEX
 Annu. Rev. Neurosci. 1999. 22:145 73 Copyright c 1999 by Annual Reviews. All rights reserved COMPUTATIONAL NEUROIMAGING OF HUMAN VISUAL CORTEX Brian A. Wandell Neuroscience Program and Department of Psychology,
The hippocampus operates in a threshold manner during spatial source memory Scott D. Slotnick a and Preston P. Thakral b
 Cognitive neuroscience and neuropsychology 265 The hippocampus operates in a threshold manner during spatial source memory Scott D. Slotnick a and Preston P. Thakral b Long-term memory can be based on
Show Me the Features: Regular Viewing Patterns. During Encoding and Recognition of Faces, Objects, and Places. Makiko Fujimoto
 Show Me the Features: Regular Viewing Patterns During Encoding and Recognition of Faces, Objects, and Places. Makiko Fujimoto Honors Thesis, Symbolic Systems 2014 I certify that this honors thesis is in
TMS Disruption of Time Encoding in Human Primary Visual Cortex Molly Bryan Beauchamp Lab
 TMS Disruption of Time Encoding in Human Primary Visual Cortex Molly Bryan Beauchamp Lab This report details my summer research project for the REU Theoretical and Computational Neuroscience program as
Templates for Rejection: Configuring Attention to Ignore Task-Irrelevant Features
 Journal of Experimental Psychology: Human Perception and Performance 2012, Vol. 38, No. 3, 580 584 2012 American Psychological Association 0096-1523/12/$12.00 DOI: 10.1037/a0027885 OBSERVATION Templates