COMPUTATIONAL NEUROIMAGING OF HUMAN VISUAL CORTEX
|
|
|
- Imogen Foster
- 5 years ago
- Views:
Transcription
1 Annu. Rev. Neurosci : Copyright c 1999 by Annual Reviews. All rights reserved COMPUTATIONAL NEUROIMAGING OF HUMAN VISUAL CORTEX Brian A. Wandell Neuroscience Program and Department of Psychology, Stanford University, Stanford, California 94305; wandell@stanford.edu KEY WORDS: fmri, visual cortex, motion, color, behavior, dyslexia ABSTRACT Functional magnetic resonance imaging is a new neuroimaging method for probing the intact, alert, human brain. With this tool, brain activity that has been hidden can now be measured. Recent advances in measuring and understanding human neural responses underlying motion, color, and pattern perception are reviewed. In individual human brains, we can now identify the positions of several retinotopically organized visual areas; measure retinotopic organization within these areas; identify the location of a motion-sensitive region in individual brains; measure responses associated with contrast, color, and motion; and measure effects of attentional modulation on visually evoked responses. By framing experiments and analyses as questions about visual computation, these neuroimaging measurements can be coupled closely with those from other basic vision-science methods. INTRODUCTION In his monumental work on visual perception, a work that has remained relevant to vision scientists for more than 100 years, von Helmholtz (1866) suggested how to think about the problem of vision. What we see, he wrote, is the solution to a computational problem. Starting with the light absorbed within our eyes, such objects are always imagined as being present in the field of vision as would have to be there in order to produce the same impression on the nervous mechanism. Von Helmholtz frames vision as a computational problem: Given the photon absorptions within our eyes, how do we compute the most likely cause? In some cases, the solution may be unique, so that only a single object X/99/ $
2 146 WANDELL could explain the sensory data. In other cases, the computational solution is underdetermined, so that we must rely on our experience or the experience in our genes to select the perception that we imagine. Von Helmholtz s framing remains a key idea that integrates the many techniques used by vision scientists. The separate disciplines within vision science all contribute to and benefit from thinking of vision as a computational problem. For example, the computational nature of perception is revealed by many of the visual illusions we use to introduce our field. Illusions demonstrate that what we see are not direct measurements of the image but rather interpretations, and important illusions tell us something about the nature of these computations. Also, any account of the visual pathways, from single-unit functional properties to anatomical interconnections, are most meaningful when we understand how they explain the visual computations of motion, pattern, and color (Hubel 1988, Wandell 1995). Significant insights into computational processing have also been obtained by studying individuals who have lost a portion of their brain, or who were raised without the opportunity for vision to develop normally (Gregory 1974, Zeki 1993). And finally, many insights into the nature of visual computation itself have been derived from the work of individuals who build computational devices to perform visual tasks (Marr 1982). This review poses a question: How can neuroimaging results be integrated into the fundamental computational framework of vision science? To answer the question, I review recent advances in measuring and understanding the neural basis of visual computation in the human brain. The review mainly covers measurements made using a relatively new technique, functional magnetic resonance imaging (fmri). It has been seven years since the first measurements of fmri signals from human cortex were reported (Kwong et al 1992, Ogawa et al 1992). In that short time, much progress has been made in both measurements and analysis of visually driven activity. In individual human brains, we can now identify the positions of several retinotopically organized visual areas; measure retinotopic organization within these areas; identify the location of a motion-sensitive region in individual brains; measure responses associated with contrast, color, and motion; measure localized deficits in activity in subjects with cortical damage; and measure effects of attentional modulation on visually evoked responses. Some of these measurements have important precedents in the positron emission tomography (PET) literature, but the signal-to-noise ratio (SNR) of fmri is superior and provides better spatial localization. Finally, the accessibility of magnetic resonance scanners has greatly expanded the number of research groups contributing to neuroimaging, and this has brought with it vitality and new ideas. After reviewing the results, I take stock of how fmri technology has changed the experimental neuroimaging questions we ask and the analytic methods we
3 COMPUTATIONAL NEUROIMAGING 147 use. Prior to fmri, neuroimaging primarily tested hypotheses about the localization of function by asking whether two stimuli (or tasks) caused statistically different signals within the brain. The SNR of fmri is large enough to measure the size of differences, not just their presence or absence. For this reason, hypotheses about neural computations, beyond localization, can be framed and tested. Hence, fmri opens up a new array of questions and has initiated an era of computational neuroimaging. In this spirit, this review emphasizes that portion of the recent visual neuroimaging literature that addresses computational questions. THE fmri SIGNAL The Biological Source of the fmri Signal The fmri signal is an indirect measure of neural activity that measures changes in the local blood oxygenation level (Moseley & Glover 1995). The indirect nature of the fmri signal is illustrated in Figure 1. In a control condition, arteries supply nearly 100% oxygenated blood and roughly 40% of the oxygen is consumed locally, so that the blood returning in the veins comprises 60% oxygenated and 40% deoxygenated blood. When a stimulus causes significant neural activity, an additional supply of oxygenated blood is delivered, but not all of the incremental supply is metabolized. Because the fraction of extracted oxygen is reduced compared with the control state, the proportion of oxygenated to deoxygenated blood becomes, say, 63:37. The change in the ratio of oxygenated to deoxygenated blood alters the local magnetic field and this can be detected in the MR signal. This signaling mechanism is the blood oxygen level dependent (BOLD) signal. 1 The first reports of BOLD fmri activity caused widespread excitement in the scientific community in general. Within the smaller community of neuroimaging scientists, the reports raised two important questions: What neural signals are responsible for controlling the vascular changes, and which elements of the vasculature provide the main source of the BOLD fmri signals? Neural Control Signals Understanding the neural control signals will be a great help in interpreting the fmri signal and relating the measurements to single-unit observations. There 1 Fox & Raichle (1986) and Fox et al (1988) suggested that the mismatch between the incremental blood supply and the incremental metabolism arises because the two systems are only loosely coupled. Buxton & Frank (1997) suggest that given certain basic considerations about the flow of oxygenated blood, the difference is to be expected even if delivery and metabolism are closely linked. It is important to decide this issue in order to understand whether or not the BOLD signal is a precise and reliable estimator of the neural activity.
 In the control state, the arterial supply is fully oxygenated and the flow rate is F.")
4 148 WANDELL Figure 1 Functional magnetic resonance imaging measures activity-dependent changes in blood oxygenation. (A) In the control state, the arterial supply is fully oxygenated and the flow rate is F. Roughly 40% of the oxygen is metabolized, so that the ratio of oxygenated-to-deoxygenated blood in the venous is roughly 60:40. (B) In the active state, the arterial flow increases, in this example by 30%. The brain oxygen consumption increases, but by a smaller amount. Hence, the proportion of oxygen in the venous return increases. Because oxygenated blood (HbO 2 ) is magnetically transparent (diamagnetic), whereas deoxygenated blood (Hb) is not transparent (paramagnetic), differences in the ratio between HbO 2 and Hb can be detected in a magnetic resonance scanner. are several significant questions about the neural signals that control the vascular response measured by fmri, including (a) whether excitatory and inhibitory activity influence the fmri signal in similar ways, and (b) whether simultaneous excitation and inhibition at a single cell, resulting in no action potentials, may nonetheless cause an increase in metabolic and vascular response. Intrinsic optical imaging is a promising method for analyzing some of these questions about the BOLD fmri signal (Bonhoeffer & Grinvald 1996). In this procedure, the surface of an animal s brain is exposed, and changes in the cortical surface reflectance are measured while the animal views visual stimuli. The cortical reflectance changes are comprised of several components that can be
5 COMPUTATIONAL NEUROIMAGING 149 separated by their wavelength composition (Malonek & Grinvald 1996). Reflectance changes of the slowly developing component (2s) occur at the same wavelengths as the spectral differences between oxy- and deoxyhemoglobin, so that this component of the intrinsic optical signal may have a common basis with the BOLD fmri signal. Further studies using this method may clarify the relationship between the vascular response and various neural signals because both neural and optical signals can be measured simultaneously in animal experiments. Spatiotemporal Resolution of the fmri Signal Another important question is whether the BOLD signals arise only from relatively large blood vessels, or whether they arise also from the fine vascular mesh called parenchyma. Identifying the vascular source of the BOLD signals is important because oxygenation levels in large veins reflects activity pooled over large brain regions. Hence, if the BOLD signals arise only from large vessels, the neural resolution of the method could be poor despite the high resolution of the MR signal. Informally, this issue was called the brain-vein debate. To a large degree, this question has been answered by measurements that probe the spatiotemporal resolution of the fmri signal. These measurements exploit the retinotopic organization of visual cortex using variants of the methods described in the next section. Here, I summarize the conclusions of these measurements. First, in retinotopically organized cortex, the fmri signal changes position smoothly rather than jumping discretely between large veins. Hence, in this portion of cortex, the BOLD signal appears to arise from small as well as large veins. We do not yet know whether this observation will generalize to other parts of the brain (e.g. Lai et al 1993). Second, using 1.5T magnets, it is possible (a) to distinguish reliably between activations separated by less than 1.5 mm in cortex, and (b) to resolve spatial variation of the response of 1.1 cycles/cm of cortex (Engel et al 1997a). The first finding shows that fmri localization is slightly too low to measure certain columnar structures, such as the ocular dominance columns in primary visual cortex. The second finding shows that the responding vasculature drains from cortical regions that span significantly less than a centimeter. Measures of spatial resolution are limited by the signal-to-noise ratio (SNR) of the measurement procedures and apparatus. Current measurements represent only a worst-case bound, and it is possible that the vasculature will reveal finer signals as the instrumentation and procedures improve. Third, Boynton et al (1996) measured the temporal response of the fmri signal in calcarine cortex. They modeled the fmri signal as comprising an
6 150 WANDELL instantaneous nonlinearity that transforms image contrast to a neural response, followed by a linear temporal filter associated with the sluggish vasculature. From measurements using several simple stimuli, they estimated that the temporal filter has a constant delay of roughly 2.5 s and then slowly rises to a peak, roughly 3 s later. In summary, the spatial and temporal resolution measurements show that in visual cortex, the signal reflects activity localized within a few millimeters of space and a few seconds of time. This resolution has proven sufficient to answer important questions about the organization of human visual cortex. In the following, results concerning retinotopy, visual area identification, motion and color responses, and behavioral correlations are reviewed. VISUAL AREAS Over the last 30 years, our understanding of monkey visual cortex has been revolutionized by the identification and analysis of a set of roughly 30 visual areas (Zeki 1969, Van Essen & Zeki 1978, Felleman & Van Essen 1991). Along with single-units and columnar architecture, visual areas define a fundamental spatial scale of brain computation. In monkeys, visual areas have been defined using a variety of criteria, including (a) anatomical connections, (b) the stimulus selectivity of single-unit responses, (c) architectural properties (e.g. columnar and immunohistochemistry), and (d ) retinotopic organization. Most of the methods used in monkeys cannot be used in humans. However, with fmri it is possible to use retinotopic organization to identify and characterize several human visual areas. Noninvasively identifying the visual areas in the human brain is important for three reasons. First, the visual areas are an important part of brain organization, and a complete understanding of visual computations must include an explanation of how the computations are segregated with respect to these structures. Second, visual area measurements provide an important link between the last two decades of animal studies and human fmri studies. The close agreement between these measurements show that the monkey studies provide an excellent model for many features of human cortex and, conversely, that fmri measurements can contribute to the ongoing analyses of computations in visual cortex. Third, the visual areas represent an important anatomical and functional coordinate frame for identifying locations within cortex. After mapping the visual areas in an observer s brain once, it is possible to describe subsequent measurements of cortical stimulus selectivity with respect to the functional coordinate frame of visual areas. In this way, activity can be accurately compared across observers, even when their physical brain sizes and shapes differ.
7 COMPUTATIONAL NEUROIMAGING 151 Retinotopic Organization of Visual Areas Within each hemisphere, human area V1 occupies a roughly 4- by 8-cm area located at the posterior pole of the brain in the occipital lobe. A large fraction of area V1 falls in the calcarine sulcus (Figure 2). Studies of patients with localized cortical damage showed that the receptive fields of neurons within area V1 are retinotopically organized (Holmes 1918, 1944; Horton & Hoyt 1991). From posterior to anterior cortex, the visual field representation shifts from the center (fovea) to the periphery. This dimension of retinotopic organization is commonly referred to as eccentricity. Because of the retinotopic organization of primary visual cortex (V1) and several nearby areas (V2 and V3), it is possible to create stimuli that control the location of the neural activity. Figure 3A represents a flickering ring that contracts slowly from the periphery to the center of the visual field. When the ring reaches the center of the viewing aperture, it is replaced by a new ring at the edge of the display. This contracting ring stimulus creates a traveling wave of neural activity that spreads from anterior to posterior cortex, along the eccentricity dimension. The activity spans several adjacent visual areas, including V2 and V3, that share a similar retinotopic organization with respect to eccentricity. (The ability to control the spatial position of the neural activity was used to make the spatial resolution measurements described earlier.) Figure 2 Retinotopic organization of visual areas in the left hemisphere. (A) Icons indicating the visual field positions of the central fixation and periphery (black dot, white surround; white dot, black surround ) and the horizontal and vertical meridia (dashed lines) are shown. (B) The approximate positions of areas V1 (hatch marks) and V2 (dotted area) in a sketch of the medial surface of the left occipital lobe are shown. The visual field icons are superimposed on the sketch to indicate the retinotopic organization within areas V1 and V2. The positions of the fundus of the calcarine sulcus (Ca) and parieto-occipital sulcus (PO) are also shown.
.")
8 152 WANDELL A second dimension of retinotopic organization, the angular dimension, is represented on a path that traverses from the lower to the upper lip of the calcarine sulcus. Along this path, the visual field representation shifts from the upper vertical meridian through the horizontal meridian to the lower vertical meridian (see Figure 2B). Figure 3B represents a flickering wedge that rotates slowly about fixation. This rotating wedge stimulus creates a traveling wave of neural activity that spreads from the lower to the upper lip of the calcarine. Because of the different angular representations in V1 and V2 (see Figure 2B), the traveling wave reverses direction at the border. Similarly, although not shown, visual area V3 surrounds V2 and the traveling wave reverses direction again at the V2/V3 border. Hence, measurements using the rotating wedge stimulus (Figure 3B) reveal the boundaries between retinotopically organized visual areas. Traveling Wave Measurements First, consider a contracting ring stimulus. When it is seen through a small aperture in the visual field, such as the receptive field of a neuron, the visual field alternates between the flickering checkerboard and the neutral gray field. The alternation of the contrast pattern and uniform field causes a waxing and waning of the neural response. If the stimulus moves at a constant velocity from periphery to fovea, the alternation frequency of the response will be the same for all points in the visual field. However, the temporal phase of the response will differ. Neurons with receptive fields in the periphery will respond earlier Figure 3 Images of the stimuli used for phase-encoded measurements of retinotopic organization. The contracting ring (A) and rotating wedge (B) are shown at different moments in time. (arrows) The direction of motion of the stimuli; not present in the actual display. These stimuli cause a traveling wave of neural activity to sweep across the cortex in either the eccentricity dimension (A) or the angular dimension (B).

9 COMPUTATIONAL NEUROIMAGING 153 than neurons with receptive fields near the fovea. Hence, the phase of the response defines the receptive field position along the dimension of eccentricity. Retinotopic mapping methods that rely on this phase signal to map the visual field responses are called phase-encoded. Figure 4A shows a linear region of interest running from posterior to anterior cortex in an image plane that runs along the fundus of the calcarine sulcus. Figure 4B shows the time course of the fmri signal at each location along the linear region. One axis of the surface plot represents time, and the second axis represents distance along the region of interest. The time series at each pixel modulates six times, corresponding to the number of periods of the stimulus. The phase of the modulation varies systematically with position in the cortex. The plot shows the traveling wave of neural activity caused by the contracting rings. Figure 4 The traveling wave response in primary visual cortex in the left hemisphere caused by a contracting ring stimulus. (A) The magnetic resonance image (MRI) is shown in a plane that runs through the calcarine sulcus. The region of interest, shown by the black line, runs along the calcarine sulcus. (B) The functional fmri time series at each location within the region of interest is shown. The signal modulates each time the ring passes through a cycle. The phase of the activation in posterior cortex is delayed compared with posterior anterior, creating a traveling wave.
10 154 WANDELL Flattened Cortical Representations The calcarine sulcus, like most large brain structures, does not stay within a plane over a large distance. To obtain a more complete representation of the activity in area V1, measurements must be integrated from several different images. One way to do this is to take advantage of the fact that neocortical gray matter is much like a folded sheet. Segment the gray matter in a series of image planes and then computational algorithms can be used to unfold the cortical sheet, representing it in a single image. It is also possible to physically unfold macaque and human cortex (e.g. Van Essen & Maunsell 1980, Tootell et al 1983, Gattas et al 1988, Van Essen & Drury 1997). Such representations are useful for understanding the spatial organization of visual areas. To create flattened representations of human cortex from anatomical MR images, two technical challenges must be met. First, methods are required for identifying the location and contiguity of the gray matter. Teo et al (1998) have developed (and distributed) a method for obtaining a segmented, connected representation from MR images. Figure 5 (see color figure) shows an example of an anatomical image with the regions segmented into white and gray matter. Notice that gray matter on opposite sides of a sulcus can be adjacent within a single image at the 1-mm resolution. Although they touch in the image, the gray matter points are not connected because contiguity is determined by the relationship to the white matter. Unless one correctly determines the contiguity of the gray matter points arising from opposite sides of the sulcus, it is impossible to create accurate flattened representations of the gray matter. Second, a method is required for converting the representation of the folded, three-dimensional gray matter into a flattened, two-dimensional image. This part of the flattening procedure can be accomplished by specifying the measures within the original (folded) representation that should be preserved and then defining an algorithm to create a flattened representation that preserves these measures. A number of measures have been proposed. Carman et al (1995), Dale & Sereno (1993), and Drury et al (1996) suggest preserving a mixture of measures, including angles and area. Wandell et al (1996) designed and distributed an algorithm to preserve interpoint distances (this method of gray matter segmentation and unfolding can be obtained at wandell.html). Figure 6 (see color figure) shows an example of how gray matter from a collection of images was merged into a single picture using the flattening algorithm of Wandell et al (1996). Eight different anatomical images are shown with a color code. The position of the gray matter from each of these planes is indicated in the large image. The locations of major anatomical landmarks are also shown. By overlaying the measured functional MR activity onto this flattened representation, we obtain a more complete picture of the retinotopic organization
 The software identifies the white matter, indicated by the tan overlay, based on intensity levels and structural considerations.")
11 Figure 5 The semiautomatic selection of gray matter from magnetic resonance images. (A) The software identifies the white matter, indicated by the tan overlay, based on intensity levels and structural considerations. Notice that the white matter on opposite sides of sulci is well separated. (B) The location of the gray matter is computed by adding gray matter layers onto the white matter (green overlay). Gray matter positions on either side of a sulcus can abut one another without interfering with the unfolding algorithm because contiguity is determined by the white matter.

12 Figure 6 Flattened representation of one occipital lobe. An automatic algorithm transforms the segmented, connected representation of gray matter into an image in which interpoint planar distances are close to the same interpoint distances measured along the cortical surface. The seven small images are anatomical measurements made perpendicular to the calcarine sulcus. The center of the flattened representation is a point at the fundus of the calcarine sulcus in the middle anatomical image. The correspondence between gray matter in each of the seven images and the main image is indicated (colored overlays). The gray-shading of other gray-matter points, those not in any of the seven measurement planes, indicates the position of the unfolded points with respect to the medial (light) to lateral (dark) axis of the brain. The location of the fundus of the calcarine (Ca) and the parieto-occipital (PO) sulci are shown in the flattened representation (dashed cyan lines).
13 COMPUTATIONAL NEUROIMAGING 155 across the cortical surface. Figure 7 (see color figure) shows an example of phase-encoded responses to an expanding ring stimulus, which is the same as the contracting ring but moving in the opposite direction. The colors code the response phase; each phase is uniquely associated with an eccentricity in the visual field. Comparison of the legend with the colors on the flattened image shows the broad retinotopic organization with respect to eccentricity. From measurements of responses to expanding and contracting rings, we can estimate how the eccentricity dimension is represented in intact human brains. Engel et al (1994, 1997a) developed a simple formula relating position within area V1 (millimeters from the point representing 10 ) to position within the visual field (degree of visual angle): ln E = 0.63D , where E is eccentricity measured in degree from fixation, and D is cortical distance (in millimeters) from the cortical position representing 10 of eccentricity. Cortical locations anterior to that point are assigned positive values, and cortical locations posterior to that point are assigned negative values. This representation agrees well with estimates obtained using completely different means in monkeys and humans (DeYoe et al 1996, Engel et al 1997a, Horton & Hockina 1997; RBH Tootell, personal communication). In a widely cited paper, Sereno et al (1995) suggested that there were significant differences in cortical magnification between monkey and human striate and extrastriate regions. This observation has not been replicated. Visual Area Boundaries The rotating wedge stimulus creates a traveling wave that reverses direction at the boundaries between the visual areas. These reversals occur because of the representation of the angular representation (see Figure 2B). By measuring the locations of the traveling wave reversals using fmri, the visual area boundaries can be located (Sereno et al 1995, DeYoe et al 1996, Engel et al 1997a). Figure 8 (see color figure) shows the angular dimension of retinotopic organization on a flattened cortical representation. The colors represent the angular position in the visual field of the rotating wedge that activated the region. The visual area boundaries, derived from phase-encoded fmri measurements, are placed at locations where the traveling wave reversed direction. For example, starting at the dorsal boundary of V1 and proceeding ventrally, the visual field representation changes from lower vertical midline, to horizontal meridian, to upper vertical midline. Then, at the V1/V2 border, the representation changes direction from vertical midline back to horizontal midline. The traveling wave reverses direction at the V1/V2 border and the boundary is placed at the location of this reversal.
 that evoked activity.")
14 Figure 7 The retinotopic structure of a human brain with respect to eccentricity. The color at each position shows the visual stimulus eccentricity (see inset) that evoked activity. Other details as in Figure 6.
15 156 WANDELL Area V1, in calcarine cortex of each hemisphere, represents an entire hemifield. The dorsal and ventral boundaries of V1 are separated by roughly 4 cm and fall on the cortical surface at the upper and lower lips of the calcarine. Area V1 is bordered by two cortical regions, each roughly 1 cm, that form area V2. Dorsal V2 (V2d) represents the lower quarter of the visual field and ventral V2 (V2v) represents the upper visual field. The strip V2v (V2d) is bounded by another distinct cortical strip called V3v (V3d). Like their neighbors, V3d and V3v each represent one quarter of the visual field, and each spans roughly 1 cm of width and 6 8 cm of length. In macaque, dorsal V3, but not ventral V3, receives projections from V1; dorsal V3, but not ventral V3, has a large minority of directionally selective cells; the anterior border of ventral V3 is demarcated by a strip of callosal inputs that is more precisely organized than the callosal inputs to dorsal V3 (Burkhalter et al 1986, Felleman et al 1997). It is unclear whether these separate quarter field representations (V3d, V3v) should be regarded as one or two areas, so we follow the convention of maintaining separate labels for each of the quarter field representations: V2d, V3d, V2v, and V3v. An additional retinotopically organized area, V3A, is adjacent to V3d (Tootell et al 1997). Area V3A represents the entire hemifield and has a field representation analogous to area V3A in macaque. Figure 8 shows one more retinotopically organized ventral region, tentatively labeled V4v. Further improvements in the SNR and unfolding methods may well result in the discovery of additional retinotopically organized areas. The retinotopic organization of human visual areas identified using fmri are consistent with that described in macaque. We are just beginning to learn whether their functional properties are similar. For example, Tootell et al (1997) have argued that there are important differences with respect to motion selectivity. An important task that confronts us now is to understand the way in which visual information flows and is transformed by neuronal processing in these areas. MOTION How are the basic features of the visual world, such as color and motion, represented in the human brain? In this section, I describe three examples of measurements of cortical responses to moving stimuli, measurements that address computational questions, including (a) the distribution of activity in response to moving stimuli, (b) the effect of stimulus contrast and color on responses to moving stimuli, and (c) responses to different types of motion.
. Their positions are determined from reversals in the direction of the traveling wave caused by a rotating wedge.")
16 Figure 8 Visual area locations in a flattened representation of one human occipital lobe. The color at each position shows the visual stimulus angular position (see inset) that evoked activity. The boundaries between the visual areas are shown (dashed lines). Their positions are determined from reversals in the direction of the traveling wave caused by a rotating wedge. See text and Figure 6 for other details.
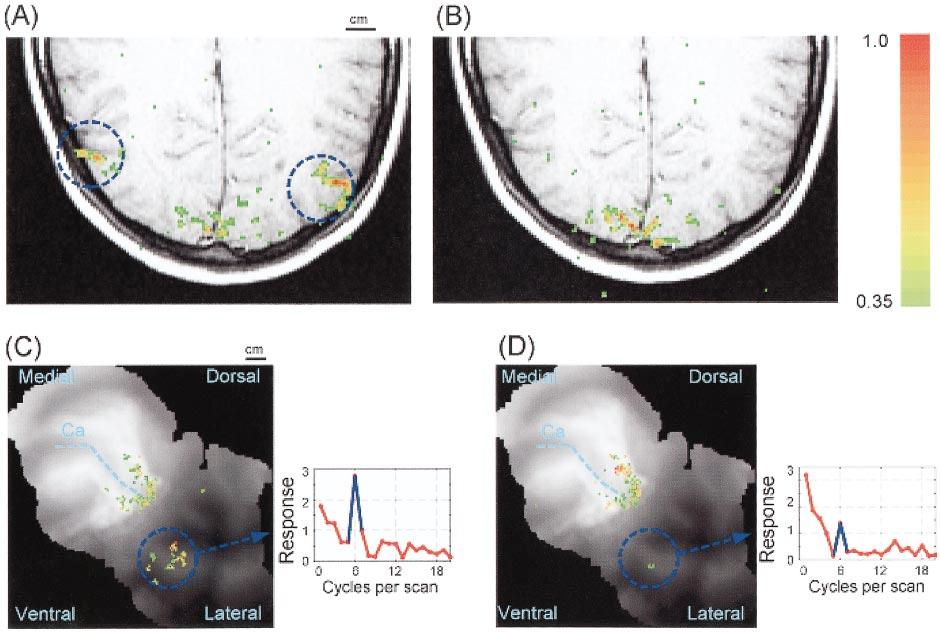
17 COMPUTATIONAL NEUROIMAGING 157 Motion Responsive Cortex Using PET and averaging across a group of observers, it is possible to identify a human brain region that is sensitive to moving stimuli (Zeki et al 1991). Using fmri, it is possible to identify this motion-selective region in individual subjects within a few minutes (Tootell et al 1995). Figure 9A (see color figure) summarizes the response level in a single image plane roughly parallel but slightly ventral to the calcarine sulcus. The stimulus consisted of a moving field of dots that alternated with a static field of dots every 18 s (response alternation frequency of 1/36 Hz). Figure 9B shows measurements in the same image plane when the stimulus was a flickering checkerboard alternating with a static checkerboard. The color overlay measures the fraction of the power in the signal at the stimulus alternation frequency (scale bar at the right). Activity in the posterior portion of the brain is similar during the two scans. Activity in the lateral anterior region is larger in response to the moving dots than to the flickering checkerboard. The motion-selective portion of cortex spans several image planes. Figure 9C shows measurements made with the moving dots on a flattened representation of one occipital lobe. Figure 9D shows the responses to the flickering checkerboard. The motion-selective region is near the parieto-occipital junction, roughly 3 cm from foveal representation in posterior V1. The insets show the amplitude of the signal as a function of cycles per scan time in the motionresponsive region. The stimulus was repeated six times during the scan, and the response amplitude 2 at six cycles per scan is much higher in the presence of motion. There is also significant activity to the flickering checkerboard, but it is reduced in MT+ and not reduced (not shown) in V1. The color map levels are adjusted to emphasize the differences between the two brain regions. Based on the neuroimaging evidence and anatomical studies of this region in the human brain, it is widely believed that the motion-responsive region contains the human homologue of monkey MT (Zeki et al 1991, Tootell & Taylor 1995). The remaining observation needed to confirm the significance of this region for motion is to demonstrate that the signals are direction selective, as are the single-unit responses in the motion-selective regions of monkey brain. Because the fmri activity may also arise from adjacent visual areas that are responsive to motion, activity from the motion-selective portion of the brain identified by fmri is commonly called MT+. Activity within the motion-responsive region has been confirmed in many laboratories. The most powerful response occurs in primary visual cortex and 2 Here and in the following, response amplitude measures the percentage modulation of the fmri response at the stimulus alternation frequency.
18
19 Figure 9 The position of region MT+. (A) (pseudo-color overlay) Regions with strong modulation as the observer viewed rapidly moving dots alternating with static dots. There is considerable activity in the posterior brain and on the lateral surface, near the parieto-occipital border (see circled regions) in a region that is generally called MT+. (B) When a flickering checkerboard is alternated with a static checkerboard, the MT+ activity is reduced, but activity in the posterior region, near primary visual cortex, is little changed. (C, D) Data in the same two experiments, measured in several planes parallel to the calcarine sulcus, are shown integrated into a flattened representation. The fundus of the calcarine sulcus is shown (Ca). Other details as in Figure 6. (inset graphs) The amplitude of the functional magnetic resonance imaging (fmri) signal in MT+ as a function of temporal frequency for each experiment. The stimulus alternated six times during each experiment, and the insets show the increase in the modulation at this frequency. (color bar) Measures the temporal correlation between the visual stimulus and the fmri signal; it applies to all of the images.
20 158 WANDELL MT+, though other portions of the brain respond as well. The strength of the human fmri response suggests that, as in monkeys, there is a strong signal between primary visual cortex and MT+. The next challenge is to measure the signaling properties of these pathways and to understand their relationship to motion perception. Motion Contrast-Response Functions The relatively high SNR of the fmri signal makes it possible to measure how the response depends on stimulus parameters such as contrast, speed, and color. Figure 10 shows the amplitude of the fmri signal in MT+ as the subject alternately views a moving, circular, red/green grating for 18 s followed by a uniform field for 18 s. Each point shows the average amplitude measured from six such alternations, spanning 216 s. The horizontal axis shows the grating contrast levels. Using black-white monochrome gratings, reliable MT+ signals can be measured at stimulus contrast as low as 0.5% (not shown). Responses in MT+ to moving patterns saturate at contrast levels as low as 5%, as shown for the red-green pattern in Figure 10. High sensitivity and early saturation have been reported for black-white monochrome gratings (see also Tootell et al 1995). Figure 10 also shows the contrast-response function in area V1 measured with the same moving target during the same experiment. The response curve in area V1 saturates at roughly four times the MT+ saturation contrast. Tootell et al Figure 10 Contrast-response functions measured in area V1 and MT+ using moving gratings. The two panels show measurements made with a moving red/green grating (left) and a short-wavelength (S) cone grating (right). Curves are the average of measurements in two observers. The response to the red/green grating reaches its maximum level at a very low stimulus contrast, on the order of 5%. Responses to the S-cone grating also saturate, but at stimulus contrasts roughly six times higher, near 30%. L, Long wavelength; M, middle wavelength.
21 COMPUTATIONAL NEUROIMAGING 159 (1995) reported this general relationship, though they report that the response in area V1 saturates at stimulus contrasts that are 15 times greater than MT+. Why do signals from MT+ saturate at such low contrast levels? The contrast response function to moving targets in area MT+ may be a mechanism that reduces the effect of stimulus contrast on perceived motion. Motion computations should not confound image contrast with image velocity: A low contrast stimulus and a high contrast stimulus, moving at the same velocity, should appear to move at the same velocity. As a general rule, objects do not appear to change speed as they move in front of different backgrounds. Because MT+ responses saturate at low contrast levels, stimulus contrast is generally irrelevant for the computations therein. If we assume that firing rate mainly represents stimulus contrast, then a step-like contrast response function is a computational method of reducing the influence of contrast on motion estimation (Heeger et al 1996, Wandell 1995). For relatively low contrast levels and for certain colored patterns, stimulus contrast strongly influences perceived speed (Stone & Thompson 1992, Cavanagh & Anstis 1991). One of the most powerful examples of this effect occurs when comparing the speed of a stimulus that excites the short-wavelength (S) cones with another that excites the long- (L) and middle-wavelength (M) cones: The S-cone stimulus has the illusion of moving more slowly than an equally visible (L,M)-cone stimulus. Activity in area MT+ initiated by signals in the S-cones require a much higher contrast level before achieving the same response level as (L,M)-cone signals (Poirson & Wandell 1997) (Figure 10, right). The high saturation level for S-cone activity in MT+ may be the source of these contrast-color speed illusions. Motion and Segmentation Retinal image motion may arise from different physical causes. One important cause is self-motion: When the observer moves, there is motion in the retinal image. A second source is object-motion: When objects shift their relative positions, there is also motion in the retinal image. Processing of these two types of motion requires analyzing image information in different ways. When the observer moves, coordinated changes occur across a large part of the visual field. But when an object moves, changes are restricted to local image regions. Hence, the processing needed to interpret the two types of motion differ, with respect to the integration of information across the visual field. These two types of retinal image motion both represent information about objects. When the observer moves, differences in the local motion can be used to identify depth discontinuities, which, in turn, often correspond to object boundaries. Local differences in retinal image motion are also common signs of object boundaries. Because the two types of motion both provide information
22 160 WANDELL about object boundaries, the representation from these two types of motion may be integrated into a single visual account of the scene. The experiments described up to this point used stimuli with a single motion across the image, much like self-motion. A series of PET and fmri studies has measured the activity caused by stimuli comprised of two sections moving in different directions, more closely coupled to object-motion (Van Oostende et al 1997, Dupont et al 1997). An example of a stimulus with two moving parts is, say, a circular aperture filled with dots. The dots in the upper half move to the right and the dots in the lower half move to the left. The opposing dot motions leads to the percept of a motion-defined boundary at the contour where the dots motions differ. There are conflicting reports concerning the responses to moving stimuli that contain a motion-defined boundary. Van Oostende et al (1997; see also Dupont 1997) report that motion-defined boundaries cause substantially more activity than does uniform motion in a region they call kinetic occipital (KO) and whose location, although not known precisely, appears to be somewhat beyond V3A (Van Oostende et al 1997). According to this group, comparison of the responses caused by these stimuli shows significant differences in MT+ but little or no difference in regions near calcarine cortex. Reppas et al (1997) report measurements using similar stimuli and describe significant, retinotopically organized activation in V1, V2, and V3. They do not describe a response in the position corresponding to KO, and they write that a robust fmri signal that is selective for motion segmentation...is largely absent from the motion selective area MT/V5 and far extrastriate visual areas (p. 175). Finally, Mendola et al (1997) report that motion-defined boundaries do cause a significant response in MT+. Single-unit data suggest that neurons in primary visual cortex should respond to motion-defined boundaries (Chaudhari & Albright 1997). Perhaps more surprising is the small difference between uniform motion and motion-defined boundaries in MT+. Single units in monkey MT are reported to have opponentsurrounds that is their responses are increased by stimuli with motion-defined boundaries (Allman et al 1985, Born & Tootell 1992). Although there is no consensus on the activity caused by motion-defined boundaries, there is some agreement on the overall pattern of response to simple moving stimuli. Powerful responses to moving stimuli are found in large regions of the visual cortex. It is likely that motion computations specialized for the different types of motion are parceled out among these different areas. Initial measurements show that the relative size of motion-responses in MT+, V3A, and KO differ depending on the nature of the motion stimulus. Refining the visual stimuli should help reveal how the responses in these different regions work together to form the computational pathways for motion analysis.
23 COLOR COMPUTATIONAL NEUROIMAGING 161 Color perception results from a sequence of optical and neural computations, beginning in the eye and continuing through the cortex. The initial transformations, and most importantly the absorption of light by the visual photopigments within the L-, M-, and S-cones, are well understood. How the photopigments encode light, and how the photopigment properties can be related to human color-matching, is one of the most complete and satisfying analyses linking brain and behavior in all of neuroscience (Wandell 1995, Ch. 4). Current computational analyses of color vision seek to explain how appearance, beyond simple matching, can be explained by the properties of retinal and cortical signals. A great deal of perceptual evidence suggests that the central visual pathways represent color signals using an opponent-colors representation comprised of three parallel pathways. The red/green pathway receives opposing L and M signals, and the blue/yellow pathway receives opposing S and L + M signals. The luminance pathway receives L- and M-cone responses of a common sign. The opponent-colors hypothesis helps to explain many perceptual aspects of color vision, including color discrimination and color appearance (Wandell 1955, Ch. 9). Single-unit studies have revealed possible neural substrates of the opponentcolors signals. Neurons in the retina, lateral geniculate nucleus, and area V1 receive opposing signals from the different cone classes (DeValois et al 1966, Derrington et al 1984, Lennie et al 1990). It has proven difficult, however, to link the response properties of neurons to the perceptual measurements of opponent colors. Using PET and averaging across a group of observers, Zeki et al (1991) sought to determine whether there is a human brain region that responds particularly strongly to the red/green and blue/yellow opponent-colors dimensions. They compared the PET signal caused by a pair of stimuli. One stimulus, the color image, was a collection of 15 rectangular patches spanning 40 of visual angle. The second stimulus, the monochrome image, consisted of the same collection of rectangular shapes, but the colors were changed to be gray patches luminance-matched to the original, so that the stimuli differed only in their opponent-colors levels. Comparing the activity evoked by the two types of images, Zeki et al report that the only area showing a significant change of activity was in the region of the lingual and fusiform gyri. They suggest that the responsive area should be named human V4, based on a proposed homology with macaque V4, an area they believe is specialized for color perception. For the present, I retain the neutral name of VO to refer to the location in ventral-occipital cortex (see also Sakai et al 1995).
24 162 WANDELL The result is puzzling because the data suggest no path for the opponentcolors signals to reach VO; no significant activity is reported in likely sources of this signal, such as V1. One interpretation of these data is that V1 and VO have different opponent-colors responsivities; the opponent-colors signals are amplified in VO compared with V1, similar to the V1-MT relationship for motion. In contrast to the PET measurements, fmri measurements demonstrate significant opponent-colors signals in area V1 and V2 (Engel et al 1997b, Kleinschmidt et al 1996, Wandell et al 1998). Figure 11A summarizes the fmri responses to various colored contrast patterns designed to initiate signals in the L- and M-cones but to be invisible to the S-cones. The stimulus spatial pattern consisted of a flickering, colored checkerboard pattern whose two colors were complementary with respect to a neutral gray background. The checkerboard was alternated with a neutral gray background, and responses were measured at the alternation rate. To investigate whether the color responses in VO differ from those in V1 and V2, Wandell et al (1998) measured the iso-response curve in that region. They found iso-response curves quite similar to those in V1 (Figure 11B). It appears that the color tuning in VO, measured with simple contrast reversing patterns, is not a unique specialization. Rather, the same color turning can be measured Figure 11 Comparison of the color tuning in area V1 (left) and an active region located in the ventral occipital region near the anterior portion of the calcarine sulcus (right). (solid curves) Stimuli producing an equal functional magnetic resonance imaging response; (dashed curves) an 80% confidence interval. Stimuli with opposing long- (L) and middle-wavelength (M) cone contrasts (opponent-colors signals) are about four times more effective at evoking a response than stimuli with covarying L- and M-cone contrasts. The two regions share a common color tuning; other measurements (not shown) suggest that the signal in VO is slightly stronger.
25 COMPUTATIONAL NEUROIMAGING 163 as early as V1. While the responses in V1 and VO were highly correlated, the magnitude of the VO responses were slightly larger. This may be the reason it was possible to identify VO activity, but not the V1 activity, in the PET study (Zeki et al 1991). The color tuning within a cortical region changes dramatically with the spatiotemporal properties of the visual stimulus (Engel et al 1997b). Hence, the intrinsic color tuning within a cortical region cannot be measured with a single space-time pattern. To appreciate this point, notice that V1 responses to S-cone driven moving targets are small compared with responses to red/green targets (Figure 10). But, when the stimulus is 1-Hz flickering, V1 responses to S-cone targets are comensurate to L, M-cone targets (Engel et al 1997b). Until shown otherwise, expect that the color tuning within an area depends on the spatiotemporal structure of the stimulus. Differences in color tuning will probably covary with the spatiotemporal structure of the target. This may be a second reason why Zeki et al (1991) failed to detect opponent colors signals in area V1. As color measurements expand to include more stimuli and cortical territory, it should be possible to measure the distribution of opponent-colors signals across much of the cortical surface. Neuroimaging measurements can complement the information obtained using other methods. Behavioral experiments have proven the importance of opponent-colors signals for visual perception. Single-unit measurements have shown how the cone signals are combined and provided several possible substrates for opponent-colors. FMRI experiments are well suited to analyze activity at the spatial resolution level somewhat finer than areas, and in the next few years columns, for comparing these signals closely with behavioral measurements in individual observers. BEHAVIOR AND NEUROIMAGING CORRELATIONS Task Demands A central goal of vision science is to understand the relationship between neural responses and behavioral performance. Using fmri, one can acquire neuroimaging and behavioral measurements during the same experimental session, using the same experimental stimuli. The SNR is large enough to permit reliable comparisons between the perceptual and neuroimaging measures in a single observer, without averaging across a population. One of the most promising observations for linking behavior and neural activity comes from the study of visual attention. FMRI measurements made as an observer alternates between tasks have shown that the fmri signal fluctuates, even when there is no change in the stimulus (e.g. O Craven et al 1997,
Retinotopy & Phase Mapping
 Retinotopy & Phase Mapping Fani Deligianni B. A. Wandell, et al. Visual Field Maps in Human Cortex, Neuron, 56(2):366-383, 2007 Retinotopy Visual Cortex organised in visual field maps: Nearby neurons have
Reading Assignments: Lecture 5: Introduction to Vision. None. Brain Theory and Artificial Intelligence
 Brain Theory and Artificial Intelligence Lecture 5:. Reading Assignments: None 1 Projection 2 Projection 3 Convention: Visual Angle Rather than reporting two numbers (size of object and distance to observer),
Lateral Geniculate Nucleus (LGN)
") Lateral Geniculate Nucleus (LGN) What happens beyond the retina? What happens in Lateral Geniculate Nucleus (LGN)- 90% flow Visual cortex Information Flow Superior colliculus 10% flow Slide 2 Information
Lateral Geniculate Nucleus (LGN) What happens beyond the retina? What happens in Lateral Geniculate Nucleus (LGN)- 90% flow Visual cortex Information Flow Superior colliculus 10% flow Slide 2 Information
OPTO 5320 VISION SCIENCE I
 OPTO 5320 VISION SCIENCE I Monocular Sensory Processes of Vision: Color Vision Mechanisms of Color Processing . Neural Mechanisms of Color Processing A. Parallel processing - M- & P- pathways B. Second
Supplementary Note Psychophysics:
 Supplementary Note More detailed description of MM s subjective experiences can be found on Mike May s Perceptions Home Page, http://www.senderogroup.com/perception.htm Psychophysics: The spatial CSF was
Retinotopic Organization in Human Visual Cortex and the Spatial Precision of Functional MRI
 Retinotopic Organization in Human Visual Cortex and the Spatial Precision of Functional MRI Stephen A. Engel, Gary H. Glover and Brian A. Wandell Department of Psychology, Neuroscience Program and Department
Lighta part of the spectrum of Electromagnetic Energy. (the part that s visible to us!)
") Introduction to Physiological Psychology Vision ksweeney@cogsci.ucsd.edu cogsci.ucsd.edu/~ /~ksweeney/psy260.html Lighta part of the spectrum of Electromagnetic Energy (the part that s visible to us!)
Introduction to Physiological Psychology Vision ksweeney@cogsci.ucsd.edu cogsci.ucsd.edu/~ /~ksweeney/psy260.html Lighta part of the spectrum of Electromagnetic Energy (the part that s visible to us!)
Ch 5. Perception and Encoding
 Ch 5. Perception and Encoding Cognitive Neuroscience: The Biology of the Mind, 2 nd Ed., M. S. Gazzaniga, R. B. Ivry, and G. R. Mangun, Norton, 2002. Summarized by Y.-J. Park, M.-H. Kim, and B.-T. Zhang
Biological Bases of Behavior. 6: Vision
 Biological Bases of Behavior 6: Vision Sensory Systems The brain detects events in the external environment and directs the contractions of the muscles Afferent neurons carry sensory messages to brain
Ch 5. Perception and Encoding
 Ch 5. Perception and Encoding Cognitive Neuroscience: The Biology of the Mind, 2 nd Ed., M. S. Gazzaniga,, R. B. Ivry,, and G. R. Mangun,, Norton, 2002. Summarized by Y.-J. Park, M.-H. Kim, and B.-T. Zhang
Frank Tong. Department of Psychology Green Hall Princeton University Princeton, NJ 08544
 Frank Tong Department of Psychology Green Hall Princeton University Princeton, NJ 08544 Office: Room 3-N-2B Telephone: 609-258-2652 Fax: 609-258-1113 Email: ftong@princeton.edu Graduate School Applicants
Neural Networks: Tracing Cellular Pathways. Lauren Berryman Sunfest 2000
 Neural Networks: Tracing Cellular Pathways Lauren Berryman Sunfest 000 Neural Networks: Tracing Cellular Pathways Research Objective Background Methodology and Experimental Approach Results and Conclusions
fmri and visual brain function
 fmri and visual brain function Dr Elaine Anderson (presented by Dr. Tessa Dekker) UCL Institute of Ophthalmology 28 th February 2017, NEUR3001 Brief history of brain imaging 1895 First human X-ray image
2/3/17. Visual System I. I. Eye, color space, adaptation II. Receptive fields and lateral inhibition III. Thalamus and primary visual cortex
 1 Visual System I I. Eye, color space, adaptation II. Receptive fields and lateral inhibition III. Thalamus and primary visual cortex 2 1 2/3/17 Window of the Soul 3 Information Flow: From Photoreceptors
LISC-322 Neuroscience Cortical Organization
 LISC-322 Neuroscience Cortical Organization THE VISUAL SYSTEM Higher Visual Processing Martin Paré Assistant Professor Physiology & Psychology Most of the cortex that covers the cerebral hemispheres is
fmri and visual brain function Dr. Tessa Dekker UCL Institute of Ophthalmology
 fmri and visual brain function Dr. Tessa Dekker UCL Institute of Ophthalmology 6 th February 2018 Brief history of brain imaging 1895 First human X-ray image 1950 First human PET scan - uses traces of
Flexible Retinotopy: Motion-Dependent Position Coding in the Visual Cortex
 Flexible Retinotopy: Motion-Dependent Position Coding in the Visual Cortex David Whitney,* 1 Herbert C. Goltz, 2 Christopher G. Thomas, 1 Joseph S. Gati, 2 Ravi S. Menon, 2 Melvyn A. Goodale 1 1 The Department
M Cells. Why parallel pathways? P Cells. Where from the retina? Cortical visual processing. Announcements. Main visual pathway from retina to V1
 Announcements exam 1 this Thursday! review session: Wednesday, 5:00-6:30pm, Meliora 203 Bryce s office hours: Wednesday, 3:30-5:30pm, Gleason https://www.youtube.com/watch?v=zdw7pvgz0um M Cells M cells
Visual area MT responds to local motion. Visual area MST responds to optic flow. Visual area STS responds to biological motion.
 Visual area responds to local motion MST V3a V3 Visual area MST responds to optic flow MST V3a V3 Visual area STS responds to biological motion STS Macaque visual areas Flattening the brain What is a visual
NEUROSCIENCE. Barbora Cimrová
 NEUROSCIENCE Barbora Cimrová Neuroscience is the scientific study of the nervous system (NS) structure, organization, function of its parts and its functioning as a whole unit traditionally: branch of
Early Stages of Vision Might Explain Data to Information Transformation
 Early Stages of Vision Might Explain Data to Information Transformation Baran Çürüklü Department of Computer Science and Engineering Mälardalen University Västerås S-721 23, Sweden Abstract. In this paper
Image Processing in the Human Visual System, a Quick Overview
 Image Processing in the Human Visual System, a Quick Overview By Orazio Gallo, April 24th, 2008 The Visual System Our most advanced perception system: The optic nerve has 106 fibers, more than all the
CS294-6 (Fall 2004) Recognizing People, Objects and Actions Lecture: January 27, 2004 Human Visual System
 Recognizing People, Objects and Actions Lecture: January 27, 2004 Human Visual System") CS294-6 (Fall 2004) Recognizing People, Objects and Actions Lecture: January 27, 2004 Human Visual System Lecturer: Jitendra Malik Scribe: Ryan White (Slide: layout of the brain) Facts about the brain:
CS294-6 (Fall 2004) Recognizing People, Objects and Actions Lecture: January 27, 2004 Human Visual System Lecturer: Jitendra Malik Scribe: Ryan White (Slide: layout of the brain) Facts about the brain:
The Eye. Cognitive Neuroscience of Language. Today s goals. 5 From eye to brain. Today s reading
 Cognitive Neuroscience of Language 5 From eye to brain Today s goals Look at the pathways that conduct the visual information from the eye to the visual cortex Marielle Lange http://homepages.inf.ed.ac.uk/mlange/teaching/cnl/
Visual Physiology. Perception and Attention. Graham Hole. Problems confronting the visual system: Solutions: The primary visual pathways: The eye:
 Problems confronting the visual system: Visual Physiology image contains a huge amount of information which must be processed quickly. image is dim, blurry and distorted. Light levels vary enormously.
Visual Field Maps in Human Cortex
 Visual Field Maps in Human Cortex Brian A. Wandell, 1, * Serge O. Dumoulin, 1 and Alyssa A. Brewer 2 1 Psychology Department, Stanford University, Stanford, CA 94305-2130, USA 2 Department of Cognitive
Visual field maps, population receptive field sizes, and. visual field coverage in the human MT+ complex
 Articles in PresS. J Neurophysiol (July 8, 2009). doi:10.1152/jn.00102.2009 Visual field maps, population receptive field sizes, and visual field coverage in the human MT+ complex Kaoru Amano (1, 2), Brian
Supplementary materials for: Executive control processes underlying multi- item working memory
 Supplementary materials for: Executive control processes underlying multi- item working memory Antonio H. Lara & Jonathan D. Wallis Supplementary Figure 1 Supplementary Figure 1. Behavioral measures of
ASSUMPTION OF COGNITIVE UNIFORMITY
 The Human Brain cerebral hemispheres: two most important divisions of the brain, separated by the longitudinal fissure corpus callosum: a large bundle of axons that constitutes the major connection between
Required Slide. Session Objectives
 Vision: CNS 2018 Required Slide Session Objectives Visual system: CNS At the end of this session, students will be able to: 1. Understand how axons from the eyes travel through the optic nerves and tracts
Photoreceptors Rods. Cones
 Photoreceptors Rods Cones 120 000 000 Dim light Prefer wavelength of 505 nm Monochromatic Mainly in periphery of the eye 6 000 000 More light Different spectral sensitivities!long-wave receptors (558 nm)
Plasticity of Cerebral Cortex in Development
 Plasticity of Cerebral Cortex in Development Jessica R. Newton and Mriganka Sur Department of Brain & Cognitive Sciences Picower Center for Learning & Memory Massachusetts Institute of Technology Cambridge,
Carlson (7e) PowerPoint Lecture Outline Chapter 6: Vision
 PowerPoint Lecture Outline Chapter 6: Vision") Carlson (7e) PowerPoint Lecture Outline Chapter 6: Vision This multimedia product and its contents are protected under copyright law. The following are prohibited by law: any public performance or display,
Carlson (7e) PowerPoint Lecture Outline Chapter 6: Vision This multimedia product and its contents are protected under copyright law. The following are prohibited by law: any public performance or display,
Vision Seeing is in the mind
 1 Vision Seeing is in the mind Stimulus: Light 2 Light Characteristics 1. Wavelength (hue) 2. Intensity (brightness) 3. Saturation (purity) 3 4 Hue (color): dimension of color determined by wavelength
Visual Deficits in Amblyopia
 Human Amblyopia Lazy Eye Relatively common developmental visual disorder (~2%) Reduced visual acuity in an otherwise healthy and properly corrected eye Associated with interruption of normal early visual
Neuroscience Tutorial
 Neuroscience Tutorial Brain Organization : cortex, basal ganglia, limbic lobe : thalamus, hypothal., pituitary gland : medulla oblongata, midbrain, pons, cerebellum Cortical Organization Cortical Organization
Prof. Greg Francis 7/31/15
 s PSY 200 Greg Francis Lecture 06 How do you recognize your grandmother? Action potential With enough excitatory input, a cell produces an action potential that sends a signal down its axon to other cells
Introduction to Physiological Psychology
 Introduction to Physiological Psychology Vision ksweeney@cogsci.ucsd.edu cogsci.ucsd.edu/~ksweeney/psy260.html This class n Sensation vs. Perception n How light is translated into what we see n Structure
A Neurally-Inspired Model for Detecting and Localizing Simple Motion Patterns in Image Sequences
 A Neurally-Inspired Model for Detecting and Localizing Simple Motion Patterns in Image Sequences Marc Pomplun 1, Yueju Liu 2, Julio Martinez-Trujillo 2, Evgueni Simine 2, and John K. Tsotsos 2 1 Department
SUPPLEMENTARY MATERIAL. Comparisons between V4 and previous schemes that do not involve conceptual
 SUPPLEMENTARY MATERIAL Comparisons between V4 and previous schemes that do not involve conceptual conflict V4v (field-sign-defined): In 1995, a region called V4v (Figure 11) was defined by its non-mirror-reversed
Senses are transducers. Change one form of energy into another Light, sound, pressure, etc. into What?
 1 Vision 2 TRANSDUCTION Senses are transducers Change one form of energy into another Light, sound, pressure, etc. into What? Action potentials! Sensory codes Frequency code encodes information about intensity
25/09/2012. Capgras Syndrome. Chapter 2. Capgras Syndrome - 2. The Neural Basis of Cognition
 Chapter 2 The Neural Basis of Cognition Capgras Syndrome Alzheimer s patients & others delusion that significant others are robots or impersonators - paranoia Two brain systems for facial recognition -
Disparity- and velocity- based signals for 3D motion perception in human MT+ Bas Rokers, Lawrence K. Cormack, and Alexander C. Huk
 Disparity- and velocity- based signals for 3D motion perception in human MT+ Bas Rokers, Lawrence K. Cormack, and Alexander C. Huk Supplementary Materials fmri response (!% BOLD) ).5 CD versus STS 1 wedge
Fundamentals of Cognitive Psychology, 3e by Ronald T. Kellogg Chapter 2. Multiple Choice
 Multiple Choice 1. Which structure is not part of the visual pathway in the brain? a. occipital lobe b. optic chiasm c. lateral geniculate nucleus *d. frontal lobe Answer location: Visual Pathways 2. Which
The Visual System. Cortical Architecture Casagrande February 23, 2004
 The Visual System Cortical Architecture Casagrande February 23, 2004 Phone: 343-4538 Email: vivien.casagrande@mcmail.vanderbilt.edu Office: T2302 MCN Required Reading Adler s Physiology of the Eye Chapters
Supplemental Information
 Current Biology, Volume 22 Supplemental Information The Neural Correlates of Crowding-Induced Changes in Appearance Elaine J. Anderson, Steven C. Dakin, D. Samuel Schwarzkopf, Geraint Rees, and John Greenwood
Morton-Style Factorial Coding of Color in Primary Visual Cortex
 Morton-Style Factorial Coding of Color in Primary Visual Cortex Javier R. Movellan Institute for Neural Computation University of California San Diego La Jolla, CA 92093-0515 movellan@inc.ucsd.edu Thomas
The Integration of Features in Visual Awareness : The Binding Problem. By Andrew Laguna, S.J.
 The Integration of Features in Visual Awareness : The Binding Problem By Andrew Laguna, S.J. Outline I. Introduction II. The Visual System III. What is the Binding Problem? IV. Possible Theoretical Solutions
V1 (Chap 3, part II) Lecture 8. Jonathan Pillow Sensation & Perception (PSY 345 / NEU 325) Princeton University, Fall 2017
 Lecture 8. Jonathan Pillow Sensation & Perception (PSY 345 / NEU 325) Princeton University, Fall 2017") V1 (Chap 3, part II) Lecture 8 Jonathan Pillow Sensation & Perception (PSY 345 / NEU 325) Princeton University, Fall 2017 Topography: mapping of objects in space onto the visual cortex contralateral representation
V1 (Chap 3, part II) Lecture 8 Jonathan Pillow Sensation & Perception (PSY 345 / NEU 325) Princeton University, Fall 2017 Topography: mapping of objects in space onto the visual cortex contralateral representation
Pathway from the eye to the cortex
 Vision: CNS 2017 Pathway from the eye to the cortex Themes of this lecture Visual information is analyzed in more complicated ways than in the retina. One major pathway from the eye leads to the striate
Cortical Representation of Space Around the Blind Spot
 J Neurophysiol 94: 3314 3324, 2005. First published July 20, 2005; doi:10.1152/jn.01330.2004. Cortical Representation of Space Around the Blind Spot Holger Awater, 1,2 Jess R. Kerlin, 1,2 Karla K. Evans,
The Central Nervous System
 The Central Nervous System Cellular Basis. Neural Communication. Major Structures. Principles & Methods. Principles of Neural Organization Big Question #1: Representation. How is the external world coded
Neural circuits PSY 310 Greg Francis. Lecture 05. Rods and cones
 Neural circuits PSY 310 Greg Francis Lecture 05 Why do you need bright light to read? Rods and cones Photoreceptors are not evenly distributed across the retina 1 Rods and cones Cones are most dense in
EDGE DETECTION. Edge Detectors. ICS 280: Visual Perception
 EDGE DETECTION Edge Detectors Slide 2 Convolution & Feature Detection Slide 3 Finds the slope First derivative Direction dependent Need many edge detectors for all orientation Second order derivatives
Event-Related fmri and the Hemodynamic Response
 Human Brain Mapping 6:373 377(1998) Event-Related fmri and the Hemodynamic Response Randy L. Buckner 1,2,3 * 1 Departments of Psychology, Anatomy and Neurobiology, and Radiology, Washington University,
Natural Scene Statistics and Perception. W.S. Geisler
 Natural Scene Statistics and Perception W.S. Geisler Some Important Visual Tasks Identification of objects and materials Navigation through the environment Estimation of motion trajectories and speeds
Computational Cognitive Neuroscience of the Visual System Stephen A. Engel
 CURRENT DIRECTIONS IN PSYCHOLOGICAL SCIENCE Computational Cognitive Neuroscience of the Visual System Stephen A. Engel University of Minnesota ABSTRACT Should psychologists care about functional magnetic
Attention Response Functions: Characterizing Brain Areas Using fmri Activation during Parametric Variations of Attentional Load
 Attention Response Functions: Characterizing Brain Areas Using fmri Activation during Parametric Variations of Attentional Load Intro Examine attention response functions Compare an attention-demanding
CSE511 Brain & Memory Modeling. Lect21-22: Vision Central Pathways
 CSE511 Brain & Memory Modeling CSE511 Brain & Memory Modeling Lect02: BOSS Discrete Event Simulator Lect21-22: Vision Central Pathways Chapter 12 of Purves et al., 4e Larry Wittie Computer Science, StonyBrook
Neuronal responses to plaids
 Vision Research 39 (1999) 2151 2156 Neuronal responses to plaids Bernt Christian Skottun * Skottun Research, 273 Mather Street, Piedmont, CA 94611-5154, USA Received 30 June 1998; received in revised form
Neural Population Tuning Links Visual Cortical Anatomy to Human Visual Perception
 Article Neural Population Tuning Links Visual Cortical Anatomy to Human Visual Perception Highlights d Variability in cortical thickness and surface area has opposite functional impacts Authors Chen Song,
Spatial Distribution of Contextual Interactions in Primary Visual Cortex and in Visual Perception
 Spatial Distribution of Contextual Interactions in Primary Visual Cortex and in Visual Perception MITESH K. KAPADIA, 1,2 GERALD WESTHEIMER, 1 AND CHARLES D. GILBERT 1 1 The Rockefeller University, New
fmri: What Does It Measure?
 fmri: What Does It Measure? Psychology 355: Cognitive Psychology Instructor: John Miyamoto 04/02/2018: Lecture 02-1 Note: This Powerpoint presentation may contain macros that I wrote to help me create
The Perceptual Experience
 Dikran J. Martin Introduction to Psychology Name: Date: Lecture Series: Chapter 5 Sensation and Perception Pages: 35 TEXT: Lefton, Lester A. and Brannon, Linda (2003). PSYCHOLOGY. (Eighth Edition.) Needham
Functional Imaging of the Human Lateral Geniculate Nucleus and Pulvinar
 J Neurophysiol 91: 438 448, 2004. First published September 17, 2003; 10.1152/jn.00553.2003. Functional Imaging of the Human Lateral Geniculate Nucleus and Pulvinar Sabine Kastner, Daniel H. O Connor,
Vision and Action. 10/3/12 Percep,on Ac,on 1
 Vision and Action Our ability to move thru our environment is closely tied to visual perception. Simple examples include standing one one foot. It is easier to maintain balance with the eyes open than
Retinotopy and Functional Subdivision of Human Areas MT and MST
 The Journal of Neuroscience, August 15, 2002, 22(16):7195 7205 Retinotopy and Functional Subdivision of Human Areas MT and MST Alexander C. Huk, Robert F. Dougherty, and David J. Heeger Department of Psychology,
PHY3111 Mid-Semester Test Study. Lecture 2: The hierarchical organisation of vision
 PHY3111 Mid-Semester Test Study Lecture 2: The hierarchical organisation of vision 1. Explain what a hierarchically organised neural system is, in terms of physiological response properties of its neurones.
A contrast paradox in stereopsis, motion detection and vernier acuity
 A contrast paradox in stereopsis, motion detection and vernier acuity S. B. Stevenson *, L. K. Cormack Vision Research 40, 2881-2884. (2000) * University of Houston College of Optometry, Houston TX 77204
Orientation Selectivity of Motion-Boundary Responses in Human Visual Cortex
 J Neurophysiol 104: 2940 2950, 2010. First published September 22, 2010; doi:10.1152/jn.00400.2010. Orientation Selectivity of Motion-Boundary Responses in Human Visual Cortex Jonas Larsson, 1 David J.
Organization of the Visual Cortex in Human Albinism
 The Journal of Neuroscience, October 1, 2003 23(26):8921 8930 8921 Behavioral/Systems/Cognitive Organization of the Visual Cortex in Human Albinism Michael B. Hoffmann, 1 David J. Tolhurst, 2 Anthony T.
Neural Correlates of Human Cognitive Function:
 Neural Correlates of Human Cognitive Function: A Comparison of Electrophysiological and Other Neuroimaging Approaches Leun J. Otten Institute of Cognitive Neuroscience & Department of Psychology University
Visual Areas in Macaque Cortex Measured Using Functional Magnetic Resonance Imaging
 The Journal of Neuroscience, December 1, 2002, 22(23): Visual Areas in Macaque Cortex Measured Using Functional Magnetic Resonance Imaging AQ: A Alyssa A. Brewer, 1 William A. Press, 2 Nikos K. Logothetis,
Functional Analysis of V3A and Related Areas in Human Visual Cortex
 The Journal of Neuroscience, September 15, 1997, 17(18):7060 7078 Functional Analysis of V3A and Related Areas in Human Visual Cortex Roger B. H. Tootell, 1 Janine D. Mendola, 1 Nouchine K. Hadjikhani,
We are IntechOpen, the world s leading publisher of Open Access books Built by scientists, for scientists. International authors and editors
 We are IntechOpen, the world s leading publisher of Open Access books Built by scientists, for scientists 4,000 116,000 120M Open access books available International authors and editors Downloads Our
Effects of Light Stimulus Frequency on Phase Characteristics of Brain Waves
 SICE Annual Conference 27 Sept. 17-2, 27, Kagawa University, Japan Effects of Light Stimulus Frequency on Phase Characteristics of Brain Waves Seiji Nishifuji 1, Kentaro Fujisaki 1 and Shogo Tanaka 1 1
COGS 101A: Sensation and Perception
 COGS 101A: Sensation and Perception 1 Virginia R. de Sa Department of Cognitive Science UCSD Lecture 5: LGN and V1: Magno and Parvo streams Chapter 3 Course Information 2 Class web page: http://cogsci.ucsd.edu/
LISC-322 Neuroscience. Visual Field Representation. Visual Field Representation. Visual Field Representation. Visual Field Representation
 LISC-3 Neuroscience THE VISUAL SYSTEM Central Visual Pathways Each eye sees a part of the visual space that defines its visual field. The s of both eyes overlap extensively to create a binocular. eye both
Encoding model of temporal processing in human visual cortex
 Encoding model of temporal processing in human visual cortex Anthony Stigliani a, Brianna Jeska a, and Kalanit Grill-Spector a,b, PNAS PLUS a Department of Psychology, Stanford University, Stanford, CA
CISC 3250 Systems Neuroscience
 CISC 3250 Systems Neuroscience Levels of organization Central Nervous System 1m 10 11 neurons Neural systems and neuroanatomy Systems 10cm Networks 1mm Neurons 100μm 10 8 neurons Professor Daniel Leeds
THE VISUAL WORLD! Visual (Electromagnetic) Stimulus
 Stimulus") THE VISUAL WORLD! Visual (Electromagnetic) Stimulus Perceived color of light is determined by 3 characteristics (properties of electromagnetic energy): 1. Hue: the spectrum (wavelength) of light (color)
THE VISUAL WORLD! Visual (Electromagnetic) Stimulus Perceived color of light is determined by 3 characteristics (properties of electromagnetic energy): 1. Hue: the spectrum (wavelength) of light (color)
Visually Driven Activation in Macaque Areas V2 and V3 without Input from the Primary Visual Cortex
 Visually Driven Activation in Macaque Areas V2 and V3 without Input from the Primary Visual Cortex Michael C. Schmid 1 *, Theofanis Panagiotaropoulos 1, Mark A. Augath 1, Nikos K. Logothetis 1,2, Stelios
Theta sequences are essential for internally generated hippocampal firing fields.
 Theta sequences are essential for internally generated hippocampal firing fields. Yingxue Wang, Sandro Romani, Brian Lustig, Anthony Leonardo, Eva Pastalkova Supplementary Materials Supplementary Modeling
NeuroImage. Relationship between BOLD amplitude and pattern classification of orientation-selective activity in the human visual cortex
 NeuroImage 63 (2012) 1212 1222 Contents lists available at SciVerse ScienceDirect NeuroImage journal homepage: www.elsevier.com/locate/ynimg Relationship between BOLD amplitude and pattern classification
ID# Exam 1 PS 325, Fall 2003
 ID# Exam 1 PS 325, Fall 2003 Read each question carefully and answer it completely. Pay careful attention to the point value of questions so that you allocate your time appropriately (1 point = 1 minute).
What do we perceive?
 THE VISUAL SYSTEM Aditi Majumder What do we perceive? Example: Switch off the light in room What we perceive Not only the property of the scene But also that of the visual system Our perception is filtered
ID# Exam 1 PS 325, Fall 2004
 ID# Exam 1 PS 325, Fall 2004 As always, the Skidmore Honor Code is in effect. Read each question carefully and answer it completely. Multiple-choice questions are worth one point each, other questions
Motion Opponency in Visual Cortex
 The Journal of Neuroscience, August 15, 1999, 19(16):7162 7174 Motion Opponency in Visual Cortex David J. Heeger, 1 Geoffrey M. Boynton, 1 Jonathan B. Demb, 1 Eyal Seidemann, 2 and William T. Newsome 2
Magnetic Resonance Angiography
 Magnetic Resonance Angiography 1 Magnetic Resonance Angiography exploits flow enhancement of GR sequences saturation of venous flow allows arterial visualization saturation of arterial flow allows venous
Principals of Object Perception
 Principals of Object Perception Elizabeth S. Spelke COGNITIVE SCIENCE 14, 29-56 (1990) Cornell University Summary Infants perceive object by analyzing tree-dimensional surface arrangements and motions.
Visual Mental Imagery Induces Retinotopically Organized Activation of Early Visual Areas
 Cerebral Cortex October 2005;15:1570--1583 doi:10.1093/cercor/bhi035 Advance Access publication February 2, 2005 Visual Mental Imagery Induces Retinotopically Organized Activation of Early Visual Areas
Selectivity of human retinotopic visual cortex to S-cone-opponent, L M-cone-opponent and achromatic stimulation
 European Journal of Neuroscience, Vol. 5, pp. 491 5, 7 doi:1.1111/j.146-9568.7.53.x Selectivity of human retinotopic visual cortex to S-cone-opponent, L M-cone-opponent and achromatic stimulation Kathy
Consciousness The final frontier!
 Consciousness The final frontier! How to Define it??? awareness perception - automatic and controlled memory - implicit and explicit ability to tell us about experiencing it attention. And the bottleneck
Models of Attention. Models of Attention
 Models of Models of predictive: can we predict eye movements (bottom up attention)? [L. Itti and coll] pop out and saliency? [Z. Li] Readings: Maunsell & Cook, the role of attention in visual processing,
Linear Systems Analysis of Functional Magnetic Resonance Imaging in Human V1
 The Journal of Neuroscience, July 1, 1996, 16(13):4207 4221 Linear Systems Analysis of Functional Magnetic Resonance Imaging in Human V1 Geoffrey M. Boynton, 1 Stephen A. Engel, 1 Gary H. Glover, 2 and
Adventures into terra incognita
 BEWARE: These are preliminary notes. In the future, they will become part of a textbook on Visual Object Recognition. Chapter VI. Adventures into terra incognita In primary visual cortex there are neurons
Cerebral Cortex 1. Sarah Heilbronner
 Cerebral Cortex 1 Sarah Heilbronner heilb028@umn.edu Want to meet? Coffee hour 10-11am Tuesday 11/27 Surdyk s Overview and organization of the cerebral cortex What is the cerebral cortex? Where is each
THE VISUAL WORLD! Visual (Electromagnetic) Stimulus
 Stimulus") THE VISUAL WORLD! Visual (Electromagnetic) Stimulus Perceived color of light is determined by 3 characteristics (properties of electromagnetic energy): 1. : the spectrum (wavelength) of light (color) 2.
THE VISUAL WORLD! Visual (Electromagnetic) Stimulus Perceived color of light is determined by 3 characteristics (properties of electromagnetic energy): 1. : the spectrum (wavelength) of light (color) 2.