MANUSCRIPT FACTORS INFLUENCING THE VISUAL ACUITY OF NIGHT SHIFT WORKERS (A STUDY ON GORONTALO POST JOURNALISTS) Reni Hiola
|
|
|
- Randolf York
- 5 years ago
- Views:
Transcription
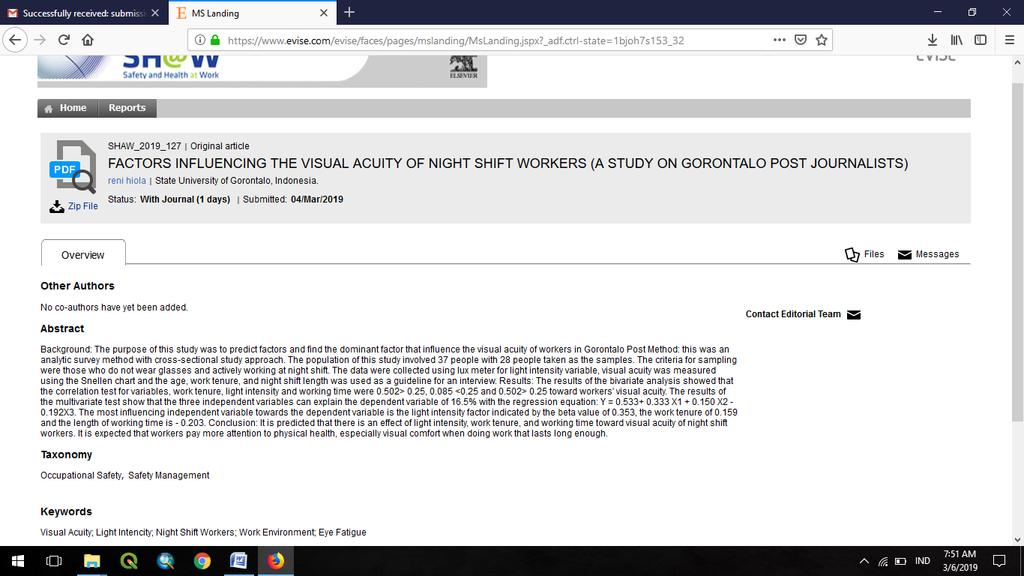
1 MANUSCRIPT FACTORS INFLUENCING THE VISUAL ACUITY OF NIGHT SHIFT WORKERS (A STUDY ON GORONTALO POST JOURNALISTS) Reni Hiola Faculty of Sports and Health, Universitas Negeri Gorontalo Jalan. Jend. Sudirman No.6 Gorontalo, Indonesia. tel: ; fax:(0435) Background: The purpose of this study was to predict factors and find the dominant factor that influence the visual acuity of workers in Gorontalo Post Method: this was an analytic survey method with cross-sectional study approach. The population of this study involved 37 people with 28 people taken as the samples.the criteria for sampling were those who do not wear glasses and actively working at night shift. The data were collected using lux meter for light intensity variable, visual acuity was measured using the Snellenchart and the age, work tenure, and night shift length was used as a guideline for an interview. Results: The results of the bivariate analysis showed that the correlation test for variables, work tenure, light intensity and working time were 0.502> 0.25, <0.25 and 0.502> 0.25 toward workers' visual acuity. The results of the multivariate test show that the three independent variables can explain the dependent variable of 16.5% with the regression equation: Y = X X X3. The most influencing independent variable towards the dependent variable is the light intensity factor indicated by the beta value of 0.353, the work tenure of and the length of working time is Conclusion: It is predicted that there is an effect of light intensity, work tenure, and working time toward visual acuity of night shift workers. It is expected that workers pay more attention to physical health, especially visual comfort when doing work that lasts long enough. Keywords : Visual Acuity, Light Intencity, Night Shift Workers, Work Environment, Eye Fatigue
2 1. Introduction Human needs lighting to visually recognize objects in which the organs that influence vision are eyes and central vision nerves. Light intensity, either high or low intensity, influences the eyestrain and eye nerve strain. For workers, the working environment influencesproduct quality. Lighting is one of the physical factors in the workplace. Bad lighting can cause eyestrain and in turn, lack of work efficiency, mental tiredness, pain complaints and even work-related accidents(1).bad lighting intensity is one of the physical factors in the work environment that can reduce visual acuity. Visual acuity is influenced by several factors such as 1) size of the object; 2) brightness or level of light in the field which depends on the lighting and the optical reflection or surface; 3) length of observation time; 4) level of contrast that is the degree of brightness differences between the object and its surrounding (2). The healthiness of the eyes is an important requirement to increase the quality of human resources in order to increase the quality of life of the society, which in turn, to achieve smart, productive, independent, and prosperous Indonesian human resources. Lack of light intensity has made the iris muscle force the pupil to see objects and when this is done continuously for a long time will cause the reduction of visual acuity(3).visual acuity is defined as an eye ability to see an object clearly and is highly dependent on the eye accommodating ability. Visual acuityis influenced by changes of target angle speed, vibration, luminance, contrast, tracking of the head and eyes movement, reaction time, learning factor, and fatigue(4). Reduction of visual acuitycan also occur due to aging. Initial study in the Redaction Unit at Gorontalo Post Newspaper agency reveals that workers in average journalists/workers work at night time, as in day time they hunt the news to be published daily in this newspaper, and their nighttime work shift starts from pm to am, hence, they work under artificial lighting which yet complies with the standard regulates by Kepmenkes No of 2002, where it stipulates that lighting for routine workers at night time shift should be 300 Lux. Observation using Lux Meter, reveals that the light intensity in the redaction room of Gorontalo Post was only 133 Lux.Therefore, the lighting does need attention as it influences the eye fatigue and causes eyes nerve strain, thus, accelerate the reduction of visual acuity. The absolute sleep time of shift workers, including night workers, is longer than that of non-shift workers; however, it is associated with health problems such as drowsiness and persistent fatigue during work(5). Night
3 workers are awake for about 20 h, and weekly workers are awake for 15 h (6). This is becausenighttime sleepers are less likely to sleep in the daytime, and theeffects of the bio-cycle reduce the time spent sleeping(7). 2. Material and Methods 2.1 Participants and Study Sample The population in this study is 37 people who work in the redaction room (newsroom) in Gorontalo Post agency. Sampling technique is purposive sampling with the criteria ofworkers who do not wear glasses, discipline, and active in their jobs each working hour in their night shift, thus, 28 samples are obtained(8). 2.2 Measures The independent variables in this study were age, light intensity (X1), work tenure (X2), length of working time (X3) and, while the dependent variable is the visual acuity of workers.as lighting system used in the workroom is general lighting, which lights are attached in the attic of the workroom, thus light is equally spread, then, the light intensity is measured using three spots of measurement. Measurement spot is determined based on the horizontal crosscutting spot of the length and width of the room each 5-meter distance and 1 meter above the floor. A lux meter Kris Bow type KW06-sne291 is used to measure the intensity of light in the workroom. The light received by the photocell will produce a current that can move the pointer at the meter level; this number indicates the intensity of illumination. The stronger the illumination intensity, the greater the number indicated by the pointer level meter.work tenure is defined as <5 years and 5 years. The length of working time is defined as <6 hours and 6 years. To measure the visual acuity of the respondents, Snellen chart tests were used which are commonly used in Indonesia. Respondents were asked to stand at a distance of 6 meters from the Snellen chart, close one eye using their hands, then start reading from the top row to the bottom, until they are no longer able to read the letters on the line. If the respondent could read the letters of the 8th line, the sight is optimal (visual acuity 20/20). The visual acuity is measured
4 based on a percentage with the following criteria: normal visual acuity if the percentage is 95%-75%, a low vision if 60% - 10% (9). 2.3 Statistical Analysis A multiple regression analysis based on a linear model is used to investigate which variable is more dominant to influence visual acuity. Statistical analysis in this study is used to test a multiplelinear regression model by considering that the data from the dependent variable are numeric data. Following the fulfillment of assumption used in multiple linear regression, thus, univariate, bivariate, and multivariate analysis is used to describe the characteristic of respondents based on age, work tenure, light intensity, length of the work shift, and visual acuity. Bivariate analysis is to select correlation between the dependent variable (visual acuity) and independent variables (work tenure, light intensity, and length of work shift in the workroom), while multivariate analysis is used to obtain the regression model to determine factors that significantly influence the complaint on visual acuity. The descriptionof the characteristics of the respondents uses univariate analysis test. In order to test the correlation, bivariate and multivariate tests between variables are administered. The statistical package used by researchers for the analysis is IBM s SPSS version Results Univariate analysis result toward 28-night shift workers shows that there are ninerespondents (29.0%) whose visual acuity isnormal and 19 respondents (61.3%) whose visual acuity isa low vision. Thisis influenced by the insufficient light intensity in the workroom, where the light intensity is less than 300 lux (low lighting). In addition, there are also workers who have been working for more than six years,and in addition to the aging factor, these people also have more than one extra hour from the scheduled work shift. This study shows that age factor does not significantly influence the complaint on visual acuity as respondents average age is 25 years old or still in their productive age. Workers who have been working for less than five years are 16 respondents while 12 respondents who have been working for five years or more. This difference in work tenure is due to the Gorontalo Post Newspaper agency has been developing. Hence, they become selective in recruiting workers. Thus, the number of workers is limited. Level of light intensity in the redaction room of Gorontalo Post, the
5 highest is 320 lux,and the lowest is only 133 lux. There are 19 workers who work under insufficient light intensity as their desks are located in non-strategic location (spot 2 and 3) whose light intensity is 170 and 130 lux. Meanwhile, there are only nine workers who work under appropriate light intensity as their desks are positioned within a strategic location, spot 1, where the light intensity is 320 lux. The result of bivariate analysis for correlation of work tenure has the correlation value of > 0.25, light intensity < 0.25 and length of work shift has the correlation value of > Therefore, it is evident that work tenure and length of work shift variables can be ignored from multivariate modeling. Nevertheless, as substantially the work tenure variable and the length of work shift are important factors to influence visual acuity, those variables are still included in the multivariate analysis(10). Further, to create a multivariate model, a multivariate analysis is simultaneously carried out. From the data, it is obtained that the value of R square is 0.165, which means that all three independent variables are able to describe the visual acuity variable by 16.5%, whereas the rest can be described by other variables. The analysis of the output shows a residual value with the mean of and deviation standard of , as seen in Table 1 below. Table 1 Simultaneous multivariate analysis Entered Variables R R Square Work tenure, lighting intensity, length of work shift Adjusted R Square Std. The error of the Estimate Durbin- Watson In table 1, the obtained Durbin Watson coefficient is and categorized in interval value between - 2 and +2. This means that the independence assumption is fulfilled. In the Figure 1, the distribution area is equally distributed around the zero dots, it can be said that the variance is homogenous in each X value. The data which are distributed around the diagonal line and follow the direction of the diagonal line, and the formed diagram is like that of a bell, then the regression model met the normality assumption as presented in Figure 1 below.


6 Figure 1 Histogram Graphic of Normality Assumption Figure 2 Normal P Plot Graphic for Normality Assumption The analysis results show a residual number with a mean of with a standard deviation of , as presented in Table 2 below. Thus the existence assumption is fulfilled. Table 2 Regression Coefficient of Each Variable Minimum Maximum Mean Std. Deviation N Predicted Value Residual Std. Predicted Value Std. Residual
7 By considering a regression model were able to explain 16.5% variation of the dependent variable and fulfillment of assumptions, the regression line equation is obtained as follows: Visual acuity = light intensity work tenure length of working time. This means that the constant of states that if there is no increase in the value of the variable light intensity, work tenure and working time, the value of visual acuity is Each addition of 1 score of work tenure value and lighting intensity in the workspace, it will give a score of and on visual acuity after the work tenure and working time are controlled. For workers who carry out tasks during working hours, the vision level will decrease by 0.19% after the intensity variable and work tenure are controlled. To find out which variable has the most influence in determining the dependent variable can be seen from the large beta value for intensity 0.353, work tenure of 0.159, length of working time , it can be concluded that the variable light intensity has the greatest influence (dominant) on visual acuity. The coefficient of regression equation is shown in Table 3 below: Table 3. Coefficient of Regression Equation Unstandardized Coefficients Model B Std. Error 1 (Constant) lighting intensity work tenure working time Discussion Descriptive analysis result toward 28 respondents in redaction room shows that on average their age is 25 years old. The age range is years old and is a productive age range (11). There are 78.6 % of workers who work at nighttime and have work tenure of 5 years or more, and 21.4% ofworkers have been working for less than five years. The length of their work, which more than five years suggest that they have adapted toward their working condition. This is as suggested with the regression model, were each one score increase in work tenure will increase their visual acuity by in correlation with their working experience.
8 However, the aging factor also causes a reductionin visual acuity. Aging has caused eye lenses to gradually lose its elasticity and made it hard to see close distance objects. Aging has made the distance to the closer spot longer. Around the age of years old, there will be a significant change;the object will appear blurry,and fatigue will easily come when working on a closer object(12).lighting intensity in this study is a dominant factor that influences complaint on visual acuity. According to the measurement in each measurement spots, lighting intensity in two spots, spot number 2 and 3, do not meet the lighting standard. This is due to the type and quality of light that is unsuitable with the type of work being done in the room. Length of working time for the night shift workers is six hours from 6.00 pm to am. When the news is plenty to be printed, then the workers should work extra hours. This condition has caused their visual acuity to decline. Based on the data analysis, visual acuity declines by 0.19% when workers work fully for 6 hours. This work is implemented so they can fulfill their daily needs. Visual acuity is the ability of the visual system to differentiate various objects (13). Optimal visual can be achieved when there are a complete visual nerve, healthy eyes structure and appropriate ability of the eyes to focus (14). 5. Conclusion The objective of this study is to predict factors that influence visual acuity complaint of the workers of Gorontalo Post newspaper redaction and to determine dominant factors that influence visual acuity complaint. To find out those factors, the analysis is carried out by involving independent variables such as age, lighting intensity, work tenure, and length of the work shift. Through univariate, bivariate, and multivariate tests toward independent and dependent variables, it is obtained that there are three variables that can describe the visual acuity complaint of the respondents by 16.5% whereas the rest can be described by other variables outside the study. Lighting intensity that is suitable for this type of journalism work is 300 lux, whereas the findings show that lighting intensity in the workroom is yet to meet this standard. Hence, it made eyestrain and causes the decline of visual acuity of the workers. In certain conditions, workers work for more than 6 hours under this lighting which caused fatigue,especially in the eye. All workers age is under 40 years old. Thus, the age factor does not influence the visual acuity complaint. This was due to their age is
9 categorized as a productive age,and they are able to work maximally. Out of 28 workers, there are 22 workers who havea workingtenure of 5 years; hence, their eyes have adjusted to this nighttime working condition. Limitation in this study is that there are variables, which predicted to influence the eyestrain considering the significance value of the studied variables is low. Conflict of Interest The author has no conflict of interest with regard to the material presented in this paper. References 1. Suma mur. Higiene Perusahaan dan Kesehatan Kerja (Hiperkes). Jakarta: Sagung Seto; Budiyono H. Bahan Kuliah Instrumentasi. Program Pascasarjana Ilmu Kesehatan Kerja. Yogyakarta: Universitas Gadjah Mada; Haeny N. Analisis Faktor Resiko Keluhan Subjektif Kelelahan Mata Pada Radar Controller Di PT Angkasa Pura II (Persero) Cabang Utama Bandara Soekarno-Hatta. Universitas Indonesia; Wijaya AR, Sukandari N. Efek Vibrasi Terhadap Ketajaman Visual Manusia dalam Human Display Interface. In: Proceeding Seminar Nasional Ergonomi. Surabaya: Guna Widya; Fallis W, Diana E, Marie P. Napping During Night Shift: Practices, Preferences, and Perceptions of Critical Care and Emergency Department Nurses. Crit Care Nurse. 2011;31(2): Kim J. The Relationship Between Frequency of Injuries and Workplace Environment in Korea: Focus on Shift Work and Workplace Environmental Factors. Saf Health Work. 2018;9: Åkerstedt T. Shift Work and Disturbed Sleep/Wakefulness. Occup Med. 2003;53(2): Sugiyono. Statistika Untuk Penelitian. Bandung: Alfabeta; Ilyas S. Ilmu Perawatan Mata. Jakarta: Sagung Seto; Riyanto A. Penerapan Analisis Multivariat dalam Penelitian Kesehatan. Yogyakarta: Nuha Medika; Indonesian Law on Employment/UU No. 13. Indonesia; Natalegawa A. Geriatrik Oftalmologi dalam Bunga Rampai Ilmu Kedokteran. Bandung; 1982.
10 13. Anderson DM. Dorland s Illustrated Medical Dictionary. 31st ed. Saunders/Elsevier. Philadephia, PA; Riordan-Eva P, Witcher J. Vaughan & Asbury s General Ophtalmology. 17th ed. New York: McGraw-Hill Companies; 2008.
11 SUBMISSION
12
Effect of work stress on auditor performance in the financial audit board of the republic of Indonesia representative of North Sulawesi province
 Scientific Research Journal (SCIRJ), Volume V, Issue XII, December 2017 7 Effect of work stress on auditor performance in the financial audit board of the republic of Indonesia representative of North
Analysis of Factors Related to the Fatigue of Work on the Part of Production Workers at Pt. X Wonogiri
 Analysis of Factors Related to the Fatigue of Work on the Part of Production Workers at Pt. X Wonogiri Tyas Lilia Wardani 1, Tri Martiana 1, Abdul Rohim Tualeka 1 1 Faculty of Public Health Master's Degree
The Influence of Caloric Intake to Work Fatigue of Nurses in Inpatient Care Unit RSU Haji Surabaya, 2015
 International Conference of Occupational Health and Safety (ICOHS-2017) Volume 2018 Conference Paper The Influence of Caloric Intake to Work Fatigue of Nurses in Inpatient Care Unit RSU Haji Surabaya,
Pitfalls in Linear Regression Analysis
 Pitfalls in Linear Regression Analysis Due to the widespread availability of spreadsheet and statistical software for disposal, many of us do not really have a good understanding of how to use regression
CRITERIA FOR USE. A GRAPHICAL EXPLANATION OF BI-VARIATE (2 VARIABLE) REGRESSION ANALYSISSys
 REGRESSION ANALYSISSys") Multiple Regression Analysis 1 CRITERIA FOR USE Multiple regression analysis is used to test the effects of n independent (predictor) variables on a single dependent (criterion) variable. Regression tests
Multiple Regression Analysis 1 CRITERIA FOR USE Multiple regression analysis is used to test the effects of n independent (predictor) variables on a single dependent (criterion) variable. Regression tests
The Correlation between Sex, Age, Educational Background, and Hours of Service on Vigilance Level of ATC Officers in Air Nav Surabaya, Indonesia
 International Journal of Evaluation and Research in Education (IJERE) Vol.5, No.1, March2016, pp. 9 ~ 13 ISSN: 2252-8822 9 The Correlation between Sex, Age, Educational Background, and Hours of Service
Classification Accuracy and Factors Affecting Diphtheria Incident Using Multivariate Adaptive Regression Spline (Mars)
") J. Appl. Environ. Biol. Sci., 6(7)80-84, 016 016, TextRoad Publication ISSN: 090-474 Journal of Applied Environmental and Biological Sciences www.textroad.com Classification Accuracy and Factors Affecting
J. Appl. Environ. Biol. Sci., 6(7)80-84, 016 016, TextRoad Publication ISSN: 090-474 Journal of Applied Environmental and Biological Sciences www.textroad.com Classification Accuracy and Factors Affecting
Human Capabilities & Work Physiology II
 Human Capabilities & Work Physiology II Vision Circadian rhythms Musculoskeletal system 19.525 Recognition of Work Environment Hazards: Introduction to Industrial Hygiene and Ergonomics Visual Capabilities
Section 6: Analysing Relationships Between Variables
 6. 1 Analysing Relationships Between Variables Section 6: Analysing Relationships Between Variables Choosing a Technique The Crosstabs Procedure The Chi Square Test The Means Procedure The Correlations
bivariate analysis: The statistical analysis of the relationship between two variables.
 bivariate analysis: The statistical analysis of the relationship between two variables. cell frequency: The number of cases in a cell of a cross-tabulation (contingency table). chi-square (χ 2 ) test for
The Effect Of Video Compact Disc (VCD) Media On Results Far Away To The Seventh Grade Students Of State Junior High School 3 Of Palembang
 Media On Results Far Away To The Seventh Grade Students Of State Junior High School 3 Of Palembang") The Effect Of Video Compact Disc (VCD) Media On Results Far Away To The Seventh Grade Students Of State Junior High School 3 Of Palembang Farizal Imansyah Abstract: The problem in this study is whether
The Effect Of Video Compact Disc (VCD) Media On Results Far Away To The Seventh Grade Students Of State Junior High School 3 Of Palembang Farizal Imansyah Abstract: The problem in this study is whether
Prepared by: Assoc. Prof. Dr Bahaman Abu Samah Department of Professional Development and Continuing Education Faculty of Educational Studies
 Prepared by: Assoc. Prof. Dr Bahaman Abu Samah Department of Professional Development and Continuing Education Faculty of Educational Studies Universiti Putra Malaysia Serdang At the end of this session,
Bootstrapping Residuals to Estimate the Standard Error of Simple Linear Regression Coefficients
 Bootstrapping Residuals to Estimate the Standard Error of Simple Linear Regression Coefficients Muhammad Hasan Sidiq Kurniawan 1) 1)* Department of Statistics, Universitas Islam Indonesia hasansidiq@uiiacid
Lecturer Performance Factors in Private Universities in Bandung City
 Lecturer Performance Factors in Private Universities in Bandung City Ratih Hadiantini (Corresponding author) Faculty of Economic and Business, Universitas Informatika dan Bisnis Indonesia Soekarno Hatta
Daniel Boduszek University of Huddersfield
 Daniel Boduszek University of Huddersfield d.boduszek@hud.ac.uk Introduction to Multiple Regression (MR) Types of MR Assumptions of MR SPSS procedure of MR Example based on prison data Interpretation of
Chapter 14: More Powerful Statistical Methods
 Chapter 14: More Powerful Statistical Methods Most questions will be on correlation and regression analysis, but I would like you to know just basically what cluster analysis, factor analysis, and conjoint
Multiple Linear Regression Analysis
 Revised July 2018 Multiple Linear Regression Analysis This set of notes shows how to use Stata in multiple regression analysis. It assumes that you have set Stata up on your computer (see the Getting Started
A COMPARISON BETWEEN MULTIVARIATE AND BIVARIATE ANALYSIS USED IN MARKETING RESEARCH
 Bulletin of the Transilvania University of Braşov Vol. 5 (54) No. 1-2012 Series V: Economic Sciences A COMPARISON BETWEEN MULTIVARIATE AND BIVARIATE ANALYSIS USED IN MARKETING RESEARCH Cristinel CONSTANTIN
UK National Aerospace NDT Board
 UK National Aerospace NDT Board c/o The British Institute of NDT Newton Building, St George s Avenue Northampton, NN2 6JB United Kingdom Tel: +44 (0)1604-893-811. Fax: +44 (0)1604-893-868. E-mail: Nicole.scutt@bindt.org
Business Statistics Probability
 Business Statistics The following was provided by Dr. Suzanne Delaney, and is a comprehensive review of Business Statistics. The workshop instructor will provide relevant examples during the Skills Assessment
ICASH-A031 FACTORS AFFECTING SLEEP DISORDERS OF PATIENTS IN THE INTENSIVE CARE UNIT (ICU) Hadi
 Hadi") ICASH-A031 FACTORS AFFECTING SLEEP DISORDERS OF PATIENTS IN THE INTENSIVE CARE UNIT (ICU) Hadi Postgraduate Applied Science Program in Nursing, Poltekkes Kemenkes Semarang, Semarang, Indonesia, *Corresponding
ICASH-A031 FACTORS AFFECTING SLEEP DISORDERS OF PATIENTS IN THE INTENSIVE CARE UNIT (ICU) Hadi Postgraduate Applied Science Program in Nursing, Poltekkes Kemenkes Semarang, Semarang, Indonesia, *Corresponding
Regulatory Requirements
 Safe Use of Display Screen Equipment The wide application of display screen equipment (DSE) to improve the quality of work and efficiency are commonly recognized in our daily life such as paper work, data
CHAPTER TWO REGRESSION
 CHAPTER TWO REGRESSION 2.0 Introduction The second chapter, Regression analysis is an extension of correlation. The aim of the discussion of exercises is to enhance students capability to assess the effect
Available online at ScienceDirect. The 4th International Conference on Electrical Engineering and Informatics (ICEEI 2013)
") Available online at www.sciencedirect.com ScienceDirect Procedia Technology 11 ( 2013 ) 1244 1251 The 4th International Conference on Electrical Engineering and Informatics (ICEEI 2013) Nutritional Needs
Available online at www.sciencedirect.com ScienceDirect Procedia Technology 11 ( 2013 ) 1244 1251 The 4th International Conference on Electrical Engineering and Informatics (ICEEI 2013) Nutritional Needs
EFFECT OF SERVICE QUALITY TOWARDS PATIENT SATISFACTION AT THE PUBLIC HEALTH CENTRE OF SITU GINTUNG SOUTH TANGERANG
 EFFECT OF SERVICE QUALITY TOWARDS PATIENT SATISFACTION AT THE PUBLIC HEALTH CENTRE OF SITU GINTUNG SOUTH TANGERANG by Drs. Sunanto, APT., MM sunantoapt@gmail.com Faculty Member of Pamulang University ABSTRAK
Research in Business and Social Science
 International Journal of Research in Business and Social Science 7(2), 2018: 22-29 Research in Business and Social Science IJRBS Vol 7 No 2, ISSN: 2147-4478 Contents available at www.ssbfnet.com/ojs https://doi.org/10.20525/ijrbs.v7i2.879
Comparison of coronary heart disease stratification using the Jakarta cardiovascular score between main office and site office workers
 Journal of Physics: Conference Series PAPER OPEN ACCESS Comparison of coronary heart disease stratification using the Jakarta cardiovascular score between main office and site office workers To cite this
CHAPTER VI RESEARCH METHODOLOGY
 CHAPTER VI RESEARCH METHODOLOGY 6.1 Research Design Research is an organized, systematic, data based, critical, objective, scientific inquiry or investigation into a specific problem, undertaken with the
Unit 1 Exploring and Understanding Data
 Unit 1 Exploring and Understanding Data Area Principle Bar Chart Boxplot Conditional Distribution Dotplot Empirical Rule Five Number Summary Frequency Distribution Frequency Polygon Histogram Interquartile
ID# Exam 1 PS 325, Fall 2001
 ID# Exam 1 PS 325, Fall 2001 As always, the Skidmore Honor Code is in effect, so keep your eyes foveated on your own exam. I tend to think of a point as a minute, so be sure to spend the appropriate amount
SPSS output for 420 midterm study
 Ψ Psy Midterm Part In lab (5 points total) Your professor decides that he wants to find out how much impact amount of study time has on the first midterm. He randomly assigns students to study for hours,
INFLUENCE OF LABELING HALAL AND PRODUCTS CONSUMPTION SAFETY LABELS TO BUYING DECISIONS OF THE MUSLIM COMMUNITY
 DOI : 10.18843/rwjasc/v8i4/11 DOI URL : http://dx.doi.org/10.18843/rwjasc/v8i4/11 INFLUENCE OF LABELING HALAL AND PRODUCTS CONSUMPTION SAFETY LABELS TO BUYING DECISIONS OF THE MUSLIM COMMUNITY Adi Santoso,
Society s Behavior of Personal Transportation Utilization in Makassar South Sulawesi Indonesia
 Management 2017, 7(3): 131-135 DOI: 10.5923/j.mm.20170703.05 Society s Behavior of Personal Transportation Utilization in Makassar South Sulawesi Indonesia Lambang Basri Said *, Maryam Hafram, Abdul Hafid
Statistics is the science of collecting, organizing, presenting, analyzing, and interpreting data to assist in making effective decisions
 Readings: OpenStax Textbook - Chapters 1 5 (online) Appendix D & E (online) Plous - Chapters 1, 5, 6, 13 (online) Introductory comments Describe how familiarity with statistical methods can - be associated
Modifiers and Retransmitters (Secondary Light Sources)
") Vision and Light Vision Generators Transmitters (Light Sources) Modifiers and Retransmitters (Secondary Light Sources) Receivers Decoder Encoders Interpreter (Eyes) (Brain) Sun, Discharge lamps, fluorescent
Vision and Light Vision Generators Transmitters (Light Sources) Modifiers and Retransmitters (Secondary Light Sources) Receivers Decoder Encoders Interpreter (Eyes) (Brain) Sun, Discharge lamps, fluorescent
Powered by TCPDF (
 Powered by TCPDF (www.tcpdf.org) The Analysis of Enterpreneurs Willingness to Start Small or Medium-sized Enterprises (SME) Hada Siti Maesyaroh 1 Waseso Segoro 2 Email: maesyarohhadasiti@ymail.com Email:
CHAPTER IV RESULT OF THE RESEARCH AND DISCUSSION
 CHAPTER IV RESULT OF THE RESEARCH AND DISCUSSION A. Orientation of Research Field Ushuluddin and Humaniora Faculty, previously Ushuluddin Faculty established in Tegal in September 1970 eventually moved
The Difference of Test Results Endurence Using Bleep Test and Balke Test on Football Players Maung Bandung Fc
 IOP Conference Series: Materials Science and Engineering PAPER OPEN ACCESS The Difference of Test Results Endurence Using Bleep Test and Balke Test on Football Players Maung Bandung Fc To cite this article:
Correlation and Regression
 Dublin Institute of Technology ARROW@DIT Books/Book Chapters School of Management 2012-10 Correlation and Regression Donal O'Brien Dublin Institute of Technology, donal.obrien@dit.ie Pamela Sharkey Scott
The influence of the antecedent variable on the teachers' performance through achievement motivation in senior high school
 OPEN ACCESS INTERNATIONAL JOURNAL OF ENVIRONMENTAL & SCIENCE EDUCATION 2016, VOL. 11, NO. 12, 5613-5618 The influence of the antecedent variable on the teachers' performance through achievement motivation
Understandable Statistics
 Understandable Statistics correlated to the Advanced Placement Program Course Description for Statistics Prepared for Alabama CC2 6/2003 2003 Understandable Statistics 2003 correlated to the Advanced Placement
Chapter 3 CORRELATION AND REGRESSION
 CORRELATION AND REGRESSION TOPIC SLIDE Linear Regression Defined 2 Regression Equation 3 The Slope or b 4 The Y-Intercept or a 5 What Value of the Y-Variable Should be Predicted When r = 0? 7 The Regression
MULTIPLE LINEAR REGRESSION 24.1 INTRODUCTION AND OBJECTIVES OBJECTIVES
 24 MULTIPLE LINEAR REGRESSION 24.1 INTRODUCTION AND OBJECTIVES In the previous chapter, simple linear regression was used when you have one independent variable and one dependent variable. This chapter
On the purpose of testing:
 Why Evaluation & Assessment is Important Feedback to students Feedback to teachers Information to parents Information for selection and certification Information for accountability Incentives to increase
Nearly one quarter of American workers
 Fatigue Nearly one quarter of American workers spend over 40 hours a week at work and almost 15 million work full time on evening, night, rotating, or other irregular shifts.* *OSHA 2 Irregular and extended
AP Statistics. Semester One Review Part 1 Chapters 1-5
 AP Statistics Semester One Review Part 1 Chapters 1-5 AP Statistics Topics Describing Data Producing Data Probability Statistical Inference Describing Data Ch 1: Describing Data: Graphically and Numerically
Dentist knowledge about dental health management for disabled child at primary health service in Bandung City
 Dentist knowledge about dental health management for disabled child at primary health service in Bandung City Elvanissa Ruslan*, Arlette Suzy Puspa Pertiwi*, Sri Susilawati** *Department of Pedodontic,
Statistics is the science of collecting, organizing, presenting, analyzing, and interpreting data to assist in making effective decisions
 Readings: OpenStax Textbook - Chapters 1 5 (online) Appendix D & E (online) Plous - Chapters 1, 5, 6, 13 (online) Introductory comments Describe how familiarity with statistical methods can - be associated
Correlation between Computer Workstation and Location of Musculoskeletal Disorders
 323 Correlation between Computer Workstation and Location of Musculoskeletal Disorders Hafiz Ambyo Bagaskoro, 1 Tertianto Prabowo, 2 Setiawan 3 1 Faculty of Medicine Universitas Padjadjaran, 2 Department
Table of Contents. Plots. Essential Statistics for Nursing Research 1/12/2017
 Essential Statistics for Nursing Research Kristen Carlin, MPH Seattle Nursing Research Workshop January 30, 2017 Table of Contents Plots Descriptive statistics Sample size/power Correlations Hypothesis
THE EFFECT OF GIVING DATE PALM EXTRACT TO AGAINTS CONSTIPATION THAT HAPPEN TO POSTPARTUM MOTHER. Ninik Azizah 1 dan Suyati 2
 THE EFFECT OF GIVING DATE PALM EXTRACT TO AGAINTS CONSTIPATION THAT HAPPEN TO POSTPARTUM MOTHER Ninik Azizah 1 dan Suyati 2 Diploma III Kebidanan Faculty of Health Science Universitas Pesantren Tinggi
Undertaking statistical analysis of
 Descriptive statistics: Simply telling a story Laura Delaney introduces the principles of descriptive statistical analysis and presents an overview of the various ways in which data can be presented by
Low Vision Assessment
 Reason for Assessment Diagnosis & relevant history: Does patient wear corrective lenses? Y N If yes, what type? single strength bifocals trifocal Lenses worn for: near vision distance at all times Last
Human Anatomy and Physiology - ANAT 14 Sensory System Lab Goals Activities
 Sensory System Human Anatomy and Physiology - ANAT 14 Lab Goals Observe many characteristics of our somatic and special senses. Activity descriptions noted in your lab manual are specified. Activities
Neural circuits PSY 310 Greg Francis. Lecture 05. Rods and cones
 Neural circuits PSY 310 Greg Francis Lecture 05 Why do you need bright light to read? Rods and cones Photoreceptors are not evenly distributed across the retina 1 Rods and cones Cones are most dense in
Office Ergonomics and Workstation Analysis
 Office Ergonomics and Workstation Analysis Ergonomics is the study of the relationship between people and their environment. In the workplace, ergonomics is the science of designing or redesigning the
Journal of Educational Research and Evaluation. Development of Pneumonia Risk Early Detection Instruments in Puskesmas Area, Semarang City
 JERE 7 (2) (2018) 139-148 Journal of Educational Research and Evaluation http://journal.unnes.ac.id/sju/index.php/jere Development of Pneumonia Risk Early Detection Instruments in Puskesmas Area, Semarang
Describe what is meant by a placebo Contrast the double-blind procedure with the single-blind procedure Review the structure for organizing a memo
 Business Statistics The following was provided by Dr. Suzanne Delaney, and is a comprehensive review of Business Statistics. The workshop instructor will provide relevant examples during the Skills Assessment
Fatigue management guidelines
 Contents Introduction...2 1. What is the purpose of this guide?...2 2. What is fatigue?...3 3. Why does fatigue matter to taxi drivers?...3 4. Fatigue management responsibilities for drivers... 3 5. Effects
The Influence of Attitude, Subjective Norm, and Perceived Behavioural Control Toward Snack Consumer Behaviour in Halal Labeling in Yogyakarta
 Ilmu Pertanian (Agricultural Science) Vol. 2 No. 1 April, 2017 :029-34 Available online at http://journal.ugm.ac.id/jip DOI: doi.org/10.22146/ipas.10827 The Influence of Attitude, Subjective Norm, and
Simple Linear Regression One Categorical Independent Variable with Several Categories
 Simple Linear Regression One Categorical Independent Variable with Several Categories Does ethnicity influence total GCSE score? We ve learned that variables with just two categories are called binary
ANOVA in SPSS (Practical)
") ANOVA in SPSS (Practical) Analysis of Variance practical In this practical we will investigate how we model the influence of a categorical predictor on a continuous response. Centre for Multilevel Modelling
ANOVA in SPSS (Practical) Analysis of Variance practical In this practical we will investigate how we model the influence of a categorical predictor on a continuous response. Centre for Multilevel Modelling
Section 53 FATIGUE MANAGEMENT
 1. Purpose The purpose of this policy is to establish the requirements for managing fatigue. It is intended that this policy will reduce the risk of fatigue-related injuries and incidents in the workplace.
The Journal of Educational Development
 The Journal of Educational Development JED 5 (3) (2017) 414-424 http://journal.unnes.ac.id/sju/index.php/jed Effect of the School Principal s Management, Academic Supervision, Organizational Culture, and
Cataract Surgery: Patient Information
 Cataract Surgery: Patient Information How do the Eyes Work? As light enters the eye, it first passes through the cornea the clear window of the eye. Because the cornea is curved, the light rays bend (refract).
Business Research Methods. Introduction to Data Analysis
 Business Research Methods Introduction to Data Analysis Data Analysis Process STAGES OF DATA ANALYSIS EDITING CODING DATA ENTRY ERROR CHECKING AND VERIFICATION DATA ANALYSIS Introduction Preparation of
The Impact of Melamine Spiking on the Gel Strength and Viscosity of Gelatin
 The Impact of Melamine Spiking on the and of atin Introduction The primary purpose of this research was to assess the impact of melamine spiking on the gel strength and viscosity of gelatin. A secondary
7. Sharp perception or vision 8. The process of transferring genetic material from one cell to another by a plasmid or bacteriophage
 1. A particular shade of a given color 2. How many wave peaks pass a certain point per given time 3. Process in which the sense organs' receptor cells are stimulated and relay initial information to higher
MULTIPLE REGRESSION OF CPS DATA
 MULTIPLE REGRESSION OF CPS DATA A further inspection of the relationship between hourly wages and education level can show whether other factors, such as gender and work experience, influence wages. Linear
Acceptance Analysis of Logic And Algorithms Learning Application By Using Technology Acceptance Model At Business And Informatics Stikom Surabaya
 International Journal of Business and Management Invention (IJBMI) ISSN (Online): 2319 8028, ISSN (Print): 2319 801X Volume 7 Issue 1 January. 2018 PP 51-58 Acceptance Analysis of Logic And Algorithms
The lowest level of stimulation that a person can detect. absolute threshold. Adapting one's current understandings to incorporate new information.
 absolute threshold The lowest level of stimulation that a person can detect accommodation Adapting one's current understandings to incorporate new information. acuity Sharp perception or vision audition
Modeling Tetanus Neonatorum case using the regression of negative binomial and zero-inflated negative binomial
 Journal of Physics: Conference Series PAPER OPEN ACCESS Modeling Tetanus Neonatorum case using the regression of negative binomial and zero-inflated negative binomial To cite this article: Luthfatul Amaliana
INFLUENCE OF ATTITUDE AND MOTIVATION OF BEHAVIOR IN THE COMMUNITY ENVIRONMENTAL RIPARIAN MAROS DISTRICT OF SOUTH SULAWESI PROVINCE
 Man In India, 95 (3) : 781-793 Serials Publications INFLUENCE OF ATTITUDE AND MOTIVATION OF BEHAVIOR IN THE COMMUNITY ENVIRONMENTAL RIPARIAN MAROS DISTRICT OF SOUTH SULAWESI PROVINCE Syafri, Gufran Darma
Statistical techniques to evaluate the agreement degree of medicine measurements
 Statistical techniques to evaluate the agreement degree of medicine measurements Luís M. Grilo 1, Helena L. Grilo 2, António de Oliveira 3 1 lgrilo@ipt.pt, Mathematics Department, Polytechnic Institute
Quantitative Methods in Computing Education Research (A brief overview tips and techniques)
") Quantitative Methods in Computing Education Research (A brief overview tips and techniques) Dr Judy Sheard Senior Lecturer Co-Director, Computing Education Research Group Monash University judy.sheard@monash.edu
Quantitative Methods in Computing Education Research (A brief overview tips and techniques) Dr Judy Sheard Senior Lecturer Co-Director, Computing Education Research Group Monash University judy.sheard@monash.edu
Development of an Illumination Control Method to Improve Office Productivity
 Development of an Illumination Control Method to Improve Office Productivity Fumiaki Obayashi, Misa Kawauchi, Masaaki Terano Matsushita Electric Works, Ltd., 1048 Kadoma, Kadoma, Osaka, Japan {obayashi,
Chapter 10: Moderation, mediation and more regression
 Chapter 10: Moderation, mediation and more regression Smart Alex s Solutions Task 1 McNulty et al. (2008) found a relationship between a person s Attractiveness and how much Support they give their partner
SPSS output for 420 midterm study
 Ψ Psy Midterm Part In lab (5 points total) Your professor decides that he wants to find out how much impact amount of study time has on the first midterm. He randomly assigns students to study for hours,
Employee Outsourcing in Packing Plant PT Semen Padang can be Incidental Interrupted Disease that Affected by the Performance and Education Level
 OPEN ACCESS INTERNATIONAL JOURNAL OF ENVIRONMENTAL & SCIENCE EDUCATION e-issn: 1306-3065 2018, Vol. 13, No. 3, 251-256 Employee Outsourcing in Packing Plant PT Semen Padang can be Incidental Interrupted
Shift Work and Fatigue
 Shift Work and Fatigue SHIFT WORK What is Shift Work and why is it Important? It is: Groups of people working together alternating with other groups to create a cohesive and productive workplace 24 hours
MMI 409 Spring 2009 Final Examination Gordon Bleil. 1. Is there a difference in depression as a function of group and drug?
 MMI 409 Spring 2009 Final Examination Gordon Bleil Table of Contents Research Scenario and General Assumptions Questions for Dataset (Questions are hyperlinked to detailed answers) 1. Is there a difference
The Art & Science of Fitting the Work to the Person
 OFFICE ERGONOMICS The Art & Science of Fitting the Work to the Person What is Ergonomics? By the end of this chapter, You will be able to: Demonstrate a general knowledge of office ergonomics Identify
Comparative Effect Haloperidol and Quetiapine within Positive Symptoms for Female Schizophrenic Patient
 ISSN 2224-38 (Paper) ISSN 2225-093X (Online) Vol.4, No.28, 14 Comparative Effect and Quetiapine within Positive Symptoms for Female Schizophrenic Patient Hanip Fahri * Vita Camellia 1 Bahagia Loebis Faculty
Readings: Textbook readings: OpenStax - Chapters 1 13 (emphasis on Chapter 12) Online readings: Appendix D, E & F
 Online readings: Appendix D, E & F") Readings: Textbook readings: OpenStax - Chapters 1 13 (emphasis on Chapter 12) Online readings: Appendix D, E & F Plous Chapters 17 & 18 Chapter 17: Social Influences Chapter 18: Group Judgments and Decisions
Readings: Textbook readings: OpenStax - Chapters 1 13 (emphasis on Chapter 12) Online readings: Appendix D, E & F Plous Chapters 17 & 18 Chapter 17: Social Influences Chapter 18: Group Judgments and Decisions
The Influence of Organizational Culture Behavior on Work Motivation: Case Study of Returnee of AFS Bina Antar- Budaya, Yogyakarta
 The Influence of Organizational Culture Behavior on Work Motivation: Case Study of Returnee of AFS Bina Antar- Budaya, Yogyakarta Cholivia Qonita *, Sanggar Kanto, Anif Fatmwa Chawwa Faculty of Social
CHILD HEALTH AND DEVELOPMENT STUDY
 CHILD HEALTH AND DEVELOPMENT STUDY 9. Diagnostics In this section various diagnostic tools will be used to evaluate the adequacy of the regression model with the five independent variables developed in
IAPT: Regression. Regression analyses
 Regression analyses IAPT: Regression Regression is the rather strange name given to a set of methods for predicting one variable from another. The data shown in Table 1 and come from a student project
Statistics for Psychology
 Statistics for Psychology SIXTH EDITION CHAPTER 12 Prediction Prediction a major practical application of statistical methods: making predictions make informed (and precise) guesses about such things as
Driving at Night. It's More Dangerous
 It's More Dangerous Driving at Night You are at greater risk when you drive at night. Drivers can't see hazards as quickly as in daylight, so they have less time to respond. Drivers caught by surprise
Simple Linear Regression
 Simple Linear Regression Assoc. Prof Dr Sarimah Abdullah Unit of Biostatistics & Research Methodology School of Medical Sciences, Health Campus Universiti Sains Malaysia Regression Regression analysis
OFFICE ERGONOMICS. Department of Environmental Health and Safety University of Pittsburgh
 OFFICE ERGONOMICS Department of Environmental Health and Safety University of Pittsburgh Ergonomics What is it? Why should I be interested? What do I need to know to help myself? Where can I get help?
Ergonomics. For additional assistance, contact the Occupational Safety office to schedule an evaluation.
 Ergonomics 1. Purpose: Virginia Commonwealth University Department of Safety and Risk and Risk Management (SRM) developed this program to improve the health and happiness of it s employees by assisting
M 140 Test 1 A Name SHOW YOUR WORK FOR FULL CREDIT! Problem Max. Points Your Points Total 60
 M 140 Test 1 A Name SHOW YOUR WORK FOR FULL CREDIT! Problem Max. Points Your Points 1-10 10 11 3 12 4 13 3 14 10 15 14 16 10 17 7 18 4 19 4 Total 60 Multiple choice questions (1 point each) For questions
Using the ISO characterized reference print conditions to test an hypothesis about common color appearance
 Using the ISO 15339 characterized reference print conditions to test an hypothesis about common color appearance John Seymour 1, Sept 23, 2016 Abstract If I view an ad for my favorite cola in a newspaper
Validity, Reliability and Classical Assumptions
 , Reliability and Classical Assumptions Presented by Mahendra AN Sources: www-psych.stanford.edu/~bigopp/.ppt http://ets.mnsu.edu/darbok/ethn402-502/reliability.ppt http://5martconsultingbandung.blogspot.com/2011/01/uji-asumsi-klasik.html
Global Stability of SACR Epidemic Model for Hepatitis C on Injecting Drug Users
 PROCEEDING OF 3 RD INTERNATIONAL CONFERENCE ON RESEARCH, IMPLEMENTATION AND EDUCATION OF MATHEMATICS AND SCIENCE YOGYAKARTA, 16 17 MAY 2016 Global Stability of SACR Epidemic Model for Hepatitis C on Injecting
Two-Way Independent ANOVA
 Two-Way Independent ANOVA Analysis of Variance (ANOVA) a common and robust statistical test that you can use to compare the mean scores collected from different conditions or groups in an experiment. There
Preliminary Report on Simple Statistical Tests (t-tests and bivariate correlations)
") Preliminary Report on Simple Statistical Tests (t-tests and bivariate correlations) After receiving my comments on the preliminary reports of your datasets, the next step for the groups is to complete
Preliminary Report on Simple Statistical Tests (t-tests and bivariate correlations) After receiving my comments on the preliminary reports of your datasets, the next step for the groups is to complete
Research Methods in Forest Sciences: Learning Diary. Yoko Lu December Research process
 Research Methods in Forest Sciences: Learning Diary Yoko Lu 285122 9 December 2016 1. Research process It is important to pursue and apply knowledge and understand the world under both natural and social
6. Unusual and Influential Data
 Sociology 740 John ox Lecture Notes 6. Unusual and Influential Data Copyright 2014 by John ox Unusual and Influential Data 1 1. Introduction I Linear statistical models make strong assumptions about the