Filling the Bins - or - Turning Numerical Data into Histograms. ISC1057 Janet Peterson and John Burkardt Computational Thinking Fall Semester 2016
|
|
|
- Joseph Matthews
- 6 years ago
- Views:
Transcription
1 * Filling the Bins - or - Turning Numerical Data into Histograms ISC1057 Janet Peterson and John Burkardt Computational Thinking Fall Semester 2016
2 A histogram is a kind of chart which shows patterns in sets of numeric data. Strictly speaking, a histogram is different from a bar chart, because a bar chart is based on categories: the number of times each baseball team has won a World Series, for instance. The categories are given, and we just have to assign a number to each one. For a histogram, we might have measurements of the circumference of 1,000 trees on campus, that is, just series of 1,000 numbers. These numbers might all be different. If we made a bar chart of this data, then we would end up with 1,000 little bars, one for each measurement.
3 But if the numbers are measurements, then it might make sense to group them together, separating small, medium and large numbers, or, more carefully, dividing the values into ranges, or bins. The size and number of bins we use will have a significant effect on whether we can see patterns in the data. We don t want every number in a separate bin, or all the numbers in a single bin. We are looking for natural patterns that the numbers arrange themsselve into when we give them a reasonable number of bins to choose from.
4 Sample data: Employee Number Position Annual Salary 1 Clerk 32,000 2 Stocker 17,125 3 Senior Manager 143, more data 2108 Vice President for Sales 245, Cleaner 15, Data Analyst 74,000 It s possible that no two people in this company earn the same salary. What it we consider salary ranges of $10,000, and count the number of employees in each range?
5
6 In a histogram, it s usual to make the bin widths or ranges the same. That means we still have to decide how many bins to use, and so sometimes a little experimentation is necessary. However, just as with bar charts, if the data is properly plotted, we may find that it is: pretty much flat or even; arranged like a staircase (mostly up, or mostly down); arranged like a hill (up, then down); arranged like a valley (down, then up). having several peak values separated by valleys (as in our salary data on the previous slide); seemingly random (up and down with no pattern); A histogram may summarize or illustrate our beliefs, or it may be evidence that asks us to think of an explanation.
7 Example #1: 200 Height and Weight Measurements It s a common practice to collect height and weight measurements. We assume there is an average height, with some range of normal variation. But are there more short people than tall ones? It s not so easy to guess someone s weight, and the range of variation is probably much greater than for height. Because both measurements are numbers that are scattered over a numeric range, a histogram can be a good tool to find patterns.
8 We have 200 height and weight measurements in the file hw 200.csv. Index, Height (inches), Weight (pounds) 1, 65.78, , 71.52, , 69.40, more data 198, 68.24, , 68.02, , 71.39,
9

10
11

12
13
14

15
16
17
18 Example #1.5: (DO OVER!) 25,000 Height and Weight Measurements Our histogram of the height measurements was somewhat disappointing. There was a pattern visible, with the typical height seeming to 67.5 inches or , and other heights tending to stay close to that value. However, the histogram pattern looked very blocky and irregular, especially when we had a bin width of 1 2. We would expect that a law of nature would have a smoother appearance. However, it s possible that we just haven t looked at enough data for the pattern to become clear. We can test this idea, because we have another dataset of 25,000 height and weight measurements.
19
20

21

22
23
24 Example #2: Female Oscar Winners The Academy awards or Oscars for best Actor and Actress have been given every year since 1928, a total of 89 years. It has often been said that Hollywood treats men and women stars very differently: male actors have long careers, and can have leading roles into their 60 s, while actresses are often allowed only a few hit roles before being dropped in favor of younger stars. As a small test of this statement, we can plot the ages of female Oscar winners, and see if the plot has any story to tell.
25 Our data is stored in the file oscar female.csv. Index, Year, Age, Name, Movie 1, 1928, 22, Janet Gaynor, Seventh Heaven 2, 1929, 37, Mary Pickford, Coquette 3, 1930, 28, Norma Shearer, The Divorcee more data 87, 2014, 44, Cate Blanchett, Blue Jasmine 88, 2015, 54, Julianne Moore, Still Alice 89, 2016, 26, Brie Larson, Room
26 We begin our histogram creation by logging into Plotly. There is already some sample data entered in the Plotly grid, but we want to replace this with the data from our file. We do this by going to the IMPORT menu item, choosing Upload file, then using the browse menu to find our file and clicking on it.

27
28
29

30

31

32

33
34
35
36 Example #3: Male Oscar Winners The female Academy Award winners represent a small and untypical sample of the acting careers of women in Hollywood, but our histogram does suggest that women have the greatest success at a very early age, and seem to decrease in visibility each time we move 5 years further in age range, although there are some blips popping up in the later end of the plot. If our data is correctly showing us the story, then it s natural to wonder about what we would see if we examined the same data for male Oscar winners. First we need to grab the corresponding data file!
37 Our data is stored in the file oscar male.csv. Index, Year, Age, Name, Movie 1, 1928, 44, Emil Jannings, The Last Command 2, 1929, 41, Warner Baxter, In Old Arizona 3, 1930, 62, George Arliss, Disraeli more data 87, 2014, 44, Matthew McConaughey, Dallas Buyers Club 88, 2015, 33, Eddie Redmayne, The Theory of Everything 89, 2016, 41, Leonardo DiCaprio, The Revenant
38
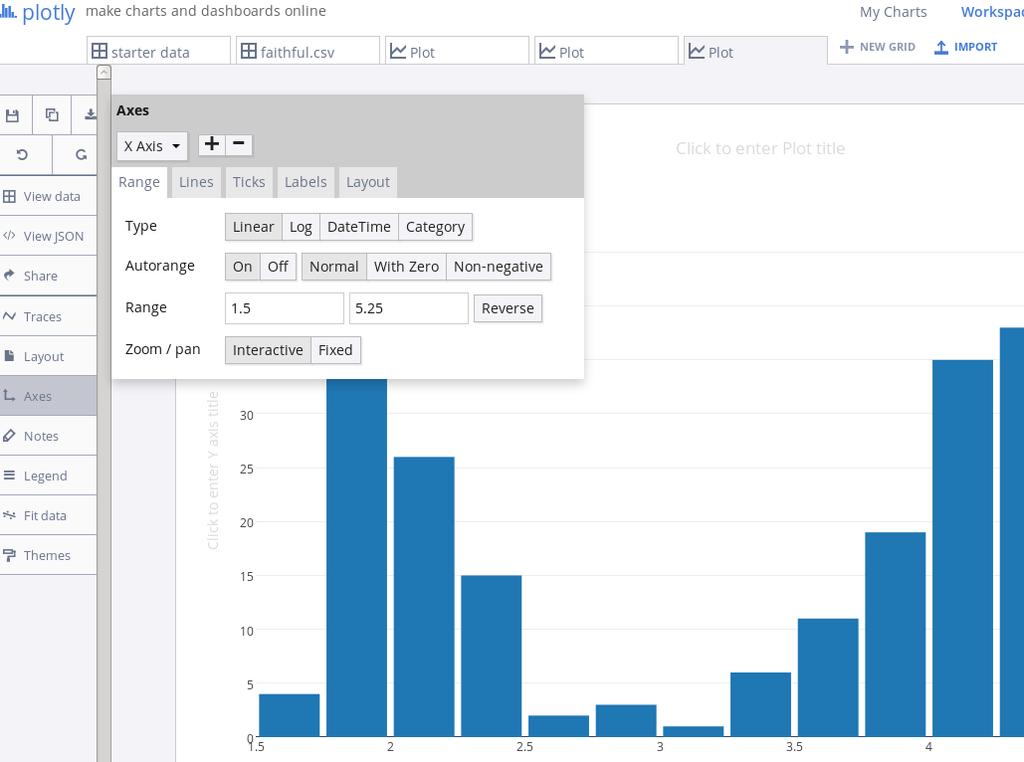
39 Our first plot has an interesting shape, but if we are going to compare it to the same plot for the female Oscar winners, we need to make some modifications. In particular, note that the horizontal data (the Age values) doesn t seem to have the same extent as in the plot of the female data. Unless we say so, Plotly will make the graph just wide enough for the data it sees. But we can go into the Axes menu item, and pick the Range item and then change the range from the values Range to match the range on the female plot: Range

40
41
42 Now we have both sets of data plotted with the same age range matched up. We can concentrate on the story that the two sets of histogram bars seem to be telling. One reading of this story is: Male actors have their peak popularity in their late 30 s, and their careers don t start to drop off until around 50, continuing til 65. Female actores have their peak popularity in their late 20 s, and their careers immediately begin to drop off substantially every 5 years thereafter til about 55.
43
44 Example #4: Probabilities (Number of Turns in Snakes and Ladders) Snakes and Ladders is a game played on a board of 100 numbered squares. From the starting square, players repeatedly roll a die, trying to reach the final square first. Certain squares have a ladder that moves you ahead; others are snakes that drag you backwards. A simple question to investigate: How many turns does it take for one player to reach the final square?

45
46 Since dice are involved, there s an element of chance, so we have to revise our question and ask, what is the typical or average number of turns required for one player? It s not easy to see a way to answer this question, except to play a lot of games and see what happens. To keep things simple, we imagine a single player, who rolls the die over and over, following the rules, until reaching the end, and writing down the number of turns required.
47 We could store our data in a file called snakes 10.csv. Game Number, Game Length 1, 30 2, 29 3, 31 4, 16 5, 24 6, 29 7, 28 8, 117 9, 42 10, 23 but that one long 117 turn game suggests we need more data!

48
49
50
51
52 Using data from 10,000 games, our histogram seems to have a fairly smooth shape, which suggests that the data has settled down, and that the effects of chance have been averaged out. However, we still can see a certain amount of saw-tooth or up-anddown variations in the plot. If we look in the Traces menu, we can see that our bin width is 2. If we use wider bins, we may be able to smooth out our plot. At the same time, we can reduce the maximum interesting value of Game Length to 100, which will allow us to focus on the most commonly occurring values. The result is a simplified plot that is smoother and easier to read.

53

54
55 Example #5: A Camel with Two Humps (Bimodal data) Sometimes a histogram can show an interesting pattern in the data. It may look like a double mountain range, having two peaks. Often, a peak represents a typical behavior, and if the data has two peaks, then it suggests that sometimes the system wants to do one thing, and sometimes the other. A peak in a histogram is sometimes called a mode and a histogram that has two peaks is called a bimodal histogram.
56 Our data is stored in the file faithful.csv. Index, Eruption length (mins), Eruption wait (mins) 1, 3.600, 79 2, 1.800, 54 3, 3.333, 74 more data 270, 4.417, , 1.817, , 4.467, 74

57
58 Now we will do a histogram of the duration of an eruption, that is, after however long we had to wait, how long the geyser actually sprays water upwards in a spectacular show. Since the geyser has a short and a long waiting period, we might expect that sometimes the water doesn t have so much time to heat up, and other times it does, so that we have a corresponding short and long eruption pattern as well. By default, the horizontal plot range starts with the smallest observed time. In order to better suggest the time scale, I went to the colorredaxes left hand menu item and reset the plot range to start at 0.
59
60
Chapter 7: Descriptive Statistics
 Chapter Overview Chapter 7 provides an introduction to basic strategies for describing groups statistically. Statistical concepts around normal distributions are discussed. The statistical procedures of
Risk Aversion in Games of Chance
 Risk Aversion in Games of Chance Imagine the following scenario: Someone asks you to play a game and you are given $5,000 to begin. A ball is drawn from a bin containing 39 balls each numbered 1-39 and
CCM6+7+ Unit 12 Data Collection and Analysis
 Page 1 CCM6+7+ Unit 12 Packet: Statistics and Data Analysis CCM6+7+ Unit 12 Data Collection and Analysis Big Ideas Page(s) What is data/statistics? 2-4 Measures of Reliability and Variability: Sampling,
Statistics: Interpreting Data and Making Predictions. Interpreting Data 1/50
 Statistics: Interpreting Data and Making Predictions Interpreting Data 1/50 Last Time Last time we discussed central tendency; that is, notions of the middle of data. More specifically we discussed the
Bouncing Ball Lab. Name
 Bouncing Ball Lab Name Scientists use an organized set of steps when they solve problems or perform investigations. This organized set of steps is called the Scientific Method. There are many versions
Eating and Sleeping Habits of Different Countries
 9.2 Analyzing Scatter Plots Now that we know how to draw scatter plots, we need to know how to interpret them. A scatter plot graph can give us lots of important information about how data sets are related
The Effectiveness of Captopril
 Lab 7 The Effectiveness of Captopril In the United States, pharmaceutical manufacturers go through a very rigorous process in order to get their drugs approved for sale. This process is designed to determine
Clever Hans the horse could do simple math and spell out the answers to simple questions. He wasn t always correct, but he was most of the time.
 Clever Hans the horse could do simple math and spell out the answers to simple questions. He wasn t always correct, but he was most of the time. While a team of scientists, veterinarians, zoologists and
Further Mathematics 2018 CORE: Data analysis Chapter 3 Investigating associations between two variables
 Chapter 3: Investigating associations between two variables Further Mathematics 2018 CORE: Data analysis Chapter 3 Investigating associations between two variables Extract from Study Design Key knowledge
Population. Sample. AP Statistics Notes for Chapter 1 Section 1.0 Making Sense of Data. Statistics: Data Analysis:
 Section 1.0 Making Sense of Data Statistics: Data Analysis: Individuals objects described by a set of data Variable any characteristic of an individual Categorical Variable places an individual into one
Clinical Applications of Emerging Tactile-Sensing Technologies
 Transcript Details This is a transcript of an educational program accessible on the ReachMD network. Details about the program and additional media formats for the program are accessible by visiting: https://reachmd.com/programs/clinicians-roundtable/clinical-applications-of-emerging-tactile-sensingtechnologies/2257/
Stepwise method Modern Model Selection Methods Quantile-Quantile plot and tests for normality
 Week 9 Hour 3 Stepwise method Modern Model Selection Methods Quantile-Quantile plot and tests for normality Stat 302 Notes. Week 9, Hour 3, Page 1 / 39 Stepwise Now that we've introduced interactions,
UF#Stats#Club#STA#2023#Exam#1#Review#Packet# #Fall#2013#
 UF#Stats#Club#STA##Exam##Review#Packet# #Fall## The following data consists of the scores the Gators basketball team scored during the 8 games played in the - season. 84 74 66 58 79 8 7 64 8 6 78 79 77
Organizing Data. Types of Distributions. Uniform distribution All ranges or categories have nearly the same value a.k.a. rectangular distribution
 Organizing Data Frequency How many of the data are in a category or range Just count up how many there are Notation x = number in one category n = total number in sample (all categories combined) Relative
Lab 4 (M13) Objective: This lab will give you more practice exploring the shape of data, and in particular in breaking the data into two groups.
 Objective: This lab will give you more practice exploring the shape of data, and in particular in breaking the data into two groups.") Lab 4 (M13) Objective: This lab will give you more practice exploring the shape of data, and in particular in breaking the data into two groups. Activity 1 Examining Data From Class Background Download
Lab 4 (M13) Objective: This lab will give you more practice exploring the shape of data, and in particular in breaking the data into two groups. Activity 1 Examining Data From Class Background Download
Planning and Carrying Out an Investigation. Name:
 Planning and Carrying Out an Investigation Name: Part A: Asking Questions (NGSS Practice #1) Topic or Phenomenon: 1. What am I wondering? What questions do I have about the topic/phenomenon? (why, when,
Standard Deviation and Standard Error Tutorial. This is significantly important. Get your AP Equations and Formulas sheet
 Standard Deviation and Standard Error Tutorial This is significantly important. Get your AP Equations and Formulas sheet The Basics Let s start with a review of the basics of statistics. Mean: What most
deafness It s called A BETTER UNDERSTANDING OF THIS PROBLEM WILL HELP TO ELIMINATE ANY EXISTING STIGMA
 It s called deafness Jennifer Moore-Mallinos Illustrations: Marta Fàbrega A BETTER UNDERSTANDING OF THIS PROBLEM WILL HELP TO ELIMINATE ANY EXISTING STIGMA My name is Lana. What is your name? It s called
Paper Airplanes & Scientific Methods
 Paper Airplanes & Scientific Methods Scientific Inquiry refers to the many different ways in which scientists investigate the world. Scientific investigations are done to answer questions and solve problems.
Quantitative Evaluation
 Quantitative Evaluation Research Questions Quantitative Data Controlled Studies Experimental Methods Role of Statistics Quantitative Evaluation What is experimental design? What is an experimental hypothesis?
15.301/310, Managerial Psychology Prof. Dan Ariely Recitation 8: T test and ANOVA
 15.301/310, Managerial Psychology Prof. Dan Ariely Recitation 8: T test and ANOVA Statistics does all kinds of stuff to describe data Talk about baseball, other useful stuff We can calculate the probability.
Physiological Simulations: Plasma Glucose Regulation 1 Physiology Biology 390
 Physiological Simulations: Plasma Glucose Regulation 1 Physiology Biology 390 I. An Introduction to this Lab and to Models 2 in General: The purpose of this exercise is to use a computer simulation to
Name: Economics Fall Semester October 14, Test #1
 Name: Economics 300-01 Fall Semester 2009-10 October 14, 2009 Test #1 Each problem is weighted equally. Write your answers on the test; use an appropriate number of significant digits for each answer;
MA 151: Using Minitab to Visualize and Explore Data The Low Fat vs. Low Carb Debate
 MA 151: Using Minitab to Visualize and Explore Data The Low Fat vs. Low Carb Debate September 5, 2018 1 Introduction to the Data We will be working with a synthetic data set meant to resemble the weight
What is Data? Part 2: Patterns & Associations. INFO-1301, Quantitative Reasoning 1 University of Colorado Boulder
 What is Data? Part 2: Patterns & Associations INFO-1301, Quantitative Reasoning 1 University of Colorado Boulder August 29, 2016 Prof. Michael Paul Prof. William Aspray Overview This lecture will look
Newsletter E-Commerce Place 1350 &1360, René-Lévesque Blvd. West
 Newsletter E-Commerce Place 1350 &1360, René-Lévesque Blvd. West Volume 1II, Issue 2 FALL 2009 EDITION Special point of interest : E-COMMERCE PLACE WINS BOMA CANADA S BUILDING OF THE YEAR AWARD INSIDE
Controlled Experiments
 CHARM Choosing Human-Computer Interaction (HCI) Appropriate Research Methods Controlled Experiments Liz Atwater Department of Psychology Human Factors/Applied Cognition George Mason University lizatwater@hotmail.com
Homework #3. SHORT ANSWER. Write the word or phrase that best completes each statement or answers the question.
 Homework #3 Name Due Due on on February Tuesday, Due on February 17th, Sept Friday 28th 17th, Friday SHORT ANSWER. Write the word or phrase that best completes each statement or answers the question. Fill
CHAPTER 3 Describing Relationships
 CHAPTER 3 Describing Relationships 3.1 Scatterplots and Correlation The Practice of Statistics, 5th Edition Starnes, Tabor, Yates, Moore Bedford Freeman Worth Publishers Reading Quiz 3.1 True/False 1.
Outline. Practice. Confounding Variables. Discuss. Observational Studies vs Experiments. Observational Studies vs Experiments
 1 2 Outline Finish sampling slides from Tuesday. Study design what do you do with the subjects/units once you select them? (OI Sections 1.4-1.5) Observational studies vs. experiments Descriptive statistics
(a) 50% of the shows have a rating greater than: impossible to tell
 50% of the shows have a rating greater than: impossible to tell") q 1. Here is a histogram of the Distribution of grades on a quiz. How many students took the quiz? What percentage of students scored below a 60 on the quiz? (Assume left-hand endpoints are included in
q 1. Here is a histogram of the Distribution of grades on a quiz. How many students took the quiz? What percentage of students scored below a 60 on the quiz? (Assume left-hand endpoints are included in
q2_2 MULTIPLE CHOICE. Choose the one alternative that best completes the statement or answers the question.
 q2_2 MULTIPLE CHOICE. Choose the one alternative that best completes the statement or answers the question. A sporting goods retailer conducted a customer survey to determine its customers primary reason
Standard KOA3 5=3+2 5=4+1. Sarah Krauss CCLM^2 Project Summer 2012
 Sarah Krauss CCLM^2 Project Summer 2012 DRAFT DOCUMENT. This material was developed as part of the Leadership for the Common Core in Mathematics (CCLM^2) project at the University of Wisconsin-Milwaukee.
Students will understand the definition of mean, median, mode and standard deviation and be able to calculate these functions with given set of
 Students will understand the definition of mean, median, mode and standard deviation and be able to calculate these functions with given set of numbers. Also, students will understand why some measures
Math 075 Activities and Worksheets Book 2:
 Math 075 Activities and Worksheets Book 2: Linear Regression Name: 1 Scatterplots Intro to Correlation Represent two numerical variables on a scatterplot and informally describe how the data points are
(a) 50% of the shows have a rating greater than: impossible to tell
 50% of the shows have a rating greater than: impossible to tell") KEY 1. Here is a histogram of the Distribution of grades on a quiz. How many students took the quiz? 15 What percentage of students scored below a 60 on the quiz? (Assume left-hand endpoints are included
KEY 1. Here is a histogram of the Distribution of grades on a quiz. How many students took the quiz? 15 What percentage of students scored below a 60 on the quiz? (Assume left-hand endpoints are included
MULTIPLE CHOICE. Choose the one alternative that best completes the statement or answers the question.
 Statistics Final Review Semeter I Name MULTIPLE CHOICE. Choose the one alternative that best completes the statement or answers the question. Provide an appropriate response. 1) The Centers for Disease
Chapter 3: Examining Relationships
 Name Date Per Key Vocabulary: response variable explanatory variable independent variable dependent variable scatterplot positive association negative association linear correlation r-value regression
ORIENTATION SAN FRANCISCO STOP SMOKING PROGRAM
 ORIENTATION SAN FRANCISCO STOP SMOKING PROGRAM PURPOSE To introduce the program, tell the participants what to expect, and set an overall positive tone for the series. AGENDA Item Time 0.1 Acknowledgement
Gold Coast Film Group The 2015 Academy Awards
 Gold Coast Film Group The 2015 Academy Awards Best Cinematography Carol, Ed Lachman The Hateful Eight, Robert Richardson Mad Max: Fury Road, John Seale The Revenant, Emmanuel Lubezki Sicario, Roger Deakins
Variability. After reading this chapter, you should be able to do the following:
 LEARIG OBJECTIVES C H A P T E R 3 Variability After reading this chapter, you should be able to do the following: Explain what the standard deviation measures Compute the variance and the standard deviation
Chapter 1. Picturing Distributions with Graphs
 Chapter 1 Picturing Distributions with Graphs Statistics Statistics is a science that involves the extraction of information from numerical data obtained during an experiment or from a sample. It involves
Unit 7 Comparisons and Relationships
 Unit 7 Comparisons and Relationships Objectives: To understand the distinction between making a comparison and describing a relationship To select appropriate graphical displays for making comparisons
1SCIENTIFIC METHOD PART A. THE SCIENTIFIC METHOD
 1SCIENTIFIC METHOD LEARNING OUTCOMES Upon successful completion of this lab, you will be able to: Describe the steps of the scientific method Formulate research questions, hypotheses, and predictions Design
Sheila Barron Statistics Outreach Center 2/8/2011
 Sheila Barron Statistics Outreach Center 2/8/2011 What is Power? When conducting a research study using a statistical hypothesis test, power is the probability of getting statistical significance when
q3_2 MULTIPLE CHOICE. Choose the one alternative that best completes the statement or answers the question.
 q3_2 MULTIPLE CHOICE. Choose the one alternative that best completes the statement or answers the question. Provide an appropriate response. 1) The relationship between the number of games won by a minor
An Interview with a Chiropractor
 An Interview with a Chiropractor Doctor Scott Warner took the time out of his busy schedule to talk to us about chiropractic medicine what it is, what it isn t, and why he chose it as a profession. What
GCSE PSYCHOLOGY UNIT 2 FURTHER RESEARCH METHODS
 GCSE PSYCHOLOGY UNIT 2 FURTHER RESEARCH METHODS GCSE PSYCHOLOGY UNIT 2 SURVEYS SURVEYS SURVEY = is a method used for collecting information from a large number of people by asking them questions, either
Worksheet. Gene Jury. Dear DNA Detectives,
 Worksheet Dear DNA Detectives, Last night, Peter, a well-known businessman, was discovered murdered in the nearby hotel. As the forensic investigators on the scene, it is your job to find the murderer.
How to interpret scientific & statistical graphs
 How to interpret scientific & statistical graphs Theresa A Scott, MS Department of Biostatistics theresa.scott@vanderbilt.edu http://biostat.mc.vanderbilt.edu/theresascott 1 A brief introduction Graphics:
Our goal in this section is to explain a few more concepts about experiments. Don t be concerned with the details.
 Our goal in this section is to explain a few more concepts about experiments. Don t be concerned with the details. 1 We already mentioned an example with two explanatory variables or factors the case of
She won the Oscar for her role in the movie Monster's Ball. The role showed Berry's acting talent. She has been in more than 25 films and TV shows.
 Shining Star Halle Berry is a huge movie star. In 2002, she made Hollywood history. She became the first African American woman to win the Academy Award for Best Actress. She won the Oscar for her role
Education. Patient. Century. in the21 st. By Robert Braile, DC, FICA
 Patient Education 21 st in the21 st Century By Robert Braile, DC, FICA Thealthcare marketplace. We also here are a few things we need to recognize relative to how chiropractic is perceived in the need
How to Conduct an Unemployment Benefits Hearing
 How to Conduct an Unemployment Benefits Hearing Qualifications for receiving Unemployment Benefits Good Morning my name is Dorothy Hervey and I am a paralegal with Colorado Legal Services and I will talk
Primary Objectives. Content Standards (CCSS) Mathematical Practices (CCMP) Materials
 Mathematical Practices (CCMP) Materials") NEW-TRITIONAL INFO How long does it take to burn off food from McDonald s? licensed under CC-BY-NC lesson guide Many restaurants are required to post nutritional information for their foods, including
NEW-TRITIONAL INFO How long does it take to burn off food from McDonald s? licensed under CC-BY-NC lesson guide Many restaurants are required to post nutritional information for their foods, including
Descriptive statistics
 CHAPTER 3 Descriptive statistics 41 Descriptive statistics 3 CHAPTER OVERVIEW In Chapter 1 we outlined some important factors in research design. In this chapter we will be explaining the basic ways of
Patrick Breheny. January 28
 Confidence intervals Patrick Breheny January 28 Patrick Breheny Introduction to Biostatistics (171:161) 1/19 Recap Introduction In our last lecture, we discussed at some length the Public Health Service
MULTIPLE LINEAR REGRESSION 24.1 INTRODUCTION AND OBJECTIVES OBJECTIVES
 24 MULTIPLE LINEAR REGRESSION 24.1 INTRODUCTION AND OBJECTIVES In the previous chapter, simple linear regression was used when you have one independent variable and one dependent variable. This chapter
2.4.1 STA-O Assessment 2
 2.4.1 STA-O Assessment 2 Work all the problems and determine the correct answers. When you have completed the assessment, open the Assessment 2 activity and input your responses into the online grading
Captioning Your Video Using YouTube Online Accessibility Series
 Captioning Your Video Using YouTube This document will show you how to use YouTube to add captions to a video, making it accessible to individuals who are deaf or hard of hearing. In order to post videos
Flu Vaccines: Questions and Answers
 Flu Vaccines: Questions and s Question 1 Does the flu shot give me the flu? Does the flu shot give me the flu? I heard people get sick after the shot. Well, I m really glad you asked that question about
Letter to the teachers
 Letter to the teachers Hello my name is Sasha Jacombs I m 12 years old and I have had Type 1 Diabetes since I was four years old. Some of the people reading this may not know what that is, so I had better
Teachers Students Total
 Investigation #1: Analyzing data from two way tables Example #1: I pod ownership At a very large local high school in 2005, David wondered whether students at his local school were more likely to own an
STP226 Brief Class Notes Instructor: Ela Jackiewicz
 CHAPTER 2 Organizing Data Statistics=science of analyzing data. Information collected (data) is gathered in terms of variables (characteristics of a subject that can be assigned a numerical value or nonnumerical
Unit 1 Outline Science Practices. Part 1 - The Scientific Method. Screencasts found at: sciencepeek.com. 1. List the steps of the scientific method.
 Screencasts found at: sciencepeek.com Part 1 - The Scientific Method 1. List the steps of the scientific method. 2. What is an observation? Give an example. Quantitative or Qualitative Data? 35 grams?
Undertaking statistical analysis of
 Descriptive statistics: Simply telling a story Laura Delaney introduces the principles of descriptive statistical analysis and presents an overview of the various ways in which data can be presented by
EXERCISE: HOW TO DO POWER CALCULATIONS IN OPTIMAL DESIGN SOFTWARE
 ...... EXERCISE: HOW TO DO POWER CALCULATIONS IN OPTIMAL DESIGN SOFTWARE TABLE OF CONTENTS 73TKey Vocabulary37T... 1 73TIntroduction37T... 73TUsing the Optimal Design Software37T... 73TEstimating Sample
Physiological Mechanisms of Lucid Dreaming. Stephen LaBerge Sleep Research Center Stanford University
 Physiological Mechanisms of Lucid Dreaming Stephen LaBerge Sleep Research Center Stanford University For those of you here who aren t familiar with the general approach we have been using in our research
What Science Is and Is Not
 What Is Science? Key Questions What are the goals of science? What procedures are at the core of scientific methodology? Vocabulary science observation inference hypothesis controlled experiment independent
Graphic Organizers. Compare/Contrast. 1. Different. 2. Different. Alike
 1 Compare/Contrast When you compare and contrast people, places, objects, or ideas, you are looking for how they are alike and how they are different. One way to organize your information is to use a Venn
An InTROduCTIOn TO MEASuRInG THInGS LEvELS OF MEASuREMEnT
 An Introduction to Measuring Things 1 All of statistics is based upon numbers which represent ideas, as I suggested in the Preface. Those numbers are also measurements, taken from the world, or derived
Estimation. Preliminary: the Normal distribution
 Estimation Preliminary: the Normal distribution Many statistical methods are only valid if we can assume that our data follow a distribution of a particular type, called the Normal distribution. Many naturally
Intangible Attributes of Baseball s Best Players
 by Jim Murphy Intangible Attributes of Baseball s Best Players 1 Dealing with adversity Baseball is a game of failure, and the top players are comfortable with adversity. They don t base their self confidence
Aggregate Report Instructions
 Version 2018_v4 Workplace Health Solutions Center for Workplace Health Research & Evaluation Version 2018_v4 Table of Contents Purpose.....3 Data Privacy....3 About Life's Simple 7....4 Table 1. Life's
Scatter Plots and Association
 ? LESSON 1.1 ESSENTIAL QUESTION Scatter Plots and Association How can you construct and interpret scatter plots? Measurement and data 8.11.A Construct a scatterplot and describe the observed data to address
Large Research Studies
 Large Research Studies Core Concepts: Traditional large research studies involve collecting and analyzing data related to an independent variable and dependent variable for a large number of research subjects.
This means that the explanatory variable accounts for or predicts changes in the response variable.
 Lecture Notes & Examples 3.1 Section 3.1 Scatterplots and Correlation (pp. 143-163) Most statistical studies examine data on more than one variable. We will continue to use tools we have already learned
Two-Way Independent ANOVA
 Two-Way Independent ANOVA Analysis of Variance (ANOVA) a common and robust statistical test that you can use to compare the mean scores collected from different conditions or groups in an experiment. There
UNIT. Experiments and the Common Cold. Biology. Unit Description. Unit Requirements
 UNIT Biology Experiments and the Common Cold Unit Description Content: This course is designed to familiarize the student with concepts in biology and biological research. Skills: Main Ideas and Supporting
Reasoning about probabilities (cont.); Correlational studies of differences between means
; Correlational studies of differences between means") Reasoning about probabilities (cont.); Correlational studies of differences between means Phil 12: Logic and Decision Making Fall 2010 UC San Diego 10/29/2010 Review You have found a correlation in a sample
Reasoning about probabilities (cont.); Correlational studies of differences between means Phil 12: Logic and Decision Making Fall 2010 UC San Diego 10/29/2010 Review You have found a correlation in a sample
Test 1 Version A STAT 3090 Spring 2018
 Multiple Choice: (Questions 1 20) Answer the following questions on the scantron provided using a #2 pencil. Bubble the response that best answers the question. Each multiple choice correct response is
Reaction Times: A POGIL Introduction to the Nervous System
 Reaction Times: A POGIL Introduction to the Nervous System Original POGIL developed during July 2011 POGIL Workshop; revised by Nancy Cripe, Minnehaha Academy Student Content Outcomes Summarize the organization
Section 6: Analysing Relationships Between Variables
 6. 1 Analysing Relationships Between Variables Section 6: Analysing Relationships Between Variables Choosing a Technique The Crosstabs Procedure The Chi Square Test The Means Procedure The Correlations
Gage R&R. Variation. Allow us to explain with a simple diagram.
 Gage R&R Variation We ve learned how to graph variation with histograms while also learning how to determine if the variation in our process is greater than customer specifications by leveraging Process
Chapter 9: Comparing two means
 Chapter 9: Comparing two means Smart Alex s Solutions Task 1 Is arachnophobia (fear of spiders) specific to real spiders or will pictures of spiders evoke similar levels of anxiety? Twelve arachnophobes
This is a guide for volunteers in UTS HELPS Buddy Program. UTS.EDU.AU/CURRENT-STUDENTS/SUPPORT/HELPS/
 VOLUNTEER GUIDE This is a guide for volunteers in UTS HELPS Buddy Program. UTS.EDU.AU/CURRENT-STUDENTS/SUPPORT/HELPS/ CONTENTS 1 2 3 4 5 Introduction: Your role as a Buddy Getting started Helping with
Your goal in studying for the GED science test is scientific
 Science Smart 449 Important Science Concepts Your goal in studying for the GED science test is scientific literacy. That is, you should be familiar with broad science concepts and how science works. You
Frequency Distributions
 Frequency Distributions In this section, we look at ways to organize data in order to make it user friendly. We begin by presenting two data sets, from which, because of how the data is presented, it is
PubMed Tutorial for Veterinarians URL:
 Title: Scripts for the PubMed Tutorial for Veterinarians PubMed Tutorial for Veterinarians URL: http://cases.vetmoodle.org/cet_courseplayer/demo1/public/pubmed.html Digital collection of the documents
Recommendations from the Report of the Government Inquiry into:
 Recommendations from the Report of the Government Inquiry into: mental health addiction. Easy Read Before you start This is a long document. While it is written in Easy Read it can be hard for some people
STOR 155 Section 2 Midterm Exam 1 (9/29/09)
") STOR 155 Section 2 Midterm Exam 1 (9/29/09) Name: PID: Instructions: Both the exam and the bubble sheet will be collected. On the bubble sheet, print your name and ID number, sign the honor pledge, also
STOR 155 Section 2 Midterm Exam 1 (9/29/09) Name: PID: Instructions: Both the exam and the bubble sheet will be collected. On the bubble sheet, print your name and ID number, sign the honor pledge, also
SHORT ANSWER. Write the word or phrase that best completes each statement or answers the question.
 Chapters 6 & 7 Exam Review Math 0306 Name SHORT ANSWER. Write the word or phrase that best completes each statement or answers the question. Find fraction notation for the ratio. You need not simplify.
Building Concepts: Visualizing Linear Expressions
 Lesson Overview In this TI-Nspire lesson, students will use the distributive property to rewrite expressions for a given context in order to make connections between the scenario and the expression(s)
NEXTGEN ICD10 TIPS DEMONSTRATION
 NEXTGEN ICD10 TIPS DEMONSTRATION This demonstration reviews some of the changes you ll see in NextGen after ICD10 goes into effect October 1, 2015. Details of the workflow will likely vary somewhat, depending
Stats 95. Statistical analysis without compelling presentation is annoying at best and catastrophic at worst. From raw numbers to meaningful pictures
 Stats 95 Statistical analysis without compelling presentation is annoying at best and catastrophic at worst. From raw numbers to meaningful pictures Stats 95 Why Stats? 200 countries over 200 years http://www.youtube.com/watch?v=jbksrlysojo
Analysis and Interpretation of Data Part 1
 Analysis and Interpretation of Data Part 1 DATA ANALYSIS: PRELIMINARY STEPS 1. Editing Field Edit Completeness Legibility Comprehensibility Consistency Uniformity Central Office Edit 2. Coding Specifying
Draft 0-25 special educational needs (SEN) Code of Practice: young disabled people s views
 Code of Practice: young disabled people s views") Draft 0-25 special educational needs (SEN) Code of Practice: young disabled people s views Young people s consultation When I used to on have the my reviews at school they never used to tell me what was
Draft 0-25 special educational needs (SEN) Code of Practice: young disabled people s views Young people s consultation When I used to on have the my reviews at school they never used to tell me what was
Disclosure slide. We don t always know what someone is thinking. People always have perspectives. When listening is complicated
 When listening is complicated Disclosure slide Skills for honoring the individual perspectives of every person with disabilities Ruti Regan Anachnu www.anachnu.org @WeAnachnu @RutiRegan Nothing to disclose
This week s issue: UNIT Word Generation. conceive unethical benefit detect rationalize
 Word Generation This week s issue: We all know the story about George Washington s honesty. As a little boy George chopped down a cherry tree with his shiny new axe. When confronted by his father he immediately