THE STATE OF WORLD HAPPINESS
|
|
|
- Logan Hill
- 5 years ago
- Views:
Transcription
1 Part I. Chapter 2. THE STATE OF WORLD HAPPINESS JOHN F. HELLIWELL AND SHUN WANG 10 John F. Helliwell: Professor Emeritus of Economics, University of British Columbia and Arthur J.E. Child Foundation Fellow of the Canadian Institute for Advanced Research (CIFAR) Shun Wang: Assistant Professor, KDI School of Public Policy and Management
2 WORLD HAPPINESS REPORT Introduction This chapter presents and explains a range of happiness measures currently available in a comparable format for many countries. Some survey data cover almost all countries, and hence can be used to develop an overall picture of the state of world happiness in the first decade of the 21 st century. This accounting makes use of measures of subjective well-being, since they capture best how people rate the quality of their lives. Subjective well-being is the general expression used to cover a range of individual self-reports of moods and life assessments. The word happiness is often used in an equally general way, as in the title of this report. It does help to focus thinking, and attracts attention more quickly than does subjective well-being. But there is a risk of confusion. A bit of advance explanation may help to keep things clear. Among various measures of subjective well-being, the primary distinction to be made is between cognitive life evaluations (represented by questions asking how happy or satisfied people are with their lives as a whole), and emotional reports. Early modern attempts to classify different types of subjective well-being in psychology have also made a distinction between two types of emotional reports: positive affect (a range of positive emotions) and negative affect (a range of negative emotions). The primary distinction between life evaluations and emotional reports continues to be accepted today. It is also accepted, although less generally, that positive and negative affect carry different information, and need to be separately measured and analyzed. In this report we shall present all three types of measure. How does happiness come into this classification? For better or worse, it enters in three ways. It is sometimes used as a current emotional report- How happy are you now?, sometimes as a remembered emotion, as in How happy were you yesterday?, and very often as a form of life evaluation, as in How happy are you with your life as a whole these days? People answer these three types of happiness question differently, so it is important to keep track of what is being asked. The good news is that the answers differ in ways that suggest that people understand what they are being asked, and answer appropriately. Thus when people are asked about their happiness now or yesterday, the answers are closely correlated with current activities and events in their lives today or yesterday. By contrast, when people are asked how happy they are with their lives a whole these days, their answers match very closely the answers to other similar evaluations of life as a whole. We shall return later to more detailed discussions of the meaning and validity of different measures. The introduction above is intended to provide a springboard for our initial description of world happiness. The specific data we use are drawn from the Gallup World Poll (GWP), the World Values Survey (WVS), the European Values Survey (EVS), and the European Social Survey (ESS). We shall start by presenting data from the Gallup World Poll, since it provides far greater country coverage than is currently available from any other source. The Gallup World Poll contains measures of positive and negative affect (yesterday) as well as a life evaluation. We shall start with life evaluations, since they will be shown to depend much more on life circumstances, to have larger and more stable international differences, and to be more readily and systematically explained. We shall then consider the levels and uses of affect measures, and compare affect measures and life evaluations from other surveys covering fewer countries. Happiness Across the World In the Gallup World Poll respondents are asked (using fresh annual samples of 1,000 respondents aged 15 or over in each of more than 150 countries) to evaluate the quality of their lives on an 11-point ladder scale running from 0 to 10, with the bottom rung of the ladder (0) being the worst possible life for them and 10 being the best possible. We begin with this ladder measure, which we sometimes refer to as the Cantril ladder, because it currently covers the widest span of countries. Figure 2.1 gathers together the responses from all available Gallup World Polls, from 2005 through mid-2011, and weights them by each country s population aged 15 and up to show the state of world happiness. There are 11 columns in the figure, one for each possible answer to 11
3 the question. The total height of each bar represents the number of people in the world, aged 15 and over (the population being surveyed), who give that score for their evaluation of life today. Because of the large number of countries covered, Figure 2.1 provides the broadest measure of the level and distribution of world happiness in the second half of the first decade of the 21 st century. What do the data show? Over one-fourth of the world s population give answers of 5, which is exactly the mid-point of the range of possibilities. In every country there are life evaluations covering the whole range of possible answers, from 0 to 10. The differences within each country reflect differing life circumstances and personalities, and perhaps whatever else was in the respondents minds when the question was asked. It has even been argued by some that individuals have their own personal set points for their happiness, as determined by their personalities. In this view, while good or bad experiences might push people away from their set points, they eventually adapt to the new circumstances, and revert to their set point. If this were generally true, the world distribution of happiness answers in Figure 2.1 could tell us little about the economic and social circumstances of people s lives. It would reflect instead the distribution of more and less happy personality types. On the contrary, Figure 2.2 presents the distributions of answers in each of nine country groupings to show that life evaluations reflect much more than individual personality differences. Average life evaluations differ a great deal from continent to continent, as shown in Figure 2.2, and even more from the top to the bottom of the country rankings, as shown in Figure 2.3. There are very large differences in average life evaluations across world regions, with a difference exceeding 3 points on the 11-point scale between a group of industrial countries and sub-saharan Africa. Even more striking is the ability of just a few differences in average life circumstances, including per capita incomes, healthy life expectancy, having friends to count on in times of need, having a sense of freedom to make life choices, and absence of corruption to explain almost all (more than 95%) of these inter-regional differences. Happiness, like income, is unequally distributed within and among nations. As is shown in Table 2.1, however, the variation of happiness across the world s population is largely within countries, while this is much less so for incomes. Thus 42% of the worldwide variation in log of household incomes is between countries, much higher than the corresponding percentages for subjective well-being, which are 22% for the Gallup World Poll ladder and 7% for happiness yesterday. The primary reason for the difference is that income is but one of the supports for happiness, and most of the other supports are much more evenly spread across countries. However, some of the economically poorest regions and countries also have lower trust and weaker social relations, both of which have strong links to happiness. Also apparent from Figures 2.1 and 2.2 is that in every region there is a broad range of life evaluations. To some extent these simply reflect different personality types. But to a much greater extent they reflect different circumstances of life, and predict different future life courses, within the same neighborhoods and nations. Happiness Averages by Country 12 The several panels of Figure 2.3 show ranked ladder averages by country, with horizontal lines showing the 95% confidence bands. Data from several years are combined, so that the sample size is several thousand for most countries. This large sample size, coupled with the fact that the year-to-year changes in happiness averages are small relative to the inter-country differences, means that it is possible to establish many significant inter-country differences. Because of the variety of national experiences, the range of national happiness averages is even greater than for groups of countries. The top four countries (all in Northern Europe) in Figure 2.3 have life evaluations averaging 7.6, compared to 3.4 in the bottom four (all in sub-saharan Africa). As described in more detail in Chapter 3,
4 WORLD HAPPINESS REPORT about 80% of these inter-country differences can be attributed to the same few variables measuring the material, social and institutional supports for a good life. All of these supports are stronger in the high-ranking countries. Comparing the top four to the bottom four countries, average incomes are 40 times higher, healthy life expectancy is 28 years greater, people are much more likely to have someone to call on in times of trouble (95% vs. 48%), to have a sense of freedom (94% vs. 63%), and are less likely to perceive widespread corruption in business and government (33% vs. 85%). Returning to the question of the distribution of subjective well-being within countries, the panels of Figure 2.4 show the standard deviations of each country s distribution of life evaluations. The countries are listed in the same order as in Figure 2.3, so as to illustrate the great extent to which inequality of well-being differs among countries. If the degree of within-country inequality in the distribution of happiness were the same in each country (as measured by the coefficient of variation) then the standard deviations in Figure 2.4 would follow the same gradual downward slope displayed by the Figure 2.3 country rankings of average life evaluations. Figure 2.4 shows that this is far from reality. In general, there is no significant cross-country correlation between country means and standard deviations for the global sample of countries. However, among the OECD countries the correlation between county means and standard deviations is significantly negative, while for the rest of the world the correlation is on average positive. Among those countries with high average scores, some have quite high degrees of equality in the distribution of happiness (e.g. Denmark and the Netherlands), while in some other fairly high-ranking countries (e.g. Costa Rica and the United States) there is much more dispersion, and a higher proportion of the population has low life satisfaction. The OECD has recently reported a growing inequality of income in almost all OECD countries over the past 20-odd years. There are not yet sufficiently large and long samples of happiness data, and of social support data, to see whether this growing inequality of income has been matched by growing inequality of happiness and its non-income drivers. Comparing Different Measures After starting with the ladder, since it is the data set with the best international coverage, we now turn to illustrate the differences between the ladder, life satisfaction, overall happiness, and measures of positive and negative affect. If all of these measures were collected from the same respondents, in the same surveys, in comparable ways, then it would be relatively easy to see how they differ, both in average values and in the stories they tell about why some lives are happier than others. But most surveys only ask one or two subjective well-being questions, so it is instead necessary to proceed in stages, using a number of pair-wise comparisons. But first some further distinctions need to be made between different ways of getting individuals to report on their well-being. A first distinction is between experienced and remembered well-being. Experienced well-being depends on moment-by-moment reports, usually of pleasure or pain, and remembered well-being is reported subsequently, and is hence based on memory. A second distinction relates to the time span of the emotion or event being experienced or remembered. For experienced well-being, the time span is momentary, but for remembered well-being, the report can relate to a past moment (how did you feel when something happened, or at noon), to the average for any particular event or time period, whether yesterday, last week, your last holiday, your just-finished colonoscopy, or to your life as a whole these days. A third distinction is between evaluations and emotional reports. An evaluation is inherently a judgment about something, while an emotional report is more simply the description of an emotional state. 13 All three of these distinctions are potentially important. The reference to colonoscopies was deliberate. In a well-known study, colonoscopy patients were asked to report their moment-by-moment pain levels, and were later asked for a retrospective evaluation using the same scale. There was a systematic difference between the average of momentary assessments and the retrospective evaluations, with the latter closely tracking the average of the peak and final momentary pain levels. If these two reporting forms give different answers, then which should be taken to represent the true pain level? Some have argued that the true total pain is the sum of the momentary assessments, and that therefore the retrospective reports are mistaken. Others have argued
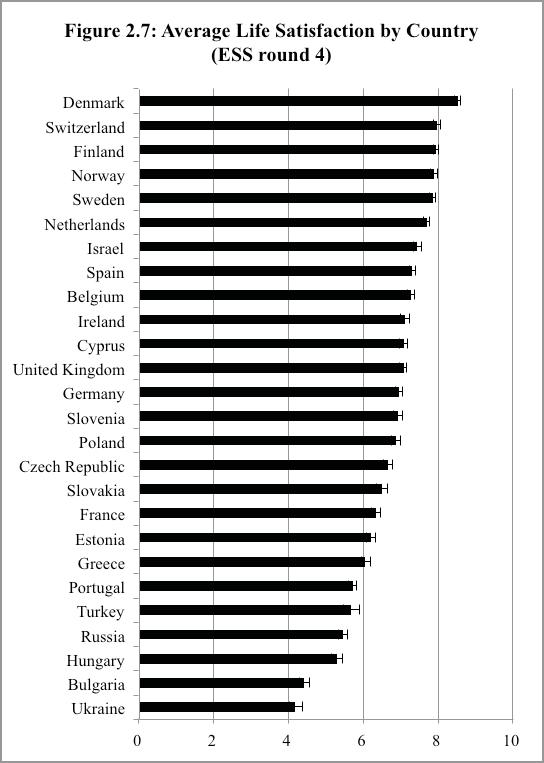
5 that the ability to frame experiences into summary memories that help to inform future judgments is an essential rather than a mistaken part of human nature. And when future decisions are made about having colonoscopies, choosing where to go on spring break, or deciding to have another child, it is retrospective evaluations that govern decisions. But most agree that the remembering self and the experiencing self must both be considered, because their interests do not always coincide. This distinction does not impinge directly on this current analysis of world happiness measures, since all of the affect reports currently available are of remembered rather than experienced affect. This includes all of the Gallup World Poll affect measures presented here, which refer to memories of emotions on the previous day. The second and third distinctions, relating to the time span covered by the question, and whether the question invites an evaluation of life or an emotional report, both remain important for our discussions here. As already noted, the Gallup affect measures all relate to yesterday. Most life assessments are explicitly evaluative, asking respondents to think of their lives as a whole, often nowadays, or alternatively at some past or future time. Thus the three separate Cantril ladder questions in the Gallup World Poll ask respondents to evaluate their lives at the present time, five years ago and five years in the future. The data in this report are all based on answers to the at the present time question. The life satisfaction question in the European Social Survey asks All things considered, how satisfied are you with your life as a whole nowadays? (on a 0 to 10 scale). The World Values Survey asks almost the same life satisfaction question, except that it uses these days instead of nowadays, and the response scale runs from 1 to 10. Happiness measures sometimes relate to a specific moment or day, in which case it is appropriate to regard them as reports of affect. This is the case with the positive affect question now being used widely by the U.K. Office for National Statistics (ONS), which asks Overall, how happy were you yesterday?. By contrast, the happiness question in the European Social Survey, and that asked in the World Values Survey, are both evaluative in nature, and broader in their time coverage. For example, the European Social Survey asks Taking all things together, how happy would you say you are? (on a scale of 0 to 10), while the World Values Survey asks Taking all things together, would you say you are: Very happy, Quite happy, Not very happy, or Not at all happy?. How do the various evaluation measures compare? Figure 2.5 shows the country-by-country rankings for life satisfaction based on the Gallup World Poll and Figure 2.6 shows them for the combined World Values Survey/European Values Survey. These rankings are very similar to those shown for the ladder in Figure 2.3. If the Figure 2.5 country rankings for life satisfaction are compared with those for the Gallup ladder responses asked of the same respondents, and in the same survey, the correlation is very high (r=0.94). Analysis of the resulting data show that while there were significant differences in average scores, with the mean of life satisfaction being higher by about 0.5 on the 11-point scale, the two variables are explained by the same factors, including the same effects of income. 14 What about comparisons between the answers from life evaluations based on happiness and those based on satisfaction with life? This is best answered using data from the European Social Survey, which asks happiness and life satisfaction questions in similarly evaluative ways, and on the same scales, for large samples of respondents in 29 countries. Figures 2.7 and 2.8 show the country averages for life satisfaction and happiness, respectively. Although the means of the two series differ significantly, with life satisfaction generally being rated higher by 0.4 points on the 11-point scale, tests of explanatory equations show that the same variables explain happiness and life satisfaction, with generally similar coefficients, including the effects of income. In addition, the ESS country rankings for happiness and life satisfaction are almost identical (r=0.987). Thus when happiness is asked about in a life-evaluative mode, the answers have the same structures across individuals and countries as do the answers to life satisfaction questions. Indeed, these structures are so similar that taking an average of the life satisfaction and happiness answers for each respondent gives a combined evaluation of life that is explained significantly more accurately than is either on its own. The same is true for life satisfaction and ladder responses in the Gallup World Poll.
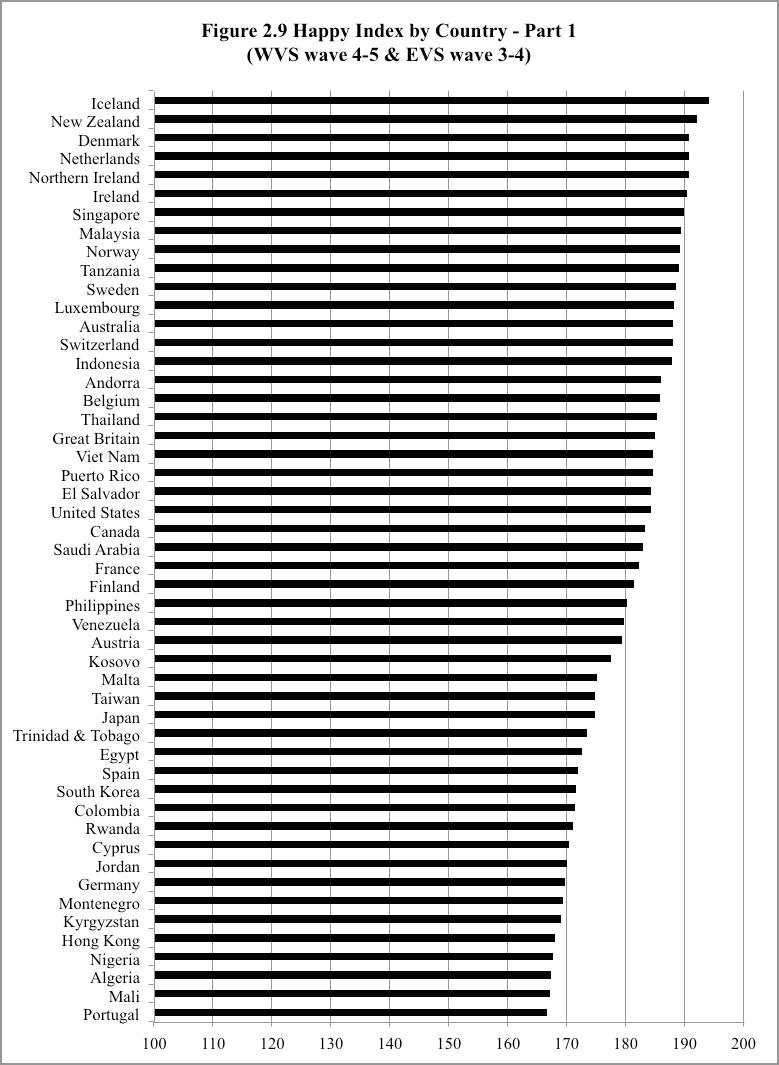
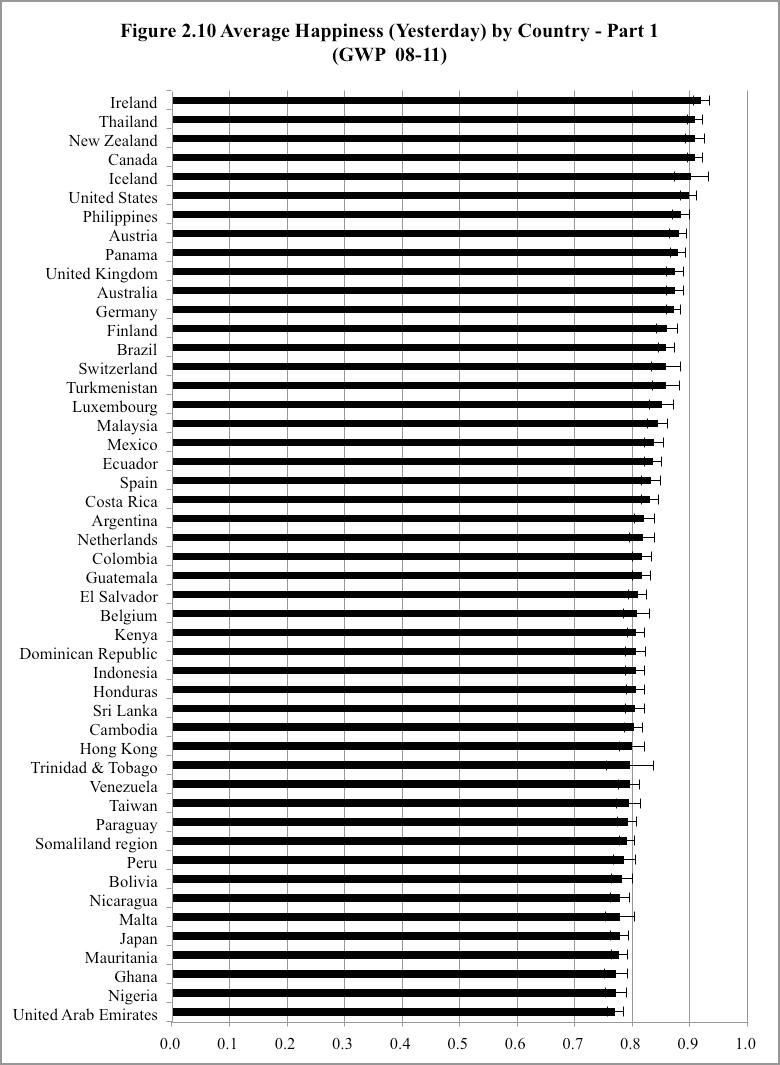
6 WORLD HAPPINESS REPORT Bhutan has not yet been included in the Gallup World Poll, but has used the European Social Survey happiness question in its recent large (n=7,000) national survey, so that Bhutanese average happiness, equal to 6.05 on the 0 to 10 scale, can be compared with that in the ESS countries. This is lower than the 7.01 average in the latest ESS survey, but higher than in Russia, Ukraine and Bulgaria, significantly so in the latter two cases. Compared to Bhutan s near neighbors, less precise calculations rank Bhutanese happiness levels slightly above those in India, and significantly above those in Nepal, China and Bangladesh. The bottom line of our comparisons among life evaluations is that when life satisfaction, happiness and ladder questions are asked about life as a whole, they tell very similar stories about the likely sources of a good life. The information base for these comparisons is still growing, however, so there may be some systematic differences that appear in larger samples. But when happiness is seen as an emotional report, and measured at a point in time, then it looks very like other measures of positive affect. Thus happiness yesterday measured on a 0 to 10 scale as a positive affect measure (as currently being asked by the ONS in the U.K.) has very different properties from life satisfaction, asked on the same scale of the same respondents. The affect measure of happiness is much less correlated with major life circumstances than are the life satisfaction answers, and the effects of income are much smaller, and often statistically insignificant. This is similar to what was found when the Gallup ladder answers were compared to the Gallup yesterday affect answers. The ONS and Gallup data both show that life evaluations are much more closely related to life circumstances than are affect measures, and that positive affect is more easily explained by life circumstances than is negative affect. Figure 2.9 shows country rankings based on the 4-point evaluative happiness answers in the combined World Values Survey/European Values Survey, while Figure 2.10 shows rankings, for a much larger number of countries, of the average Gallup World Poll answers to a question asking about the respondent s happiness yesterday (using a yes/no 2-point response scale). We would not expect these country rankings to be very similar, and they are indeed much less correlated than were the ESS happiness and life satisfaction rankings. The reasons for difference relate to answer scales (binary for the Gallup happiness vs. a 4-point scale for the WVS/EVS happiness question), to the difference between yesterday and some longer period, and to the related and more fundamental distinction between evaluations and emotional reports. Although short-term emotional reports carry much less information about life circumstances than do life evaluations, they are very useful at revealing the nature and possible causes of changes in moods on an hourby-hour or day-by-day basis. They are hence of most use when asked in the context of time-use surveys that provide scope for explaining these short-term changes. How do international differences in measures of affect compare with those for the more cognitive life evaluations? Figure 2.11 shows Gallup World Poll country rankings for positive affect (the average of yes/no answers on the frequency yesterday of enjoyment, happiness and laughter). Figure 2.12 does the same for negative affect (averages for worry, sadness, anger and depression), and Figure 2.13 shows net affect (positive affect minus negative affect). We should expect that proportionate differences between average country scores would be larger for life evaluations than for affect, because the effects of income are relatively larger for the evaluative measures, and the international differences in income are much greater than those for the non-economic supports for a better life. This is consistent with the results in Figures 2.11 to 2.13, which show some interesting differences in country rankings both between evaluations and affect, and between positive and negative affect. In all parts of the world, the frequency of positive affect is two to three times greater than for negative affect. The countries of Latin America and the Caribbean have higher than average rankings for the ladder and for positive affect, to a slightly greater extent for the latter. 15
7 To summarize, life evaluations, whether they are general questions about life satisfaction, the ladder question in the Gallup World Poll, or overall happiness questions of the sort used in the European Social Survey, all give similar answers about the relative importance of the economic and social supports for a good life. When overall happiness and life satisfaction questions are asked on the same scales, and of the same respondents, the answers have very similar distribution, as shown in the two panels of Figure Although the mean of the ESS happiness answers is 0.4 larger than for SWL, the two measures are very highly correlated at both the individual (r=0.67) and national (r=0.96) levels, are explained in the same way by the same variables, and are usefully averaged to produce even more robust life evaluations. Measures of positive and negative affect contain much less that differs from one community or country to another (as shown in Table 2.1), but if collected in suitable ways can unravel important aspects of life as it is actually experienced. Table 2.1 Inter-Country Shares of Total Variance Data Source Well-Being Measures Inter-Country Share of Total Variance GWP Cantril Ladder (life evaluation) GWP Life Satisfaction (life evaluation) GWP Happiness (yesterday) GWP Positive Affect (yesterday) GWP Negative Affect (yesterday) GWP Net Affect (yesterday) GWP Log of Income ESS round 4 Life Satisfaction (life evaluation) ESS round 4 Happiness (life evaluation) ESS round 4 Log of Income WVS 3-5 Life Satisfaction (life evaluation) WVS 3-5 Happiness (four point scale) Notes: (1) To construct numerical income from the categorical income class in ESS round 4, we use midpoints for non-top income categories and 1.5*(bottom boundary) for the top income category. Household income in local currency units in ESS round 4 is converted to international dollars by multiplying by the PPP conversion factor from WDI (2011). Note that the PPP conversion ratio for Slovakia is for euro and international dollar, however, the household income is measured by Slovak crown in the survey. Household income for Slovak respondents is then divided by , the official exchange rate between Slovak crown and euro, before applying the PPP conversion factor. (2) WVS 3-5 refers to the WVS round 3-5 and EVS round Happiness has been shown to play a double role, sometimes appearing as an emotional report and at other times in an evaluative role. Life satisfaction and other life evaluations, by contrast, always relate to life as a whole, and show much less short-term variation but much more linkage to life circumstances. Having presented a range of measures of subjective well-being, we turn now to consider the extent to which they can provide valid and policy-relevant guides to the quality of life. Making the Case for Measuring Subjective Well-Being Although almost 40 years have passed since Richard Easterlin advocated using measures of happiness to assess the quality of people s lives, systematic collection and use of subjective well-being data at the population level have been slow to follow. In the meantime, several decades of research, mainly in psychology, have dug
8 WORLD HAPPINESS REPORT deeper into the meaning, reliability, and validity of various measures of subjective well-being. The results of this research strongly support wider collection and use of subjective well-being data. Why has it taken so long for subjective well-being to become more widely and routinely measured as part of the statistical base for public information and decision-making? One reason is that in the absence of some crisis in existing ways of collecting and using information, people tend to simply and often unconsciously apply and use information and decision rules that have served them well in the past. It took many decades to establish national systems of accounts for income and expenditure, and even then the developments were often driven by the imperatives of wars or depressions, and the meaning and uses of the data were frequently contested. Hence it should be no surprise that it has taken many years to raise baseline awareness to the point where widespread official and private collection of subjective well-being data is starting to happen. Nor should it be surprising that there are many skeptical questions posed about what the data mean and whether they are useful. Here are some of the questions that have been asked, and how they have been answered: Are subjective well-being measures reliable? Within psychology, reliability is gauged by the extent to which the same questions yield identical answers when administered in the same conditions. The replicability of subjective well-being measures has been tested in a variety of ways, all of which combine to produce a reassuring picture. For example, life evaluations asked of the same person in a sequence of surveys start high, and become less correlated as the intervening time grows. This is just what should be expected, since underlying circumstances are more likely to have changed over the longer period. Furthermore, multi-item measures average over random errors, and hence produce higher reliability measures at the individual level. At the group or national level, reliability is very high, since individual-level random variations and personality differences are averaged away, while the underlying year-to-year changes in average life circumstances are relatively modest. Hence the year-to-year correlations of country rankings of the ladder in the Gallup World Poll are very high, averaging between 0.88 and Similarly the wave-to-wave country-ranking correlations of both happiness and life satisfaction in the European Social Survey are between 0.92 and These correlations gradually drop, as they ought to do, when the comparison dates become further apart. Are subjective well-being answers valid? There are three quite different ways of judging the validity of happiness measures. The first is to see to what extent they are plausibly explained in terms of life circumstances and other candidate variables. The second is to assess the extent to which they are correlated with other subjective and objective measures of well-being. The third is to see how and whether the measures predict subsequent outcomes and behavior. As will be shown in the next chapter, more than three-quarters of the cross-country differences in national average measures of happiness can be explained by variables already known through experimental and other evidence to be important. The fact that different measures of subjective well-being are explained by different patterns of other variables represents a strength rather than a weakness, because in general the differential patterns take exactly the form they should if the measures are valid. For example, Maslow s theory of the hierarchy of needs would suggest that the relative importance of income and social factors might differ between richer and poorer countries. Research using data from the Gallup World Poll shows country differences of just this sort. Although both social and economic conditions are important supports for life evaluations in all countries, the relative importance of the social factors is higher in OECD countries. 17 Second, subjective measures of well-being have been correlated with a variety of objective measures including facial expressions, brain-wave patterns and cortisol measures at the individual level, and community and national suicide patterns. Some have regarded these correlations as a necessary pre-requisite to taking subjective measures more seriously. But why should this be necessary? In the case of happiness the subjective measure
9 itself is primary, with the coincidental movements of physical measures being reassuring but of less consequence. Indeed, certain patterns of electrical activity in the brain became established as measures of happiness because they tended to be present when people reported themselves to be happy. Clearly what matters are the subjective experiences, and not any associated electrical patterns. Nonetheless, the correlations are reassuring to those who are concerned about interpersonal and intercultural differences in how people use words and scales when making their reports. The ability of measures of subjective well-being to predict subsequent events and behavior is relevant for two main reasons. First, predictive power is a straight forward test of validity. The ability of life evaluations in large populations to predict subsequent suicide frequencies provides strong evidence that life evaluations are important to behavior. The same point can be made for the ability of measures of positive affect to predict a variety of good outcomes especially including health and mortality. Second, the fact that happiness measures are predictive of sickness and death feeds back to strengthen the case for collecting measures of happiness as a regular part of health maintenance and the delivery of health care. How sensitive are results to question wording and placement? A well-known study hypothesized, following influential philosophical work on the logic of conversation, that if a general question follows a related specific one the answer to the specific question will help set the context for the general question, and will hence be likely to influence the answer to it. Thus the researchers presumed, and found, that when students in Illinois were asked about how happy they were with their recent dating experiences and how happy they were with their lives as a whole, the answers were more closely correlated when the dating question was asked before the general question. But when the two questions were presented as relating to one another, the ordering effect shrank to insignificance. The first part of the result has been used by some to question the reliability of subjective assessments, but the two parts seen together might equally well be seen to show that respondents are adept at seeing the conversational context and giving answers that are most useful when seen in that context. Two other results help to show that respondents are generally able to understand the questions asked, and to give the answers requested. The first relates to subjective health evaluations. Many surveys ask respondents, on a 5-point scale, to report the state of their physical health, with 0 being very poor and 5 being very good. The answers to this question always show a significant decline as age increases. The designers of one large Canadian survey, trying to be more precise, used the same response scale but asked respondents to compare the state of their health with that of others of the same age. The answers showed no age trend at all. This suggests strongly that respondents are able to assess the states of their own health, and to make, if asked, appropriate comparisons with the age-adjusted states of health of others living in the same community. The second example comes from the Gallup Daily Poll which reveals strong day-of-week effects for affect questions that apply specifically to yesterday, but no daily patterns in life evaluations. 18 There has also been a substantial literature testing and assessing order effects, with one meta-analysis of 16 studies showing small effects. But they can be dramatically large, as recently found in the Gallup-Healthways U.S. Daily Poll. Split samples showed that respondents asked about their attitudes to government (which were very negative at the time) immediately before the ladder question gave significantly lower answers (by almost 5%), than when the political questions were absent, or were separated from the ladder question by some less upsetting buffer questions. This effect is very large relative to the modest changes in national average happiness that would normally happen from day to day or year to year, even during a major recession. These results are very useful in underlining three points already implicit in the data we have presented. First, the day-to-day and year-to-year changes in national average subjective well-being are likely to be very small relative to the differences across individuals, communities and nations. Second, as will be shown in more
10 WORLD HAPPINESS REPORT detail in Chapter 3, although incomes are important supports for life evaluations, their effects are relatively small compared to other factors, especially in terms of national average changes from one year to the next. Third, shared changes in sentiment, whether triggered by question order or changes in the stock market, can have large effects on average scores. The daily frequency of the Gallup-Healthways poll, and Gallup s use of split samples, made it easy to spot and correct the issue, and to convince others to test for question order and other framing effects. For all of these reasons, subjective well-being data are not suitable for use as guides to shortterm macroeconomic policy, where in any case there are many other more relevant data. Framing effects are important, but they exist for behavior as much as for survey answers. For example, experiments showed that student subjects showed some modest tendency (less than 7%, but nonetheless greater than the 5% noted in the previous paragraph) to mark in their own favor, but had no tendency to cheat if they had previously been asked to write down as many as they could remember of the Ten Commandments. All human behavior, whether evidenced by thought, opinions or action, is influenced by the social norms and contexts in which people live. This does not diminish the validity of subjective answers, but does show the need for careful and experimental data collection, and demonstrates the advantages of large and repeated samples. How can happiness be compared across individuals, nations, and cultures? Since the social and institutional contexts are such important supports for well-being, then we would expect to find that there will be corresponding differences in reported well-being across communities, nations and cultures. But what if there are cultural differences in response styles, so that people in different cultures might report different answers to the same question, even if in other respects their life quality is the same? If these differences in the interpretations of questions, or in the use and meaning of response scales, were very large, they might affect subsequent judgments about where and why subjective well-being is higher. More generally, it has been argued that for a broad range of psychological findings, conclusions are based on experiments undertaken using WEIRD subjects (those from Western, Educated, Industrialized, Rich Democracies), and do not represent well what happens in the much larger populations in other countries and cultures. For both of these reasons, it is important to assemble data from different cultures and nations in ways that permit researchers to make judgments about the likely extent of difficulties in making comparisons in happiness. One basic check, once comparable data are assembled, is to see to what extent the answers drawn from different nations and cultures appear to be influenced by the same factors, and to the same extent. As it turns out, the cross-national commonality of the correlates of life evaluations is substantial. How much do aspirations and standards change? Endowment effects, changing aspirations, adaptation, and relativities pose complications rather than roadblocks to the use of happiness data as measures of the quality of life. Life on earth has, at least on average, become much less brutish, nasty and short over the past 500 years. The evidence for this ranges from falling murder rates to rising life expectancies. There are no long-standing happiness measures available to track these life improvements, but it would be no surprise if individual and community-level aspirations and standards have risen over the same centuries, even if at a lower rate. The empirical basis for adaptation and relativities will be discussed in the next chapter. Our summary view of the available research is that adaptation and relativities can truncate the average happiness increases that accompany human progress, that some comparison effects are helpful and others harmful to average happiness, and that happiness tells a valid story both across communities and over time. 19 Is there a happiness set point? It is sometimes argued that human capacities for adaptation are so strong that even major changes in life circumstances will have no lasting impact on subjective well-being. The most cited reference to this effect is
11 a study of subjective well-being among accident victims and lottery winners. However, even based on the small number of cases analyzed in that paper, accident victims were significantly less happy than the control group. Subsequent research has consistently confirmed that individuals with long-term disabilities have lower subjective well-being, to an extent that varies with the severity of the disability. As might be expected from other research reported in Chapter 3, the extent to which a disability affects subsequent well-being depends not just on the severity of the disability, but also on the extent to which patients are enabled to maintain their social connections. If each individual had his or her own set point based on stable personality traits, and eventually returned to that point after any change in circumstances, there could not be such large and long-lasting international differences in subjective well-being as are shown in this chapter. For example, average life evaluations in the top 10 countries of Figure 2.3 are twice as high as in the bottom 10 countries, and these differences are largely explained, as shown in Chapter 3, by measured differences in life circumstances. Nor would there be such a systematic U-shape in happiness over the life course for each individual, as shown in Chapter 3. Studies of identical and fraternal twins have also been used to estimate the extent to which happiness depends on genetically based personality differences rather than differing circumstances. For example, studies of U.S. twins have estimated that one-third to one-half of within-country variance of happiness can be explained by genetic differences between individuals. At the global level, the genetically based share of life satisfaction differences will of course be much smaller, since life circumstances differ much more among people around the globe than among people living in the same country. Finally, if most inter-personal happiness differences were personality-driven, and if judgments returned to set point levels after a period of adaptation, then there could be no sustained trend differences in the relative happiness of different groups within larger populations. But data from a series of Canadian General Social Surveys spanning almost 25 years reveals that residents of Québec, especially those who are francophone, have had, in the decades following Québec s Quiet Revolution, steadily growing life satisfaction compared to residents of the rest of Canada. The accumulated trend difference is both large and statistically very significant, equivalent in life satisfaction terms to more than a doubling of household incomes. This finding shows that life satisfaction captures much more than temporary departures from personality-driven set points, and also that social changes can cause sustained trends in well-being far beyond those explicable by conventional economic measures. Is happiness serious enough to be taken seriously? In most of the social, political, caring and policy sciences, the focus of attention is on eradication of disease, crime, poverty and war. In a world where there is still so much hardship left, is it an unearned luxury to be concerned with measuring and building happiness? The case for taking happiness seriously, even in a world still marked by evils of many types, is based on a belief, increasingly supported by evidence, that it provides a broader range of possible ways to build a better world, including more effective solutions for poverty, illness and war. Happiness research is sometimes seen as having a giggle factor, too frivolous for serious study. It has taken a long time to build convincing evidence that the measurement and maintenance of positive states of mind can suggest new routes to longer and healthier lives, above and beyond conventional medical care, but the case has now been made. 20 Another related issue, with deep philosophical roots, is the contrast between the hedonistic life, spent in the pursuit of pleasure, and the eudaimonistic life, aimed at achieving excellence. This distinction is captured in modern psychology as the difference between hedonic and eudaimonic well-being, where the hedonic approach has a focus on positive emotions and the eudaimonic approach emphasizes flourishing, meaning and purpose. Does this distinction support the skeptical view of happiness as too frivolous? Does happiness unduly emphasize current pleasures and ignore the deeper and more fundamental aspects of life? These questions hark back to the distinction we have made between emotional reports and life evaluations. Whether framed as questions about happiness or life satisfaction, life evaluations appear to take pleasures and purpose
12 WORLD HAPPINESS REPORT both into account, just as Aristotle suggested they should and would. This is somewhat less so for short-term emotional reports, including those on happiness. This difference can be illustrated by the first data available from the 2011 U.K. ONS well-being surveys. Four questions are asked. One asks about life satisfaction, one asks about the respondent s sense of life purpose (a eudaimonic question), and two relate to emotions yesterday: one about happiness and the other about anxiety. The results show that the eudaimonic answers are correlated with both emotional measures, but more closely to life satisfaction than to either emotion. Even emotional reports are likely to depend on more than current pleasures. Life evaluations, whether based on happiness, life satisfaction, or the Cantril ladder, are well placed to attach an even greater weight to the deeper features of a good life. Happiness measures are part of a larger effort to understand well-being Although there is always intrinsic interest in finding out how happy people are, such measures will be of little help unless they can be combined with sufficient other information to build an understanding of what makes for better lives. Thus many national and international efforts to measure and promote happiness have been set within broader frameworks involving the measurement and reporting of other variables that have themselves been used as indicators or supports for well-being. The Bhutanese case study shows how measures of happiness are part of a larger Gross National Happiness framework that monitors many variables that have been found to contribute to a higher quality of individual and community life. Similarly, the OECD s recent accounting for well-being in OECD countries includes many other variables. And in the United Kingdom, although most attention has been given to subjective well-being there is also recognition of the need to collect a much broader set of information relevant to the understanding and improvement of well-being. Within the broader framework of well-being measures, what is special about happiness and other indicators of subjective well-being? The distinctive feature of happiness and other subjective well-being measures is that they offer people the chance to report on the quality of their own lives, reflecting their own histories, personalities and preferences. These are arguably the most democratic of well-being measures, since they reflect not what experts or governments think should define a good life, but instead represent a direct personal judgment. Seen in this light, the subjectivity of happiness is to be seen as a strength rather than a weakness. The most fundamental indicator of your happiness is how happy YOU feel, not whether others see you smiling, your family thinks you are happy, or you have all the presumed material advantages of a good life. When pulled together for a neighborhood, community or nation, subjective well-being scores can thus be seen as directly democratic measures of the quality of individual and community life within that geographic zone. Other measures of well-being, and of the presumed supports for happy lives, can then provide the evidence required to explain why some lives, and some communities, are happier than others. Chapter 3 provides many examples of what can be discovered, and Chapter 4 shows how this information can be put to work to suggest, test and evaluate better ways of designing and delivering public and private services. Building a strong information base requires that subjective well-being measures be collected widely and frequently. Geographic detail is needed to better understand what features of community life are most supportive of well-being. To be of most use, assessments of happiness should be made within a wide variety of surveys already being conducted for other purposes, since such surveys will thereby automatically provide a range of descriptions of the social and economic contexts of people s lives. These in turn can support a more fine-grained assessment of what makes for happier communities. 21 Running surveys frequently, and spreading data collection over the whole year, is useful to help pinpoint and hence understand the sources of changes in happiness. Average happiness measures generally move slowly, and the changes over time are small relative to the range of happiness differences among cities and countries. This increases the value of frequent assessments, especially in geographic detail, as the frequency makes it easier to spot and understand trends as they develop. We turn now to consider in slightly more detail how different types of measures can best be collected and used.
13 Different measures for different purposes What can be learned by measuring and tracking happiness on different time scales? Time use surveys involving the diary-based daily reconstruction method or the pager-based experience sampling methods each have their own most appropriate uses. Experience sampling and diary methods, despite their differences, can be used in complementary ways to track happiness and its correlates in the context of daily life. This chapter has made a distinction between life evaluations (whether ladder, SWL or happiness) and emotional reports, including both positive and negative affect. Life evaluations, positive affect, and negative affect are ranked in that order in terms of what they tell us about the relative importance of different life circumstances, as will be shown in Chapter 3. But for analyzing the fabric of daily life, the priorities are reversed, with the most valuable information being provided by momentary and remembered emotions and reactions during the daily course of activities and events. What are the implications for future collection and use of happiness data? What sorts of happiness data are needed to support better institutions and policy choices? How can the results of well-being research be used to design and deliver better policies? We outline a few possibilities here, to set the stage for fuller consideration in Chapter 4. First, regular large-scale collection of happiness data in the context of a variety of existing surveys will permit the establishment of baseline values and trend changes for subjective well-being within and across nations and communities. This will permit the well-being consequences of subsequent events and policy changes to be better assessed. It is critically important, if happiness data are to be able to support the uses described below, that there should be information available also about the key variables likely to support better lives. It is also necessary to know where respondents live, to permit measurement and explanation of happiness differences among neighborhoods, cities, and demographic groups. Second, analysis of these data in their broader economic and social contexts will permit more comprehensive estimation of the relative importance of different factors supporting happiness. This will in turn allow conventional benefit/cost analysis to be changed to attach specific values to many features of life, and especially the social context. Thus it becomes possible to lift important non-market variables from the footnotes to the center of benefit/cost analysis. Third, the resulting research can have implications for macroeconomic policies by improving the information used to assess the relative importance of different macroeconomic objectives, as well as to alter how such policies are designed and delivered. Fourth, well-being results can be used to suggest alternative ways of designing and delivering public services ranging from elder care and community services to prisons. 22 In all of these cases, subjective well-being measures are needed. First, it is necessary to build the broad base of information to establish baseline levels and to enable more solid research. Second, the research gives rise to a range of policy possibilities that need to be assessed in experimental and field trial conditions, in each case supported by monitoring the well-being consequences for those involved in designing, delivering and receiving public and private services.
14 WORLD HAPPINESS REPORT 1. In preparing and revising this chapter, we have benefited from the kind advice of Rafael Di Tella, Paul Dolan, Richard Easterlin, Nicole Fortin, Bruno Frey, Dan Gilbert, Carol Graham, Stephen Hicks, Haifang Huang, Ron Inglehart, Daniel Kahneman, Richard Layard, Richard Lucas, Conal Smith, Neil Thin, Chris Barrington-Leigh, and Dan Weijers. This research was supported by R01AG from the US National Institute on Aging. 2. Kahneman, Diener & Schwarz, eds, (1999). 3. e.g. Andrews & Withey (1976), Diener (1984). 4. Cohen et al. (2003), Lyubomirsky et al. (2005), Schimmack (2003), Wiest et al. (2011). 5. Russell & Carroll (1999). 6. This is shown by the similarity between the European Social Survey happiness and life satisfaction data in Figures 2.7 and 2.8, and between life satisfaction and the Cantril ladder in the Gallup World Poll, in Diener et al., eds. (2010) Table Cantril (1965) introduced the ladder as a self-anchoring striving scale. 8. See, for example, De Neve et al. (2011). 9. OECD (2011b). 10. Redelmeier & Kahneman (1996). 11. Kahneman et al. (1997) took this Benthamite view. 12. E.g. Helliwell (2008) and Helliwell & Barrington-Leigh (2010). 13. Wirtz et al. (2003). 14. Kahneman (2011), p Dolan et al. (2011). 16. Helliwell et al. (2010) Table Helliwell et al. (2010) Table The comparisons with neighboring countries are indirect because the satisfaction with life answers of the Gallup World Poll need to be compared to the happiness answers in Bhutan. Both are asked using the same 0 to 10 scale, and comparisons are implemented using averages from ESS answers to the same two questions. In the ESS, life satisfaction answers are on average 0.40 points lower than those for happiness. The Bhutanese happiness average of 6.05 is thus converted to a 5.65 SWL-equivalent value for comparison with the Gallup SWL averages of 5.51 for India, 5.32 for Nepal, 5.25 for Bangladesh and 5.24 for China. The Bhutan estimate is statistically significantly higher than for Nepal, Bangladesh and China. 19. Kahneman & Deaton (2010). 20. Krueger et al. (2009). 21. See the notes to Figures 2.11 to 2.13 for the exact questions asked. 22. Easterlin (1974). Empirical welfare functions based on happiness data were being estimated even earlier in Europe, e.g. van Praag (1971). 23. For surveys and examples, see Stiglitz et al. (2009), Diener et al. (2009), Krueger et al. (2009), and Layard (2010). 24. Bilali et al. (2008). 25. Nickerson (1998). 26. Diener (2011), Diener et al. (2009). 27. e.g. r=0.56 in one year, falling to 0.24 over sixteen years, Fujita and Diener (2005). 28. Maslow (1943). 29. For the distributions of country coefficients, see Figure 10.3 of Diener et al., eds, (2010). For the difference between OECD and non- OECD coefficients, see Figure 1 of Helliwell & Barrington-Leigh (2010). 30. Gilbert (2006), p For example, see Koivumaa-Honkanen et al. (2000). 32. Lyubomirsky et al. (2005) Cohen & Pressman (2006). 34. See Danner et al. (2001), Chida & Steptoe (2008), and Diener & Chan (2011). 35. Strack, Martin & Schwarz (1988). 36. Grice (1975). 37. As argued by Grice (1975). 38. Helliwell & Wang (2011b).
15 39. Schimmack & Oishi (2005). 40. See Deaton (2011) and Agrawal & Harter (2011). 41. Mazar et al. (2008), experiment Oishi (2010). 43. Henrich et al. (2010). 44. As shown in Figure 10.3 of Diener et al., eds. (2010). 45. Brickman et al. (1978). 46. Lucas (2007). 47. Haslam et al. (2008). 48. See for example Lykken (1999) and De Neve et al. (2011). This share includes the role of any environmental factors that may be correlated with the genetic differences. De Neve et al. (2011) also identify one of the candidate genes involved (the 5HTT). 49. Barrington-Leigh (2011). 50. For representative surveys of these results, see Steptoe et al. (2005) and Diener & Chan (2011). 51. For more on the philosophical underpinnings of happiness research, see Bok (2010), Kenny & Kenny (2006), Nussbaum & Sen, eds. (1999) and Graham (2011, chapter 2). 52. E.g. Ryan & Deci (2001). 53. The correlation between a sense of life purpose and satisfaction with life is r=0.67 (n=4200) compared to r=0.54 between purpose and happiness yesterday and r=-0.16 between life purpose and anxiety yesterday. 54. For a survey, see Møller et al., eds. (2008). 55. OECD (2011a). 56. Krueger et al. (2009). 57. Csikszentmihalyi & Larson (1987). 58. Kahneman (2011), Stone et al. (2002). 59. Krueger, ed. (2009). 60. For an experimental study showing how much results can differ when the social context is values using subjective well-being analysis, see Gyarmati et al. (2008). For a general review of methods for taking subjective well-being into account in benefit/cost analysis, see Fujiwara & Campbell (2011). 61. For examples, see Di Tella et al. (2001) and Di Tella & MacCulloch (2009). 62. As in the recent South Korean macroeconomic policies described in Helliwell (2011b). 63. Frey et al. (2004). 64. Haslam et al. (2010). 65. Halpern (2010), Bacon et al. (2010). 66. Leong (2010), Helliwell (2011a). 24
16 WORLD HAPPINESS REPORT 25
17 26
18 WORLD HAPPINESS REPORT 27
19 28
20 WORLD HAPPINESS REPORT 29
21 30
22 WORLD HAPPINESS REPORT 31
23 32
24 WORLD HAPPINESS REPORT 33
25 34
26 WORLD HAPPINESS REPORT 35
27 36
28 WORLD HAPPINESS REPORT 37
29 38
30 WORLD HAPPINESS REPORT 39
31 40

32 WORLD HAPPINESS REPORT 41
33 42
34 WORLD HAPPINESS REPORT 43
35 44
36 WORLD HAPPINESS REPORT 45
37 46
38 WORLD HAPPINESS REPORT 47
39 48

40 WORLD HAPPINESS REPORT 49
41 50
42 WORLD HAPPINESS REPORT 51
43 52
44 WORLD HAPPINESS REPORT 53
45 54
46 WORLD HAPPINESS REPORT 55
47 56
World Happiness 2013
 World Happiness REPORT 2013 Edited by John Helliwell, Richard Layard and Jeffrey Sachs World Happiness REPORT 2013 Edited by John Helliwell, Richard Layard and Jeffrey Sachs Table of Contents 1. Introduction
December 2014 Korea Development Institute 263, Namsejong-ro, Sejong-si , Korea. ISBN (93320) Price: 11,000
 Price: 11,000") December 2014 Korea Development Institute 263, Namsejong-ro, Sejong-si 339-007, Korea ISBN 978-89-8063-911-3 (93320) Price: 11,000 Subjective well-being has attracted more and more attention among researchers,
December 2014 Korea Development Institute 263, Namsejong-ro, Sejong-si 339-007, Korea ISBN 978-89-8063-911-3 (93320) Price: 11,000 Subjective well-being has attracted more and more attention among researchers,
A Blueprint for Exploring International Differences in Well-Being
 A Blueprint for Exploring International Differences in Well-Being A review of International Differences in Well-Being by Ed Diener, John Helliwell, and Daniel Kahneman (Eds.) New York, NY: Oxford University
ISC- GRADE XI HUMANITIES ( ) PSYCHOLOGY. Chapter 2- Methods of Psychology
 PSYCHOLOGY. Chapter 2- Methods of Psychology") ISC- GRADE XI HUMANITIES (2018-19) PSYCHOLOGY Chapter 2- Methods of Psychology OUTLINE OF THE CHAPTER (i) Scientific Methods in Psychology -observation, case study, surveys, psychological tests, experimentation
ISC- GRADE XI HUMANITIES (2018-19) PSYCHOLOGY Chapter 2- Methods of Psychology OUTLINE OF THE CHAPTER (i) Scientific Methods in Psychology -observation, case study, surveys, psychological tests, experimentation
Is Happiness Different From Flourishing? Cross-Country Evidence from the ESS
 Is Happiness Different From Flourishing? Cross-Country Evidence from the ESS Andrew E. Clark (Paris School of Economics and IZA) http://www.pse.ens.fr/clark/ ESRI Tokyo. November 30 th 2012. Economics
Happiness Measures as a Guide to Development Policy? Promises and Potential Pitfalls
 Happiness Measures as a Guide to Development Policy? Promises and Potential Pitfalls Presentation at the Annual ABCDE Conference Stockholm, Sweden June 2010 Carol Graham The Brookings Institution 1 What
John Helliwell, Richard Layard and Jeffrey Sachs World happiness report
 John Helliwell, Richard Layard and Jeffrey Sachs World happiness report Report Original citation: Helliwell, John and Layard, Richard and Sachs, Jeffrey (eds.) (2012) World happiness report. The Earth
The OECD Guidelines on Subjective Well-Being
 The OECD Guidelines on Subjective Well-Being Marco Mira d Ercole OECD Statistics Directorate Subjective Well-Being: Its Measurement and Use in Public Policies and Decision-Making in Mexico and Latin America,
Well-Being on Planet Earth
 Full text presented in this Bibliography of Happiness with permission of the author Psychological Topics 18 (2009), 2, 213-219 Original scientific article UDC 159.9.019.3 159.922.4 Well-Being on Planet
TABLE OF CONTENTS. John F. Helliwell, Richard Layard and Jeffrey D. Sachs. John F. Helliwell, Haifang Huang and Shun Wang
 WORLD HAPPINESS REPORT 2017 Editors: John Helliwell, Richard Layard, and Jeffrey Sachs Associate Editors: Jan-Emmanuel De Neve, Haifang Huang and Shun Wang TABLE OF CONTENTS 1. Overview 2 John F. Helliwell,
ORIGINS AND DISCUSSION OF EMERGENETICS RESEARCH
 ORIGINS AND DISCUSSION OF EMERGENETICS RESEARCH The following document provides background information on the research and development of the Emergenetics Profile instrument. Emergenetics Defined 1. Emergenetics
GAMBLING AND INDIVIDUALS WELLBEING:
 GAMBLING AND INDIVIDUALS WELLBEING: EVIDENCE FROM A LARGE-SCALE BRITISH SURVEY David Forrest International Symposium on Pathological Gambling Montevideo- September, 2014 THE RISE OF HAPPINESS STUDIES The
Wellbeing and communities Builth Wells 27 Feb 2018 Ingrid Abreu Scherer
 Wellbeing and communities Builth Wells 27 Feb 2018 Ingrid Abreu Scherer 1 Wellbeing and communities Contents The What Works Centre for Wellbeing What is (individual) wellbeing, how do we measure it, and
Income s Association with Judgments of Life Versus Feelings
 Income s Association with Judgments of Life Versus Feelings Ed Diener University of Illinois Daniel Kahneman Princeton University William Tov Singapore Management University Raksha Arora The Gallup Organization
Nonjudgmentally and Cognitive Therapy
 Nonjudgmentally and Cognitive Therapy See, but don t evaluate. Take a nonjudgmental stance. Just the facts. Focus on the what, not the good or bad, the terrible or wonderful, the should or should not.
Emotional Intelligence and NLP for better project people Lysa
 Emotional Intelligence and NLP for better project people Lysa Morrison @lysam8 Copyright 2015 Lysa Morrison Reasons projects fail Three of the most common causes of project failure according to the National
Human Capital and Economic Opportunity: A Global Working Group. Working Paper Series. Working Paper No.
 Human Capital and Economic Opportunity: A Global Working Group Working Paper Series Working Paper No. Human Capital and Economic Opportunity Working Group Economic Research Center University of Chicago
Measuring Subjective Well-Being for Policy and Individual Use
 Measuring Subjective Well-Being for Policy and Individual Use Ed Diener University of Illinois and The Gallup Orgnization Mexico City: INEGI April 17, 2013 My Gratitude INEGI, FLACSO, AIDLE Mariano Rojas
NBER WORKING PAPER SERIES INTERNATIONAL EVIDENCE ON THE SOCIAL CONTEXT OF WELL-BEING
 NBER WORKING PAPER SERIES INTERNATIONAL EVIDENCE ON THE SOCIAL CONTEXT OF WELL-BEING John F. Helliwell Christopher P. Barrington-Leigh Anthony Harris Haifang Huang Working Paper 14720 http://www.nber.org/papers/w14720
Foundations for Success. Unit 3
 Foundations for Success Unit 3 Know Yourself Socrates Lesson 1 Self-Awareness Key Terms assessment associate cluster differentiate introspection What You Will Learn to Do Determine your behavioral preferences
NBER WORKING PAPER SERIES HOW WAS THE WEEKEND? HOW THE SOCIAL CONTEXT UNDERLIES WEEKEND EFFECTS IN HAPPINESS AND OTHER EMOTIONS FOR US WORKERS
 NBER WORKING PAPER SERIES HOW WAS THE WEEKEND? HOW THE SOCIAL CONTEXT UNDERLIES WEEKEND EFFECTS IN HAPPINESS AND OTHER EMOTIONS FOR US WORKERS John F. Helliwell Shun Wang Working Paper 21374 http://www.nber.org/papers/w21374
What You Will Learn to Do. Linked Core Abilities Build your capacity for life-long learning Treat self and others with respect
 Courtesy of Army JROTC U3C1L1 Self-Awareness Key Words: Assessment Associate Cluster Differentiate Introspection What You Will Learn to Do Determine your behavioral preferences Linked Core Abilities Build
The extent of happiness
 Happiness The extent of happiness What percent of US adults consider themselves happy most or all of the time? 80% happy most of the time. 80% consider themselves optimists. How accurate do you think these
OECD work on Subjective Well-being
 OECD work on Subjective Well-being Asia Pacific Conference on Measuring Well- Being and Fostering the Progress of Societies Marco Mira d Ercole OECD Statistics Directorate Tokyo, 5-6 December 2011 Overview
MULTIPLE LINEAR REGRESSION 24.1 INTRODUCTION AND OBJECTIVES OBJECTIVES
 24 MULTIPLE LINEAR REGRESSION 24.1 INTRODUCTION AND OBJECTIVES In the previous chapter, simple linear regression was used when you have one independent variable and one dependent variable. This chapter
3 CONCEPTUAL FOUNDATIONS OF STATISTICS
 3 CONCEPTUAL FOUNDATIONS OF STATISTICS In this chapter, we examine the conceptual foundations of statistics. The goal is to give you an appreciation and conceptual understanding of some basic statistical
Assignment 4: True or Quasi-Experiment
 Assignment 4: True or Quasi-Experiment Objectives: After completing this assignment, you will be able to Evaluate when you must use an experiment to answer a research question Develop statistical hypotheses
Economics 2010a. Fall Lecture 11. Edward L. Glaeser
 Economics 2010a Fall 2003 Lecture 11 Edward L. Glaeser Final notes how to write a theory paper: (1) A highbrow theory paper go talk to Jerry or Drew don t listen to me. (2) A lowbrow or applied theory
Political Science 15, Winter 2014 Final Review
 Political Science 15, Winter 2014 Final Review The major topics covered in class are listed below. You should also take a look at the readings listed on the class website. Studying Politics Scientifically
support support support STAND BY ENCOURAGE AFFIRM STRENGTHEN PROMOTE JOIN IN SOLIDARITY Phase 3 ASSIST of the SASA! Community Mobilization Approach
 support support support Phase 3 of the SASA! Community Mobilization Approach STAND BY STRENGTHEN ENCOURAGE PROMOTE ASSIST AFFIRM JOIN IN SOLIDARITY support_ts.indd 1 11/6/08 6:55:34 PM support Phase 3
The first step to managing stress is to understand its nature
 Excerpted from 5 Steps to Reducing Stress: Recognizing What Works Recognizing Stress The first step to managing stress is to understand its nature as well as your preferred way of initiating a relaxation
Study Guide for Why We Overeat and How to Stop Copyright 2017, Elizabeth Babcock, LCSW
 Study Guide for Why We Overeat and How to Stop Copyright 2017, Elizabeth Babcock, LCSW This book can be discussed in many different ways. Whatever feels productive and enlightening for you and/or your
Chapter 1. Dysfunctional Behavioral Cycles
 Chapter 1. Dysfunctional Behavioral Cycles For most people, the things they do their behavior are predictable. We can pretty much guess what someone is going to do in a similar situation in the future
Government goals and policy get in the way of our happiness
 University of Wollongong Research Online Faculty of Law, Humanities and the Arts - Papers Faculty of Law, Humanities and the Arts 2014 Government goals and policy get in the way of our happiness Brian
Measuring Psychological Wealth: Your Well-Being Balance Sheet
 Putting It All Together 14 Measuring Psychological Wealth: Your Well-Being Balance Sheet Measuring Your Satisfaction With Life Below are five statements with which you may agree or disagree. Using the
CHAPTER 3 METHOD AND PROCEDURE
 CHAPTER 3 METHOD AND PROCEDURE Previous chapter namely Review of the Literature was concerned with the review of the research studies conducted in the field of teacher education, with special reference
Chapter 11 Nonexperimental Quantitative Research Steps in Nonexperimental Research
 Chapter 11 Nonexperimental Quantitative Research (Reminder: Don t forget to utilize the concept maps and study questions as you study this and the other chapters.) Nonexperimental research is needed because
THE USE OF MULTIVARIATE ANALYSIS IN DEVELOPMENT THEORY: A CRITIQUE OF THE APPROACH ADOPTED BY ADELMAN AND MORRIS A. C. RAYNER
 THE USE OF MULTIVARIATE ANALYSIS IN DEVELOPMENT THEORY: A CRITIQUE OF THE APPROACH ADOPTED BY ADELMAN AND MORRIS A. C. RAYNER Introduction, 639. Factor analysis, 639. Discriminant analysis, 644. INTRODUCTION
HARRISON ASSESSMENTS DEBRIEF GUIDE 1. OVERVIEW OF HARRISON ASSESSMENT
 HARRISON ASSESSMENTS HARRISON ASSESSMENTS DEBRIEF GUIDE 1. OVERVIEW OF HARRISON ASSESSMENT Have you put aside an hour and do you have a hard copy of your report? Get a quick take on their initial reactions
The Power of Positive Thinking
 The Power of Positive Thinking Youhaveprobablyhadsomeonetellyouto'thinkpositive'whenyouwereinatrying situation. That is because the power of positive thinking is something that is a widely heldbelief-andnotwithoutgoodreason.
Complementing GNP with Well-Being Metrics: Implications for Public Policy in the U.S. and Beyond
 Complementing GNP with Well-Being Metrics: Implications for Public Policy in the U.S. and Beyond Carol Graham The Brookings Institution UNLV Lecture February 21, 2013 1 A Celebration of a new science?
MEN S HEALTH PERCEPTIONS FROM AROUND THE GLOBE
 MEN S HEALTH PERCEPTIONS FROM AROUND THE GLOBE A SURVEY OF 16,000 ADULTS 1 MEN S HEALTH PERCEPTIONS FROM AROUND THE GLOBE CONTENTS Foreword from Global Action on Men s Health 4 Introduction 6 GLOBAL FINDINGS
Changes in Subjective Well-Being and Their Implications
 Changes in Subjective Well-Being and Their Implications Hae-sik Jung Associate Research Fellow, KIHASA Sunhee Woo Senior Researcher, KIHASA Introduction Since subjective well-being emerged as a policy
Step One for Gamblers
 Step One for Gamblers We admitted we were powerless over gambling that our lives had become unmanageable. Gamblers Anonymous (GA) (1989b, p. 38) Before beginning this exercise, please read Step One in
Objectives. Quantifying the quality of hypothesis tests. Type I and II errors. Power of a test. Cautions about significance tests
 Objectives Quantifying the quality of hypothesis tests Type I and II errors Power of a test Cautions about significance tests Designing Experiments based on power Evaluating a testing procedure The testing
Family Connections Validation Skills
 Page 24 Definition of validation What Is Validation? (Fruzzetti) Identifying and communicating your understanding of what the other person is saying or feeling in a CLEAR way Communicate what you understand
Inferences: What inferences about the hypotheses and questions can be made based on the results?
 QALMRI INSTRUCTIONS QALMRI is an acronym that stands for: Question: (a) What was the broad question being asked by this research project? (b) What was the specific question being asked by this research
The Wellbeing Course. Resource: Mental Skills. The Wellbeing Course was written by Professor Nick Titov and Dr Blake Dear
 The Wellbeing Course Resource: Mental Skills The Wellbeing Course was written by Professor Nick Titov and Dr Blake Dear About Mental Skills This resource introduces three mental skills which people find
Recording Transcript Wendy Down Shift #9 Practice Time August 2018
 Recording Transcript Wendy Down Shift #9 Practice Time August 2018 Hi there. This is Wendy Down and this recording is Shift #9 in our 6 month coaching program. [Excuse that I referred to this in the recording
Step 2 Challenging negative thoughts "Weeding"
 Managing Automatic Negative Thoughts (ANTs) Step 1 Identifying negative thoughts "ANTs" Step 2 Challenging negative thoughts "Weeding" Step 3 Planting positive thoughts 'Potting" Step1 Identifying Your
My Notebook. A space for your private thoughts.
 My Notebook A space for your private thoughts. 2 Ground rules: 1. Listen respectfully. 2. Speak your truth. And honor other people s truth. 3. If your conversations get off track, pause and restart. Say
or seen with seasonal influenza. So we will continue to follow this and see how the picture of clinical symptoms evolves.
 Transcript of Virtual Press conference with Dr Keiji Fukuda, Assistant Director-General ad. Interim for Health Security and Environment World Health Organization 29 April 2009 Dr Fukuda: Good afternoon
Models of Information Retrieval
 Models of Information Retrieval Introduction By information behaviour is meant those activities a person may engage in when identifying their own needs for information, searching for such information in
Overcome anxiety & fear of uncertainty
 Psoriasis... you won t stop me! Overcome anxiety & fear of uncertainty Royal Free London NHS Foundation Trust Psoriasis You Won t Stop Me This booklet is part of the Psoriasis You Won t Stop Me series:
EXECUTIVE SUMMARY 9. Executive Summary
 EXECUTIVE SUMMARY 9 Executive Summary Education affects people s lives in ways that go far beyond what can be measured by labour market earnings and economic growth. Important as they are, these social
Paradoxes of well-being
 Paradoxes of well-being Latin American Conference on Measuring Well- Being and Fostering the Progress of Societies Marco Mira d Ercole OECD Statistics Directorate Mexico City, 11-13 May 2011 Content of
What do Americans know about inequality? It depends on how you ask them
 Judgment and Decision Making, Vol. 7, No. 6, November 2012, pp. 741 745 What do Americans know about inequality? It depends on how you ask them Kimmo Eriksson Brent Simpson Abstract A recent survey of
A Survey Method for Characterizing Daily Life Experience: The Day Reconstruction Method
 A Survey Method for Characterizing Daily Life Experience: The Day Reconstruction Method By Daniel Kahneman, Alan B. Krueger, David A. Schkade, Norbert Schwarz, Arthur A. Stone Science 3 December 2004:
How to Reduce Test Anxiety
 How to Reduce Test Anxiety To reduce math test anxiety, you need to understand both the relaxation response and how negative self-talk undermines your abilities. Relaxation Techniques The relaxation response
RESEARCH RESEARCH RESEARCH Answering the Questions of Society Utilizing the Sociological Research Methodology
 RESEARCH RESEARCH RESEARCH Answering the Questions of Society Utilizing the Sociological Research Methodology Marshall High School Sociology Mr. Cline Unit Two AE * Choosing a Research Design and Collecting
Pain Self-Management Strategies Wheel
 Pain Self-Management Strategies Wheel Each strategy has its own wedge on this wheel. Each wedge is divided into three sections. After you read about a strategy, use the key below to rate how well you think
Memory loss in dementia
 PBO 930022142 NPO 049-191 Memory loss in dementia If you are caring for a person with dementia you will want to find ways to help them cope with memory problems so that they can retain their confidence
BASIC VOLUME. Elements of Drug Dependence Treatment
 BASIC VOLUME Elements of Drug Dependence Treatment Module 2 Motivating clients for treatment and addressing resistance Basic counselling skills for drug dependence treatment Special considerations when
Lesson 1: Making and Continuing Change: A Personal Investment
 Lesson 1: Making and Continuing Change: A Personal Investment Introduction This lesson is a review of the learning that took place in Grade 11 Active Healthy Lifestyles. Students spend some time reviewing
WHAT WE KNOW. Ruut Veenhoven
 WHAT WE KNOW Ruut Veenhoven The World Book of Happiness Lannoo Uitgeverij, Tielt, Belgium, Leo Bormans editor, 2010 ISBN 978 90 209 90669, Pag 338-346 After more than 30 years of studying worldwide happiness,
Contents. Chapter. A Closer Look at You. Section 17.1 Your Personality Section 17.2 Develop a Positive Attitude. Chapter 17 A Closer Look at You
 Chapter 17 A Closer Look at You Chapter 17 A Closer Look at You Contents Section 17.1 Your Personality Section 17.2 Develop a Positive Attitude 1 Section 17.1 Your Personality Personality develops from
Attention and Concentration Problems Following Traumatic Brain Injury. Patient Information Booklet. Talis Consulting Limited
 Attention and Concentration Problems Following Traumatic Brain Injury Patient Information Booklet Talis Consulting Limited What are Attention and Concentration? Attention and concentration are two skills
CHAPTER 4 RESULTS. In this chapter the results of the empirical research are reported and discussed in the following order:
 71 CHAPTER 4 RESULTS 4.1 INTRODUCTION In this chapter the results of the empirical research are reported and discussed in the following order: (1) Descriptive statistics of the sample; the extraneous variables;
Horizon Research. Public Trust and Confidence in Charities
 Horizon Research Public Trust and Confidence in Charities Conducted for Charities Services New Zealand Department of Internal Affairs May 2014 Contents EXECUTIVE SUMMARY... 3 Terminology... 8 1. Overall
Coaching for Emotional Intelligence
 Coaching for Emotional Intelligence Emotional Intelligence (EI) is the habitual practice of thinking about feeling (and feeling about thinking) to manage our behavior. 1 Life Tree What stands out for you
ADHD Explanation 2: Oppositional defiant disorder and MERIM
 ADHD Explanation 2: Oppositional Oppositional defiant disorder (ODD) ODD is very frequently associated with ADHD. People with ODD typically overreact with anger in response to minor frustration. The lack
Aim #1a: How do we analyze and interpret different types of data?
 Aim #1a: How do we analyze and interpret different types of data? Data (information) may appear in various forms such as a map, graph, chart, table, timelines, political cartoons, visuals, and reading
Why Is It That Men Can t Say What They Mean, Or Do What They Say? - An In Depth Explanation
 Why Is It That Men Can t Say What They Mean, Or Do What They Say? - An In Depth Explanation It s that moment where you feel as though a man sounds downright hypocritical, dishonest, inconsiderate, deceptive,
CHAPTER 2. MEASURING AND DESCRIBING VARIABLES
 4 Chapter 2 CHAPTER 2. MEASURING AND DESCRIBING VARIABLES 1. A. Age: name/interval; military dictatorship: value/nominal; strongly oppose: value/ ordinal; election year: name/interval; 62 percent: value/interval;
COSTA RICA KEY. Public health is the study of how diseases spread in a population and the measures used to control them.
 COSTA RICA KEY Controlling the Pandemic: Public Health Focus Just 25 years since it was first reported, HIV/AIDS has become one of the world s greatest public health crises. More than 39 million people
The Logic of Data Analysis Using Statistical Techniques M. E. Swisher, 2016
 The Logic of Data Analysis Using Statistical Techniques M. E. Swisher, 2016 This course does not cover how to perform statistical tests on SPSS or any other computer program. There are several courses
Chapter 7: Descriptive Statistics
 Chapter Overview Chapter 7 provides an introduction to basic strategies for describing groups statistically. Statistical concepts around normal distributions are discussed. The statistical procedures of
Spirituality in the Workplace
 Spirituality in the Workplace By Ginger Lapid-Bogda, Ph.D. The most frequently asked question about spirituality in the workplace is this: How can the Enneagram be used to bring spirituality into organizations?
How to stop Someone who is ADDICTED ENABLING
 stop ENABLING Table of Contents 2 Are You an Enabler? What if the steps you were taking to help a friend or family member through a problem or crisis were actually the very things hurting them most? And,
LEADING WITH INFLUENCE
 LEADING WITH INFLUENCE Marilyn Gorman Gorman Group Consulting September 25, 2016 THE NEW WORLD OF WORK From.. To.. 1 INFLUENCING OTHERS ACTIVITY Disney World Grand Canyon New York City Influence your partner
An Assessment of Life Satisfaction Responses on Recent Statistics Canada Surveys
 Soc Indic Res DOI 10.1007/s11205-013-0437-1 An Assessment of Life Satisfaction Responses on Recent Statistics Canada Surveys Aneta Bonikowska John F. Helliwell Feng Hou Grant Schellenberg Accepted: 2 September
Unit 3: EXPLORING YOUR LIMITING BELIEFS
 Unit 3: EXPLORING YOUR LIMITING BELIEFS Beliefs and Emotions Bring to mind a negative belief you hold about money. Perhaps it is I don t believe I can win with money or Money is hard to come by. While
HEALTH, GROWTH, AND MEDICINES. Angus Deaton 49 th International Conference in Memory of Franco Modigliani Brescia, 17 th June, 2016
 1 HEALTH, GROWTH, AND MEDICINES Angus Deaton 49 th International Conference in Memory of Franco Modigliani Brescia, 17 th June, 2016 Health, growth, and medicines Does economic growth promote health? Is
NBER WORKING PAPER SERIES WEEKENDS AND SUBJECTIVE WELL-BEING. John F. Helliwell Shun Wang. Working Paper
 NBER WORKING PAPER SERIES WEEKENDS AND SUBJECTIVE WELL-BEING John F. Helliwell Shun Wang Working Paper 17180 http://www.nber.org/papers/w17180 NATIONAL BUREAU OF ECONOMIC RESEARCH 1050 Massachusetts Avenue
Section 3. Objectives. Vocabulary clinical depression cutting suicide cluster suicides
 Section 3 I Objectives ~ Explain why it is important to identify and treat clinical depression. ~ Explain why individuals might deliberately injure themselves. ~ Describe one major risk factor for suicide.
Schizophrenia is a serious mental health condition that affects
 Schizophrenia Schizophrenia is a serious mental health condition that affects a person s thoughts, feelings and behaviours. Whilst it is serious, schizophrenia is both treatable and manageable, and we
SUBJECTIVE WELL-BEING TRENDS 2015 THE HAPPINESS RESEARCH INSTITUTE
 SUBJECTIVE WELL-BEING TRENDS 2015 TREND 1 HAPPINESS AS A POLITICAL GOAL Improving the quality of our lives should be the ultimate target of public policies. Angel Gurría, Secretary-General, OECD TREND
BLACK RESIDENTS VIEWS ON HIV/AIDS IN THE DISTRICT OF COLUMBIA
 PUBLIC OPINION DISPARITIES & PUBLIC OPINION DATA NOTE A joint product of the Disparities Policy Project and Public Opinion and Survey Research October 2011 BLACK RESIDENTS VIEWS ON HIV/AIDS IN THE DISTRICT
Wellbeing at Work NZ managing resilience in the workplace symposium. Dr Anne Messervy Dr Aaron Jarden 12 th September, 2016
 Wellbeing at Work NZ managing resilience in the workplace symposium Dr Anne Messervy Dr Aaron Jarden 12 th September, 2016 Geelong Breathing Breath One. Take a deep breath in through your nose and fill
Vaccines: Canadian majority believes vaccinations are effective; but two-in-five say the science isn t clear
 Page 1 of 22 Vaccines: Canadian majority believes vaccinations are effective; but two-in-five say the science isn t clear Three-quarters of respondents call those who oppose childhood vaccinations irresponsible
Introduction: Statistics, Data and Statistical Thinking Part II
 Introduction: Statistics, Data and Statistical Thinking Part II FREC/STAT 608 Dr. Tom Ilvento Department of Food and Resource Economics Let s Continue with our introduction We need terms and definitions
Dual Diagnosis. Themed Review Report 2006/07 SHA Regional Reports East Midlands
 Dual Diagnosis Themed Review Report 2006/07 SHA Regional Reports East Midlands Contents Foreword 1 Introduction 2 Recommendations 2 Themed Review 06/07 data 3 Additional information 13 Weighted population
Deciding whether a person has the capacity to make a decision the Mental Capacity Act 2005
 Deciding whether a person has the capacity to make a decision the Mental Capacity Act 2005 April 2015 Deciding whether a person has the capacity to make a decision the Mental Capacity Act 2005 The RMBI,
THEORY OF POPULATION CHANGE: R. A. EASTERLIN AND THE AMERICAN FERTILITY SWING
 Lecture on R. A. Easterlin American Fertility Swing THEORY OF POPULATION CHANGE: R. A. EASTERLIN AND THE AMERICAN FERTILITY SWING 1 Comparison and Contrast of Malthus and Easterlin: Malthus' approach is
COUNTY LEVEL DATA FROM PWB POLLING BOULDER
 How serious are these issues to Boulder residents? Extremely serious Very serious Somewhat serious Not a problem DK/NA Hight health care costs Lack of affordable housing Income inequality Drug and alcohol
abcdefghijklmnopqrstu
 abcdefghijklmnopqrstu Swine Flu UK Planning Assumptions Issued 3 September 2009 Planning Assumptions for the current A(H1N1) Influenza Pandemic 3 September 2009 Purpose These planning assumptions relate
Section 4 - Dealing with Anxious Thinking
 Section 4 - Dealing with Anxious Thinking How do we challenge our unhelpful thoughts? Anxiety may decrease if we closely examine how realistic and true our unhelpful/negative thoughts are. We may find
How to Manage Seemingly Contradictory Facet Results on the MBTI Step II Assessment
 How to Manage Seemingly Contradictory Facet Results on the MBTI Step II Assessment CONTENTS 3 Introduction 5 Extraversion with Intimate and Expressive 8 Introversion with Expressive and Receiving 11 Sensing
What Constitutes a Good Contribution to the Literature (Body of Knowledge)?
?") What Constitutes a Good Contribution to the Literature (Body of Knowledge)? Read things that make good contributions to the body of knowledge. The purpose of scientific research is to add to the body of
What Constitutes a Good Contribution to the Literature (Body of Knowledge)? Read things that make good contributions to the body of knowledge. The purpose of scientific research is to add to the body of