Impacts of Dialysis Transportation on Florida s Coordinated Public Transportation Programs
|
|
|
- Shanna Tyler
- 6 years ago
- Views:
Transcription

1 Final Report Impacts of Dialysis Transportation on Florida s Coordinated Public Transportation Programs April 2014 BDK PREPARED FOR Florida Department of Transportation

2 Impacts of Dialysis Transportation on Florida s Coordinated Public Transportation Programs Final Report Prepared for Florida Department of Transportation 605 Suwannee Street, MS 30 Tallahassee, Florida Project Manager: Jayne Pietrowski Prepared by: Michael J. Audino and Jay A. Goodwill National Center for Transit Research Center for Urban Transportation Research (CUTR) University of South Florida 4202 East Fowler Avenue, CUT100 Tampa, Florida April 2014 BDK ii
3 Disclaimer The contents of this report reflect the views of the authors, who are responsible for the facts and the accuracy of the information presented herein. This document is disseminated under the sponsorship of the Department of Transportation University Transportation Centers Program and the Florida Department of Transportation, in the interest of information exchange. The U.S. Government and the Florida Department of Transportation assume no liability for the contents or use thereof. The opinions, findings, and conclusions expressed in this publication are those of the authors and not necessarily those of the State of Florida Department of Transportation. iii
4 Metric Conversion SYMBOL WHEN YOU KNOW MULTIPLY BY TO FIND SYMBOL LENGTH in inches 25.4 millimeters mm ft feet meters m yd yards meters m mi miles 1.61 kilometers km VOLUME fl oz fluid ounces milliliters ml gal gallons liters L ft 3 cubic feet cubic meters m 3 yd 3 cubic yards cubic meters m 3 NOTE: volumes greater than 1000 L shall be shown in m 3 MASS oz ounces grams g lb pounds kilograms kg T short tons (2000 lb) megagrams (or "metric ton") Mg (or "t") TEMPERATURE (exact degrees) o F Fahrenheit 5 (F-32)/9 or (F-32)/1.8 Celsius o C iv
5 Technical Documentation Page 1. Report No. 2. Government Accession No. 3. Recipient's Catalog No. 4. Title and Subtitle Impacts of Dialysis Transportation on Florida s Coordinated Public Transportation Programs 5. Report Date April Performing Organization Code 7. Author(s) Michael J. Audino and Jay A. Goodwill 9. Performing Organization Name and Address National Center for Transit Research, Center for Urban Transportation Research University of South Florida 4202 East Fowler Avenue, CUT100, Tampa, FL Sponsoring Agency Name and Address Research Center Florida Department of Transportation 605 Suwannee Street, MS 30 Tallahassee, Florida Performing Organization Report No. 10. Work Unit No. (TRAIS) 11. Contract or Grant No. FDOT BDK Type of Report and Period Covered Final Report - October 2012 April Sponsoring Agency Code Research and Innovative Technology Administration U.S. Department of Transportation Mail Code RDT New Jersey Ave, SE, Room E33 Washington, D.C Supplementary Notes 16. Abstract The National Center for Transit Research (NCTR) at the University of South Florida (USF) collected quantitative and qualitative data from Community Transportation Coordinators (CTCs) throughout Florida. An online survey and a series of personal interviews provided insight into the following issues: How the supply of and demand for dialysis transportation has changed over the past 5 years. How the increase in dialysis trips is impacting the operations and financial condition of CTCs. How the impacts of dialysis trips differ among rural-oriented CTCs, urban-oriented CTCs, and urban-oriented CTCs which are part of a public transit agency. What unique transportation services are being implemented by CTCs to meet the increasing demand for non-medicaid- funded dialysis trips. How CTCs are preparing for increased transportation demand associated with increased need for dialysis treatment. 17. Key Word 18. Distribution Statement dialysis, transportation, mobility, transportation disadvantaged 19. Security Classif. (of this report) 20. Security Classif. (of this page) 21. No. of Pages 22. Price Unclassified Unclassified 91 Form DOT F v
6 Executive Summary In 2012, Community Transportation Coordinators (CTCs) in Central and Southeast Florida suggested that the increased demand for travel to dialysis treatment had begun to negatively impact their ability to meet the transportation needs of other mobility-challenged residents of their communities. In response to this observation, the Center for Urban Transportation Research (CUTR) at the University of South Florida (USF) undertook a multi-phased research project. This research captured qualitative and quantitative data which produced the following answers to the research questions. Research Question: How have the supply of and demand for dialysis transportation in Florida changed over the past 5 years? Finding: Based on data from the CTCs that responded to the survey, total oneway dialysis trips increased during the five-year period from 282,000 in fiscal year 2008 to 426,000 in fiscal year As a percentage of total trips provided by the reporting CTCs, dialysis transportation trips increased from 11.9% in FY08 to 15.6% in FY12. Research Question: How are the supply of and demand for dialysis transportation expected to change during the next five years? Finding: Based upon the available data and the input of the CTCs surveyed and interviewed, it was not possible to answer this question. Research Question: Which CTCs in Florida are expected to have the largest gap between demand for and supply of dialysis transportation service? Finding: Based upon the available data and the input of the CTCs surveyed and interviewed, it was not possible to answer this question. Research Question: How are dialysis trips impacting the operations and financial condition of CTCs? Finding: 77 percent of CTCs that responded to the survey indicated they were able to accommodate all dialysis trip requests. Among the primary barriers for not being able to fulfill all of the dialysis trip requests, the primary factors provided were that the requested trips were outside the service span (i.e., hours of the day and days of the week). Insufficient funding and vehicle availability were the secondary contributing factors. vi
7 Research Question: How do the impacts of dialysis trips differ among rural-oriented CTCs, small urban-oriented CTCs, and large urbanoriented CTCs? Finding: One-way dialysis trips represent a larger percentage of total one-way trips for urban CTCs. In fiscal year 2012, dialysis trips represented 9.4 percent of total trips for rural CTCs, 13.2 percent for small urban CTCs and 18.1 percent for large urban CTCs. The higher percentages in the urban areas are attributed to the ability of other trip demand to be met by the fixed route and complementary ADA paratransit services available in the urban areas. Research Question: What unique transportation services are being implemented by CTCs to meet the increasing demand for funded dialysis trips? Finding: There was one CTC serving a small urban area that has implemented a volunteer transportation service and a mileage reimbursement program to help satisfy demand for dialysis transportation. Research Question: How are CTCs preparing for increased transportation demand associated with increased need for dialysis treatment? Finding: The research did not uncover any specific future plans, but did document several best practices for the management of dialysis trips. These findings are summarized in Chapters 4 and 5. The research began with a comprehensive literature review which identified reports, studies, and research papers which address the issues of dialysis transportation, Medicaid funding for dialysis patients, and the unique funding of dialysis transportation. The results of the literature review served as the starting point for the research. Based upon the findings of the literature review, CUTR designed and distributed an electronic survey instrument to all CTCs in Florida. The survey instrument captured both qualitative and quantitative data that identified those CTCs experiencing challenges in accommodating demand for dialysis transportation, and quantified the unfulfilled demand for dialysis transportation at both the individual CTC and state level. CUTR followed up with transit agencies telephonically and through to encourage the completion of the survey, clarify responses, and ensure quality control and consistency of the responses. Based upon the findings of the literature review, the survey, and the historical data trends, CUTR selected CTCs with which to conduct in-depth, face-to-face interviews. These vii
8 interviews assessed how CTCs are attempting to satisfy the demand for dialysis transportation, identified unique challenges CTCs are facing regarding dialysis transportation, and uncovered unique solutions to the dialysis transportation problem. Analysis of the quantitative data revealed the following findings and observations: Dialysis trips as a percentage of total one-way trips provided by reporting CTCs were 11.9 percent in fiscal year 2008, 13.9 percent in fiscal year 2009, 14.8 percent in fiscal year 2010, 14.4 percent in fiscal year 2011, and 15.6 percent in fiscal year The percentage of dialysis trips to total trips provided by CTCs responding to the survey ranged from 3 percent to 34 percent, with an average among the respondents of 13 percent. The percentage of dialysis trips to total trips for each of the CTCs responding generally appeared constant over the past five-year period. Seventy-seven percent of the CTCs reported they have been able to accommodate all requests for dialysis-related travel requests. Analysis of both the qualitative and quantitative data revealed the following general observations: Eight CTCs - 1 rural, 2 small urban, 5 urban - indicated that the increase and demand for dialysis transportation had a negative impact on their operations. Eight CTCs reported that the increase in the number of trips provided to dialysis treatment patients had prevented them from satisfying trip requests from other customers. Approximately one-third of the CTCs reported positive working relationships with local dialysis treatment facilities. One CTC utilizes both volunteer drivers and a mileage reimbursement program (alternative transportation delivery tactics) to help satisfy demand for dialysis transportation. The CTCs serving larger metropolitan areas have access to financial resources that allow them to meet an increase in demand for dialysis transportation. No CTCs forecast future demand for dialysis transportation. Not all CTCs separate dialysis transportation trips from general medical trips. viii
9 Requests for transportation service during hours or on days that CTCs do not operate are the primary reasons for not accommodating all dialysis trip requests. 100 percent of CTCs make dialysis transportation and other medical-related trips their number one priority. Every CTC interviewed was aware of and sensitive to the challenges of dialysis treatment return trips. Three CTCs indicated the need for dedicated funding for dialysis transportation. CTCs may want to explore opportunities for dialysis treatment facilities to pay for dialysis transportation. One CTC reported that no-shows create operational and financial challenges. Input gathered from the personal interviews conducted during the data collection phase of the research identified several best practices among Florida s CTCs, as described below. Designating a staff person to represent the CTC in interactions with dialysis treatment facilities. This staff person is responsible for conducting regular and frequent (often monthly) meetings with treatment center personnel, identifying issues and challenges that may be inhibiting the effective delivery of dialysis patients, working collaboratively to solve problems, and ensuring that effective communication exists between the CTC and the dialysis treatment facilities. Recognizing that improved communications and relations between CTCs and dialysis treatment centers are a function of: o the willingness of some treatment centers to adjust chair times to accommodate the needs of the CTC; o a collaborative approach to chair time and transportation scheduling; and o the willingness of dialysis treatment facilities to provide treatment time priority to CTC customers. Identifying dialysis patients who reside within a common geographic trip origination zone and transporting them using a single vehicle. Whenever possible, maximize multi-loading. Assigning the same driver to the same patient as frequently as possible. The dialysis process can be an extremely tiring occurrence for patients. To help ease both the physical and emotional discomfort of dialysis treatment, several CTCs attempt to provide the same driver for the same patient. ix
10 Implementing a counseling program to help better inform and educate patients and family members about the operational and financial impacts to the system when patients fail to cancel if they are unable to make the scheduled trip, resulting in a no-show. x
11 Table of Contents Disclaimer... iii Metric Conversion... iv Technical Documentation Page... v Executive Summary... vi List of Figures... xii List of Tables... xii Chapter 1: Overview... 1 State of the Problem... 1 Chronic Kidney Disease... 1 Treatment Options... 1 Relationship of Treatment and Transportation... 3 The Florida Context... 5 Chapter 2: Survey of Florida Community Transportation Coordinators... 8 Survey Background... 8 Survey Results Survey Highlights Chapter 3: Interview with Florida Community Transportation Coordinators Interview Background Interview Process Findings from Personal Interviews Chapter 4: Observations and Findings Research Objectives and Findings Observations Regarding Demand Observations Regarding Scheduling Chapter 5: Best Practices and Recommendations Appendix A: Survey Questionnaire Appendix B: Project Advisory Committee Members Appendix C: Total Trips and Dialysis Trips Summaries Appendix D: Response to Open-Ended Questions Appendix E: Personal Interviews Summaries xi
12 List of Figures Figure 1-1: Florida Counties by Population Size... 7 Figure 2-1: Florida Counties Responding to Survey Figure 2-2: Annual One-Way Dialysis Trips Figure 2-3: Total Annual Trips Figure 2-4: Dialysis Trips as a Percent of Total Trips Figure 2-5: Dialysis Trips as a Percent of Total Trips Rural Systems Figure 2-6: Dialysis Trips as a Percent of Total Trips Small Urban Systems Figure 2-7: Dialysis Trips as a Percent of Total Trips Large Urban Systems Figure 2-8: Ability to Satisfy Demand for Dialysis Trips Figure 2-9: Primary Barriers to Fulfilling Dialysis Trip Requests Figure 2-10: Ability to Cross County Lines for Dialysis Trips Figure 3-1: Florida Counties/CTCs Interviewed List of Tables Table 2-1: Florida Counties Represented by Survey Process... 9 Table 2-2: Total CTC Trips Versus Dialysis Trips FY08-FY Table 3-1: Counties Represented by Interview Process xii
13 Chapter 1 Overview State of the Problem According to the National Kidney Foundation, 26 million Americans suffer from Chronic Kidney Disease (CKD) 1 a more than 20 percent increase since Additionally, more than half a million Americans suffer from End Stage Renal Disease (ESRD), the vast majority of whom require dialysis treatments to stay alive. In the past 30 years, demand for ESRD treatment has increased by more than 900 percent. Dale J. Marsico, Executive Director of the Community Transportation Association of America, states, The dialysis transportation issue, because of the life-or-death nature of the service and the overwhelming demand, is the logical place to first focus when considering the role of community and public transit in health care provision and transportation. 2 Chronic Kidney Disease CKD is a silent condition, and there are no symptoms until the latter stages of the disease. Approximately 31 million American adults have the disease and another 20 million are thought to be at risk. The complications of chronic kidney disease, are cardiovascular disease, kidney failure, and death. Treatment can slow progression of the disease, address complications of the disease, and replace lost kidney functions. Dialysis or kidney transplantation are the only treatments. The American Kidney Foundation estimates 100,000 people in the United States begin dialysis each year, and approximately 70,000 dialysis patients die annually. 3 Currently, there is no cure for chronic kidney disease. 3 Treatment Options Hemodialysis treatment is the most common form of dialysis. While other forms of dialysis treatment are available and hemodialysis can be performed in a patient s home, 93 percent of dialysis patients in the United States are treated in dialysis centers. 4 1 The term chronic kidney disease can refer to many kinds of diseases. CKD is lasting damage to the kidneys that can get worse over time. If damage is significant, kidneys may stop functioning. If the kidneys fail to perform, patients need dialysis or a kidney transplant in order to live. CKD can be caused my many different diseases; the most common causes are diabetes and high blood pressure. 2 Bogren, Scott (2011) The Dialysis Report: Transportation Demand Outstrips Supply, Community Transportation: Fall/Winter, Community Transportation Association of America, Washington, D.C. 3 Quinn, Maureen Hensley, (2004), Trends in Healthcare Impact Trends in Medical Transportation, Community Transportation, Community Transportation Association, Washington, D.C. 4 Burkhardt, John, and Rocco, Michael, (1993) Prevalence of Missed Treatments and Early Sign-Offs in Hemodialysis Patients, Journal of the American Society of Nephrology, Volume 4, Number 5, Washington, D.C. 1
14 Another form of dialysis is peritoneal dialysis, which may also be performed at a patient s home. This procedure cleans the blood inside the patient's body, using the peritoneum (membrane lining the wall of the abdomen) as a filter. Approximately 7 percent of the dialysis population in the United States uses this modality. From the patient s perspective, the dialysis process can be an extremely tiring occurrence and can produce side effects including nausea, infection, and bleeding. A dialysis patient s condition lessens the bloods ability to clot and presents unique challenges for public transportation providers. And, while a dialysis patient may be able to utilize public transportation for the trip to the dialysis center, the physical toll on that patient caused by the dialysis treatment process typically requires more personalized transportation options. The Community Transportation Association of America (CTAA) reports that dialysis treatment is most often performed on a thrice-weekly basis and, typically, patients on a Monday-Wednesday-Friday schedule are more likely to be private-paid, particularly those receiving their dialysis in the middle of the day. Conversely, the CTAA report suggests Tuesday-Thursday-Saturday patients and that early morning and later night clients are more likely to be Medicare patients. From a transportation point of view, patients on the Tuesday-Thursday-Saturday and patients with early morning and late evening chair times are the most difficult and costly to serve and are more likely to be dependent upon public transportation because their appointment times do not align well with the operating days/hours of many public transit operators. Bogren suggested that increased frequency of dialysis treatments with shorter six times a week for two-and-a-half hours increased overall health and quality of life in patients. While increases in this trend may benefit patients, it may create additional challenges for public transportation organizations. 5 Burkhart and Rocco find that many dialysis patients fail to complete their prescribed dialysis treatment time and occasionally may miss their dialysis treatments completely. They analyzed data from 31,212 dialysis sessions over a 12-month period and documented a total of 2,108 early sign-offs from dialysis treatment and 387 failures to show. 6 Early sign-offs from and no-shows to dialysis treatments pose a major health problem. Early sign-off from dialysis treatment occurs with approximately 33 percent of the dialysis population. 7 Approximately 55 percent of those early sign-offs from dialysis treatment were 5 Bogren, Scott, (2011) The Dialysis Report: Transportation Demand Outstrips Supply, Community Transportation: Fall/Winter 2011, Community Transportation Association of America, Washington, D.C. 6 Burkhart, John, and Rocco, Michael, (1993) Prevalence of Missed Treatments and Early Sign-Offs in Hemodialysis Patients, Journal of the American Society of Nephrology, Volume 4, Number 5, Washington, D.C. 7 Ibid. 2
15 due to medically related problems. For these patients, the most common reason for ending a dialysis treatment session early were cramping (17.9%), followed by feels bad or sick (14.2%). Most of the remaining early sign-offs occurred because of either personal obligations or noncompliance with the dialysis. For these individuals, personal business or errands were indicated by 12.1 percent of patients, lack of transportation later in the day by 7.7 percent, and refusal to comply with the prescribed treatment time by 6.4 percent of patients. 8 McCann and Nichols reported that many dialysis treatment patients have multiple medical issues which complicate transportation. Their research revealed: Thirty-seven percent of dialysis patients use a wheelchair or a walker, compared with 13 % for other riders. Fifty percent of dialysis patients require some type of mobility device. At least 50% of dialysis patients are physically unable to drive themselves, have no family members, volunteer group to provide transportation, or are unable to take fixed-route public transit. 9 Relationship of Treatment and Transportation Quinn concluded the on-going and continuous nature of treatment for chronic diseases is the crux of the transportation challenge. 10 For community and public transit operators, dialysis treatment trips are a mounting challenge. Demand for dialysis transportation is increasing at the same time payment mechanisms are dwindling. Additionally, dialysis trips can be lengthy and time consuming (some often taking up to 4 hours), and the regular and consistent need for dialysis treatment requires similar consistency in transportation access. Many dialysis treatment facilities have hours of operation that make family-based transportation a challenge and the effects of dialysis treatment make self-transportation a problem. Even with an increase in the number of dialysis treatment facilities, travel distance to/from dialysis treatment centers is the biggest problem for both patients and public transportation providers in rural areas. The high incidence of unemployment among dialysis patients translates into lower incomes and greater difficulty in paying for transportation services to and from dialysis treatment. Burton noted that 25 percent of dialysis patients live in rural areas and that only 19 percent of dialysis patients age are employed Ibid. 9 McCann, Jessica, and Nichols, Jordan (2005), Medical Transportation Toolkit and Best Practices, Community Transportation Association of America, Washington, D.C. 10 Quinn, Maureen Hensley, (2004), Trends in Healthcare Impact Trends in Medical Transportation, Community Transportation, Community Transportation Association, Washington, D.C. 11 Burton, LaVarne A., (2009), Barriers to Care and Employment Facing Rural Dialysis Patients, American Kidney Fund, Rockville, Maryland 3
16 Bogren suggests Medicare policy exacerbates the dialysis transportation challenge because the majority of dialysis patients are covered by Medicare, which unlike Medicaid does not offer non-emergency transportation as a benefit. Subsequently, many transit operators struggle to continuously add new dialysis patients to their transit schedule who may not have the ability to pay for their trips. Bogren also suggests that public transportation is being overwhelmed by the swiftly growing dialysis transportation demand. Medicare will only reimburse for emergency transportation services (ambulances) and not for non-emergency dialysis transportation. The key solution for public transportation is to develop a funding mechanism for dialysis transportation in Medicare. Bogren identified another key issue that some transit managers have identified some privately owned and operated dialysis centers seem to believe there is a statutory rule that prohibits them from actually paying a portion of the transportation costs to get their patients to their facilities. McCann and Nichols clarified that Section 1128(b) of the Social Security Act prohibits a medical facility from paying anything of value to a Medicaid or Medicare beneficiary. However, the US Department of Transportation has determined that dialysis facilities could help pay for transportation of their clients and be in compliance with the Section 1128(b). McCann and Nichols affirm the notion that dialysis patients, transportation providers, and dialysis treatment facilities all have a vested interest in solving the transportation challenges and offer a list of potential solutions. 5 Dialysis treatment facilities can acknowledge that transportation to/from treatment is a critical component of treatment plan Individualized transportation planning with social worker involvement is necessary Dialysis facilities can coordinate scheduling Dialysis facilities can take patient location into consideration when locating new facilities Transportation providers can group riders Transportation providers may place geographic/zonal restrictions on where they transport patients and may impose an additional fare for service beyond certain zones 4
17 Dialysis centers can help patients locate other forms of transportation Transportation providers should work cooperatively with dialysis treatment centers 12 The McCann report further affirms that Medicare Part B allows transportation but only in ambulances. The report suggests that Medicare s insistence on the use of ambulances and emergency care may be creating overcrowding in emergency rooms and driving up medical costs. This report acknowledges that ambulance transportation is much more expensive than public transportation and that Medicare should consider the cost of public transit as a reimbursable expense. The Florida Context The Florida Commission for the Transportation Disadvantaged (CTD) is an independent state agency serving as the policy development and implementation agency for Florida s Transportation Disadvantaged Program. The Commission is administratively housed within the Florida Department of Transportation. The CTD mission is: To ensure the availability of efficient, cost-effective and quality transportation services for transportation disadvantaged persons. The Florida CTD is charged with serving the mobility needs of the TD population, which includes those persons who because of physical or mental disability, income status, or age are unable to transport themselves or purchase transportation and are, therefore, dependent on others to obtain access to health care, employment, education, shopping, social activities, or other life-sustaining activities or children who are handicapped or highrisk or at-risk as defined in s , Florida Statutes (Chapter 427, Florida Statutes). Florida's TD program was created in 1979 and reenacted in The 1989 act created the Florida Transportation Disadvantaged Commission (currently the Florida Commission for the Transportation Disadvantaged) and enhanced local participation in the planning and delivery of coordinated transportation services through the creation of local coordinating boards (LCBs) and Community Transportation Coordinators (CTCs). Local planning organizations perform long-range planning, and assist the Commission and LCBs in implementing the TD program in designated service areas. The CTCs are businesses or local public transportation providers that are responsible for providing or arranging the delivery of transportation services to the TD population within their county. The designated CTC may provide all trips as a sole source, or the CTC may provide some trips and subcontract some (partial brokerage). The CTC may also function as a complete brokerage, subcontracting all trips to approved operators. 12 McCann, Jessica, and Nichols, Jordan (2005) Medical Transportation Toolkit and Best Practices, Community Transportation Association of America, Washington, D.C. 5
18 The CTD approves the CTC for each county based upon the recommendation of the local planning agency. The CTCs are responsible for the provision of transportation services to the TD population within their county. According to the CTD s 2013 Annual Report, 658,000 Floridians consumed 49,601,883 trips on the state s coordinated transportation system. This compared with 47,720,113 trips in fiscal year 2012 and 51,144,400 trips in fiscal year Trips for medical purposes have decreased from 35.3% of the total in fiscal year 2011 to 18.2% in fiscal year Almost 35 million trips, 70 percent of all trips taken by older adults, persons with disabilities, people with low incomes and at-risk children within the Coordinated System were on fixed route or deviated-fixed route systems. For the purpose of this research, Florida s 67 counties were classified based on their populations: Rural (population of fewer than 25,000) 17 Counties: Baker, Bradford, Calhoun, Dixie, Franklin, Gilchrist, Glades, Gulf, Hamilton, Holmes, Jefferson, Lafayette, Liberty, Madison, Taylor, Union and Washington Small Urban (population of 25,000 to 200,000) 27 Counties: Bay, Charlotte, Citrus, Clay, Columbia, DeSoto, Flagler, Gadsden, Hardee, Hendry, Hernando, Highlands, Indian River, Jackson, Levy, Martin, Monroe, Nassau, Okaloosa, Okeechobee, Putnam, St. Johns, Santa Rosa, Sumter, Suwannee, Wakulla, and Walton Large Urban (population of greater than 200,000) 23 Counties: Alachua, Brevard, Broward, Collier, Duval, Escambia, Hillsborough, Lake, Lee, Leon, Manatee, Marion, Miami-Dade, Orange, Osceola, Palm Beach, Pasco, Pinellas, Polk, St. Lucie, Sarasota, Seminole, and Volusia Figure 1-1 provides a schematic of the 67 Florida counties designated as rural, small urban and large urban. Finally, it should be noted that the focus of this research was on demand response services provided by the Florida CTCs and does not include those other paratransit trips provided by non-ctc public transit agencies and does not include trips provided under the urban transit systems complementary ADA paratransit services. 6

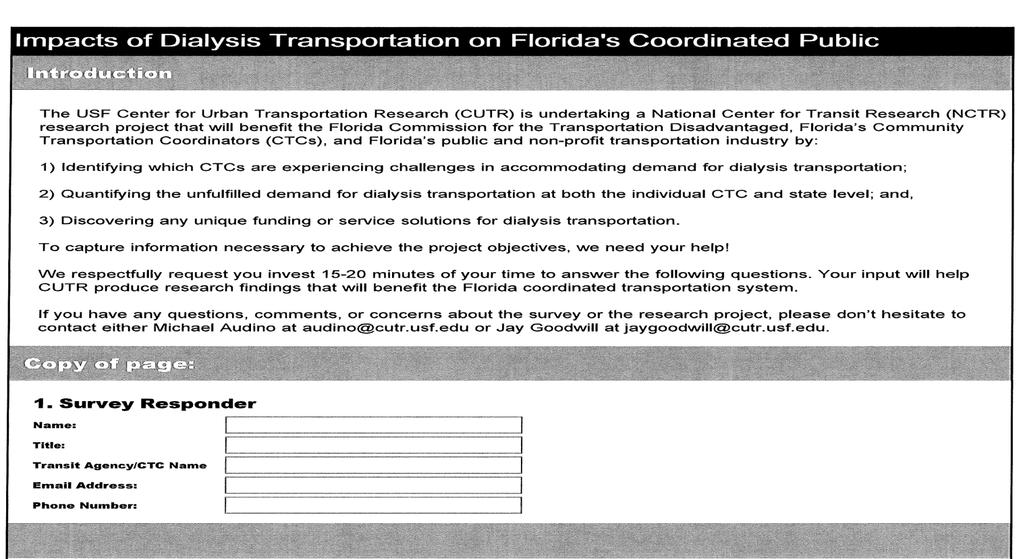
19 Figure 1-1 Florida Counties by Population Size 7
20 Chapter 2 Survey of Florida Community Transportation Coordinators Based on the findings from the literature review, the Center for Urban Transportation (CUTR) at the University of South Florida designed and distributed an electronic survey to each of the CTCs providing service to Florida s 67 counties. The survey captured both quantitative and qualitative data. The survey results helped determine the significance of the increase in demand for dialysis transportation and how Florida s CTCs are responding to the increased demand for dialysis transportation in their communities. Survey Background The survey instrument, which is included in Appendix A, consisted of 14 questions that requested trip data and responses to several open-ended questions. The survey was finalized in late January 2013 with the assistance of the Project Manager and some members of the Project Advisory Committee. The Project Advisory Committee was organized to provide advice and guidance to the research team, help implement research findings, and possibly review written material produced by the research team. A list of Project Advisory Committee members is included in Appendix B. In advance of the release of the survey, at the request of CUTR, the Executive Director of the Florida Commission for the Transportation Disadvantaged (CTD) sent an to all of the CTCs alerting them of this project and requesting their cooperation in responding to the project survey. The survey was distributed electronically using Survey Monkey to all Florida CTCs by on February 22, Subsequent reminders were sent to encourage responses. The survey was closed in late April A total of 40 CTCs responded to the survey. These 40 CTCs provide coordinated transportation services to 53 of Florida s 67 counties. The 53 counties represented by the responding CTCs are listed in Table 2-1 and depicted graphically in Figure
21 Table 2-1 Florida Counties Represented by Survey Responses Florida Counties Represented by Responding CTCs Alachua Hardee Monroe Baker Hendry Nassau Bradford Hernando Okaloosa Calhoun Highlands Okeechobee Charlotte Hillsborough Pasco Citrus Indian River Pinellas Clay Jackson Polk Collier Jefferson Putnam DeSoto Lafayette Santa Rosa Dixie Lake Sarasota Duval Lee Saint Johns Escambia Levy Saint Lucie Flagler Liberty Sumter Franklin Madison Taylor Gadsden Manatee Union Gilchrist Marion Volusia Glades Martin Wakulla Gulf Miami-Dade 9
22 Figure 2-1 Florida CTCs Responding to Survey 10
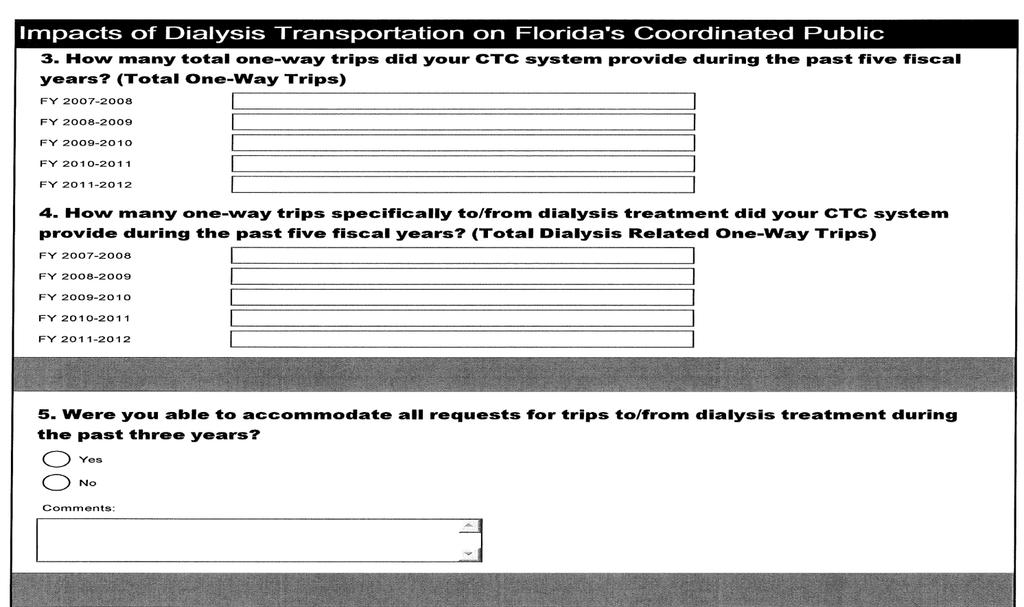
23 Responding CTCs were placed into 1 of 3 categories. CTCs that serve counties with fewer than 25,000 residents were classified as rural; CTCs that serve counties with populations between 25,000 and 200,000 were classified as small urban; CTCs that serve counties with populations greater than 200,000 were classified as large urban. Of the 40 CTCs that responded to the survey, 22 CTCs (representing 33 counties) provided detailed information on total trips and dialysis trips. Of the 33 counties represented by responding CTCs, 11 are rural, 15 are small urban, and 7 are large urban. Survey response rates are 64.7% (11 of 17) for rural counties, 55.5% (15 of 27) for small urban counties, and 30.4% (7 of 23) for large urban counties. Survey Results The initial questions requested participants to quantify the total number of one-way trips and the total number of one-way trips to dialysis treatment they had provided in each of the previous five fiscal years. Figure 2-2 shows total annual one-way dialysis trips during fiscal year (FY) 2008 through FY 2012 as detailed from the 22 CTCs that responded to the survey. The data reveal an increase of approximately 150,000 trips during the five-year period. Four systems reported an increase in dialysis trips every year and 13 of the 22 systems responding reported yearto-year increases. Annual One-Way Dialysis Trips by Reporting CTCs 440, , , , , , , , , ,000 Figure 2-2 Annual One-Way Dialysis Trips 11
24 Figure 2-3 shows total annual one-way trips from the 22 CTCs (representing 33 counties) that provided detailed information during FY 2008 through FY 2012 time period. The data reveals a large fluctuation in trips from year to year. Total one way trips increased by approximately 100,000 during the five-year period. Total Annual Trips by Reporting CTCs 2,950,000 2,900,000 2,850,000 2,800,000 2,750,000 2,700,000 2,650,000 2,600,000 2,550,000 2,500,000 2,450,000 2,400,000 2,890,481 2,748,962 2,663,926 2,735,949 2,581,913 Figure 2-3 Total Annual Trips As the number of trips provided to dialysis treatment has increased for most CTCs over the past 5 years and as total trips have remained relatively stable, dialysis transportation trips as a percentage of total trips provided has increased from 11.9% in FY08 to 15.6% in FY12. Figure 2-4 shows the change in percentages for dialysis trips for the fiscal year 2008 to 2012 time frame. 12
25 Dialysis Trips as a Percentage of Total Trips Figure 2-4 Dialysis Trips as a Percentage of Total Trips While dialysis trips represents a larger percentage of the overall service provided by CTC s, the percentage varies greatly from rural systems to small urban systems to large urban systems. Rural CTCs that responded to the survey experienced a decline in dialysis trips as a percentage of total trips from 10.5% to 9.4%. This decline has been consistent over the past 4 fiscal years. Small urban CTCs that responded to the survey experienced an increase in dialysis trips as a percentage of total trips from 8.3% to 13.2%. 80% of this 5% overall increase occurred from FY08 to FY09. CTCs from large urban areas reported an increase in dialysis trips as a percentage of total trips from 11.6% to 18.1% with percentage increases occurring in every fiscal year of the reporting period. Figure 2-5 depicts the percentage change for rural systems; Figure 2-6 depicts the percentage change for small urban systems; and Figure 2-7 depicts the percentage change for large urban areas. 13
26 Dialysis Trips as a Percentage of Total Trips--Rural Systems Figure 2-5 Dialysis Trips as a Percentage of Total Trips---Rural CTC s Dialysis Trips as a Percentage of Total Trips--Small Urban Systems Figure 2-6 Dialysis Trips as a Percentage of Total Trips Small Urban Systems 14
27 Dialysis Trips as a Percentage of Total Trips--Urban Systems Figure 2-7 Dialysis Trips as a Percentage of Total Trips Large Urban Systems 15
28 Table 2-2 provides the five year averages of the percentage of total trips that were dialysis trips. Table 2-2 Total CTC Trips versus Dialysis Trips FY08-FY12 CTC / County Percent Dialysis Trips 1 Baker County 4% 2 Big Bend (Gadsden, Jefferson, Madison and Taylor) 9% 3 Charlotte County 3% 4 Clay County 13% 5 Collier County 18% 6 Duval County (JTA) 22% 7 Flagler County 7% 8 Good Wheels (Lee, Henry and Glades) 34% 9 Gulf County 16% 10 Hernando County 6% 11 Hillsborough County 17% 12 Jackson County 8% 13 Lake County 17% 14 Manatee County 5% 15 Martin County 3% 16 Okaloosa County 17% 17 Polk County 27% 18 Sumter County 7% Suwanee River Economic Council 19 (Bradford, Dixie, Gilchrist and Lafayette) 11% Veolia (DeSoto, Hardee, Highlands and 20 Okeechobee) 26% 21 Volusia County 10% 22 Wakulla County 6% AVERAGE 13% 16
29 The survey queried respondents regarding their ability to satisfy demand for dialysis transportation. Figure 2-8 reveals that 77% of respondents were able to accommodate all requests for dialysis transportation. Able To Accommodate All Dialysis Trip Requests 22.6% YES 77.4% NO Figure 2-8 Ability to Satisfy Demand for Dialysis Trips 17

30 For the 22 percent of CTCs that were unable to accommodate all requests for dialysis transportation, a follow-up question asked for specific reasons why trip requests were not fulfilled. As shown in Figure 2-9, the primary reasons for not fulfilling trip request are a function of when the trip is desired. Figure 2-9 Primary Barriers to Fulfilling Dialysis Trip Requests 18
31 One rural CTC reported that there is no dialysis treatment center within its county and patients must travel to adjacent counties for dialysis treatment. Therefore, it is important to understand if Florida s CTCs have any restrictions regarding travel to adjacent counties. Figure 2-10 reveals that 38 percent of responding counties did not provide service to adjacent counties. Able To Cross County Lines for Dialysis Trips 37.90% YES 62.10% NO Figure 2-10 Ability to Cross County Lines for Dialysis Trips Survey Highlights The survey captured diverse quantitative and qualitative information from the Florida CTCs to determine their experiences in responding to the challenges in accommodating demand for dialysis transportation in their communities. The percentage of dialysis trips to total trips provided by CTCs responding to the survey ranged from 3 percent to 34 percent, with an average among the respondents of 13 percent The percentage of dialysis trips to total trips for the CTCs responding generally appeared constant over the past five-year period Seventy-seven percent of the CTCs reported that they have been able to accommodate all requests for dialysis related travel Primary barriers to satisfying dialysis trip requests included: o Requests outside of normal operating hours o Requests for days service is not provided 19
32 o o Funding issues or limitations Lack of vehicles or staffing Medical and dialysis trip requests are typically provided the top priority, implying that lower priority trip requests destinations may be sacrificed due to limited trip resources Communication between CTCs and dialysis treatment facilities was cited as an important item CTCs listed the following as strategies for working cooperatively with the dialysis treatment facilities: o Establish relationships with the dialysis centers o Openly communicating and having dialogue with centers o Cooperate to set up treatment and transportation schedules o Give CTC customers priority in scheduling so as to maximize scheduling efficiencies o Group dialysis patients from common origin zones and maximize multiloading o Allow patients to use the treatment facility nearest to their home Potential use of volunteers to transport dialysis patients may be an option in some communities Greater use of subcontracting with taxis should be considered, especially for hard to schedule trips CTCs should explore extending service hours to provide improved scheduling to and from dialysis centers CTCs should work closely with the local fixed route operator (if available) to explore the feasibility of using the fixed route services for dialysis passenger travel needs Due to the need to provide dialysis treatments 2 to 3 times per week, transporting passengers to dialysis treatment account for a high number of system trips and therefore account for a significant budgetary impact CTCs reported that TD funding was the primary source for funding the non-medicaid dialysis patient trips Rural CTCs reported cross county boundary dialysis trips were common and, due to time and distance, resulted in high per trip costs 20
33 Chapter 3 Interviews with Florida Community Transportation Coordinators The second element of the outreach effort involved personal interviews with select CTCs throughout Florida. The personal interviews provide a better understanding of how Florida s CTCs are attempting to satisfy the demand for dialysis transportation, identify unique challenges these entities are facing regarding dialysis transportation, and uncover unique solutions to the dialysis transportation problem. Interview Background Based upon the findings of the literature review, the online survey, and the historical data trends, CUTR identified 19 CTCs with whom to conduct in-depth, personal interviews. These 19 CTCs represented 33 counties. Of these 33 counties, 10 are rural in nature, 11 are considered small urban areas, and 12 are categorized as large urban areas. The CTCs selected for interviews represent six of the seven FDOT districts. Following approval of the list by the FDOT project manager, CUTR researchers initiated efforts to contact each selected CTC. Telephone calls were placed to each CTC, and followup s were also transmitted. The purpose of the personal contacts was to identify a date and time when the CTC representative could be interviewed by a CUTR researcher. CUTR researchers were able to contact 17 of the 19 selected CTCs, which represented 29 of the 33 counties. In-person interviews were completed with representatives of the Suwannee Valley Transit Authority, the Sumter County CTC, and the Hillsborough County CTC. All remaining interviews were conducted telephonically. All interviews were conducted between July 12, 2013, and September 12,
34 The 33 counties represented by the interviewed CTCs are listed in Table 3-1 and depicted graphically in Figure 3-1 Table 3-1 Counties Represented By Interviews RURAL SMALL URBAN LARGE URBAN Bradford Dixie Gilchrist Glades Gulf Coast Hamilton Jefferson Lafayette Madison Taylor Clay Columbia DeSoto Gadsden Hardee Hendry Highlands Martin Okeechobee Putnam Suwannee Broward Collier Duval Hillsborough Lee Lake Manatee Orange Osceola Palm Beach Seminole Volusia 22
35 Figure 3-1 Florida Counties/CTCs Interviewed 23
36 Interview Process Whether in-person or telephonic, each interview began with the CUTR researcher providing an overview of the research project, a summary of the research objectives, and an explanation that the personal interviews were designed to gather information and insights not attainable via the on-line survey. Each interview began with a variation of the open-ended statement Help me understand how big of an issue dialysis transportation is to you and your CTC. Specific follow-up questions varied based on how the interviewee responded to the initial question. The time necessary to complete each interview varied by respondent; the briefest interview lasted 10 minutes and the lengthiest interview lasted approximately 75 minutes. A summary of each interview is included in Appendix E. Findings from Personal Interviews CUTR researchers performed a content analysis of the 17 interview summaries. Following is a summary of the findings from the analysis. There is not broad consensus regarding the degree to which dialysis transportation is a problem. Every interviewee indicated that demand for dialysis transportation was increasing within their service territory; although very few were able to quantify the increase. Additionally, no interviewee indicated that they had a process in place to forecast future demand for dialysis transportation. Most interviewees -regardless of system size indicated that dialysis transportation did not present any unique operational challenges. The increased demand is placing strains on the financial conditions of many interviewees and dialysis transportation presents some unique operational challenges (i.e. patients not being physically able to travel immediately following dialysis treatment) for agencies. As one interviewee stated, dialysis transportation is a challenge and we deal with it. The increase in demand for dialysis transportation has negatively impacted the ability of some CTCs to satisfy demand for other trips. It was found that 68.2% of interviewees indicated an increase in the number of trips provided to dialysis patients. This increase in demand for dialysis trips has occurred without an increase in the resources to pay for the additional trips. Eight of the CTC s interviewed have found it necessary to reduce the number of trips provided to customers with needs other than dialysis treatment. This finding is based almost solely on qualitative information since no system interviewed maintained a data base of unfilled trips. Relationships with dialysis treatment centers vary greatly. The quality of the relationship between personnel from the transit systems and personnel from dialysis treatment facilities vary greatly. Generally speaking, interviewees revealed that more positive relationships produced fewer complaints from patients and treatment 24
37 centers. Additionally, more positive relationships produced fewer operational problems. This finding may help explain why each of the urban CTCs interviewed dedicates staff to meet with dialysis treatment facilities on a regular basis. Conversely, a small number of interviewees reported less than satisfactory relationships with dialysis treatment centers. Financial contributions from dialysis treatment centers are an opportunity. When asked if dialysis treatment centers had been asked to help defray the cost of transporting patients, only two interviewees responded affirmatively. However, every interviewee identified financial contributions from dialysis treatment facilities as an immediate opportunity. A majority of CTCs prioritize trips to accommodate demand for dialysis trips. Findings from the personal interviews supported the observation (documented previously in this section of this report) that CTCs make medical and dialysis trip requests the priority. Interviewees definitely recognized the life-and-death nature of dialysis transportation and occasionally sacrificed fulfillment of other trip requests in order to satisfy demand for dialysis transportation. Very few CTCs utilize volunteers, vouchers, or mileage reimbursement to help accommodate demand. One interviewee indicated that volunteer transportation was a technique utilized to meet the demand for dialysis transportation. The same interviewee had also implemented a mileage reimbursement system and a limited voucher program to help satisfy increased demand for transportation. Interestingly, this same interviewee indicated an inability to satisfy the demand for dialysis transportation. No other interviewee had implemented a volunteer transportation program, a transportation voucher program, or a mileage reimbursement system. Dialysis treatment centers need to help pay for transportation service. Twelve CTCs voluntarily offered the opinion that dialysis treatment facilities should help pay for the cost of dialysis transportation. The sentiment among interviewees is that dialysis treatment facilities are for-profit entities which are deriving financial benefit from the service provided by CTCs and, therefore, have a vested interest and perhaps a business responsibility to pay for or provide some financial support for the services. No activity to predict or quantify demand. No interviewees identified any planning efforts to help quantify projected demand for dialysis transportation. Rural Systems One rural CTC suggested that dialysis transportation consumers in rural areas may be more tolerant than their urban counterparts of CTC operational challenges such as longer trip distances and longer wait times for pick-up following treatment.. 25
38 One rural county reported having no dialysis treatment facility within the county so patients requiring dialysis treatment must be transported to a neighboring county. This situation actually adds value to non-dialysis passengers because the CTC operates more trips to adjacent counties than they would if there were not demand for dialysis transportation and non-dialysis passengers are able to ride. Large Urban Systems Two interviewees from Florida s large urban areas suggested the larger CTCs were in a much better financial position to pay for any increase in demand for dialysis transportation. No large urban CTC interviewee identified money as a problem. Dialysis no-shows can be a problem for CTCs. Two interviewees expressed concern over instances where dialysis patients were not available when the CTC vehicle arrived to pick-up the passenger for a pre-arranged trip. This situation is particularly problematic in rural areas where trip distances are longer and, subsequently, operating costs are greater. 26
39 Chapter 4 Observations and Findings Analysis of the data collected through the on-line survey and the personal interviews provided partial answers to the research questions and resulted in partial fulfillment of the research objectives. Gaps in the research data were a significant contributor to this situation. Two of the underlying assumptions that governed the research are: (1) CTCs produce forecasts which quantified future demand for dialysis transportation; and (2) the severity of the dialysis transportation problem would induce all CTC s to respond to the research surveys proved to be inaccurate assumptions. Research Objectives and Findings Following are findings related to each research objective. Research Objective: Assess how have the supply of and demand for dialysis transportation in Florida changed over the past 5 years. Finding: 22 CTCs responded to the on-line survey. These CTCs reported an increase of approximately 144,000 annual 1-way trips during the five-year period from 282,000 in fiscal year 2008 to 426,000 in fiscal year As a percentage of total trips provided by the reporting CTCs, dialysis transportation trips increased from 11.9% in FY08 to 15.6% in FY12. While dialysis trips represents a larger percentage of the overall service provided by CTC s, the percentage varies greatly from rural systems to small urban systems to large urban systems. Rural CTCs that responded to the survey experienced a decline in dialysis trips as a percentage of total trips from 10.5% to 9.4%. This decline has been consistent over the past 4 fiscal years. Small urban CTCs that responded to the survey experienced an increase in dialysis trips as a percentage of total trips from 8.3% to 13.2%. 80% of this 5% overall increase occurred from FY08 to FY09. CTCs from large urban areas reported an increase in dialysis trips as a percentage of total trips from 11.6% to 18.1% with percentage increases occurring in every fiscal year of the reporting period. 27
40 Research Objective: Determine how dialysis trips are impacting the operations and financial condition of CTCs. Finding: 77 percent of CTCs that responded to the survey indicated they were able to accommodate all dialysis trip requests. The primary factors that prevented CTCs from fulfilling dialysis trip requests included requested trips were outside the service span (i.e., hours of the day and days of the week), insufficient funding, and vehicle availability. Research Objective: Determine how the impacts of dialysis trips differ among rural-oriented CTCs, urban-oriented CTCs, and urban-oriented CTCs. Finding: One-way dialysis trips represent a larger percentage of total one-way trips for urban CTCs. In fiscal year 2012, dialysis trips represented 9.4 percent of total trips for rural CTCs, 13.2 percent for small urban CTCs and 18.1 percent for large urban CTCs. The higher percentages in the urban areas are attributed to the ability of other trip demand to be met by the fixed route and complementary ADA paratransit services available in the urban areas. Research Objective: Identify what unique transportation services are being implemented by CTCs to meet the increasing demand for funded dialysis trips. Finding: The utilization of alternative forms of transportation such as volunteer and voucher programs was rare within the interviewed population. Only 1 interviewee indicated that volunteer transportation was a technique utilized to meet the demand for dialysis transportation, and no CTC identified a voucher initiative as a means to satisfy increasing demand. The same interviewee that implemented a volunteer program had also implemented a mileage reimbursement system to help satisfy increased demand for transportation. Research Objective: Determine how CTCs are preparing for increased transportation demand associated with increased need for dialysis treatment. Finding: The research did not identify any CTC that was formulating specific plans to help them prepare for increased demand for dialysis transportation but the research did document several best practices for the management of their dialysis trips. 28
41 Research Objective: Quantify how the supply of and demand for dialysis transportation is expected to change during the next five years. Finding: Based upon the available data and the input of the CTCs surveyed and interviewed, it was not possible to answer this question. Research Objective: Identify which CTCs in Florida are expected to have the largest gap between demand for and supply of dialysis transportation service. Finding: Based upon the available data and the input of the CTCs surveyed and interviewed, it was not possible to answer this question. Observations Regarding Demand While Florida s CTCs estimated total demand for trips among the transportation disadvantaged population, it appeared that demand for dialysis transportation was not a cohort for which demand estimates were developed. Every CTC acknowledged the transportation challenges faced by dialysis patients and were seeking solutions that minimize negative impacts on the patient. Examples of operational tactics that reflect this concern included making special runs to accommodate a single patient and ensuring the same driver serves the same patient for the duration of treatment to help maximize rider comfort. Observations Regarding Scheduling Twenty-three percent of reporting CTCs were unable to accommodate all dialysis trip requests. Limited funding, vehicle availability, service hours, and days of operation are the greatest barriers. Utilizing transportation vouchers or greater use of subcontracting with taxis are possible tactics to help address this issue. Two of the interviewed CTCs (1 rural and 1 small urban) reported that some dialysis treatment centers adjust chair times to accommodate the needs of the CTC. Similarly, CTCs may selectively extend their service span to provide greater flexibility to accommodate dialysis trips. Two rural CTC interviewees expressed concern over instances where dialysis patients were not available when the CTC vehicle arrived to pick up the passenger for a prearranged trip. This situation is particularly problematic in rural areas where trip distances are longer, and subsequently, operating costs are greater. Two CTCs reported having instituted some type of follow-up counseling for patient and family regarding no-shows. 29
42 Similarly, late trips or when the dialysis treatment is not finished by the scheduled time create operational issues for the CTCs. The need to wait or reschedule the trip to a later time creates delays for other passengers and inefficient operations. The impact of late trips can be minimized with open lines of communication with the dialysis centers. No issue surfaced more frequently in the personal interview process than the issue of relationships between CTCs and dialysis treatment facilities. In general, the CTCs that spoke most favorably about their positive relationships expressed the least amount of concern regarding dialysis transportation. 13 counties represented by reporting CTC s have implemented unique measures to facilitate these relationships including regular and frequent meetings, dedicated personnel to meet with treatment personnel, open communication and dialogue, cooperatively setting up treatment and transportation schedules, giving CTC customers priority in scheduling so as to maximize scheduling efficiencies, grouping dialysis patients from common origin zones, maximizing multi-loading, and ensuring transportation to the nearest treatment facility to the patients home. 30
43 Chapter 5 Best Practices and Recommendations The personal interviews with Florida s CTC have revealed several best practices and recommendations which are summarized as follows: Four of the reporting CTC s have designated a staff person to serve as the designated representative to dialysis treatment facilities. This staff person is responsible for conducting regular and frequent (often monthly) meetings with treatment center personnel, identifying issues and challenges that may be inhibiting the effective delivery of dialysis patients, working collaboratively to solve problems, and ensuring that effective communication exists between the CTC and the dialysis treatment facilities. Three byproducts of improved communications and relations between CTCs and dialysis treatment centers include: o the willingness of some treatment centers to adjust chair times to accommodate the needs of the CTC; o a collaborative approach to chair time and transportation scheduling; and o the willingness of dialysis treatment facilities to provide chair time priority to CTC customers, which helps maximize operational efficiencies for the CTCs. Two of the interviewed CTCs are able to identify dialysis patients who reside within a common geographic trip origination zone and transport them using a single vehicle. Whenever possible, CTCs should maximize multi-loading. Community Transportation Coordinators and Local Coordinating Boards may derive value from implementing a process that measures the number of dialysis trips provided annually and a process for forecasting the demand for dialysis trips. As documented in the literature review, the dialysis process can be an extremely tiring occurrence for patients and creates side effects including nausea, infection, and bleeding. The physical toll on patients caused by the dialysis treatment process typically requires more personalized transportation from dialysis treatment. To help ease both the physical and emotional discomfort of dialysis treatment, several CTCs attempt to provide the same driver for the same patient. Two CTCs for whom no-shows were a problem have implemented follow-up counseling programs to help better inform and educate patients and family members about the operational and financial impacts of the patients failure to fulfill a trip request. 31
44 APPENDIX A SURVEY QUESTIONNAIRE 32
45 33

46 34
47 35
Florida Statewide Agricultural Irrigation Demand
 2017 Florida Statewide Agricultural Irrigation Demand Appendix A Acreage Projections THE BALMORAL GROUP 165 Lincoln Ave Winter Park, FL 32789 407 629 2185 407 629 2183 Appendix A Acreage Projections List
CITIZENS PROPERTY INSURANCE CORPORATION
 (Sheet 1 of 5) Alachua 192 72,001 8.4% 4,390 0.0% 76,391 7.9% Baker 292 8,850 9.1% 38 172.6% 8,888 9.8% Bay 601 Coastal 81,028 10.8% 341 137.0% 81,369 11.3% Bay 721 Remainder 244,441 11.2% 918 144.1% 245,359
Special Report of Baker Act Initiations by County and Judicial Circuit for Children and Adults for Calendar Year 2001 March 2002
 Special Report of Baker Act s by County and Judicial Circuit for Children and Adults for Calendar Year 2001 March 2002 Prepared by: Annette McGaha, Ph.D. Baker Act Reporting Center Louis de la Parte Florida
VOCATIONAL REHABILITATION SERVICES PROVIDER CHOICE DIRECTORY DEMOGRAPHIC INFORMATION FORM
 Please complete this form for each of your locations/offices where you will be serving our VR consumers: Vendor Details FEID Number: Vendor Name: VR Area: Address: City County State Zip Code Contact Person:
Florida PDMP User Survey Methodology
 Florida PDMP User Survey Methodology Florida Prescription Drug Monitoring Program (PDMP) conducted a survey in March 2013 to identify the barriers to PDMP utilization and opportunities for improvement.
Florida Residential Market Sales Activity - August 2015 Closed Sales and Median Sale Prices Statewide and by Metropolitan Statistical Area*
 Statewide and by Metropolitan Statistical Area* State / Metropolitan Statistical Area State of Florida 32,867 $184,000 23,605 $199,900 9,262 $150,000 936 $56,250 Cape Coral-Fort Myers MSA (Lee ) Crestview-Fort
Florida Residential Market Sales Activity - Q Closed Sales and Median Sale Prices Statewide and by Metropolitan Statistical Area*
 Statewide and by Metropolitan Statistical Area* State / Metropolitan Statistical Area State of Florida 86,236 $170,300 59,599 $182,000 26,637 $145,000 3,090 $54,000 Cape Coral-Fort Myers MSA (Lee ) Crestview-Fort
Florida Residential Market Sales Activity - March 2015 Closed Sales and Median Sale Prices Statewide and by Metropolitan Statistical Area*
 Statewide and by Metropolitan Statistical Area* State / Metropolitan Statistical Area State of Florida 35,894 $178,500 24,811 $190,000 11,083 $152,000 1,247 $56,000 Cape Coral-Fort Myers MSA (Lee ) Crestview-Fort
Dear Applicant: Division of Vocational Rehabilitation Vendor Registration Unit. Enclosures
 Dear Applicant: Thank you for your interest in becoming an Individual Interpreting Vendor or Group Interpreting Agency Vendor. Registration with MyFloridaMarketPlace(MFMP) and the Florida Department of
Florida Residential Market Sales Activity Closed Sales and Median Sale Prices
 Florida Residential Market Activity and s Statewide t and by Metropolitan Statistical ti ti Area* State / Metropolitan Statistical Area State of Florida 32,413 $190,000 23,056 $206,500 9,357 $156,500 1,009
Florida Residential Market Sales Activity - Q Closed Sales and Median Sale Prices
 Florida Residential Market Activity - Q2 2015 and s Statewide t and by Metropolitan Statistical ti ti Area* State / Metropolitan Statistical Area State of Florida 110,907 $185,000 77,724 $200,000 33,183
Florida Residential Market Sales Activity - Q Closed Sales and Median Sale Prices Statewide and by Metropolitan Statistical Area*
 Statewide and by Metropolitan Statistical Area* State / Metropolitan Statistical Area All Property Types Single Family Homes Townhouses/Condos State of Florida 118,885 $235,000 80,711 $256,150 34,376 $189,900
Florida Residential Market Sales Activity - July 2018 Closed Sales and Median Sale Prices Statewide and by Metropolitan Statistical Area*
 Statewide and by Metropolitan Statistical Area* State / Metropolitan Statistical Area All Property Types Single Family Homes Townhouses/Condos State of Florida 36,563 $232,500 25,488 $255,000 10,032 $180,000
Table of Contents. 2 P age. Susan G. Komen
 FLORIDA Table of Contents Table of Contents... 2 Introduction... 3 About... 3 Susan G. Komen Affiliate Network... 3 Purpose of the State Community Profile Report... 4 Quantitative Data: Measuring Breast
Candy-Flavored Tobacco. Latonya N. Delaughter, MPA, CWWPM SWAT Coordinator
 Candy-Flavored Tobacco Latonya N. Delaughter, MPA, CWWPM SWAT Coordinator What is flavored tobacco? Flavored tobacco products contain flavors like vanilla, orange, chocolate, cherry and coffee. They are
DEPARTMENT OF HEALTH Division of Disease Control
 DEPARTMENT OF HEALTH Division of Disease Control Bureau of HIV/AIDS Patient Care Section March 22, 2011 BUREAU OF HIV/AIDS Chief, Bureau of HIV/AIDS Tom Liberti Medical Director Jeffrey Beal, MD Biological
North Central Florida Cancer Report 2013
 North Central Florida Cancer Report 2013 Data Covering the North Central Florida Cancer Control Collaborative Region January 2013 North Central Florida Cancer Report 2013 Data Covering the North Central
Introduction. Institute of Medicine, 2002
 2010 Florida Introduction Where we live matters to our health. The health of a community depends on many different factors, including quality of health care, individual behavior, education and jobs, and
Hepatitis Prevention Program UPDATE. Hepatitis Prevention Program Staff
 Hepatitis Prevention Program UPDATE Hepatitis Prevention Program Staff - 2010 PCPG Meeting - Tampa November 9, 2010 Hepatitis A Total Reported Cases 2004-2008 300 250 200 150 100 50 0 2004 2005 2006 2007
Health Maintenance Organization Preferred Provider Organization Medicare Advantage HMO. Blue Medicare HMO My Time Plus Simply Blue Network
 The table below offers a comprehensive list of provider networks. Refer to your service type to determine if the network is open. If the network for your service type is open, complete the appropriate
HIV/AIDS Update PPG/PCPG Mee3ng Marlene LaLota, MPH HIV/AIDS Sec3on Administrator
 HIV/AIDS Update PPG/PCPG Mee3ng Marlene LaLota, MPH HIV/AIDS Sec3on Administrator May 13, 2015 The Epidemic in Florida Population in 2014: 19.6 million à (3 rd in the nation) Newly diagnosed** HIV infections
Statewide Medicaid Managed Care Dental Program Overview. October 2018
 Statewide Medicaid Managed Care Dental Program Overview October 2018 The Dental Component of the Statewide Medicaid Managed Care Program Beginning in December 2018, Medicaid recipients will have a new
PHYSICIAN WORKFORCE SURVEY
 Governor Charlie Crist, State Surgeon General Ana Viamonte Ros and the Florida Legislature recognize the importance of assessing Florida s current and future physician workforce. Section 381.4018, Florida
Hospice Demographic and Outcome Measures
 RICK SCOTT GOVERNOR CHARLES T. CORLEY SECRETARY 2012 REPORT Hospice Demographic and Outcome Measures elderaffairs.state.fl.us 1 2012 R Bureau of Planning & Evaluation, September 2012 Revised March 2013
Florida Arbovirus Surveillance Week 39: September 23-29, 2012
 Florida Arbovirus Surveillance Week 39: September 23-29, 22 Arbovirus surveillance in Florida includes endemic mosquito-borne viruses West Nile virus (WNV), Eastern equine encephalitis virus (EEEV), St.
2015 REPORT. Hospice Demographic and Outcome Measures
 2015 REPORT Hospice Demographic and Outcome Measures Updated February 8, 2016 Table of Contents 1.0 Executive Summary... 1 2.0 Data Collected... 2 3.0 Outcome Measures... 3 3.1 Outcome Measure 1 (OM1)...
FLORIDA DEPARTMENT OF LAW ENFORCEMENT June Report
 FLORIDA DEPARTMENT OF LAW ENFORCEMENT June 2010 2009 Report Data Collection The Office of Vital Statistics reported more than 171,300 deaths occurred in Florida during 2009. Of these, the medical examiners
Evaluation of the Florida Quitline Spanish Language and Prenatal Smoking Cessation Campaigns
 Evaluation of the Florida Quitline Spanish Language and Prenatal Smoking Cessation Campaigns May and June 2006 Florida Department of Health Submitted by: Christopher B. Sullivan, Ph.D. Image Research 912
Florida Oral Health Workforce Statewide Needs Assessment. Prepared for the Florida Department of Health Public Health Dental Program
 Florida Oral Health Workforce Statewide Needs Assessment Prepared for the Florida Department of Health Public Health Dental Program August 2009 CONTRIBUTORS AND ACKNOWLEDGEMENTS Jill Boylston Herndon,
Florida s Oral Health Surveillance Projects. Presenters: Jennifer Wahby and Jasmine Bee July 28, 2016
 Florida s Oral Health Surveillance Projects Presenters: Jennifer Wahby and Jasmine Bee July 28, 2016 1 Older Adult Oral Health Surveillance Jennifer Wahby, MPH Senior Health Services Analyst, Public Health
Number of For-Profit Hospices Has Grown; Current Measures and Standards Are Not Sufficient to Assess Hospice Quality
 January 2010 Report No. 10-09 Number of For-Profit Hospices Has Grown; Current Measures and Standards Are Not Sufficient to Assess Hospice Quality at a glance The 2006 Florida Legislature authorized for-profit
MEMORANDUM. SUBJECT: Ordinance : Prohibition on Medical Marijuana Treatment Center Dispensing Facilities
 DATE: October 4, 2017 MEMORANDUM TO: FROM: Town Commission Dave Bullock, Manager SUBJECT: Ordinance 2017-20: Prohibition on Medical Marijuana Treatment Center Dispensing Facilities On November 8, 2016,
Florida Arbovirus Surveillance Week 42: October 14-20, 2012
 Florida Arbovirus Surveillance Week 42: October 14-2, 212 Arbovirus surveillance in Florida includes endemic mosquito-borne viruses West Nile virus (WNV), Eastern equine encephalitis virus (EEEV), St.
2016 REPORT. Hospice Demographics and Outcome Measures
 2016 REPORT Hospice Demographics and Outcome Measures Table of Contents 1.0 Executive Summary... 1 2.0 Data Collected... 2 3.0 Outcome Measure 1 (OM1)... 2 4.0 Accreditation... 5 5.0 Individual Hospice
FLORIDA DEPARTMENT OF LAW ENFORCEMENT OCTOBER Report
 FLORIDA DEPARTMENT OF LAW ENFORCEMENT OCTOBER 2012 2011 Report Data Collection The Office of Vital Statistics reported more than 172,000 deaths occurred in Florida during 2011. Of these, the medical examiners
Florida Arbovirus Surveillance Week 38: September 16-22, 2012
 Florida Arbovirus Surveillance Week 38: September 16-22, 212 Arbovirus surveillance in Florida includes endemic mosquito-borne viruses West Nile virus (WNV), Eastern equine encephalitis virus (EEEV), St.
1998 FLORIDA ANNUAL CANCER REPORT: Incidence and Mortality
 1998 FLORIDA ANNUAL CANCER REPORT: Incidence and Mortality 2001 1998 Epidemiological Series 01-0329 10-2001 October 2001 Jeb Bush Governor John O. Agwunobi, M.D., M.B.A. Secretary 1998 FLORIDA ANNUAL CANCER
Ethyl Alcohol. Phencyclidine (PCP) PCP Analogs Phenethylamines/ Piperazines Tryptamines. Halogenated Helium Hydrocarbon Nitrous Oxide
 PCP Analogs Phenethylamines/ Piperazines Tryptamines. Halogenated Helium Hydrocarbon Nitrous Oxide") FLORIDA DEPARTMENT OF LAW ENFORCEMENT PUBLISHED NOVEMBER 2018 Data Collection The State of Florida s Bureau of Vital Statistics reported 206,168 deaths in Florida during 2017. Of the 28,031 deaths investigated
FLORIDA DEPARTMENT OF LAW ENFORCEMENT PUBLISHED NOVEMBER 2018 Data Collection The State of Florida s Bureau of Vital Statistics reported 206,168 deaths in Florida during 2017. Of the 28,031 deaths investigated
Statewide Medicaid Managed Care Update. Presented to the Medicaid Medical Care Advisory Committee. July 10, 2018
 Statewide Medicaid Managed Care Update Presented to the Medicaid Medical Care Advisory Committee July 10, 2018 FL Medicaid Managed Care Today A Snapshot Current SMMC Enrollment How Services Are Delivered
Florida Arbovirus Surveillance Week 37: September 9-15, 2012
 Florida Arbovirus Surveillance Week 37: September 9-15, 212 Arbovirus surveillance in Florida includes endemic mosquito-borne viruses West Nile virus (WNV), Eastern equine encephalitis virus (EEEV), St.
The South Florida Report June 2013
 Escambia Santa Rosa Okaloosa Holmes Bay Jacks on Calhoun Gulf Liberty Gadsden Leon Franklin Wakulla Madison Taylor Dixie Hamilton Suwannee Union Gilchrist Alachua Pinellas Levy Citrus Baker Hernando Pasco
Florida Arbovirus Surveillance Week 38: September 14 September 20, 2014
 Florida Arbovirus Surveillance Week 38: September 4 September 2, 24 Arbovirus surveillance in Florida includes endemic mosquito-borne viruses such as West Nile virus (WNV), Eastern equine encephalitis
Florida Arbovirus Surveillance Week 36: September 2-8, 2012
 Florida Arbovirus Surveillance Week 36: September 2-8, 212 Arbovirus surveillance in Florida includes endemic mosquito-borne viruses West Nile virus (WNV), Eastern equine encephalitis virus (EEEV), St.
Final Report of The Epidemiologic Study on Crohn s Disease and Ulcerative Colitis
 Final Report of The Epidemiologic Study on Crohn s Disease and Ulcerative Colitis HB 869 ER (Section 2) Prepared by Bureau of Epidemiology Florida Department of Health February 1, 2006 Jeb Bush Governor
Estimation of County-Level Diabetes Prevalence Using Bayesian Hierarchical Model
 Georgia State University ScholarWorks @ Georgia State University Mathematics Dissertations Department of Mathematics and Statistics Spring 5-10-2017 Estimation of County-Level Diabetes Prevalence Using
TASK FORCE REPORT ON INVOLUNTARY EXAMINATION OF MINORS
 TASK FORCE REPORT ON INVOLUNTARY EXAMINATION OF MINORS Department of Children and Families Office of Substance Abuse and Mental Health November 15, 2017 Mike Carroll Rick Scott Secretary Governor 1 TABLE
Florida Arbovirus Surveillance Week 42: October 14-20, 2018
 Florida Arbovirus Surveillance Week 42: October 4-2, 28 Arbovirus surveillance in Florida includes endemic mosquito-borne viruses such as West Nile virus (WNV), Eastern equine encephalitis virus (EEEV),
Woman and Clinical Trials
 Woman and Clinical Trials Hancy Brignol, MHSA, BSN Project Director-WIHS Department of Medicine Division of Infectious Diseases University of Miami AIDS Clinical Research Unit Southeast AIDS Education
Evaluation of the Florida Quitline. Smoking Cessation Radio Ad Campaigns: Spanish Language. African American. Prenatal Smoking Cessation
 Evaluation of the Florida Quitline Smoking Cessation Radio Ad Campaigns: Spanish Language African American Prenatal Smoking Cessation May and June Florida Department of Health Submitted by: Christopher
Florida Arbovirus Surveillance Week 51: December 16-22, 2018
 Florida Arbovirus Surveillance Week 5: December 6-22, 28 Arbovirus surveillance in Florida includes endemic mosquito-borne viruses such as West Nile virus (WNV), Eastern equine encephalitis virus (EEEV),
The Burden of Kidney Disease in Rural & Northern Ontario
 Ontario Branch The Burden of Kidney Disease in Rural & Northern Ontario Contact: Janet Bick Director, Policy & Programs The Kidney Foundation of Canada Ontario Branch Tel: 905-278-3003/1.800-387-4474 ext.4970
Florida Arbovirus Surveillance Week 47: November 18-24, 2018
 Florida Arbovirus Surveillance Week 47: November 18-24, 218 Arbovirus surveillance in Florida includes endemic mosquito-borne viruses such as West Nile virus (WNV), Eastern equine encephalitis virus (EEEV),
2017 REPORT. Hospice Demographics and Outcome Measures
 2017 REPORT Hospice Demographics and Outcome Measures i 2017 Hospice Demographic and Outcome Measures Report October 2017 Table of Contents Executive Summary... 1 Data Collected... 2 Outcome Measure 1
UNITED STATES COURT INTERPRETER COMPENSATION DATABASE: Chapter 7: Florida Judicial Circuit Courts
 UNITED STATES COURT INTERPRETER COMPENSATION DATABASE: Chapter 7: Florida Judicial Circuit Courts Compiled by Robert Joe Lee and Francis W. Hoeber When the authors began the data collection process, we
Florida Arbovirus Surveillance Week 50: December 9-15, 2018
 Florida Arbovirus Surveillance Week 5: December 9-5, 28 Arbovirus surveillance in Florida includes endemic mosquito-borne viruses such as West Nile virus (WNV), Eastern equine encephalitis virus (EEEV),
Florida Arbovirus Surveillance Week 48: November 25-December 1, 2018
 Florida Arbovirus Surveillance Week 48: November 25-December 1, 218 Arbovirus surveillance in Florida includes endemic mosquito-borne viruses such as West Nile virus (WNV), Eastern equine encephalitis
Florida Arbovirus Surveillance Week 2: January 6-12, 2019
 Florida Arbovirus Surveillance Week 2: January 6-2, 29 Arbovirus surveillance in Florida includes endemic mosquito-borne viruses such as West Nile virus (WNV), Eastern equine encephalitis virus (EEEV),
Year End Summary
 ALZHEIMER S DISEASE INITIATIVE MEMORY DISORDER CLINICS AND FLORIDA BRAIN BANK 2016-2017 Year End Summary This document was created by the staff of the 15 Memory Disorder Clinics and the Florida Brain Bank
Florida Arbovirus Surveillance Week 21: May 20-26, 2018
 Florida Arbovirus Surveillance Week 2: May 2-26, 28 Arbovirus surveillance in Florida includes endemic mosquito-borne viruses such as West Nile virus (WNV), Eastern equine encephalitis virus (EEEV), and
Florida Arbovirus Surveillance Week 52: December 23-29, 2018
 Florida Arbovirus Surveillance Week 5: December 3-9, 18 Arbovirus surveillance in Florida includes endemic mosquito-borne viruses such as West Nile virus (WNV), Eastern equine encephalitis virus (EEEV),
New CDT Codes Announced for 2019
 PATIENT S CHART & X-RAYS FL MEDICAID 24-HR EMERGENCY ACCESS FLU SEASON IS HERE LIBERTY DENTAL PLAN LIBERTY DENTAL PLAN VOLUME 4, Q4 WINTER 2018 LIBERTY QUARTERLY PROVIDER NEWS New CDT Codes Announced for
MODERATE RISK RESIDENTIAL PROGRAMS
 MODERATE RISK RESIDENTIAL PROGRAMS Moderate-risk residential programs are environmentally secure or staff secure facilities. Youth in these programs are allowed limited access to the community. The majority
Help Me Grow Florida Centralized Access Point (CAP)
") Help Me Grow Florida Centralized Access Point (CAP) Tamara Price Help Me Grow 2018 National Forum Seattle, WA 1 Help Me Grow Florida Statewide Affiliates HMGF program is currently implemented in 27 out
Help Me Grow Florida Centralized Access Point (CAP) Tamara Price Help Me Grow 2018 National Forum Seattle, WA 1 Help Me Grow Florida Statewide Affiliates HMGF program is currently implemented in 27 out
Opioid State Targeted Response (STR) Project
 Project") Opioid State Targeted Response (STR) Project Requirement: Frequency: Due Date: The Office of Substance and Abuse and Mental Health (SAMH) Contract On going On going The major goal of Florida's Opioid State
Opioid State Targeted Response (STR) Project Requirement: Frequency: Due Date: The Office of Substance and Abuse and Mental Health (SAMH) Contract On going On going The major goal of Florida's Opioid State
For more information call:
 The Bread of the Mighty Food Bank coordinates the acquisition and distribution of food and basic essentials. 325 NW 10 Ave Gainesville FL 32601 For more information and to find the distribution site closest
(City, State, Zip Code)
") This Partner Agency Agreement, dated this day of, 2015, is between COMMUNITY FOOD SHARE, INC. (CFS), whose address is 650 South Taylor Avenue, Louisville, CO 80027, and (Partner Agency) whose address is
This Partner Agency Agreement, dated this day of, 2015, is between COMMUNITY FOOD SHARE, INC. (CFS), whose address is 650 South Taylor Avenue, Louisville, CO 80027, and (Partner Agency) whose address is
Areas 3/13 HIV/AIDS Prevention Needs Assessment
 Areas 3/13 HIV/AIDS Prevention Needs Assessment June 2010 Area 3/13 HIV/AIDS Prevention Needs Assessment WellFlorida Council Shane Bailey, MBA/HCM, CHES Project Coordinator Sandra Carroll Data and Technology
Impact of Florida s Medicaid Reform on Recipients of Mental Health Services
 Impact of Florida s Medicaid Reform on Recipients of Mental Health Services Jeffrey Harman, PhD John Robst, PhD Lilliana Bell, MHA The Quality of Behavioral Healthcare : A Drive for Change Through Research
Community-Based Coalitions: Influencing policy & practice
 University of South Florida From the SelectedWorks of May, 2011 Community-Based Coalitions: Influencing policy & practice Available at: https://works.bepress.com/florida_coveringkidsandfamilies/4/ May
2011 Cancer Committee Annual Report Shands at the University of Florida
 Cancer Committee Annual Report Shands at the University of Florida with statistical data from Message from the Shands at UF Cancer Committee Chair This report represents my final duty as out-going chair
SWAT Youth Across Florida Are Educating Their Communities And Their Community Leaders About Flavored Tobacco Products
 0 Students Working Against Tobacco SWAT Youth Across Florida Are Educating Their Communities And Their Community Leaders About Flavored Tobacco Products 1 SWAT s Statewide Mission Educate community leaders
Report of Pinellas Data Collaborative CJIS System Change Over Time 2007 Findings DRAFT
 Report of Pinellas Data Collaborative CJIS System Change Over Time 2007 Findings Submitted by Policy Services & Research Data Center Mental Health Law & Policy Florida Mental Health Institute University
Cache Valley Transit District
 Cache Valley Transit District Limited English Proficiency Plan (LEP Plan) Page 1 of 5 Introduction This Limited English Proficiency (LEP) Plan has been prepared to address the responsibilities of the Cache
Report of Pinellas Data Collaborative CJIS System Change Over Time 2007 Findings. Final
 Report of Pinellas Data Collaborative CJIS System Change Over Time 2007 Findings Submitted by Policy Services & Research Data Center Mental Health Law & Policy Florida Mental Health Institute University
Lake Charles Transit System (LCTS) Application for Para-Transit Service Program
 Application for Para-Transit Service Program") Lake Charles Transit System (LCTS) Application for Para-Transit Service Program Only original applications are accepted. No faxed copies allowed. If you have physical difficulties that prevent you from
Lake Charles Transit System (LCTS) Application for Para-Transit Service Program Only original applications are accepted. No faxed copies allowed. If you have physical difficulties that prevent you from
Meetings Attendees Public Speakers MPO Board Citizens Advisory Advisory
 Chapter 4: Measuring Participation Opportunities Public input is a critical component of the success of the MPO s efforts, and the agency consistently evaluates its participation opportunities for convenience
Public Health Dental Program
 Public Health Dental Program Water Fluoridation Project SEAN ISAAC, MPH WATER FLUORIDATION PROJECT COORDINATOR FLORIDA DEPARTMENT OF HEALTH PUBLIC HEALTH DENTAL PROGRAM JULY 28, 2016 STATEWIDE DENTAL PERFORMANCE
Calendar of Trainings June to September 2018
 The Best Ride: Customer Service and Passenger Assistance with Hands-on Wheelchair Securement (5-8 Hours) This 5-8-hour course is designed to introduce and reinforce passenger assistance techniques in a
Laboratory services for the diagnosis and management of TB, MDR-TB, XDR-TB in HIV co-infected patients
 Laboratory services for the diagnosis and management of TB, MDR-TB, XDR-TB in HIV co-infected patients Max Salfinger Fogarty Workshop on TB/HIV Cali, Colombia - March 28, 2007 John E. Fogarty Bricklayer;
Current through Chapter 199 and Chapters of the 2015 Legislative Session
 26-21-101. Short title. 26-21-101. Short title This article shall be known and may be cited as the "Colorado Commission for the Deaf and Hard of Hearing Act". Cite as C.R.S. 26-21-101 History. L. 2000:
North Central Florida Regional Planning Council
 North Central Florida Regional Planning Council 1 Medical Marijuana Sandra Joseph, Senior Planner Local Government Comprehensive Planning June 16, 2017 2 Overview Compassionate Medical Cannabis Act (2014
An Evaluation of the Success of Saving-Growing Personal Assets Project: Individual Development Accounts for People with Developmental Disabilities
 The Institute for Health, Health Care Policy, and Aging Research An Evaluation of the Success of Saving-Growing Personal Assets Project: Individual Development Accounts for People with Developmental Disabilities
The Roles Local Health Departments Play in the Organization and Provision of Perinatal Services
 The Roles Local Health Departments Play in the Organization and Provision of Perinatal Services Public health efforts to reduce maternal complications and poor pregnancy outcomes encompass a wide array
Ministry of Children and Youth Services. Follow-up to VFM Section 3.01, 2013 Annual Report RECOMMENDATION STATUS OVERVIEW
 Chapter 4 Section 4.01 Ministry of Children and Youth Services Autism Services and Supports for Children Follow-up to VFM Section 3.01, 2013 Annual Report RECOMMENDATION STATUS OVERVIEW # of Status of
Patient Advisory Committee
 IPRO End-Stage Renal Disease Network Program Patient Advisory Committee esrd.ipro.org Congratulations on your new role as a Patient Advisory Committee (PAC) participant, and welcome to the IPRO ESRD Network
Martha s Vineyard Transit Authority (VTA) ADA Policies and Procedures
 ADA Policies and Procedures") Martha s Vineyard Transit Authority (VTA) ADA Policies and Procedures APPROVED December 13, 2007 AMENDED November 2014 July 2015 January 2016 1 TABLE OF CONTENTS Types of Service Page 3 Definitions Page
Martha s Vineyard Transit Authority (VTA) ADA Policies and Procedures APPROVED December 13, 2007 AMENDED November 2014 July 2015 January 2016 1 TABLE OF CONTENTS Types of Service Page 3 Definitions Page
Calendar of Trainings July to September 2018
 : Customer Service and Passenger Assistance with Hands-on Wheelchair Securement (5-8 Hours) This 5-8-hour course is designed to introduce and reinforce passenger assistance techniques in a community transportation
SUSAN G. KOMEN NORTHEAST LOUISIANA EXECUTIVE SUMMARY
 SUSAN G. KOMEN NORTHEAST LOUISIANA EXECUTIVE SUMMARY Acknowledgments The Community Profile Report could not have been accomplished without the exceptional work, effort, time and commitment from many people
The Development of Optimal On- Premise Electronic Message Center (EMC) Lighting Levels and Sign Lighting Measurement Techniques
 Lighting Levels and Sign Lighting Measurement Techniques") The Development of Optimal On- Premise Electronic Message Center (EMC) Lighting Levels and Sign Lighting Measurement Techniques Prepared by The Pennsylvania State University The Pennsylvania State University
The Development of Optimal On- Premise Electronic Message Center (EMC) Lighting Levels and Sign Lighting Measurement Techniques Prepared by The Pennsylvania State University The Pennsylvania State University
REQUEST FOR PROPOSALS FOR CY 2019 FUNDING. Issue Date: Monday, July 30, Submission Deadline: 5:00 p.m., Friday, August 24, 2018
 REQUEST FOR PROPOSALS FOR CY 2019 FUNDING Issue Date: Monday, July 30, 2018 Submission Deadline: 5:00 p.m., Friday, August 24, 2018 NOTE: RFP proposals received after the deadline will not be considered.
Expanding Language Access Strategies in Palm Beach County. A Project of the Palm Beach Medical Society. In Collaboration with the:
 Expanding Language Access Strategies in Palm Beach County A Project of the Palm Beach Medical Society In Collaboration with the: Issued November 2010 The Freimann Initiative: A joint funding venture of
Policy Research CENTER
 TRANSPORTATION Policy Research CENTER Value of Travel Time Knowingly or not, people generally place economic value on their time. Wage workers are paid a rate per hour, and service providers may charge
The Mapping and Analysis of Transportation Needs in Haliburton County Analytical Report. Breanna Webber Viyanka Suthaskaran
 The Mapping and Analysis of Transportation Needs in Haliburton County Analytical Report Breanna Webber Viyanka Suthaskaran Host Organization: Haliburton Transportation Task Force Table Of Contents Introduction
Florida MIECHV Community Collaboration Report: PARTNER Tool Survey
 2014-2015 Florida MIECHV Community Collaboration Report: PARTNER Tool Survey Amber Warren, Rema Ramakrishnan, Pamela Birriel, Paige Alitz, & Jennifer Marshall Florida MIECHV Evaluation Team Introduction
ORAL HEALTH EMERGENCY ROOM SPENDING IN FLORIDA* AN AVOIDABLE HEALTHCARE COST
 ORAL HEALTH EMERGENCY ROOM SPENDING IN FLORIDA* HOSPITAL EMERGENCY ROOM DENTAL CARE VISITS DRAMATICALLY INCREASING More than 115, hospital emergency room visits in were for dental care with charges exceeding
Interpretype Video Remote Interpreting (VRI) Subscription Service White Paper September 2010
 Subscription Service White Paper September 2010") Interpretype Video Remote Interpreting (VRI) Subscription Service White Paper September 2010 Overview: Interpretype Video Remote Interpreting (VRI) Subscription Service is a revolutionary method of scheduling,
Interpretype Video Remote Interpreting (VRI) Subscription Service White Paper September 2010 Overview: Interpretype Video Remote Interpreting (VRI) Subscription Service is a revolutionary method of scheduling,
Position Profile Chief Executive Officer Feeding America San Diego San Diego, CA
 Position Profile Chief Executive Officer Feeding America San Diego San Diego, CA Feeding America San Diego is seeking an experienced and inspirational Chief Executive Officer to lead this impactful and
2016 Social Service Funding Application Non-Alcohol Funds
 2016 Social Service Funding Application Non-Alcohol Funds Applications for 2016 funding must be complete and submitted electronically to the City Manager s Office at ctoomay@lawrenceks.org by 5:00 pm on
Reducing Disability in Alzheimer s Disease: An Exercise Intervention for Caregiving Families
 Reducing Disability in Alzheimer s Disease: An Exercise Intervention for Caregiving Families Salli Bollin, MSW Alzheimer s Association Northwest Ohio Chapter Heather L. Menne, PhD Margaret Blenkner Research