The Apathy Evaluation Scale: A Comparison of Subject, Informant, and Clinician Report in Cognitively Normal Elderly and Mild Cognitive Impairment
|
|
|
- Kory Boone
- 5 years ago
- Views:
Transcription
1 The Apathy Evaluation Scale: A Comparison of Subject, Informant, and Clinician Report in Cognitively Normal Elderly and Mild Cognitive Impairment The Harvard community has made this article openly available. Please share how this access benefits you. Your story matters Citation Guercio, Brendan John The Apathy Evaluation Scale: A Comparison of Subject, Informant, and Clinician Report in Cognitively Normal Elderly and Mild Cognitive Impairment. Doctoral dissertation, Harvard Medical School. Citable link Terms of Use This article was downloaded from Harvard University s DASH repository, and is made available under the terms and conditions applicable to Other Posted Material, as set forth at nrs.harvard.edu/urn-3:hul.instrepos:dash.current.terms-ofuse#laa
2 Conclusion: In individuals at risk for AD, the AES-C predicts progression from MCI to AD dementia and lower inferior temporal cortical thickness. 2
3 Table of Contents: Glossary of abbreviations and Acknowledgements Section 1: Introduction Section 2: Methods Section 3: Results Section 4: Discussion, Limitations, Conclusions, and Suggestions for Future Work References Tables and Figures 3
4 Glossary of Abbreviations: Alzheimer s disease (AD); Alzheimer s Disease Neuroimaging Initiative (ADNI); American National Adult Reading Test (AMNART); amnestic mild cognitive impairment (MCI); Apathy Evaluation Scale (AES); Apathy Evaluation Scale, clinician-reported (AES-C); Apathy Evaluation Scale, informant-reported (AES-I); Apathy Evaluation Scale, subject-reported (AES- S); Clinical Dementia Rating (CDR); cognitively normal (CN); confidence interval (CI); hazard ratio (HR); Intelligence Quotient (IQ); magnetic resonance imaging (MRI); Magnetization Prepared Rapid Acquisition Gradient Echo (MP-RAGE); Mini-Mental State Examination (MMSE); Neuropsychiatric Inventory (NPI); Pittsburgh Compound B Positron Emission Tomography (PiB PET); regions of interest (ROI); Rey Auditory Verbal Learning Test (RAVLT); versus (vs.) Acknowledgements: This research was supported by R01 AG027435, K23 AG033634, K24 AG035007, the Rosalinde and Arthur Gilbert Foundation/AFAR New Investigator Awards in Alzheimer s Disease, the Massachusetts Alzheimer s Disease Research Center (P50 AG005134), and the Harvard Aging Brain Study (P01 AGO36694, R01 AG037497). Authors have also received research salary support from the Harvard Medical School Scholars in Medicine Office. The authors have received research salary support from Janssen Alzheimer Immunotherapy (GAM, REA), Wyeth/Pfizer Pharmaceuticals (GAM, REA), Eisai Inc. (GAM), Eli Lilly and Company (GAM), Avid Radiopharmaceuticals (KAJ), and Bristol-Myers-Squibb (GAM, RAS). 4
5 Contributing Investigators to the Current Study Brendan Guercio, B.S.: First author. Reviewed literature and designed initial research questions in concert with Dr. Gad Marshall; conducted statistical analyses for cross-sectional MRI study; conducted statistical analyses for baseline characteristics of participants in longitudinal study; interpreted results in concert with Dr. Gad Marshall and Dr. Joseph Locascio; wrote following report, edited subsequently by Dr. Marshall. Joseph J. Locascio, Ph.D.: Conducted statistical analyses for data reduction, mixed effects models, and Cox survival analyses. Contributed significantly to creation of tables and figures, and to prose of the following manuscript and published manuscript. Nancy J. Donovan, M.D.: Contributed to editing and revision of published manuscript. Also conducted subject interviews and data collection. Andrew Ward, B.A.: Processed MRI data, verifying region of interest parcellations and performing minor edits. Also contributed to editing and revision of published manuscript. Catherine E. Munro, B.A.: Managed database and conducted subject assessments and data collection. Aaron Schultz, Ph.D.: Managed database and contributed to editing and revision of published manuscript. Sarah L. Aghjayan, B.A.: Managed database. Natacha Lorius, B.A.: Managed database, conducted subject assessments and data collection, and contributed to editing and revision of published manuscript. Sarah E. Wigman, B.A.: Managed database, conducted subject assessments and data collection, and processed MRI data. Rebecca E. Amariglio, Ph.D.: Contributed to editing and revision of published manuscript. Also conducted subject interviews and data collection. Dorene M. Rentz, Psy.D.: Contributed to editing and revision of published manuscript. Also conducted subject interviews and data collection. Keith A. Johnson, M.D.: Contributed to editing and revision of published manuscript. Reisa A. Sperling, M.D. : Contributed to editing and revision of published manuscript. Also conducted subject interviews and data collection. 5
6 Gad A. Marshall, M.D.: Principle investigator; helped Brendan Guercio design initial research questions; instructed Brendan Guercio in performance of statistical analyses; helped Brendan Guercio interpret results; edited and revised the published manuscript and the following report. Also conducted subject interviews and data collection. 6
7 SECTION 1: INTRODUCTION Alzheimer s disease (AD) dementia, a devastating neurodegenerative disorder, is projected to grow in prevalence over the next three decades to 13.8 million in the United States alone (1, 2). Effective, diseasemodifying therapies are desperately needed to address this growing epidemic. Despite significant efforts to develop such therapies, few clinical trials have shown clinically significant benefit (3-5). The lack of efficacy observed in these trials may be due to the need for earlier diagnosis and intervention in the AD process to produce clinically apparent benefit (6). This hypothesis is supported by evidence that AD pathology such as amyloid plaque deposition and neuronal degeneration begins to manifest in the brain far before symptoms of dementia develop (7-9). Therefore, this preclinical time window may offer a more advantageous period for therapeutic intervention (6). Recent guidelines have begun to define the preclinical phase of AD, wherein occult amyloidosis and neuronal injury may be accompanied by subtle cognitive changes prior to clinically apparent cognitive and functional impairment (2); however, these diagnostic criteria still lack sufficient sensitivity and specificity for use in the clinical setting, and further characterization of the preclinical phase of AD is needed. Furthermore, in order to evaluate the efficacy of new therapeutics in this time window, clinical trials require biomarkers that track the disease progress early and reliably (2). A sufficient number of AD biomarkers have yet to be identified and validated for these purposes (2). This need has instigated a broad search for biomarkers that arise early in AD pathology (10-12). The detection of amyloid- via Pittsburgh Compound B (PiB) positron emission tomography (PET) imaging, which visualizes fibrillar amyloid- in vivo (13) can function as an early biomarker for preclinical AD; however, this marker alone may not be sufficient to predict progression to AD dementia (14). In recent years, great progress has been made in characterizing amnestic mild cognitive impairment (MCI), a prodromal phase to clinical AD dementia with a progression rate to AD dementia of around 10-15% per year (15-17), characterized by memory impairment with largely preserved activities of daily living and preserved cognition outside of memory (18). While this represents an important step toward achieving earlier diagnosis of underlying AD pathology, many people with MCI do not progress to AD dementia, and although certain markers suggest more rapid transition to AD dementia (19-23), it is not yet possible to determine with certainty who will and will not progress. Furthermore, even if individuals who would ultimately progress to AD dementia could be accurately diagnosed during MCI, the underlying pathology of AD may long precede the onset of MCI (8) and there is no data to confirm that intervention at this point in the disease process would be early enough to yield clinical benefits. Therefore, more predictive markers are needed for sufficiently early diagnosis. One of the earliest neuropsychiatric symptoms in AD dementia and MCI is apathy, characterized by social withdrawal and loss of goal oriented behavior, interest, and motivation (24-27). Apathy has been found to 7
8 predict progression from MCI to AD dementia, as well as global functional decline and cognitive decline in cognitively normal (CN) elderly (28-32). These predictive qualities suggest that measurement of apathy may be useful for earlier and more accurate diagnosis of preclinical AD and early prodromal AD (33). Given the complexity of predicting incidence of AD, experts believe that early diagnosis of AD will require integration of information regarding multiple biomarkers.(2) Apathy has been shown to correlate with several biomarkers in the context of AD dementia, including specific patterns of cortical atrophy, most consistently atrophy of the medial frontal cortex, though the precise region of apathy-associated cortical atrophy has varied between studies (34-36). In general, cortical thinning has been detected in CN elderly individuals with greater amyloid burden seen on PiB PET (9, 37) and apathy has been associated with increased cortical amyloid burden in MCI (38). Accordingly, cortical thinning has been detected in CN individuals with low cerebrospinal fluid amyloid (39). Therefore, atrophy associated with apathy in AD dementia patients may begin during MCI and possibly even in CN individuals at risk for AD. While apathy is known to manifest at the stage of MCI, which can represent prodromal AD, the possibility of apathy-associated atrophy in CN individuals potentially at the preclinical stage of AD remains relatively unexplored. In a study of mild AD dementia, MCI, and CN individuals from the AD Neuroimaging Initiative (ADNI), Donovan et al. found that reduced baseline inferior temporal cortical thickness was predictive of greater apathy over time across all diagnoses (40). This reduced thickness may have indicated cortical atrophy associated with AD pathology, atrophy associated with normal aging, or innately reduced inferior temporal cortical thickness which could predispose toward the development of apathy. If AD induced, apathy-associated cortical atrophy is found in the preclinical or prodromal stages of disease, it may be a useful biomarker for clinical trials involving the earliest stages of AD. Furthermore, not all cases of MCI advance to AD dementia (15). If detection of apathy with regionally specific atrophy in MCI or CN individuals is predictive of such progression, these markers may be useful for earlier and more accurate diagnosis of AD. Such clinical applications, however, would require a validated, standard metric for apathy. Studies of apathy in the context of MCI and AD dementia have used a variety of scales to measure apathy. Scales designed to assess multiple neuropsychiatric symptoms, among those apathy, include the Frontal Systems Behavioral Inventory (31, 41), the Neuropsychiatric Inventory brief questionnaire (30), and the full Neuropsychiatric Inventory questionnaire (28, 34-36, 42, 43), which quantifies apathy with a score ranging from 0 to 12 points (44). Scales designed to assess apathy alone using multiple items include the 14-item Apathy Scale (29) and the Apathy Inventory (45). Another promising metric for apathy in patients with dementia is the Apathy Evaluation Scale (AES), which uses 18 specific items to quantify apathy with a score range from 18 to 72 and has been shown to differentiate patients with probable AD dementia from CN elderly according to severity of apathy (46, 8
9 47). This scale can be scored by one of three reporters, resulting in the three sub-scales: the subject (self)- reported AES (AES-S), informant-reported AES (AES-I) or clinician-reported AES (AES-C). It is unclear if any one of the three AES reporter-dependent sub-scales provides particular advantages as a predictor of MCI or AD dementia compared to the other sub-scales. In order to explore the utility of the three AES sub-scales in the context of individuals at risk for AD due to MCI and/or advanced age in the case of CN elderly we conducted a longitudinal study of CN and MCI elderly subjects. A preliminary factor analysis was employed to identify clusters of symptoms driving AES scores in this sample. We then assessed the longitudinal course of apathy as measured by each sub-scale, as well as by these clusters of symptoms, taking into consideration the initial diagnosis (CN or MCI). Finally, we assessed the ability of initial apathy severity to predict disease progression designated as transitioning from a diagnosis of MCI to AD dementia. We hypothesized that a worse initial diagnosis (MCI as opposed to CN) would predict greater apathy over time. We further hypothesized that in MCI the informant and clinicianreported sub-scales as opposed to the subject sub-scale will best predict disease progression because these individuals already have cognitive impairment, which could compromise the accuracy of their self-report of symptoms. Finally, we investigated the possibility of apathy-associated regionally specific cortical atrophy in MCI and CN individuals cross-sectionally, employing the AES-C to measure apathy and magnetic resonance imaging (MRI) to assess regional cortical thickness. We hypothesized that greater apathy in MCI and CN individuals would be associated with atrophy of medial frontal regions, as has been demonstrated previously in AD dementia (34-36), and with inferior temporal atrophy as was seen in individuals with milder cognitive impairment (40). The results of the cross-sectional study of associations between apathy and patterns of cortical thickness are currently in press (33). A full citation for that publication and a description of each author s contribution are as follows: Guercio, B.J., Donovan, N.J., Ward, A., Schultz, A., Lorius, N., Amariglio, R.E., Rentz, D.M., Johnson, K.A., Sperling, R.A., Marshall, G.A. Apathy is associated with lower inferior temporal cortical thickness in mild cognitive impairment and normal elderly. The Journal of Neuropsychiatry & Clinical Neurosciences, in press. Brendan Guercio, B.S.: First author. Reviewed literature and designed initial research question in concert with Dr. Gad Marshall; conducted all statistical analyses; interpreted results in concert with Dr. Gad Marshall; created initial publication subsequently edited by co-authors. 9
10 Nancy J. Donovan, M.D.: Contributed to editing and revision of publication. Also conducted subject interviews and data collection. Andrew Ward, B.A.: Processed MRI data, verifying region of interest parcellations and performing minor edits; contributed to editing and revision of publication. Contributed to editing and revision of publication. Aaron Schultz, Ph.D.: Managed database and contributed to editing and revision of published manuscript. Natacha Lorius, B.A.: Managed database, conducted subject assessments and data collection, and contributed to editing and revision of published manuscript. Rebecca E. Amariglio, Ph.D.: Contributed to editing and revision of published manuscript. Also conducted subject interviews and data collection. Dorene M. Rentz, Psy.D.: Contributed to editing and revision of publication. Also conducted subject interviews and data collection. Keith A. Johnson, M.D.: Contributed to editing and revision of publication. Reisa A. Sperling, M.D.: Contributed to editing and revision of publication. Also conducted subject interviews and data collection. Gad A. Marshall, M.D.: Senior author. Helped Brendan Guercio design initial research question; conducted subject interviews and clinical data collection; taught Brendan Guercio how to conduct statistical analyses; helped Brendan Guercio interpret results; edited and revised publication. 10
11 SECTION 2: METHODS 1. Longitudinal Study of AES Sub-Scales Subjects Seventy five subjects (57 MCI, 18 CN) ages 53 to 86 were recruited from the clinic and community to participate in an investigator-initiated study at the Brigham and Women s Hospital and Massachusetts General Hospital Center for Alzheimer Research and Treatment where they underwent clinical assessments. At baseline, all subjects had generally good or stable health status, and did not have significant cerebrovascular disease or current primary psychiatric disorders. Specifically, subjects had a Modified Hachinski Ischemic Score 4 (48) and a Geriatric Depression Scale (long form) 10 (49). Subjects had a study partner for the provision of collateral information about the subjects behavior, mood, and daily functioning. Specific baseline inclusion criteria for CN subjects were as follows: CN with Clinical Dementia Rating (CDR) global score of 0 (50), Mini-Mental State Examination (MMSE) score of (inclusive) (51), and performance above education adjusted cutoff scores on the Logical Memory IIa (story recall) of the Wechsler Memory Scale-Revised (52). Of note, one subject received a diagnosis of CN despite a CDR global score of 0.5 after careful review by experienced clinicians (GAM and REA). Specific baseline inclusion criteria for MCI subjects satisfied criteria for single or multiple domain amnestic MCI and were as follows: non-demented subjects with memory complaint, performance below education adjusted cutoff scores on Logical Memory IIa (story recall), CDR global score of 0.5 (with Memory Box score 0.5), MMSE score of (inclusive), and essentially preserved activities of daily living. Of note, two subjects received a diagnosis of MCI despite an MMSE of 23 after careful review by experienced clinicians (GAM and REA). Follow-up diagnoses were determined at consensus meetings by experienced clinicians (GAM and REA) after careful review of current and previous neuropsychological test performance, CDR scores, and the Functional Activities Questionnaire scores (a measure of instrumental activities of daily living) (53). Clinicians were blinded to AES scores when determining diagnosis. At follow-up subjects were assigned a diagnosis of CN, MCI, or AD dementia. The study was approved by the local Institutional Review Board, and informed consent was obtained from all subjects before any of the study procedures were carried out. Clinical Assessments The Apathy Evaluation Scale (AES) (46): Apathy was quantified using the AES, consisting of 18 items relating to apathy, each scored on a 4-point Likert-type scale. The score range for the complete AES (total AES score) is 18 to 72, with a lower score indicating greater apathy. Scores for items 6, 10 and 11 are reversed prior 11
12 to summation of individual item scores. For each subject, three AES sub-scale scores were collected, with each sub-scale based on the impressions of a different respective reporter: the subject or self-report (AES-S); an informant, usually a family member or close friend (AES-I); and the clinician (AES-C). For the AES-C, the clinician takes into consideration both the subject and informant report and uses his or her clinical acumen to determine the score for each item. The Rey Auditory Verbal Learning Test (RAVLT) total learning score was used to assess memory (54); the Wechsler Adult Intelligence Scale-Revised Digit Symbol test was used to assess aspects of executive function, including processing speed, visual scanning, and working memory (55); and the American National Adult Reading Test (AMNART) intelligence quotient (IQ) was used as an estimate of premorbid verbal IQ, a proxy of cognitive reserve (56). Statistical Analysis We employed SAS version 9.4 (the Mixed and Phreg procedures) (SAS Software) for primary analyses and SPSS version 22 (IBM) for analyses of baseline characteristics. Derivation of Symptom Clusters by Factor Analysis: A preliminary factor analysis was applied to the AES-C to assess key clusters of symptoms driving AES scores in MCI and CN elderly. We reduced the 18 AES items for each AES sub-scale (AES-S, AES-I, and AES-C) to an empirically derived set of symptom clusters via factor analysis. Using baseline AES-C items as representative for data reduction purposes, we ran correlated (oblique) promax factor analysis, pooling across subjects diagnosed as MCI or CN. After determining factors, respective factor scores were computed for each sub-scale (AES-S, AES-I, AES-C) by taking the average of the corresponding items loading heavily on each given factor. Longitudinal Analysis: We took two approaches to longitudinal data analysis: (1) using a mixed fixed and random effects model to test prediction of AES sub-scale scores and symptom clusters (factors) across time, and (2) using a Cox regression/survival analysis of predictors of time to progression from a diagnosis of MCI to AD dementia. Mixed Effects Models: A mixed random and fixed coefficient regression model was used with backward elimination (p<0.05 cutoff) of both fixed and random terms, for the dependent variables of the 3 AES sub-scale scores, each in a separate analysis. In order to account for relationships between apathy and diagnosis (CN vs. MCI) over time, each model included as fixed predictors diagnosis (CN vs. MCI), time (measured as year in 12
13 study) and the interaction between the two. To examine the relationship between apathy and sex over time, we also included as fixed predictors sex and its interaction with time. Given the possibility that sex may modify relationships of apathy with diagnosis and vice versa, we also included as fixed predictors the interaction between sex and diagnosis as well as the three-way interaction between sex, diagnosis, and time. Finally, each model also included as fixed covariates age at baseline and AMNART IQ. Random terms were correlated intercepts and linear slope of change across time. Parallel analyses were run for each symptom cluster (factor) score as measured by each sub-scale (AES-S, AES-I, and AES-C), each in a separate analysis, using the same set of predictors except that interaction terms were limited to interaction of baseline diagnosis with time and of sex with time to avoid capitalizing on chance due to a large number of significance tests. Partial regression coefficient estimates ( ) values with 95% confidence intervals (CI) were reported. The squared correlations of predicted values from fixed and random predictor sets vs. actual values were used to indicate the percent of variance of the dependent variable linearly accounted for by the optimal reduced model. Residuals from fixed and random components of models were checked graphically for model fit and conformance to assumptions of normality and homogeneity of variance. Cox Model: We employed Cox proportional hazards multiple regression models to assess time to change in diagnosis from a baseline diagnosis of MCI to an endpoint diagnosis of AD dementia. Of the 18 CN subjects in the study, none progressed to MCI over a period of 0.7±0.7 years, and therefore no hazard ratios (HR) were calculated for progression from CN to MCI. Only subjects diagnosed as MCI at baseline were included in these analyses. Those who remained stable at MCI were treated as censored observations providing partial information on time to change in diagnosis. Predictors were tested in a backward elimination algorithm (cutoff p<0.05). Four Cox regression models were performed to separately assess the following AES measures as predictors of diagnostic progression: (1) the three AES sub-scale scores (AES-S, AES-I, and AES-C); (2) scores of the three symptom clusters (factors) as measured by the AES-S; (3) scores of the three symptom clusters (factors) as measured by the AES-I; and (4) scores of the three symptom clusters (factors) as measured by the AES-C. These various AES constructs were included in the initial pool of predictors for their respective Cox regressions. The initial pool of predictors in all Cox regressions also included: sex, AMNART IQ, and baseline values of age, Digit Symbol score, and RAVLT total learning score. For each analysis, after backward elimination produced an optimal subset of predictors, the validity of the proportional hazard model assumption was tested for each of the retained predictors using a Kolmogorov simulation test (see SAS Phreg Procedure). 2. Cross-Sectional Study of Associations between Apathy and Cortical Thickness 13
14 Subjects Sixty six subjects (47 MCI, 19 CN) ages 53 to 86 were recruited from the clinic and community to participate in an investigator-initiated imaging study at the Brigham and Women s Hospital and Massachusetts General Hospital Center for Alzheimer Research and Treatment where they underwent clinical assessments and MRI scans. Inclusion and exclusion criteria for subjects in this portion of the study were identical to those described for the longitudinal analysis of AES sub-scales above, as were criteria for diagnosis of subjects as either MCI or CN (see Methods: 1. Longitudinal Analysis of AES Sub-Scales: Subjects ). The study was approved by the local Institutional Review Board, and informed consent was obtained from all subjects before any of the study procedures were carried out. Clinical Assessments Clinician-Rated Apathy Evaluation Scale (AES-C) (46): Apathy for this MRI component of the study was quantified using the AES-C. Results from the Cox proportional hazards analysis showed that among the AES sub-scales the AES-C is the most significant predictor of progression from MCI to AD dementia (see Results below). Moreover, the AES-C has the best distributed scores among the AES sub-scales. As in the longitudinal study of the AES sub-scales, the RAVLT total learning score was used to assess memory (54); the Wechsler Adult Intelligence Scale-Revised Digit Symbol test was used to assess aspects of executive function, including processing speed, visual scanning, and working memory (55); and the AMNART IQ was used as an estimate of premorbid verbal IQ, a proxy of cognitive reserve (56). MRI Data MRI scans were conducted with a Siemens Trio 3T scanner (Siemens Medical Systems, Erlangen Germany). High-resolution T1-weighted structural images were acquired using a 3D Magnetization Prepared Rapid Acquisition Gradient Echo (MP-RAGE) sequence with the following acquisition parameters: repetition time=2300ms; echo time=2.98ms; inversion time=900ms; flip angle=9 ; voxel size=1.0x1.0x1.2mm. Cortical thickness of regions of interest (ROI) was measured using FreeSurfer Version 5.1 ( A priori ROI included: 1) inferior temporal cortex 2) rostral anterior cingulate cortex; 3) medial orbitofrontal cortex; and 4) supramarginal cortex. We chose to focus on cortical regions rather than deep subcortical structures. The anterior cingulate and medial orbitofrontal cortices have been associated with apathy across imaging modalities in AD dementia (42, 57-61); the inferior temporal cortex has been associated with apathy in a similar early AD sample in ADNI (40); and the supramarginal cortex was chosen because it has been associated with early AD though less consistently with apathy (62, 63). Cortical 14
15 thickness for each ROI was averaged across both hemispheres. A single individual (AMW) blinded to the clinical status of the subjects verified ROI parcellations and performed minor edits. The mean interval between MRI acquisition and clinical assessment was 35±36 days. Statistical Analyses All analyses were carried out using SAS Version 9.2 (SAS Software) and SPSS Version 20 (IBM). Associations among diagnostic groups, subject demographics and characteristics were evaluated using the chisquare test for categorical variables and two-tailed independent-samples t-tests for continuous variables; if Levene s test indicated unequal variances, two-tailed Welch s t-test was performed instead. Variances of demographic and characteristic data were assessed for normality using One-Sample Kolmogrov-Smirnov tests and frequency histograms; independent-samples Mann-Whitney U tests were used if variables demonstrated non-normal distributions. Associations between AES-C score and subject demographics and characteristics were evaluated using independent-sample t-tests for categorical variables and Pearson correlations for continuous variables. A general linear regression model with backward elimination (cutoff p<0.05) was used to evaluate the cross sectional relationship of the dependent variable, apathy (measured by AES-C score), with the following predictors: 4 a priori MRI ROI, diagnosis (MCI or CN), age, AMNART IQ, Digit Symbol score, and RAVLT total learning. values with 95% CI and significance test results (p values) were reported for each predictor retained after backward elimination. Percent variance accounted for in the dependent variable by the model as a whole (R 2 ) was also reported. The distributions of data points from residuals of the final model were assessed graphically for normality and homoscedasticity to ensure consistency with the model s assumptions. 15
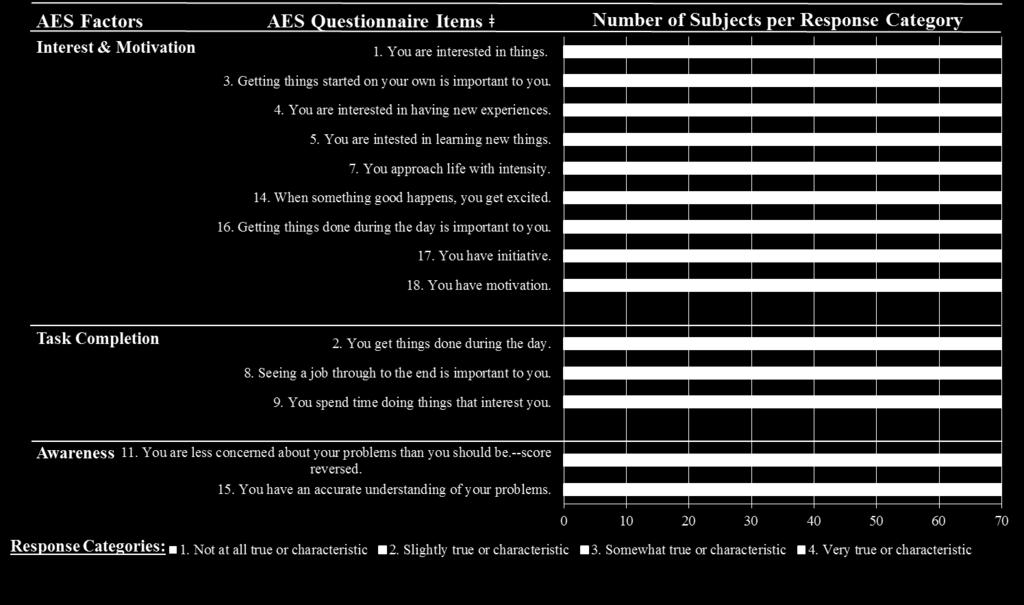
16 SECTION 3: RESULTS 1. Longitudinal Analysis of AES Sub-Scales Baseline Characteristics Demographics and characteristics for all subjects and each diagnostic group are displayed in Table 1. Compared to CN subjects, MCI subjects demonstrated significantly lower MMSE scores, Digit Symbol scores, RAVLT total learning scores, AES-C scores, and AES-I scores (lower scores indicating greater apathy), and significantly higher CDR sum of boxes scores. The difference in AES-S scores between CN and MCI subjects was not statistically significant. The MCI group also had a higher percentage of males than the CN group. Lower AES-C score (indicating greater apathy) was associated with lower AES-S score (r = 0.58, p<0.0001), AES-I score (r = 0.79, p<0.0001), MMSE (r = 0.30, p=0.01), Digit Symbol score (r = 0.35, p=0.003), and RAVLT total learning score (r = 0.47, p=0.0001), and with higher CDR sum of boxes score (r = , p<0.0001). Lower AES-I score was associated with lower AES-C score (as above), lower AES-S score (r = 0.35, p=0.002), MMSE (r = 0.26, p=0.03), Digit Symbol score (r = 0.30, p=0.01), RAVLT total learning score (r = 0.44, p=0.0002), and higher CDR sum of boxes score (r = -0.56, p<0.0001). Lower AES-S score was associated with lower AES-C and AES-I scores (as above), lower Digit Symbol score (r = 0.24, p=0.05) and higher CDR sum of boxes score (r = -0.28, p=0.02). Derivation of Symptom Clusters by Factor Analysis Maximum likelihood significance tests for number of factors were conducted and although p values can be considered only approximate because of violation of multivariate normality assumptions, they are adequate indices for purposes of preliminary factor analysis. These tests indicated 4 factors while a scree plot of eigenvalues was consistent with 3 or 4. Further examination of loadings suggested 3 substantively unitary factors which we named Interest and Motivation (9 AES items), Task Completion (3 items) and Awareness (2 items) (see Figure 1 and Table 2). Of note, since the Awareness factor consists of only 2 items, results involving it should be interpreted with greater caution. When referring to the factors from this point on, we will abbreviate them as follows: Interest, Task, and Awareness. Estimated inter-factor correlations (r) were: Interest vs. Task, r = 0.61; Interest vs. Awareness, r = 0.31; and Task vs. Awareness, r = In order to assess the internal-consistency reliability and unidimensionality of our derived factor scores, we computed Coefficient Alpha for baseline scores for each set of items constituting each factor for each subscale. Alpha was moderate to high for the Interest and Task factors (0.65 to 0.92) across the sub-scales, though low for the Awareness factor for AES-S (0.29) and AES-I (0.45) likely because it was based on only 2 items derived from a factor analysis of the AES-C items. 16
17 Mixed Effects Models Tables 3 and 4 display results for the mixed effects longitudinal analyses where the final retained models contained significant fixed terms. All significant fixed effects were in the expected direction. Random slopes and intercepts for time were included in all final models and occasional significant negative and positive correlations between them. For the reduced model for each analysis, residuals from values predicted by the combined fixed and random coefficients conformed reasonably to assumptions of normality and homoscedascity. Across the various models, the common findings were associations between greater apathy and greater years in study, a diagnosis of MCI (compared to CN), and male sex (compared to female sex). Regarding the three models for each AES sub-scale, there was a significant increase in apathy (i.e. decline in AES score) in all three models over time, at a rate independent of baseline diagnosis (CN vs MCI). However, as illustrated in Figure 2, a baseline diagnosis of MCI (compared to CN) was a significant predictor of greater informant and clinician-reported apathy (i.e. lower AES-I score and AES-C score) additive to time effects (p= and p=0.0005, respectively) (see Table 3). Moreover, Figure 2 illustrates that CN individuals self-report (AES-S) greater apathy over time when compared to informant or clinician-report (AES-I and AES-C), while this pattern reverses in MCI individuals where the informant or clinician-report greater apathy over time when compared to self-report. Male sex (compared to female sex) was a significant predictor of lower AES-S score additive to time (p=0.02) and more rapid decline in AES-C score over time (p=0.005), as illustrated in Figure 3. Regarding the models for the symptom clusters as measured by each AES sub-scale, the effects of time, diagnosis, and sex were least significant for the subject-reported factor scores, as no predictors were retained as significant in the models for subject-reported Interest or Task. In all other mixed effects models except for informant-reported Awareness, there was a significant increase in symptoms (i.e. a decline in factor scores) over time at a rate independent of baseline diagnosis (CN vs. MCI) (see Table 4). However, baseline diagnosis of MCI (compared to CN) was also a significant predictor of lower scores on all the factors for AES-I and AES-C additive to time. Male sex (compared to female sex) was a significant predictor of lower subject-reported Awareness score additive to time (p=0.003) and more rapid decline in clinician-reported Interest score over time (p=0.003). Cox Models Thirty nine subjects with MCI were included in the Cox Regression analysis, of which 11 transitioned to AD dementia over a period of 1.4±1.2 years. The remaining 28 subjects were censored. Figure 4 displays a 3- dimensional plot of baseline AES-C vs. AES-I vs. AES-S scores for subjects with a baseline diagnosis of MCI, 17
18 with labels denoting subjects who progressed to AD dementia and those who did not as of last follow-up and were censored. Note that the subjects with stable MCI diagnosis tend to cluster together in the region where all 3 sub-scale total scores are high (consistent with lesser apathy). Table 5 displays significant results from the Cox Regression Models. All predictors retained as significant in the final reduced models passed the test of the proportional hazard assumption. In the analysis which included the three sub-scale AES sub-scale scores as simultaneous predictors, only AES-C score survived the backward elimination along with Digit Symbol score, whereby for both, lower scores consistent with greater apathy and greater executive dysfunction predicted greater hazard of transition from MCI to AD dementia (see Figure 5). In the analyses which included the sets of AES symptom clusters (factors), only Interest as reported by clinicians and informants significantly predicted greater hazard of transition to AD dementia, both again in combination with Digit Symbol score. In the model for subject-reported AES symptom clusters, only Digit Symbol score was retained as predictor of progression to AD dementia. 2. Cross-Sectional Study of Apathy-Associated Cortical Thickness Baseline Characteristics Demographics and characteristics for all subjects and each diagnostic group included in the crosssectional MRI component of the current study are displayed in Table 6. Compared to CN subjects, MCI subjects demonstrated significantly lower MMSE scores, Digit Symbol scores, RAVLT total learning scores, and AES-C scores (indicating greater apathy), and significantly higher CDR sum of boxes scores. The MCI group also had a higher percentage of males than the CN group. Lower AES-C score (greater apathy) was associated with lower MMSE (r=0.29, p=0.02), Digit Symbol (r=0.34, p=0.007), and RAVLT total learning scores (r=0.39, p=0.001), and with higher CDR sum of boxes scores (r=-0.58, p<0.001). Multivariate Linear Regression After backward elimination, the multivariate linear regression model indicated a significant association between lower AES-C scores, representing greater apathy, and lower inferior temporal cortical thickness (p=0.004) and greater anterior cingulate cortical thickness (p=0.04), see Table 7 and Figure 6. Thickness of other cortical ROI was not significantly associated with AES-C score. Other predictors retained in the model included diagnosis, where an MCI diagnosis was more associated with lower AES-C score (greater apathy) than a CN diagnosis (p=0.0007) (R 2 =0.31, p= for model), see Table 7. Of note, there was a moderately strong positive unadjusted univariate correlation between inferior temporal and anterior cingulate cortical thickness (r=0.51, p<0.0001) suggesting possible multi-collinearity as an explanation for the unexpected inverse 18
19 relationship of AES-C score with anterior cingulate cortical thickness seen in the model. However, the unadjusted univariate correlation between anterior cingulate cortical thickness and AES-C score, which does not reach statistical significance (r=-0.12, p=0.37), was negative as it was in the model. 19
20 SECTION 4: DISCUSSION In a cohort of elderly individuals with MCI or normal cognition, items from the AES clustered into three factors of apathy-related symptoms: (1) interest and motivation, (2) task completion, and (3) awareness. Of these, the only factor that predicted progression from MCI to AD dementia was interest and motivation as measured by the clinician and informant-reported sub-scales of the AES but not by the subject (self) reported sub-scale. When comparing the three AES sub-scale scores, lower AES-C score, denoting greater clinicianreported apathy, best predicted progression from MCI to AD dementia. Therefore, our data suggest that clinician report, as opposed to informant or subject report, of apathy symptoms, in particular lack of interest and motivation, best predict disease progression in early AD. When looking at progression of apathy symptoms over time in CN and MCI subjects as measured by the AES sub-scales and symptom clusters, we found that apathy increased over time and was associated with a baseline diagnosis of MCI as opposed to CN and with being male as opposed to female. Furthermore, these findings were more prominent in the clinician and informant-reported sub-scales of the AES as opposed to the subject-reported sub-scale. Finally, in our analyses of associations between apathy and cortical thickness, we found that, in individuals at risk for AD (MCI and CN elderly), lower thickness of the inferior temporal cortex is associated with greater apathy as measured by the AES-C after adjusting for diagnosis, age, premorbid intelligence, memory performance, and processing speed. Our results also suggest an association between greater anterior cingulate cortical thickness and greater apathy in this population. AD is a growing epidemic in urgent need of effective therapies (1, 2). Despite ongoing and completed AD clinical trials employing multiple classes of drugs in recent years, most potentially disease-modifying therapies, especially amyloid-modifying therapies, have failed to show clinical benefit (64). The lack of efficacy observed in these trials may be due to the need for earlier diagnosis and intervention in the AD course to produce clinically-apparent benefit (6). Better characterization of subjective neuropsychiatric symptoms such as apathy in MCI and preclinical AD using more nuanced clinical assessments, such as the various AES constructs presented here, as well as biomarkers, may facilitate early diagnosis (33, 40, 65). This approach is supported by previous studies focused on cognition, which showed the combination of non-objective measures with objective measures to be superior in predicting cognitive and functional decline compared to objective measures alone (66, 67). In order to accurately characterize apathy for such purposes, a standard metric for apathy must be chosen and thoroughly validated in the context of MCI and CN elderly at risk for preclinical AD, which to our knowledge has yet to be done. This work represents a first attempt at this important endeavor. Furthermore, our results suggest that greater apathy as measured by the AES-C, the sub-scale that best predicted progression from MCI to AD dementia in our analysis, was also associated with specific patterns of cortical 20
21 thickness in patients at risk for AD. Further characterization of apathy and apathy-associated patterns of cortical thickness in preclinical AD may also facilitate earlier AD diagnosis and enriched clinical trial designs. To our knowledge, this is the first study to longitudinally compare the reporter-dependent apathy constructs, AES-C, AES-I and AES-S sub-scale and factor scores, in CN elderly and MCI, and the first study to assess the utility of these measures as predictors of progression from MCI to AD dementia. However, many previous studies have compared subject (self) and informant reporting of cognitive and functional symptoms across CN elderly, MCI, and AD dementia. In the context of AD dementia, multiple studies have demonstrated that patients with AD dementia may report significantly different symptoms compared to informants, usually under-reporting their symptoms (68-71), and do not accurately reflect objective measures of cognitive performance (70, 72). In the context of MCI, studies have shown that individuals with MCI under-report cognitive and functional decline compared to informants as well (73-75), and that informant report of cognitive deficits in the context of MCI better predicts transition to AD dementia than self-report (70); however one study showed no significant difference between subject and informant report of daily functioning in individuals with MCI (76). In elderly individuals without cognitive deficits on formal neuropsychological testing, Caselli and colleagues demonstrated that both subject and informant-reported cognitive concerns predict incidence of MCI, and also found subject-reported cognitive concerns to precede informant-reported decline in individuals who developed MCI (77). Amariglio and colleagues reported similar findings with subject and informant-reported cognitive and functional concerns using the CDR and objective cognitive performance as the longitudinal outcomes (78). These findings are supported by others, who have demonstrated an association in CN individuals between subject-reported cognitive concerns and incidence of MCI and AD dementia (79, 80), although this has not been consistent across all studies (81). Further strengthening the importance of self and informant-reported cognitive concerns for AD are studies of CN elderly demonstrating associations of such cognitive concerns with underlying brain atrophy similar to that of MCI (82, 83) and elevated cortical amyloid burden (84). It therefore appears likely that while individuals may demonstrate greater awareness of cognitive, psychiatric and functional problems compared to informants when they have normal or near-normal cognition, this relationship may invert at some point during the course of MCI, such that individuals can no longer report symptoms as accurately as informants due to a lack of awareness of and insight into their problems, also known as anosognosia, as is seen more clearly in dementia. This is consistent with the findings of the current study, where CN individuals at baseline appeared to self-report greater severity of the neuropsychiatric symptom of apathy over time when compared to informant or clinician report of apathy, while individuals with MCI at baseline appeared to under-report apathy severity over time when compared to informant or clinician report. 21
22 Furthermore, the combination of informant and subject report appears to be more sensitive than either alone as a measure of decline in cognition and function (78, 85). This may explain why in the current study, the clinicianreport measure (AES-C) was the reporter-variant of the AES found to best predict progression from MCI to AD dementia. While the AES-S and AES-I rely solely on subject-report and informant-report, respectively, the AES-C relies on the clinician s integration of input from both subject and informant, plausibly creating a more accurate measure of apathy and more sensitive predictor of disease progression than either subject or informant report alone. Of note, the CN elderly in our study were at risk for AD purely due to advanced age, and we do not know which of them, if any, have underlying AD. Therefore, it is entirely possible that the increasing apathy observed in our CN participants over time was in fact due to normal aging rather than underlying AD. Indeed previous studies have suggested such an association between apathy and normal aging (86). However, regardless of the apathy s etiology, our study does suggest that CN elderly have greater awareness of their apathy compared to informants and clinicians, while individuals with MCI have decreased awareness. Prior studies have also applied factor analysis to the AES for data reduction purposes. During the initial creation and validation of the AES in a population of patients with stroke, probable AD dementia, depression, and healthy elderly, three factors were identified in the AES reporter variants: general apathy as the major factor, and two minor factors, lack of interest, as well as lack of insight or concern a third factor which the AES-S lacked (46). A more recent study in 121 dementia patients identified two factors, general apathy and interest in the AES-C and AES-I, and only general apathy and what was termed other in the AES-S (87). These results correspond in part to our own findings: while a general apathy factor was not identified in our current analysis, interest and lack of insight or concern correspond to two of our three factors ( interest and motivation and awareness ). Differences in our results may have stemmed from the differences in subject samples, as prior studies included patients with stroke, depression, and dementia, as opposed to our study which focused on MCI and to a lesser extent CN elderly (46, 87). Of the three factors we identified, the interest and motivation factor had the strongest signal in our various analyses. Prior cross-sectional and longitudinal studies have shown that apathy is greater in those with greater AD severity, ranging from MCI to severe dementia, and that apathy worsens as AD progresses over time (25, 26, 30, 88). In the current study we too showed that apathy measured in various fashions worsens over time in individuals at risk for early AD. Moreover, in the current study, we explored different aspects of apathy and their progression over time and found that clinician and informant-reported interest and motivation, as well as task completion, worsened over time. In contrast, subjects only reported worsening over time for one of the three symptom clusters. These findings suggest that even in early AD, individuals may be less aware of their symptoms, including neuropsychiatric symptoms. 22
23 Another striking and consistent finding in our study was the association between being male, as opposed to female, and worsening of apathy over time as measured by multiple constructs. These findings are in line with those of Brodaty and colleagues, where in a study of 76 healthy, community-dwelling elderly using the AES-I, there was a significantly greater increase in apathy over time in men than women (86). The authors postulated that the association between male sex and greater apathy might be attributable to several possibilities. One such possibility is decreasing testosterone with age, which has been associated with depressive symptoms in older men (89) and apathy in the context of Parkinson s disease (90). If men with normal testosterone have comparable apathy to women, men with low testosterone may develop greater apathy compared to women. Other possibilities include higher rates of occupation outside the home among men in our study, leading to higher rates of retirement, which may cause apathy through loss of rewards and incentives (91). However, we did not have data on occupation history required to test such a hypothesis in this cohort. Of note, differences in apathy between sexes have not been previously observed in the context of AD dementia (26) or MCI (27). Multiple studies have demonstrated an association between apathy and atrophy of the medial frontal regions in AD dementia. While Apostolova et al. found reduced gray matter thickness of the bilateral anterior cingulate and left medial frontal cortex (supplementary motor area) (34), Bruen et al. found cortical thinning of the anterior cingulate cortex bilaterally, frontal cortex bilaterally, head of the left caudate nucleus, and bilateral putamen (35). Tunnard et al. partially corroborated both studies with findings of atrophy in the left caudal anterior cingulate cortex, left lateral orbitofrontal cortex, and left superior and ventrolateral frontal regions (36). Associations between apathy and atrophy of the medial frontal regions have also been found in related neurodegenerative dementias (92). Moreover, associations between apathy and cortical amyloid burden have been detected as early as MCI (38). Since cortical thinning patterns associated with AD have been detected as early as the preclinical stages of AD in PiB-positive CN individuals (9, 93), it is plausible to hypothesize that apathy-associated patterns of atrophy may begin at the stage of MCI or earlier. Our findings regarding lower inferior temporal cortical thickness build on previous studies suggesting a role for lower inferior temporal cortical thickness as a predictor of greater apathy over time and the detection of inferior temporal cortex atrophy in the early stages of MCI (40, 63). In a study using ADNI data, Donovan et al. found reduced baseline inferior temporal cortical thickness to be predictive of increasing apathy over time across the AD continuum, including CN, MCI, and mild AD dementia subjects (40). Unlike the current study, this study did not detect a significant cross-sectional association between decreased thickness of the inferior temporal cortex and greater apathy; however, this may be due to the scale used to measure apathy, the Neuropsychiatric Inventory brief questionnaire (NPI-Q), which only features a single item for apathy with a possible score range of 0-3 (94). Many other clinical-imaging correlation studies of apathy in AD dementia 23
24 have used the full NPI scale, which has a wider range of scores (0-12) (44), but often was split into a dichotomous variable (present or absent apathy) (34-36, 42, 43). More comprehensive and sensitive measures of apathy, such as the AES employed here (possible score range 18-72), may reveal subtler cross-sectional associations between cortical thickness and apathy in individuals who may be in the early stages of AD. In a separate study using ADNI data, McDonald et al. identified accelerated inferior lateral temporal atrophy starting in the early stages of MCI (CDR sum of boxes ) and continuing into mild AD dementia (63). Coupled with our findings, these studies suggest that inferior temporal atrophy may occur in individuals in the prodromal stages of AD and that regional atrophy in these stages of disease may be associated with the presence of apathy. However, our results are cross-sectional rather than longitudinal. Therefore, it is unclear whether the lower inferior temporal cortical thickness associated with apathy is the result of atrophy over time or an innate life-long trait which predisposes to apathy. Furthermore, while most of the subjects in this study are at high risk for developing AD dementia, we did not know which subjects or how many ultimately progressed to AD dementia. Therefore, the association between lower inferior cortical thickness and apathy may or may not be driven by underlying AD pathology. Further studies with molecular PET imaging visualizing AD pathology and longitudinal data are needed. Despite significant evidence for apathy-associated atrophy of the anterior cingulate cortex in AD dementia (35, 36), the lack of an association between lower anterior cingulate cortical thickness and apathy in our subjects may not be entirely surprising. While McDonald et al. s study of longitudinal cortical atrophy in MCI and AD dementia did detect inferior lateral temporal atrophy in the early stages of MCI, it did not detect atrophy of the anterior cingulate cortex until impairment increased to a CDR sum of boxes score of (63). The mean CDR sum of boxes score in MCI subjects in the current study was 1.7 and CN subjects were included as well, potentially reducing the possibility of observing a regional association with anterior cingulate cortex atrophy and apathy. Therefore, greater apathy may be associated with anterior cingulate atrophy only in later stages of the disease than examined by the current study, while inferior temporal atrophy may be associated with greater apathy at earlier stages of AD. It is difficult to explain the unexpected association between greater apathy and greater anterior cingulate cortical thickness observed in our study. When looking at the univariate unadjusted relationship between apathy and anterior cingulate cortical thickness, the directionality is the same as that found in the multivariate model. This suggests that the weak yet statistically significant relationship between greater anterior cingulate cortical thickness and greater apathy may be a real finding. This finding may suggest a compensatory or inflammatory response to AD pathology in the anterior cingulate cortex which precedes atrophy. Analogous phenomena have been identified in other brain regions. Functional MRI studies have shown a potential compensatory effect at 24
25 the stage of early MCI with increased hippocampal activity during a memory task, which later reverses to decreased activity at the stage of late MCI (95). The findings of increased anterior cingulate cortical thickness in CN and early MCI subjects and decreased anterior cingulate cortical thickness in mild-moderate AD dementia could be due to a similar compensatory phenomenon. However, this finding is in cortical thickness rather than function. There is some evidence to support a similar phenomenon with cortical thickness measurements in the earliest stages of AD. In an MRI study of early-onset familial AD mutation carriers, cortical thickness of the posterior cingulate, precuneus and parietotemporal association areas were greater in mutation carriers prior to the onset of cognitive impairment than in healthy controls, while thickness of the same areas after symptom onset was significantly less than that found in healthy controls (96). In a separate study, non-demented Apolipoprotein E 4 carriers had greater cortical thickness than non-carriers, but a stronger association between aging and cortical thinning between the ages of 48 and 75 years in cortical areas known to degenerate in AD (97). Limitations The current study has several notable limitations. First, both the longitudinal and cross-sectional components of our study were limited in statistical power due to small sample sizes, and therefore significant effects may have gone undetected by our analyses. Due to small sample sizes, we were also limited in the number of MRI ROI we could include in our linear regression, as well as the number of covariates that could be included in the multivariate models. However, our findings in the mixed effects models were statistically significant after adjusting for baseline diagnosis, sex, the interactions with baseline diagnosis and sex with time, baseline age, and premorbid IQ; our findings in the Cox proportional hazards regression models were significant after adjusting for sex, baseline age, premorbid IQ, processing speed, and memory; and our findings in the study of associations between apathy and cortical thickness were significant after adjusting for age, diagnosis, premorbid IQ, processing speed, and memory. Second, many analyses were performed in the current study. In considering the possibility that chance effects due to multiple testing were responsible for our findings, it might be noted that although the 0.05 level was used as a cutoff in all of the backward elimination analyses for mixed effects and Cox models, almost all significant effects of interest were significant at much more stringent levels and would have survived even a conservative Bonferroni correction. Also, the consistency of the significant findings across different analyses further suggests that the results were unlikely to be chance effects. Third, results from the factor analysis performed using the AES-C items were used to identify factors that were then applied to the two other AES sub-scales. This generalization may not be valid. Fourth, our study did not include data on other potentially important biological predictors of AD such as Apolipoprotein E status, 25
26 amyloid and tau burden, and hypometabolism. However, of note, a prior study from our group employing the AES did explore associations between apathy, amyloid burden, and 18F-fluorodeoxyglucose (FDG) metabolism in the early AD spectrum (38). Fifth, none of the CN subjects in our cohort progressed to MCI, and future studies with larger samples of CN elderly followed over longer periods of time will be needed if the value of AES score as a predictor of progression from CN to MCI is to be determined. Additionally, in the crosssectional component of our study we were limited to observing anatomical changes in the brain. Apathy may also correlate with functional, metabolic, or molecular changes in the brains of MCI and CN individuals, which could not be detected in our study. The MRI component of our study was also limited by the cross-sectional nature of that analysis. Our study suggests that decreased inferior temporal cortical thickness is associated with greater apathy cross-sectionally. However, given the lack of longitudinal analysis, it is impossible to determine whether or not the decreased cortical thickness observed here is actually the result of pathology related atrophy or instead inherent to the subjects at baseline, predisposing them to apathy their entire life. Conclusions In conclusion, our results suggest that scores of the AES are driven by three clusters of symptoms: interest and motivation, task completion, and awareness. Our results also suggest that apathy increases over time in CN elderly and individuals with MCI and tends to be more severe in men and MCI. Compared to informants and clinicians, subjects demonstrated greater awareness of their apathy if cognitively normal, but appeared to have diminished awareness of apathy if they had MCI. Moreover, of the three reporter types included in this study, apathy scores reported by clinicians were most useful in predicting progression from MCI to AD dementia. This is in spite of the fact that clinicians who determined the diagnosis for subjects at each time point were blinded to apathy scores. Finally, our results suggest that greater clinician-reported apathy as measured by the AES-C is associated with lower inferior temporal cortical thickness and greater rostral anterior cingulate cortical thickness in MCI and CN elderly. This study demonstrates the utility of these various constructs of apathy in predicting disease progression in early AD, as well as the complicated trajectory of subjective neuropsychiatric concerns that parallels the trajectory of subjective cognitive concerns depending on subject (self) vs. informant-report. Suggestions for Future Work As noted in limitations, our study was limited in the number of potential confounders which could be included in our regressions, and we cannot exclude residual confounding in our analyses. Future studies will be required to replicate these findings in larger cohorts allowing adjustment for more potential confounders. Larger 26
27 studies with greater longitudinal follow-up are also needed to capture diagnostic transition from CN elderly to MCI, thereby allowing potential associations between AES sub-scale scores and incidence of MCI to be explored. Such studies should include information on AD risk factors, such as amyloid burden and Apolipoprotein E status, with intent of developing means for earlier AD diagnosis. Finally, future studies may compare other metrics for apathy to the AES, in order to determine the optimal apathy metric for use in preclinical AD. Regarding the cross-sectional MRI component of our study, our findings suggest that decreased inferior temporal cortical thickness is associated with greater apathy cross-sectionally. However, given the lack of longitudinal analysis, it is impossible to determine whether or not the decreased cortical thickness observed here is actually atrophy over time or instead inherent to the subjects at baseline. Future longitudinal studies with repeated MRI and clinical assessments will allow for better exploration of this relationship and will also help determine whether certain regional atrophy patterns predict greater apathy over time and progression to AD dementia. Due to small sample size, we were also limited in the number of cortical ROI that could be chosen for our analyses, and decreased thickness of other cortical regions associated with apathy in early AD may have been missed. Future studies may employ whole-brain exploratory analyses with voxel-based morphometry to test for such regions. Furthermore, in our study apathy was found to be associated with a specific pattern of cortical thickness; however, apathy may also correlate with functional, metabolic, or molecular changes in the brains of MCI and CN individuals. This is supported by studies showing apathy to correlate with regionally specific cortical changes in AD dementia, including microstructural alterations in white matter anisotropy of the left anterior cingulate cortex (57), reduced metabolism and perfusion of the anterior cingulate cortex (42, 58-61) and the orbitofrontal cortex (42, 58-60), decreased perfusion of the right temporoparietal cortex (98), and decreased perfusion of the prefrontal cortex and anterior temporal cortex (43). Apathy has also been associated with greater neurofibrillary tangle burden of the anterior cingulate cortex (99) in moderate to severe AD dementia and increased cerebrospinal fluid total tau and phospho-tau in mild AD dementia (100). These associations with apathy may also be present in CN elderly and MCI, and techniques such as resting-state functional MRI, FDG and PiB-PET may be used to investigate such possibilities in future studies. Larger samples are also needed in order to assess the relationship between apathy and regional cortical thickness within PiB-positive individuals who are more likely to have preclinical and prodromal AD than the inclusive group of CN and MCI subjects used in the current study, who could have been PiB-positive or negative. Finally, future studies may also explore associations between cortical thickness in individuals at risk for AD and apathy as measured specifically by the AES-I and AES-S, in contrast to the AES-C as reported here. 27
28 Table 1. Baseline demographics and characteristics of all subjects and individual diagnostic groups included in the longitudinal analysis of the AES sub-scales. Characteristic All subjects MCI CN Significant Differences between MCI vs CN N Age (years) 74.7± ± ±6.0 (53-86) (53-86) (63-84) Sex (% male) Chi-square test=13.0, p= Education (years) 16.8± ± ±2.9 (12-20) (12-20) (12-20) AMNART IQ 122.4± ± ±5.3 ( ) ( ) ( ) MMSE 27.8±1.9 (23-30) 27.3±1.9 (23-30) 29.4±0.8 (28-30) Mann-Whitney U test, p< CDR-SB 1.3±1.1 ( ) 1.7±1.0 ( ) 0.0±0.1 (0-0.5) Mann-Whitney U test, p< Digit Symbol 46.0± ± ±11.5 t=2.8, p=0.008 (22-71) (22-69) (34-71) RAVLT Total 37.9± ± ±10.3 t=6.6, p< Learning (18-71) (18-55) (34-71) AES-C 62.7±7.7 (39-72) 60.9±7.7 (39-72) 68.4±4.3 (55-72) Mann-Whitney U test, p< AES-I 62.8±7.9 (42-72) 61.1±8.0 (42-72) 68.3±4.5 (58-72) Mann-Whitney U test, p= AES-S 64.3±7.4 (40-72) 63.3±8.0 (40-72) 67.2±4.2 (56-72) AES-C (Apathy Evaluation Scale, clinician-reported, total score), AES-I (Apathy Evaluation Scale, informant-reported, total score), AES-S (Apathy Evaluation Scale, subject-reported, total score), AMNART IQ (American National Adult Reading Test intelligence quotient), CDR-SB (Clinical Dementia Rating sum of boxes), CN (cognitively normal), MCI (mild cognitive 28
29 impairment), MMSE (Mini-Mental State Examination), RAVLT (Rey Auditory Verbal Learning Test). All values (except for n and sex) represent mean ± standard deviation (range). Results are displayed for statistically significant differences only. 29

30 Figure 1. Guercio et al. 30
31 Figure 1. Results of the factor analysis of the 18 AES items. Apathy Evaluation Scale (AES) Items that were not retained in the factor analysis included: (6) You put little effort into anything; (10) Someone has to tell you what to do each day; (12) You have friends; (13) Getting together with friends is important to you. 31
32 Table 2. Factor structure of Baseline AES following data reduction with Oblique Correlated (Promax Rotation) Factor Solution Factors AES Item Number AES Item Loading Standardized Cronbach Coefficient Alpha Variance Explained AES-C AES-I AES-S by Each Factor Interest & Motivation Task Completion Awareness AES sub-scale Items
33 The displayed factor analysis used baseline clinician-reported AES (AES-C) scores as representative for data reduction purposes, and pooled across MCI and CN subjects. Raw Cronbach Coefficient Alpha values were then calculated for each factor for the AES-C, AES-I, and AES-S sub-scales as displayed. Estimated correlations among factors: Interest vs. Task = 0.61, Interest vs. Awareness = 0.31, Task vs. Awareness = AES Item Loadings are rotated factor pattern coefficients. AES (Apathy Evaluation Scale); AES-C (Apathy Evaluation Scale, clinician-reported); AES-I (Apathy Evaluation Scale, informantreported) ; AES-S (Apathy Evaluation Scale, subject-reported); CN (cognitively normal); MCI (mild cognitive impairment). 33
34 Table 3. Mixed Effect Longitudinal Models with AES sub-scale Scores as Dependent Variables Dependent Variable Retained Predictors Effect ( ) 95% CI p % Var Acct F % Var Acct F+R AES-S Male Sex (-5.74, -0.44) Year in Study ( , ) 0.06 AES-I Baseline Diagnosis (-11.61, -3.60) MCI Year in Study (-3.73, -1.49) < AES-C Baseline Diagnosis MCI (-11.27, -3.30) Male Sex (-4.39, 2.72) 0.64 Year in Study (-4.18, -1.92) Year in Study X Male Sex (-4.87, -0.92) X denotes an interaction. Apathy Evaluation Scale, subject-reported sub-scale (AES-S); Apathy Evaluation Scale, informant-reported sub-scale (AES-I); Apathy Evaluation Scale, clinician-reported sub-scale (AES-C); confidence interval (CI); percent variance in dependent variable accounted for by fixed effects of model (% Var Acct F); percent variance in dependent variable accounted for by fixed and random effects of model (% Var Acct F+R); mild cognitive impairment (MCI) for a categorical predictor is the estimated difference in adjusted means for the categories. 34
35 35
36 Table 4. Mixed Effect Longitudinal Models with AES Factors as Dependent Variables Dependent Variable Retained Predictors Effect ( ) 95% CI p % Var Acct F % Var Acct F+R AES-S Factors Awareness Male Sex (-0.51, -0.11) Year in Study (-0.29, -0.11) < AES-I Factors Interest Baseline Diagnosis MCI (-0.75, -0.18) Year in Study (-0.23, -0.11) < Task Completion Baseline Diagnosis MCI (-0.74, -0.18) Year in Study (-0.20, -0.04) Awareness Baseline Diagnosis MCI (-0.78, -0.19) AES-C Factors Interest Baseline Diagnosis MCI (-0.72, -0.19) Male Sex (-0.29, 0.19)
37 Year in Study (-0.28, -0.14) Year in Study X Male Sex (-0.31, -0.07) Task Completion Baseline Diagnosis MCI (-0.65, -0.17) Year in Study (-0.18, -0.01) 0.02 Awareness AMNART IQ 0.02 (0.0008, 0.03) Baseline Diagnosis MCI (-0.76, -0.20) Year in Study (-0.23, -0.03) 0.01 X denotes an interaction. Apathy Evaluation Scale, subject-reported sub-scale (AES-S); Apathy Evaluation Scale, informant-reported sub-scale (AES-I); Apathy Evaluation Scale, clinician-reported sub-scale (AES-C); confidence interval (CI); percent variance in dependent variable accounted for by fixed effects of model (% Var Acct F); percent variance in dependent variable accounted for by fixed and random effects of model (% Var Acct F+R); mild cognitive impairment (MCI); American National Adult Reading Test intelligence quotient (AMNART IQ). for a categorical predictor is the estimated difference in adjusted means for the categories. 37
38 Figure 2. Guercio et al. Figure 2. Predicted values for AES-C, -I and -S Total scores from the fixed portions of respective mixed effects models including the fixed predictors: Baseline Diagnosis (CN vs. MCI), Time in the Study (linear and quadratic), and the interaction of Baseline Diagnosis 38
39 X Time in Study (linear and quadratic). (Intercepts and the linear term for time were random terms). Each symbol corresponds to a person-visit record. Forced best fit models were used to graphically illustrate the different trajectories of the AES-C vs AES-I vs AES-S scores, irrespective of whether individual predictors in models were statistically significant or not. AES (Apathy Evaluation Scale); AES-C (Apathy Evaluation Scale, clinician-reported); AES-I (Apathy Evaluation Scale, informantreported); AES-S (Apathy Evaluation Scale, subject-reported); CN (clinically normal); MCI (mild cognitive impairment) 39
40 Figure 3. Guercio et al. Figure 3. Predicted values for AES-C scores from the fixed portion of the mixed effects model including the fixed predictors: Baseline Diagnosis (CN vs MCI), Sex, Time in the Study (linear), and the interaction of Sex X Time in Study. (Intercepts and the linear term for time were random terms). Each symbol corresponds to a person-visit record. 40
41 AES-C (Apathy evaluation scale, clinician-reported); CN (clinically normal); MCI (mild cognitive impairment) 41
42 Figure 4. Guercio et al. Figure 4. AES-S vs. AES-I vs. AES-C scores of subjects with MCI at baseline, who remained stable or progressed to AD dementia over time. Pyramid = MCI progressed to AD dementia; Circle = Stable MCI. AES sub-scale scores are values at baseline. Due to 42
43 overlap of points, 2 stable persons are hidden in upper right. Mild cognitive impairment (MCI); AES-S (Apathy Evaluation Scale, subject-reported sub-scale); AES-I (Apathy Evaluation Scale, informant-reported sub-scale); AES-C (Apathy Evaluation Scale, clinician-reported sub-scale). 43
44 Table 5. Cox Proportional Hazards Regression Analysis Showing Significant Predictors of Time to Progression from MCI (n = 39) to AD dementia (n = 11) Retained in the Final Models Model Full Model ² df P Predictors Retained HR 95% CI Predictor ² (df = 1) p AES sub-scale Scores < Digit Symbol 1.07 (1.01, 1.13) AES-C Score 1.19 (1.09, 1.32) AES-C Factors Digit Symbol 1.08 (1.02, 1.16) Interest 8.62 (2.60, 33.56) AES-I Factors Digit Symbol 1.10 (1.03, 1.19) Interest 5.88 (2.07, 19.61) AES-S Factors Digit Symbol 1.06 (1.01, 1.12) For all models, initial covariates included: sex, baseline age, baseline American National Adult Reading Test verbal intelligence quotient, baseline Digit Symbol score, and baseline Ray Auditory Verbal Learning Test total learning score. For model AES subscale Scores, initial predictors of transition from MCI to AD dementia included baseline total scores for the subject-reported Apathy Evaluation Scale (AES-S), informant-reported Apathy Evaluation Scale (AES-I), and clinician-reported Apathy Evaluation Scale (AES-C). For model AES-C Factors, initial predictors included scores of the three AES symptom clusters, Interest, Task Completion, and Awareness, as measured by baseline AES-C. For model AES-I Factors, initial predictors included scores of the 44
45 three AES symptom clusters as measured by baseline AES-I. For model AES-S Factors, initial predictors included scores of the three AES symptom clusters as measured by baseline AES-S. AD (Alzheimer s disease); CI (confidence interval); df (degrees of freedom); HR (hazard ratio); MCI (mild cognitive impairment). Likelihood Ratio chi-square ( ²) test is a test of the model as a whole, whereas chi-square tests based on the Wald Test are used for individual predictors. The hazard ratio (HR) displayed for each retained predictor is the ratio of the probabilities of transitioning to AD dementia for a one unit increase in continuous predictor or a change in categories for a categorical predictor. Displayed HR s are inverted from the original analysis results to best illustrate the effect of increasing apathy (as denoted by a decreasing AES sub-scale or factor score) on risk of progression from MCI to AD dementia. 45

46 Figure 5. Guercio et al. 46
NIH Public Access Author Manuscript Dement Geriatr Cogn Disord. Author manuscript; available in PMC 2013 August 28.
 NIH Public Access Author Manuscript Published in final edited form as: Dement Geriatr Cogn Disord. 2012 ; 34(2): 96 111. doi:10.1159/000342119. Neuropsychiatric symptoms and global functional impairment
The Role of Cognitive Reserve in the clinical presentation of Alzheimer s Disease Dorene M. Rentz, PsyD
 The Role of Cognitive Reserve in the clinical presentation of Alzheimer s Disease Dorene M. Rentz, PsyD Division of Cognitive and Behavioral Neurology, Brigham and Women s Hospital Co-Director of the Center
Mild Cognitive Impairment (MCI)
") October 19, 2018 Mild Cognitive Impairment (MCI) Yonas E. Geda, MD, MSc Professor of Neurology and Psychiatry Consultant, Departments of Psychiatry & Psychology, and Neurology Mayo Clinic College of Medicine
October 19, 2018 Mild Cognitive Impairment (MCI) Yonas E. Geda, MD, MSc Professor of Neurology and Psychiatry Consultant, Departments of Psychiatry & Psychology, and Neurology Mayo Clinic College of Medicine
Inferior and medial temporal tau and cortical amyloid are associated with daily functional impairment in Alzheimer s disease
 Halawa et al. Alzheimer's Research & Therapy (2019) 11:14 https://doi.org/10.1186/s13195-019-0471-6 RESEARCH Inferior and medial temporal tau and cortical amyloid are associated with daily functional impairment
Cognitive Aging: Defining normal vs. disease?
 Cognitive Aging: Defining normal vs. disease? Reisa Sperling, M.D. Harvard Aging Brain Study Center for Alzheimer Research and Treatment Brigham and Women s Hospital Massachusetts General Hospital Harvard
CHAPTER 5 NEUROPSYCHOLOGICAL PROFILE OF ALZHEIMER S DISEASE
 CHAPTER 5 NEUROPSYCHOLOGICAL PROFILE OF ALZHEIMER S DISEASE 5.1 GENERAL BACKGROUND Neuropsychological assessment plays a crucial role in the assessment of cognitive decline in older age. In India, there
Supplementary Material. Functional connectivity in multiple cortical networks is associated with performance. across cognitive domains in older adults
 Supplementary Material Functional connectivity in multiple cortical networks is associated with performance across cognitive domains in older adults Emily E. Shaw 1,2, Aaron P. Schultz 1,2,3, Reisa A.
Supplemental Information. Triangulating the Neural, Psychological, and Economic Bases of Guilt Aversion
 Neuron, Volume 70 Supplemental Information Triangulating the Neural, Psychological, and Economic Bases of Guilt Aversion Luke J. Chang, Alec Smith, Martin Dufwenberg, and Alan G. Sanfey Supplemental Information
Anosognosia, or loss of insight into one s cognitive
 REGULAR ARTICLES Anosognosia Is a Significant Predictor of Apathy in Alzheimer s Disease Sergio E. Starkstein, M.D., Ph.D. Simone Brockman, M.A. David Bruce, M.D. Gustavo Petracca, M.D. Anosognosia and
DISCLOSURES. Objectives. THE EPIDEMIC of 21 st Century. Clinical Assessment of Cognition: New & Emerging Tools for Diagnosing Dementia NONE TO REPORT
 Clinical Assessment of Cognition: New & Emerging Tools for Diagnosing Dementia DISCLOSURES NONE TO REPORT Freddi Segal Gidan, PA, PhD USC Keck School of Medicine Rancho/USC California Alzheimers Disease
Supplementary Information
 Supplementary Information The neural correlates of subjective value during intertemporal choice Joseph W. Kable and Paul W. Glimcher a 10 0 b 10 0 10 1 10 1 Discount rate k 10 2 Discount rate k 10 2 10
Early Diagnosis of Alzheimer s Disease and MCI via Imaging and Pattern Analysis Methods. Christos Davatzikos, Ph.D.
 Early Diagnosis of Alzheimer s Disease and MCI via Imaging and Pattern Analysis Methods Christos Davatzikos, Ph.D. Director, Section of Biomedical Image Analysis Professor of Radiology http://www.rad.upenn.edu/sbia
Supplementary Information Methods Subjects The study was comprised of 84 chronic pain patients with either chronic back pain (CBP) or osteoarthritis
 or osteoarthritis") Supplementary Information Methods Subjects The study was comprised of 84 chronic pain patients with either chronic back pain (CBP) or osteoarthritis (OA). All subjects provided informed consent to procedures
Supplementary Information Methods Subjects The study was comprised of 84 chronic pain patients with either chronic back pain (CBP) or osteoarthritis (OA). All subjects provided informed consent to procedures
MASSACHUSETTS ALZHEIMER S DISEASE RESEARCH CENTER
 MASSACHUSETTS ALZHEIMER S THE NEWSLETTER DISEASE RESEARCH OF THE CENTER Volume 1, Issue 4 Winter 2010 http://madrc.mgh.harvard.edu/ Mild Cognitive Impairment (MCI) A new look at early changes MASSACHUSETTS
Piano playing skills in a patient with frontotemporal dementia: A longitudinal case study
 International Symposium on Performance Science ISBN 978-94-90306-01-4 The Author 2009, Published by the AEC All rights reserved Piano playing skills in a patient with frontotemporal dementia: A longitudinal
Comments to this discussion are invited on the Alzforum Webinar page. Who Should Use the New Diagnostic Guidelines? The Debate Continues
 Comments to this discussion are invited on the Alzforum Webinar page. Who Should Use the New Diagnostic s? The Debate Continues Ever since new criteria came out for a research diagnosis of prodromal/preclinical
O Connor 1. Appendix e-1
 O Connor 1 Appendix e-1 Neuropsychiatric assessment The Cambridge Behavioural Inventory Revised (CBI-R) 1, 2 is a proxy behavioural questionnaire that has been extensively used in studies involving FTD
HHS Public Access Author manuscript Curr Alzheimer Res. Author manuscript; available in PMC 2015 May 29.
 Functional Activities Questionnaire items that best discriminate and predict progression from clinically normal to mild cognitive impairment Gad A. Marshall, M.D. a,b,c,d,*, Amy S. Zoller, B.A. c,e, Natacha
Brain tissue and white matter lesion volume analysis in diabetes mellitus type 2
 Brain tissue and white matter lesion volume analysis in diabetes mellitus type 2 C. Jongen J. van der Grond L.J. Kappelle G.J. Biessels M.A. Viergever J.P.W. Pluim On behalf of the Utrecht Diabetic Encephalopathy
Supplementary Online Content
 Supplementary Online Content Devenney E, Bartley L, Hoon C, et al. Progression in behavioral variant frontotemporal dementia: a longitudinal study. JAMA Neurol. Published online October 26, 2015. doi:10.1001/jamaneurol.2015.2061.
Resistance to forgetting associated with hippocampus-mediated. reactivation during new learning
 Resistance to Forgetting 1 Resistance to forgetting associated with hippocampus-mediated reactivation during new learning Brice A. Kuhl, Arpeet T. Shah, Sarah DuBrow, & Anthony D. Wagner Resistance to
PPMI Cognitive-Behavioral Working Group. Daniel Weintraub, MD
 PPMI Cognitive-Behavioral Working Group Daniel Weintraub, MD PPMI Annual Meeting - May 6-7, 2014 Membership Daniel Weintraub WG Chair Tanya Simuni Steering Committee Shirley Lasch IND Chris Coffey, Chelsea
Form D1: Clinician Diagnosis
 Initial Visit Packet Form D: Clinician Diagnosis NACC Uniform Data Set (UDS) ADC name: Subject ID: Form date: / / Visit #: Examiner s initials: INSTRUCTIONS: This form is to be completed by the clinician.
Brain imaging for the diagnosis of people with suspected dementia
 Why do we undertake brain imaging in dementia? Brain imaging for the diagnosis of people with suspected dementia Not just because guidelines tell us to! Exclude other causes for dementia Help confirm diagnosis
Investigations in Resting State Connectivity. Overview
 Investigations in Resting State Connectivity Scott FMRI Laboratory Overview Introduction Functional connectivity explorations Dynamic change (motor fatigue) Neurological change (Asperger s Disorder, depression)
AT RISK, SCI, EMCI: THE ALPHABET SOUP OF PRECLINICAL AND PRODROMAL ALZHEIMER DISEASE
 AT RISK, SCI, EMCI: THE ALPHABET SOUP OF PRECLINICAL AND PRODROMAL ALZHEIMER DISEASE Mary Ellen Quiceno, MD, FAAN Associate Professor of Neurology Mary Quiceno, MD discloses she has received honoraria
Diagnosis and Treatment of Alzhiemer s Disease
 Diagnosis and Treatment of Alzhiemer s Disease Roy Yaari, MD, MAS Director, Memory Disorders Clinic, Banner Alzheimer s Institute 602-839-6900 Outline Introduction Alzheimer s disease (AD)Guidelines -revised
Detection of Mild Cognitive Impairment using Image Differences and Clinical Features
 Detection of Mild Cognitive Impairment using Image Differences and Clinical Features L I N L I S C H O O L O F C O M P U T I N G C L E M S O N U N I V E R S I T Y Copyright notice Many of the images in
Claims & Underwriting. You already told us that story! Maria C. Carrillo, Ph.D. Sr. Director, Medical & Scientific Relations Alzheimer s Association
 Claims & Underwriting Alzheimer s & Cognitive Impairment: You already told us that story! Maria C. Carrillo, Ph.D. Sr. Director, Medical & Scientific Relations Alzheimer s Association 1 OVERVIEW Impact
SUPPLEMENTARY INFORMATION. Table 1 Patient characteristics Preoperative. language testing
 Categorical Speech Representation in the Human Superior Temporal Gyrus Edward F. Chang, Jochem W. Rieger, Keith D. Johnson, Mitchel S. Berger, Nicholas M. Barbaro, Robert T. Knight SUPPLEMENTARY INFORMATION
CSF Aβ1-42 predicts cognitive impairment in de novo PD patients
 CSF Aβ1-42 predicts cognitive impairment in de novo PD patients Mark Terrelonge MPH *1, Karen Marder MD MPH 1, Daniel Weintraub MD 2, Roy Alcalay MD MS 1 1 Columbia University Department of Neurology 2
Imaging of Alzheimer s Disease: State of the Art
 July 2015 Imaging of Alzheimer s Disease: State of the Art Neir Eshel, Harvard Medical School Year IV Outline Our patient Definition of dementia Alzheimer s disease Epidemiology Diagnosis Stages of progression
Neuropsychiatric symptoms as predictors of MCI and dementia: Epidemiologic evidence
 16th Annual MCI Symposium January 20, 2018 Miami, FL Neuropsychiatric symptoms as predictors of MCI and dementia: Epidemiologic evidence Yonas E. Geda, MD, MSc Professor of Neurology and Psychiatry Consultant,
Exploration of a weighed cognitive composite score for measuring decline in amnestic MCI
 Exploration of a weighed cognitive composite score for measuring decline in amnestic MCI Sarah Monsell NACC biostatistician smonsell@uw.edu October 6, 2012 Background Neuropsychological batteries used
The Australian Imaging Biomarkers and Lifestyle Flagship Study of Ageing
 The Australian Imaging Biomarkers and Lifestyle Flagship Study of Ageing. (AUSTRALIAN ADNI) July 2013 UPDATE Imaging Christopher Rowe MD Neuroimaging stream leader June 2013 The Australian Imaging Biomarkers
UDS version 3 Summary of major changes to UDS form packets
 UDS version 3 Summary of major changes to UDS form packets from version 2 to VERSION 3 february 18 final Form A1: Subject demographics Updated question on principal referral source to add additional options
CHAPTER VI RESEARCH METHODOLOGY
 CHAPTER VI RESEARCH METHODOLOGY 6.1 Research Design Research is an organized, systematic, data based, critical, objective, scientific inquiry or investigation into a specific problem, undertaken with the
Clinical Study Depressive Symptom Clusters and Neuropsychological Performance in Mild Alzheimer s and Cognitively Normal Elderly
 Hindawi Publishing Corporation Depression Research and Treatment Volume 2011, Article ID 396958, 6 pages doi:10.1155/2011/396958 Clinical Study Depressive Symptom Clusters and Neuropsychological Performance
Neuropsychiatric Manifestations in Vascular Cognitive Impairment Patients with and without Dementia
 86 Neuropsychiatric Manifestations in Vascular Cognitive Impairment Patients with and without Dementia Pai-Yi Chiu 1,3, Chung-Hsiang Liu 2, and Chon-Haw Tsai 2 Abstract- Background: Neuropsychiatric profile
Characterizing Anatomical Variability And Alzheimer s Disease Related Cortical Thinning in the Medial Temporal Lobe
 Characterizing Anatomical Variability And Alzheimer s Disease Related Cortical Thinning in the Medial Temporal Lobe Long Xie, Laura Wisse, Sandhitsu Das, Ranjit Ittyerah, Jiancong Wang, David Wolk, Paul
NO LOWER COGNITIVE FUNCTIONING IN OLDER ADULTS WITH ATTENTION-DEFICIT/HYPERACTIVITY DISORDER
 CHAPTER 6 NO LOWER COGNITIVE FUNCTIONING IN OLDER ADULTS WITH ATTENTION-DEFICIT/HYPERACTIVITY DISORDER INT PSYCHOGERIATR, 2015, 27(9): 1467 1476 DOI: 10.1017/S1041610215000010 73 NO LOWER COGNITIVE FUNCTIONING
Alzheimer s disease dementia: a neuropsychological approach
 Alzheimer s disease dementia: a neuropsychological approach Dr. Roberta Biundo, PhD Neuropsychology Coordinator at Parkinson s disease and movement disorders unit of San Camillo rehabilitation hospital
Biomarkers Workshop In Clinical Trials Imaging for Schizophrenia Trials
 Biomarkers Workshop In Clinical Trials Imaging for Schizophrenia Trials Research focused on the following areas Brain pathology in schizophrenia and its modification Effect of drug treatment on brain structure
Quantitative Neuroimaging- Gray and white matter Alteration in Multiple Sclerosis. Lior Or-Bach Instructors: Prof. Anat Achiron Dr.
 Quantitative Neuroimaging- Gray and white matter Alteration in Multiple Sclerosis Lior Or-Bach Instructors: Prof. Anat Achiron Dr. Shmulik Miron INTRODUCTION Multiple Sclerosis general background Gray
The Australian Imaging, Biomarkers and Lifestyle Flagship Study of Ageing an example of Australian research on Alzheimer s disease
 The Australian Imaging, Biomarkers and Lifestyle Flagship Study of Ageing an example of Australian research on Alzheimer s disease AIBL: Two site collaborative study Study is conducted at two sites: Perth
An integrated natural disease progression model of nine cognitive and biomarker endpoints in patients with Alzheimer s Disease
 An integrated natural disease progression model of nine cognitive and biomarker endpoints in patients with Alzheimer s Disease Angelica Quartino 1* Dan Polhamus 2*, James Rogers 2, Jin Jin 1 212, Genentech
Hallucinations and conscious access to visual inputs in Parkinson s disease
 Supplemental informations Hallucinations and conscious access to visual inputs in Parkinson s disease Stéphanie Lefebvre, PhD^1,2, Guillaume Baille, MD^4, Renaud Jardri MD, PhD 1,2 Lucie Plomhause, PhD
Selection and Combination of Markers for Prediction
 Selection and Combination of Markers for Prediction NACC Data and Methods Meeting September, 2010 Baojiang Chen, PhD Sarah Monsell, MS Xiao-Hua Andrew Zhou, PhD Overview 1. Research motivation 2. Describe
NEUROPSYCHOMETRIC TESTS
 NEUROPSYCHOMETRIC TESTS CAMCOG It is the Cognitive section of Cambridge Examination for Mental Disorders of the Elderly (CAMDEX) The measure assesses orientation, language, memory, praxis, attention, abstract
Erin Cullnan Research Assistant, University of Illinois at Chicago
 Dr. Moises Gaviria Distinguished Professor of Psychiatry, University of Illinois at Chicago Director of Consultation Liaison Service, Advocate Christ Medical Center Director of the Older Adult Program,
Improving the Methodology for Assessing Mild Cognitive Impairment Across the Lifespan
 Improving the Methodology for Assessing Mild Cognitive Impairment Across the Lifespan Grant L. Iverson, Ph.D, Professor Department of Physical Medicine and Rehabilitation Harvard Medical School & Red Sox
White matter hyperintensities correlate with neuropsychiatric manifestations of Alzheimer s disease and frontotemporal lobar degeneration
 White matter hyperintensities correlate with neuropsychiatric manifestations of Alzheimer s disease and frontotemporal lobar degeneration Annual Scientific Meeting Canadian Geriatric Society Philippe Desmarais,
Regulatory Challenges across Dementia Subtypes European View
 Regulatory Challenges across Dementia Subtypes European View Population definition including Early disease at risk Endpoints in POC studies Endpoints in pivotal trials 1 Disclaimer No CoI The opinions
Neuropsychological Evaluation of
 Neuropsychological Evaluation of Alzheimer s Disease Joanne M. Hamilton, Ph.D. Shiley-Marcos Alzheimer s Disease Research Center Department of Neurosciences University of California, San Diego Establish
WHI Memory Study (WHIMS) Investigator Data Release Data Preparation Guide December 2012
 Investigator Data Release Data Preparation Guide December 2012") WHI Memory Study (WHIMS) Investigator Data Release Data Preparation Guide December 2012 1. Introduction Changes in the current update (December 2012): New data sets Post Trial - Form A, Phase 2: Administration
WHI Memory Study (WHIMS) Investigator Data Release Data Preparation Guide December 2012 1. Introduction Changes in the current update (December 2012): New data sets Post Trial - Form A, Phase 2: Administration
Methods to examine brain activity associated with emotional states and traits
 Methods to examine brain activity associated with emotional states and traits Brain electrical activity methods description and explanation of method state effects trait effects Positron emission tomography
Adverse Outcomes After Hospitalization and Delirium in Persons With Alzheimer Disease
 Adverse Outcomes After Hospitalization and Delirium in Persons With Alzheimer Disease J. Sukanya 05.Jul.2012 Outline Background Methods Results Discussion Appraisal Background Common outcomes in hospitalized
Yin-Hui Siow MD, FRCPC Director of Nuclear Medicine Southlake Regional Health Centre
 Yin-Hui Siow MD, FRCPC Director of Nuclear Medicine Southlake Regional Health Centre Today Introduction to CT Introduction to MRI Introduction to nuclear medicine Imaging the dementias The Brain ~ 1.5
Dementia. Assessing Brain Damage. Mental Status Examination
 Dementia Assessing Brain Damage Mental status examination Information about current behavior and thought including orientation to reality, memory, and ability to follow instructions Neuropsychological
Elderly Norms for the Hopkins Verbal Learning Test-Revised*
 The Clinical Neuropsychologist -//-$., Vol., No., pp. - Swets & Zeitlinger Elderly Norms for the Hopkins Verbal Learning Test-Revised* Rodney D. Vanderploeg, John A. Schinka, Tatyana Jones, Brent J. Small,
The current state of healthcare for Normal Aging, Mild Cognitive Impairment, & Alzheimer s Disease
 The current state of healthcare for Normal Aging, g, Mild Cognitive Impairment, & Alzheimer s Disease William Rodman Shankle, MS MD FACP Director, Alzheimer s Program, Hoag Neurosciences Institute Neurologist,
Supplemental Data. Inclusion/exclusion criteria for major depressive disorder group and healthy control group
 1 Supplemental Data Inclusion/exclusion criteria for major depressive disorder group and healthy control group Additional inclusion criteria for the major depressive disorder group were: age of onset of
Supplementary online data
 THELANCETNEUROLOGY-D-07-00083 Supplementary online data MRI assessments MRI at each site included a volumetric spoiled gradient echo (T1-weighted) sequence with slice partition thickness of 1 5 mm or less
USE OF BIOMARKERS TO DISTINGUISH SUBTYPES OF DEMENTIA. SGEC Webinar Handouts 1/18/2013
 Please visit our website for more information http://sgec.stanford.edu/ SGEC Webinar Handouts 1/18/2013 2013 WEBINAR SERIES STATE OF THE SCIENCE: DEMENTIA EVALUATION AND MANAGEMENT AMONG DIVERSE OLDER
Recognizing Dementia can be Tricky
 Dementia Abstract Recognizing Dementia can be Tricky Dementia is characterized by multiple cognitive impairments that cause significant functional decline. Based on this brief definition, the initial expectation
Cognitive Screening in Risk Assessment. Geoffrey Tremont, Ph.D. Rhode Island Hospital & Alpert Medical School of Brown University.
 Cognitive Screening in Risk Assessment Geoffrey Tremont, Ph.D. Rhode Island Hospital & Alpert Medical School of Brown University Outline of Talk Definition of Dementia and MCI Incidence and Prevalence
THE ROLE OF ACTIVITIES OF DAILY LIVING IN THE MCI SYNDROME
 PERNECZKY 15/06/06 14:35 Page 1 THE ROLE OF ACTIVITIES OF DAILY LIVING IN THE MCI SYNDROME R. PERNECZKY, A. KURZ Department of Psychiatry and Psychotherapy, Technical University of Munich, Germany. Correspondence
Learning objectives 6/20/2018
 Cognitive impairment of patients with chronic migraine, in a neuropsychological assessment, does not depend on the use of topiramate or comorbidities Ferreira KS, MD, PhD Professor, Neurology Clinic, Medicine
Cover Page. The handle holds various files of this Leiden University dissertation
 Cover Page The handle http://hdl.handle.net/1887/26921 holds various files of this Leiden University dissertation Author: Doan, Nhat Trung Title: Quantitative analysis of human brain MR images at ultrahigh
DSM-5 MAJOR AND MILD NEUROCOGNITIVE DISORDERS (PAGE 602)
") SUPPLEMENT 2 RELEVANT EXTRACTS FROM DSM-5 The following summarizes the neurocognitive disorders in DSM-5. For the complete DSM-5 see Diagnostic and Statistical Manualof Mental Disorders, 5th edn. 2013,
SUPPLEMENT 2 RELEVANT EXTRACTS FROM DSM-5 The following summarizes the neurocognitive disorders in DSM-5. For the complete DSM-5 see Diagnostic and Statistical Manualof Mental Disorders, 5th edn. 2013,
Differences in brain structure and function between the sexes has been a topic of
 Introduction Differences in brain structure and function between the sexes has been a topic of scientific inquiry for over 100 years. In particular, this topic has had significant interest in the past
BioArctic announces detailed results of the BAN2401 Phase 2b study in early Alzheimer s disease presented at AAIC 2018
 Press release BioArctic announces detailed results of the BAN2401 Phase 2b study in early Alzheimer s disease presented at AAIC 2018 Stockholm, Sweden, July 25, 2018 BioArctic AB (publ) (Nasdaq Stockholm:
Mild Cognitive Impairment
 Mild Cognitive Impairment Victor W. Henderson, MD, MS Departments of Health Research & Policy (Epidemiology) and of Neurology & Neurological Sciences Stanford University Director, Stanford Alzheimer s
ALZHEIMER'S DISEASE PREVENTION TRIALS
 ALZHEIMER'S DISEASE PREVENTION TRIALS Laurie Ryan, PhD Chief, Dementias of Aging Branch & Program Director, Alzheimer s Disease Clinical Trials Division of Neuroscience National Institute on Aging/National
UNIVERSITY OF CALGARY. Predicting Cognitive Decline in Patients with TIA and Minor Stroke. Muhammad Amlish Munir A THESIS
 UNIVERSITY OF CALGARY Predicting Cognitive Decline in Patients with TIA and Minor Stroke by Muhammad Amlish Munir A THESIS SUBMITTED TO THE FACULTY OF GRADUATE STUDIES IN PARTIAL FULFILMENT OF THE REQUIREMENTS
SUPPLEMENTARY MATERIAL. Table. Neuroimaging studies on the premonitory urge and sensory function in patients with Tourette syndrome.
 SUPPLEMENTARY MATERIAL Table. Neuroimaging studies on the premonitory urge and sensory function in patients with Tourette syndrome. Authors Year Patients Male gender (%) Mean age (range) Adults/ Children
Assessing and Managing the Patient with Cognitive Decline
 Assessing and Managing the Patient with Cognitive Decline Center of Excellence For Alzheimer s Disease for State of NY Capital Region Alzheimer s Center of Albany Medical Center Earl A. Zimmerman, MD Professor
Minimizing Misdiagnosis: Psychometric Criteria for Possible or Probable Memory Impairment
 Original Research Article DOI: 10.1159/000215390 Accepted: January 30, 2009 Published online: April 28, 2009 Minimizing Misdiagnosis: Psychometric Criteria for Possible or Probable Memory Impairment Brian
Dementia, Cognitive Aging Services and Support
 Dementia, Cognitive Aging Services and Support Ronald C. Petersen, Ph.D., M.D. Professor of Neurology Mayo Clinic College of Medicine Rochester, MN NASUAD Washington September 2, 2015 Disclosures Pfizer,
Sum of Neurally Distinct Stimulus- and Task-Related Components.
 SUPPLEMENTARY MATERIAL for Cardoso et al. 22 The Neuroimaging Signal is a Linear Sum of Neurally Distinct Stimulus- and Task-Related Components. : Appendix: Homogeneous Linear ( Null ) and Modified Linear
Issues to Consider in the Clinical Evaluation and Development of Drugs for Alzheimer s Disease. The University of Tokyo Hospital
 Project to Promote the Development of Innovative Pharmaceuticals, Medical Devices, and Regenerative Medical Products (Ministry of Health, Labour, and Welfare) Regulatory Science Research for the Establishment
Recent publications using the NACC Database. Lilah Besser
 Recent publications using the NACC Database Lilah Besser Data requests and publications Using NACC data Number of requests by year Type 2009 2010 2011 2012 2013 2014 2015 Data files* 55 85 217 174 204
Classification and Statistical Analysis of Auditory FMRI Data Using Linear Discriminative Analysis and Quadratic Discriminative Analysis
 International Journal of Innovative Research in Computer Science & Technology (IJIRCST) ISSN: 2347-5552, Volume-2, Issue-6, November-2014 Classification and Statistical Analysis of Auditory FMRI Data Using
Use of Multimodal Neuroimaging Techniques to Examine Age, Sex, and Alcohol-Related Changes in Brain Structure Through Adolescence and Young Adulthood
 American Psychiatric Association San Diego, CA 24 May 2017 Use of Multimodal Neuroimaging Techniques to Examine Age, Sex, and Alcohol-Related Changes in Brain Structure Through Adolescence and Young Adulthood
Mild cognitive impairment A view on grey areas of a grey area diagnosis
 Mild cognitive impairment A view on grey areas of a grey area diagnosis Dr Sergi Costafreda Senior Lecturer Division of Psychiatry, UCL Islington Memory Service, C&I NHS FT s.costafreda@ucl.ac.uk London
Developing More Effective Paradigms for Assessing and Monitoring Cognitive Change Across the MCI and PreMCI Spectrum
 Developing More Effective Paradigms for Assessing and Monitoring Cognitive Change Across the MCI and PreMCI Spectrum David A. Loewenstein, PhD Rosie Curiel PsyD Sara Czaja, PhD University of Miami School
Psychological factors that influence fall risk: implications for prevention
 Psychological factors that influence fall risk: implications for prevention Kaarin J. Anstey Professor & Director, Ageing Research Unit, Centre for Mental Health Research Psychological perspective on Injury
The Australian Imaging Biomarkers and Lifestyle Flagship Study of Ageing
 The Australian Imaging Biomarkers and Lifestyle Flagship Study of Ageing. (AUSTRALIAN ADNI) July 2012 UPDATE Imaging Christopher Rowe MD Neuroimaging stream leader October 2011 The Australian Imaging Biomarkers
EXPEDITION3: A Phase 3 Trial of Solanezumab in Mild Dementia due to Alzheimer s Disease
 EXPEDITION3: A Phase 3 Trial of in Mild Dementia due to Alzheimer s Disease Lawrence S. Honig, MD, PhD On behalf of the EXPEDITION3 Study Team Disclosure Statement I will discuss investigational use only.
Intra-Individual Reaction Time Variability in Mild Cognitive Impairment and Alzheimer s Disease: Gender, Processing Load and Speed Factors
 Intra-Individual Reaction Time Variability in Mild Cognitive Impairment and Alzheimer s Disease: Gender, Processing Load and Speed Factors Michelle Phillips 1, Peter Rogers 2, Judy Haworth 3, Antony Bayer
Localizing lesion locations to predict extent of aphasia recovery. Abstract
 Localizing lesion locations to predict extent of aphasia recovery Abstract Extensive research has related specific lesion locations to language impairment in aphasia. However, far less work has focused
Supplementary Online Content
 Supplementary Online Content Van Laere K, Vanhee A, Verschueren J, et al. Value of 18 fluorodeoxyglucose positron-emission tomography in amyotrophic lateral sclerosis. JAMA Neurol. Published online March
Mild Cognitive Impairment or Mild Neurocognitive Disorder: Implications for Clinical Practice. Hypothesized Key Players in the Pathogenesis of AD
 AD is a Neurodegenerative Disease as Seen in the PET Scan and is Characterized by Amyloid Plaques and Neurofibrillary Tangles Mild Cognitive Impairment or Mild Neurocognitive Disorder: Implications for
Functional Elements and Networks in fmri
 Functional Elements and Networks in fmri Jarkko Ylipaavalniemi 1, Eerika Savia 1,2, Ricardo Vigário 1 and Samuel Kaski 1,2 1- Helsinki University of Technology - Adaptive Informatics Research Centre 2-
Marshall et al. Alzheimer's Research & Therapy (2019) 11:4 (Continued on next page)
 11:4 (Continued on next page)") Marshall et al. Alzheimer's Research & Therapy (2019) 11:4 https://doi.org/10.1186/s13195-018-0464-x RESEARCH Open Access Measuring instrumental activities of daily living in non-demented elderly: a comparison
Marshall et al. Alzheimer's Research & Therapy (2019) 11:4 https://doi.org/10.1186/s13195-018-0464-x RESEARCH Open Access Measuring instrumental activities of daily living in non-demented elderly: a comparison
Copyright 2002 American Academy of Neurology. Volume 58(8) 23 April 2002 pp
 23 April 2002 pp") Copyright 2002 American Academy of Neurology Volume 58(8) 23 April 2002 pp 1288-1290 Improved executive functioning following repetitive transcranial magnetic stimulation [Brief Communications] Moser,
Copyright 2002 American Academy of Neurology Volume 58(8) 23 April 2002 pp 1288-1290 Improved executive functioning following repetitive transcranial magnetic stimulation [Brief Communications] Moser,
fmri and Voxel-based Morphometry in Detection of Early Stages of Alzheimer's Disease
 fmri and Voxel-based Morphometry in Detection of Early Stages of Alzheimer's Disease Andrey V. Sokolov 1,3, Sergey V. Vorobyev 2, Aleksandr Yu. Efimtcev 1,3, Viacheslav S. Dekan 1,3, Gennadiy E. Trufanov
Tutorial 3: MANOVA. Pekka Malo 30E00500 Quantitative Empirical Research Spring 2016
 Tutorial 3: Pekka Malo 30E00500 Quantitative Empirical Research Spring 2016 Step 1: Research design Adequacy of sample size Choice of dependent variables Choice of independent variables (treatment effects)
Supplementary Online Content
 Supplementary Online Content Schlaeger R, Papinutto N, Zhu AH, et al. Association between thoracic spinal cord gray matter atrophy and disability in multiple sclerosis. JAMA Neurol. Published online June
isc ove ring i Statistics sing SPSS
 isc ove ring i Statistics sing SPSS S E C O N D! E D I T I O N (and sex, drugs and rock V roll) A N D Y F I E L D Publications London o Thousand Oaks New Delhi CONTENTS Preface How To Use This Book Acknowledgements