PINNIPED PREDATION ON ADULT SALMONIDS AND OTHER FISH IN THE BONNEVILLE DAM TAILRACE,
|
|
|
- Henry Poole
- 6 years ago
- Views:
Transcription


1 PINNIPED PREDATION ON ADULT SALMONIDS AND OTHER FISH IN THE BONNEVILLE DAM TAILRACE, By Sean C. Tackley Robert J. Stansell Karrie M. Gibbons U.S. Army Corps of Engineers CENWP-OP-SRF Fisheries Field Unit Bonneville Lock and Dam Cascade Locks, OR (541) April 2, 2008
2 ii
3 EXECUTIVE SUMMARY Since 2002, the Fisheries Field Unit (FFU) has used surface observations to evaluate the seasonal presence, abundance, and predation activities of pinnipeds, including California sea lions (Zalophus californianus), Steller sea lions (Eumetopias jubatus), and harbor seals (Phoca vitulina) in the Bonneville Dam tailrace. This monitoring program was initiated in response to concerns over the potential impact of California sea lion predation on adult salmonids passing Bonneville Dam in the spring, including spring Chinook salmon (Oncorhynchus tshawytscha) and steelhead (O. mykiss). This report summarizes observations from 2005 through Observers stationed at each of the three major tailrace areas of the dam (Powerhouse One [PH1], Powerhouse Two [PH2], and the spillway) recorded pinniped presence, recorded and identified fish catches, and identified individual California sea lions when possible. Individual pinnipeds were identified by cataloging unique physical characteristics and (for previously trapped and tagged animals) unique brand numbers. Individual identification was used to generate abundance estimates and to track individual predation and movement patterns, both within and among years. Observations generally began when California sea lions were seen at the dam on consecutive days, and monitoring ceased when the last sea lions departed each year. This study period included the fish passage season from 1 January to 31 May, with special attention paid to the spring Chinook salmon passage season at Bonneville Dam (15 March through 31 May). Few pinniped sightings occurred outside this timeframe. Observations were generally made from just prior to sunrise to just after sunset, 7 days per week. Observations made from 2002 to 2004 suggested that pinniped activity was minimal at night. Total estimated salmonid catch has ranged between 3,000 and 4,000 since The relative impact on the 1 January to 31 May run has varied with the number of fish passing each spring, which has declined from a 6-year high of 284,733 in 2002 to 88,474 in An estimated 2,920 adult salmonids (3.4% of the run) were consumed by pinnipeds in the tailrace of Bonneville Dam during the January to 31 May fish passage season. An estimated 3,023 adult salmonids (2.8% of the run) were consumed in 2006, and an estimated 3,859 adult salmonids (4.2% of the run) were consumed in Additional salmonids were caught by pinnipeds but escaped and swam away with unknown levels of injuries (0.5%, 3.1%, and 1.3% of total salmonid catch in 2005, 2006, and 2007, respectively). Prior to 2005, PH2 consistently showed the highest level of predation on salmonids, but in recent years, predation activity has become more diffuse, with PH1 accounting for about half of all salmonid catches in 2006 and Salmonid catch at the spillway increased in 2007, likely in response to hazing activities at PH1 and PH2. Pacific lamprey (Lampetra tridentata), white sturgeon (Acipenser transmontanus), and other fish were also consumed by pinnipeds on the surface. Lamprey comprised 9.4% of the total observed catch from 2005 to 2007, although lamprey catch is probably underestimated. Estimated lamprey catch has declined since it peaked in 2004 and 2005 with 816 and 810 estimated catches, respectively. An estimated 143 lamprey were caught by sea lions in White sturgeon was the most commonly observed prey item for Steller sea lions, which made 97.8% of the 625 sturgeon catches observed during our study. Estimated sturgeon catch increased from a iii
4 single catch (2005), to 315 (2006), and 467 (2007), so there is growing concern about the potential impact of Steller sea lions on sturgeon at Bonneville Dam. The total number of sea lions observed at Bonneville Dam has been relatively stable since 2005, but overall presence has increased as both California and Steller sea lions arrived earlier each year. Eighty-five individual pinnipeds were identified in 2005, 85 in 2006, and 80 in Most pinnipeds seen at Bonneville Dam are California sea lions, but Steller sea lion numbers have increased since From 2003 to 2005, about 2 to 4 Steller sea lions were observed at the dam. This number grew to 10 in 2006 and 9 in Harbor seals are seen only occasionally at the dam. The highest number of individual pinnipeds observed at the project on any one day has steadily increased, with a maximum daily count of 43 in 2005, 46 in 2006, and 54 in The mean number of pinnipeds observed per day during our study period was 18.9(standard deviation [s] = 10.1) in 2005, 20.3(s = 13.3) in 2006, and 15.7(s = 13.0) in The Corps and other federal, state, and tribal agencies implemented a variety of sea lion deterrents at Bonneville Dam from 2005 to Physical barriers called sea lion exclusion devices (SLEDs) installed at all primary fishway entrances, and floating orifice gate (FOG) barriers have proved effective in preventing all but one sea lion from entering fishways. In 2006, we tested the efficacy of a hazing (cracker shells, rubber bullets, etc.) and acoustic deterrent combination for reducing total salmonid catch and pinniped presence. The hazing and acoustic combination failed to reduce salmonid catch or pinniped presence significantly for the whole project, but pinniped activity was reduced near fishway entrances. Acoustic deterrent devices (ADDs) mounted at fishway entrances have had no obvious effect on sea lion predation activity near fishways, but observers could only infer response to ADDs and other deterrents based on surface activity. Intensive hazing, both by boat-based and dam-based personnel from various agencies, seems to affect the behavior of both California and Steller sea lions, although Steller sea lions seem more responsive to hazing efforts. Steller sea lion presence declined and predation on sturgeon effectively halted in response to full-time hazing activity in 2006 and The spillway became a kind of sea lion sanctuary in 2007, as full-time, intensive hazing efforts at PH1 and PH2 encouraged California sea lions to use the spillway tailrace. The spillway was extremely turbulent after April 10, which prevented boat access and limited the effectiveness of noise-based deterrents used by dam-based hazers. Relocation efforts in 2007 also failed. Ten of 11 California sea lions that were trapped by Oregon Department of Fish and Wildlife (ODFW), Washington Department of Fish and Wildlife (WDFW), and National Oceanic and Atmospheric Administration (NOAA) personnel and released on the Oregon coast returned to Bonneville Dam before the end of the observation season. Despite the increasingly protracted and visible sea lion presence at the dam, the total number of sea lions present and total salmonid catch may be stabilizing. This monitoring effort should continue, particularly in light of management actions that include the possible lethal removal of some California sea lions. The Corps should work with partnering agencies to evaluate impacts of pinniped predation in areas farther downstream of the dam. The Corps should also continue to evaluate potential non-lethal sea lion deterrent technologies as part of a long-term strategy to reduce sea lion predation on salmonids, sturgeon, and lamprey in the Bonneville Dam tailrace. iv
5 TABLE OF CONTENTS EXECUTIVE SUMMARY...iii TABLE OF CONTENTS... v LIST OF TABLES... vii LIST OF FIGURES...viii INTRODUCTION... 1 BACKGROUND... 1 OBJECTIVES... 3 METHODS... 4 SITE DESCRIPTION... 4 OBSERVATION AREAS... 4 OBSERVATIONS... 5 INDIVIDUAL IDENTIFICATION... 5 DETERRENT EVALUATIONS PREDATION ESTIMATES... 9 RESULTS PREDATION ACTIVITY Predation on Adult Salmonids Predation on Pacific Lamprey Predation on White Sturgeon PINNIPED ACTIVITY California Sea Lions Steller Sea Lions Harbor Seals Haul-Out Sites Navigation Lock Passage and Forebay Sightings Fishway Incursions DETERRENT RESULTS DISCUSSION PREDATION AND PINNIPEDS DETERRENTS LETHAL REMOVAL PREDATION IN THE LOWER COLUMBIA RIVER RECOMMENDATIONS ACKNOWLEDGMENTS REFERENCES APPENDICES Appendix A. Summary of historical documentation of pinniped presence in the Columbia River v
6 Appendix B. Number and percent (%) of highly-identifiable California sea lions (HIA) that were identified and returned to Bonneville Dam in subsequent years ( ) Appendix C. Assumptions made to determine the number of individual sea lions present and to determine estimates of salmonids and other fish caught by pinnipeds Appendix D. Hourly pinniped observation form from 2007 season Appendix E. Photographs of typical scars and brands used to identify individual California sea lions Appendix F. Sea lion haul-out locations at Bonneville Dam Appendix G. Photographs of sea lion exclusion devices (SLEDs) installed at 12 main fishway entrances at Bonneville Dam Appendix H. Photograph of floating orifice gate (FOG) with stab plate barriers, designed to prevent pinnipeds from entering the fishway collection channel at PH Appendix I. Photographs of Airmar db Plus II acoustic deterrent device (ADD) deployed at all main fishway entrances Appendix J. Photographs of floating platform sea lion trap operations (2007) Appendix K. Total observed (unexpanded) number of fish caught by pinnipeds in the Bonneville Dam tailrace ( ) Appendix L. Diel distribution of observed salmonid catch ( ) Appendix M. Mean (with standard deviation) and maximum number of days individual California sea lions were observed at Bonneville Dam ( ) Appendix N. Summary of California sea lion sightings upstream of Bonneville Dam ( ) Appendix O. Summary of results from 2005 hazing evaluation vi
7 LIST OF TABLES Table 1. Hours observed, salmonids caught, expanded estimate of salmonids caught, estimated catch rate, total salmonids passing Bonneville Dam, and percentage of salmonids taken by pinnipeds from 1 January to 31 May ( ) Table 2. Percent of salmonids caught at each tailrace area, based on expanded estimates at each site ( ) Table 3. Hours observed, total observed number of Pacific lamprey caught, and expanded estimates of Pacific lamprey catch at Bonneville Dam ( ) Table 4. Frequency of lamprey catches at Bonneville Dam tailrace areas, based on expanded estimates at each site ( ) Table 5. Hours observed, total observed number of white sturgeon caught, and expanded estimates of white sturgeon catch at Bonneville Dam ( ) Table 6. Estimated total number of pinnipeds present at Bonneville Dam ( ) Table 7. Number of highly identifiable, likely identifiable, and not likely identifiable California sea lions observed at Bonneville Dam ( ) Table 8. Results of the 2006 sea lion hazing and acoustic deterrent evaluation (April 2 to May 27) vii
8 LIST OF FIGURES Figure 1. Map of Bonneville Lock and Dam, with pinniped observation areas highlighted... 4 Figure 2. Expanded estimated number of adult salmonids (Oncorhynchus spp.) caught by pinnipeds in the Bonneville Dam tailrace ( ) Figure 3. Diurnal salmonid catch by pinnipeds, per observation hour, in Bonneville Dam tailrace ( ) Figure 4. Mean (with standard deviation) daily number of adult salmonids caught during peak predation season ( ), during which 80% of total expanded salmonid catch occurred..14 Figure 5. Number of days included in the peak predation season, during which 80% of total expanded salmonid catch occurred Figure 6. Total daily observed Pacific lamprey catch by pinnipeds at Bonneville Dam ( ) Figure 7. Diel distribution of Pacific lamprey catch by pinnipeds, per hour of observation ( ) Figure 8. Total daily observed white sturgeon catch by pinnipeds at Bonneville Dam in 2006 and Figure 9. Size distribution of white sturgeon caught by sea lions at Bonneville Dam in 2006 and 2007, from estimated total lengths (ft) recorded by observers (n=537) Figure 10. Daily minimum estimated number of pinnipeds (California sea lions, Steller sea lions, and harbor seals) present at Bonneville Dam ( ) Figure 11. Mean (with standard deviation) and maximum daily estimated number of pinnipeds (California sea lions, Steller sea lions, and harbor seals) present during the peak predation season (80% of total salmonid catch) at Bonneville Dam ( ) Figure 12. Daily estimated number of Steller sea lions present at Bonneville Dam ( ) viii
9 INTRODUCTION BACKGROUND The increasing seasonal presence of pinnipeds at Bonneville Dam on the Columbia River is a growing concern to fisheries managers. California sea lions (Zalophus californianus) and Steller sea lions (Eumetopias jubatus) congregate below the dam in the winter and spring to prey on Chinook salmon (Oncorhynchus tshawytscha), steelhead (Oncorhynchus mykiss), white sturgeon (Acipenser transmontanus), Pacific lamprey (Lampetra tridentata), and other fish. The impacts of this predation on Endangered Species Act (ESA) listed salmonids and other fish populations are poorly understood. Historical records of the presence of pinnipeds in the Columbia River are few (Appendix A), but pinnipeds were documented as far upriver as Celilo Falls and The Dalles in historic times (Thwaites 1969; Oregon State Board of Fish Commissioners 1889). In the early 1900s, concerns about the impact of pinnipeds on Columbia River salmon and other fisheries prompted the states of Oregon and Washington to initiate pinniped bounty programs. These bounty programs, which were active through the 1960s, and the construction of Bonneville Dam (1938) and The Dalles Dam (1960) reduced the presence of harbor seals (Phoca vitulina) and sea lions in the Columbia River. All marine mammals, including seals and sea lions, received federal protection under the Marine Mammal Protection Act of 1972 (MMPA). California sea lion numbers have increased dramatically since the 1970s. A 2003 study estimated the population size at about 250,000 animals (NOAA). California sea lions, mostly adult and sub-adult males, can be seen in the lower Columbia River throughout most of the year. In the summer (June-August), the sea lions return to breeding rookeries in southern California. One or two sea lions in the tailrace of Bonneville Dam were reported during fishway inspections almost every year from 1980 to However, in 2001, there were reports of up to six sea lions observed at one time at Bonneville Dam. The eastern stock of Steller sea lions, which includes the animals found in the Columbia River estuary year-round, is listed as threatened under ESA. The current eastern stock population estimate is about 31,000 animals. Harbor seals (Phoca vitulina) are present in the Columbia River estuary year-round, but particularly in the spring and fall when large numbers of salmon are present, and in the winter during smelt (Thaleichthys pacificus) migration. Harbor seals are seen throughout the year at Bonneville Dam, but continue to have a very minor presence. About 25,000 animals comprise the Oregon/Washington stock of harbor seals. The 2000 Federal Columbia River Power System Biological Opinion (section , action Item 106) called for an evaluation of marine mammal predation in the tailrace of Bonneville Dam. This document cited high rates of marine mammal tooth and claw abrasions on fish examined at the Lower Granite Dam adult trapping facility from (Harmon et al. 1993). In April of 2001, after several pinnipeds had been seen for a month in the Bonneville Dam tailrace, the Fisheries Field Unit (FFU) was directed to document the number of pinnipeds present and to determine their departure date. We began observing on 11 April, and saw the last pinniped on 13 May. The highest number of pinnipeds observed at any one time was six. Since 2002, we have monitored pinniped activity at Bonneville Dam during the 1 January through 31 May fish passage season. Since 2002, we have used thousands of hours of observations to 1
10 determine the timing and duration of pinniped predation activity, estimate the number of fish caught, record the number of pinnipeds present, identify and track individual California sea lions, and evaluate various pinniped deterrents used at the dam. A comprehensive report on the first three years of this study can be found in Stansell (2004). Full-time pinniped observations, prompted by consistent sightings of at least one animal, began earlier each year from 2002 to Although some sightings were reported earlier in the season, full-time observations did not begin until 21 March (2002), 3 March (2003), and 24 February (2004). Observations concluded by the last week in May or first week of June, when the last of the pinnipeds left the area for the season. As the observation season became more protracted, pinniped numbers also increased. The maximum number of individual pinnipeds observed on any single day increased from 14 in 2002 to 37 in 2004, while the mean number of pinnipeds observed per day increased from 4 in 2002 to 14 in The total number of California sea lions seen in the Bonneville Dam tailrace increased dramatically from 2002 to 2003, rising from at least 30 to at least 101. The number of individual California sea lions returning also increased during the study period. We identified at least 14 individual California sea lions in 2003 as returns from We identified at least 43 individual California sea lions in 2004 as returns from 2003, 12 of those having been also seen in 2002 (Appendix B). Harbor seals had a minor presence in our study area, with only one or two individuals documented each year. No Steller sea lions were observed in 2002, but their presence in the Bonneville Dam tailrace has increased in recent years. Observers documented at least 3 individual Steller sea lions in 2003 and 2 in The rise in California sea lion presence increased the impact of pinniped predation on returning adult salmonids from 2002 to An estimated 1,010 adult salmonids (0.4% of the run) were consumed by pinnipeds in the tailrace of Bonneville Dam during the January to 31 May fish passage season. An estimated 2,329 adult salmonids (1.1% of the run) were consumed in 2003, and an estimated 3,533 adult salmonids (1.9% of the run) were consumed in Additional salmonids were caught by pinnipeds but escaped and swam away with unknown levels of injuries (11.9%, 9.5%, and 1.8% of total salmonid catch in 2002, 2003, and 2004 respectively). Observers also reported pinniped predation on Pacific lamprey, American shad (Alosa sapidissima), yearling salmonids, centrarchids, and Northern pikeminnow (Ptychocheilus oregonensis). Although likely underestimated, lamprey comprised at least 4.6% to 13.1% of the total catch observed while shad comprised up to 3.3% of the total catch. Observations continued in the spring of 2005, when pinniped activity at Bonneville Dam became a serious and visible issue as first one, and then several sea lions began entering the fishways. Non-lethal pyrotechnics were used to haze sea lions out of the fishways and physical barriers called sea lion exclusion devices (SLEDs) were installed at fishway entrances on 30 May. Some hazing, which involved the use of non-lethal pyrotechnics and rubber bullets, from boats was also conducted. In 2006 and 2007, we continued observations and evaluated the effectiveness of various deterrents and barriers used at the dam. Physical barriers and deterrents included SLEDs at all main fishway entrances and barriers at floating orifice gates (FOGs), acoustic deterrent devices (ADDs) at all primary fishway entrances, dam-based hazing by contracted U.S. Department of Agriculture (USDA) Wildlife Services personnel, and hazing from boats by state, tribal, and other personnel. 2
11 OBJECTIVES 1. Estimate the number of adult salmonids and other fish consumed by pinnipeds in the Bonneville Dam tailrace and estimate the proportion of the adult salmonid run impacted. 2. Determine the seasonal timing and abundance of pinnipeds present at the Bonneville Dam tailrace, documenting individual California sea lion presence and predation activity when possible. 3. Evaluate the effectiveness of pinniped deterrents and barriers used at Bonneville Dam. 3
12 METHODS SITE DESCRIPTION Bonneville Lock and Dam (river mile 146) is the first hydroelectric dam upstream from the mouth of the Columbia River. Construction of Powerhouse One (PH1), the spillway (main dam), and navigation lock was completed by Powerhouse Two (PH2) was completed in 1982, and a new navigation lock replaced the original lock system in The tailrace of the dam is divided into three main channels separated by Robins Island, Bradford Island, and Cascades Island (Figure 1). Tanner Creek, a minor tributary, empties into the Columbia River on the Oregon shore, about 2 km downstream of the dam. N WASHINGTON Hamilton Island Columbia River Robins Island Bradford Island Cascades Island Spillway PH2 Tanner Creek PH1 Primary Observation Area OREGON Figure 1. Map of Bonneville Lock and Dam, with pinniped observation areas highlighted. OBSERVATION AREAS From 2005 to 2007, we observed pinniped activity primarily at the powerhouse and spillway tailraces. Observers were stationed at the powerhouse decks and at an observation point on the north shoreline of Bradford Island at the spillway (Figure 1). Portions of the tailrace of the three main channels were not visible from the observer locations. Bends in the shorelines and limitations on the effective distance for detailed observations limited the size of the primary observation areas. Therefore, we defined each tailrace observation area as the area between the face of the dam structure (PH1, PH2, and spillway) and a line-of-sight about ¾ of the distance to the Washington shore (Figure 1). We defined our study area as the three tailrace observation areas combined. 4
13 Additional observations were made near the mouth of Tanner Creek, and from the downstream ends of Robins, Bradford, and Cascades islands. Data from these locations were not included in most analyses because observed fish catches often overlapped with those from primary observation areas, and our previous work suggested that most pinniped activity was concentrated in near-dam areas (Stansell 2004). OBSERVATIONS We used surface observation techniques similar to those described in Stansell (2004). The study period was from 1 January through 31 May, but observations were made intermittently until sea lions were seen consistently. Observations were generally made during all daylight hours (dawn until dusk), five to seven days per week, during the regular observation season. A single observer was stationed at each of the PH1, PH2, and spillway tailraces for one of two 5 to 8-hour shifts: morning (dawn to mid-day), or afternoon (mid-day to dusk). Observations started and ended on the hour, but the total number of observation hours, and the start and end times of the shifts varied with day length. Observers rotated between observation locations from day to day. Some observations were conducted at night, aided by night-vision binoculars and a 2 million candle-power spotlight. Assumptions made regarding surface observations are included in Appendix C. Observers used 8x30 binoculars to monitor pinniped activity in the tailrace observation areas. Observations were recorded on standardized hourly forms (Appendix D). Information recorded by observers included date, observation hour (later converted to PST), tailrace observation area, estimated number of individual pinnipeds present per hour, individual pinnipeds identified, the prey type and time of each fish catch event. Observers reported a fish catch as lost if the fish was caught, and subsequently lost (alive) by the pinniped. When possible, observers identified the individual pinniped responsible for the fish catch. Descriptions and sketches of special physical characteristics or behavior that would help distinguish one pinniped from another were noted. When time and opportunity permitted, video or photos of individuals were taken to document distinctive characteristics or to record predation events. During pinniped deterrent evaluations in 2006, observers separately recorded pinniped activity and hazing activities within 100 feet of fishway entrances. Pinnipeds moved between observation areas throughout the day. Observers used two-way radios to confirm the presence or absence of individual pinnipeds at each tailrace, discuss individual characteristics for identification, and to loosely track movements of individuals between tailraces. This communication also ensured that fish catches were not double-counted as pinnipeds drifted downstream, between observation areas. INDIVIDUAL IDENTIFICATION Individual California sea lion identification was used to determine the number of sea lions present (daily and seasonally), and to track individual presence and predation activity. Since Steller sea lion and harbor seal presence was relatively minor at the dam, we did not attempt to identify and track individuals of these species. However, our seasonal estimates of Steller sea lion and harbor seal abundance, which should be considered minimum abundance estimates, 5
14 were derived from simultaneous multiple sightings across the study area, and from sightings of individual animals that were sufficiently different in appearance (size, coat color, coat pattern) to allow at least within-day identification. We used video and photos from digital video recorders equipped with 12X optical zoom lenses, 35mm cameras, field sketches, and observer notes to identify unique marks for individual California sea lions, and to confirm identities of individuals seen by multiple observers. We identified individual pinnipeds by noting a combination of physical characteristics such as placement of cuts, scars, lumps, color patterns, size, maturity, tags (brands), and behavior (Appendix E). Several behavioral and physical factors aided observers in the identification process. The longer an individual animal was present, the more time it spent above the water surface or hauled-out on land, and the more closely it approached observation positions, the easier it was for us to detect enough characteristics to identify it. Hazing activities altered the behavior of some individuals, with sometimes negative impacts on the individual identification process. Hazing activity prompted some animals to stay farther away from dam structures and to spend more time below the surface of the water. Individual identification efforts were also hindered when sea lions were chased off haul-out locations (Appendix F) before observers had an opportunity to identify the animals. Variation in physical characteristics also made some individuals more difficult to identify than others. Some had obvious markings that were readily visible; others had subtle markings or scars that were rarely seen, or that were not visible in subsequent years. Due to variation in physical appearance and behavior, identified individuals were assigned to categories of certainty. The first category included highly identifiable animals, or animals that were branded and those with marks or features that made them unique and likely to be identified in subsequent years (e.g. circle scars, major deformities, major scars or wounds). The second category included likely identifiable animals, which were animals that had unique marks or features, but were more difficult to observe. These animals had characteristics which allowed us to identify the individual within a particular year, but the marks or features were probably not good enough to identify the individual in subsequent years (e.g. small fresh cuts or wounds, subtle color patterns, missing patches of fur). The third category included not likely identifiable individuals, which included animals that lacked unique distinguishing marks or features, but displayed enough physical or behavioral nuances that within a day or short period of time, we could distinguish individuals from the others in our study area. However, there would be no chance of identifying particular animals again in subsequent years or outside of our study area, and if an animal left for some time and returned, we could not be certain it was the same individual. Additionally, some animals had virtually no identifying marks or features, never came in close enough for identification, did not stay long enough, or did not spend enough time above water for observers to note any characteristics that would distinguish them from other animals. These additional animals could be counted in daily tallies to determine how many pinnipeds were present, but we could see them the next day and have no idea if they were the same animal or a different one, so they could not be used for annual tallies of individual sea lions. Animals in the highly identifiable category were used to determine number and percent of individuals returning each year. Animals in the high and likely categories were added to determine the minimum number of individuals seen for each entire season or year. The not 6
15 likely identifiable category was used for daily tallies to determine the minimum number of pinnipeds seen per day. DETERRENT EVALUATIONS We used and evaluated a variety of pinniped deterrents, from physical barriers to non-lethal harassment (hazing) techniques, from 2005 to Sea lion exclusion devices (SLEDs, Appendix G) are large, barred, grate-like physical barriers that were installed at Bonneville Dam s twelve primary fishway entrances to prevent sea lions from entering the fishways. The SLEDs feature in (39.05 cm) gaps that are designed to allow fish passage. Floating orifice gates (FOGs) were equipped with barriers to prevent sea lions from entering the fishway collection channel running below deck of PH2 (Appendix H). Airmar db Plus II * acoustic deterrent devices (ADDs), which emit a 205 decibel sound in the 15 khz range, were installed at fishway entrances (Appendix I). Hazing involved a combination of acoustic, visual, and tactile non-lethal deterrents, including vessel chasing, above-water pyrotechnics (cracker shells, screamer shells or rockets), rubber bullets or rubber buckshot, and underwater percussive devices known as seal bombs Deterrents were first used at Bonneville Dam to attempt to keep sea lions from preying on salmonids and other fish in Hazing of sea lions that entered fishways began on 13 April and continued through the season. Above-water pyrotechnics were used initially, with rubber bullets being added to the effort later in the season. In May, additional hazing was conducted by ODFW, WDFW, NOAA, and Corps personnel, from the dam and boats, to see if sea lions could be chased away from fishway entrances and out of the tailrace. Deterrents included above water pyrotechnics, rubber bullets, and seal bombs. On 5 May, at about 1200 h, several personnel stationed at the tailrace deck of PH2 used seal bombs simultaneously to attempt to drive sea lions away from fishway entrances. About 3 to 5 minutes later, personnel used a second round of seal bombs. Immediately following this hazing, teams on three boats moved upstream of the sea lions and used above-water and underwater pyrotechnics to chase them downstream to the tip of Cascades Island, where they created a picket and attempted to keep any animals from entering the powerhouse tailrace. This method was repeated on 6 May at both powerhouse tailrace areas. On 17 and 18 May, this process was again repeated, with the addition of more dam-based hazing from the tailrace decks and downstream shorelines of the tailrace areas. Observers recorded the number of pinnipeds present and the predation before, during, and after these periods of harassment. In addition, fish counts were examined closely for possible impacts to fish passage with use of underwater pyrotechnics. Four prototype SLEDs were designed and built for deployment at fishway entrances. The SLEDs were installed the week of 30 May, but most sea lions had left the Bonneville Dam area by this date (Pinniped Results, Figure 10). Three acoustic deterrent devices (ADDs), loaned by NOAA, were deployed on 21 April in the Washington shore ladder junction pool, near PH2. * Use of product name does not imply endorsement by the U.S. Army Corps of Engineers 7
16 2006 In 2006, SLEDs were installed between 12 February and 4 March at all main fishway entrances. Acoustic deterrents were in place at or near all fishway entrances before the end of February. From 5 March to the end of May, we used a randomized, paired-treatment, 4-day block design to test the efficacy of a hazing/acoustic deterrent combination. During 2-day treatment periods, acoustic deterrent devices were activated and hazing was conducted by boat and dam-based hazers. On control days, ADDs were turned off and no hazing occurred. On the first day of a 2- day treatment (hazing) period, ADDs were turned on at 0500 h; they were turned off at 2000 h on the second day. On treatment days, USDA agents generally hazed pinnipeds from the decks and shorelines of Bonneville Dam from dawn to dusk. Agents only hazed sea lions active within 100 ft of fishway entrances and sea lions that were hauled out at the dam. Cracker shells and rubber bullets were used for harassment most of the time, but some noisy screamer rockets were used to haze animals from greater distances (particularly at the spillway). On both treatment and control days, additional observations were made of the presence of sea lions and salmonid catch that occurred within 100 ft of fishway entrances. To quantify pinniped presence near fishway entrances, observers recorded the number of times pinnipeds surfaced within 100 ft of fishway entrances. We used a t-test to compare total estimated salmonid catch and daily pinniped abundance during treatment and control blocks. A t-test was also used to compare total observed salmonid catch and pinniped activity within 100 ft of fishway entrances during treatment and control blocks. As we were limited to surface observations, salmonid catch within 100 ft of fishway entrances only included instances in which the sea lion initially surfaced with the fish within the defined area. Boat-based ODFW, WDFW, Columbia River Inter-Tribal Fish Commission (CRITFC), and other personnel hazed sea lions from 2 April to 27 May. Boats operated from Bonneville Dam (river mile 146) downstream to near Navigation Marker 85 (river mile 139). These personnel used above-water pyrotechnics, rubber bullets, and seal bombs. Boat-based hazing was conducted in an alternating 4-day block schedule (4 days of hazing, 4 days off) that overlapped with dam-based hazing efforts. See Wright et al. (2007) for a complete description of boat-based hazing efforts In 2007, SLEDs were installed between 10 January and 22 January at all main fishway entrances, and were removed between 30 May and 7 June, following the departure of the sea lions. Acoustic deterrents were installed and running at all fishway entrances by mid-january, and were turned off and removed by early June. Based on 2006 deterrent evaluations, the Corps and agency partners agreed to conduct maximum effort non-lethal hazing, with some restrictions for the use and conduct of hazing relating to fish passage issues and personnel safety concerns. USDA agents hazed pinnipeds from the decks and shorelines of Bonneville Dam from dawn to dusk, 7 days per week, beginning 1 March and ending 31 May. Initially, this hazing was to include two agents per shift, but USDA was unable to provide enough personnel to meet that requirement, so generally one agent was hazing at any given time. Due to work schedule overlaps, sometimes two agents were actively hazing. 8
17 From 1 February through 27 February, ODFW and WDFW hazed pinnipeds from the boat restricted zone (BRZ) downstream to Navigation Marker 85. This hazing was conducted 3-5 days per week, during daylight hours. From 28 February through 24 May, personnel from ODFW, WDFW, CRITFC, and other agencies hazed from boats from Bonneville Dam to Navigation Marker 85, 7 days per week, during daylight hours. Occasionally, two or more boats were actively hazing, but typically only one boat was present. Boat-based hazing included the use of cracker shells, rubber bullets, and seal bombs. When salmonid passage reached 1000 per day, no seal bombs were allowed within the boat restricted zone (BRZ). For human safety and to limit impacts on migrating fish, boat activity was not allowed within approximately 30 m from all dam structures and 50 m from fishway entrances. The use of seal bombs was prohibited within 100 m of fishways, floating orifices, the PH2 corner collector flume, and the downstream smolt monitoring facility (SMF) outfall. See Brown et al. (2007) for a complete description of boat-based hazing efforts. To capture and relocate sea lions, ODFW, WDFW, and NOAA used a portable floating sea lion trap moored in the PH2 tailrace, near the PH2 corner collector flume (Appendix J). The trap was generally checked daily for sea lion use. Trapped animals were moved to transfer cages, then transported via these cages or a modified horse trailer to Astoria, Oregon. In Astoria, unmarked animals were tagged and branded, and some were outfitted with a satellite tracking device. After being processed, trapped animals were released at Astoria or at other locations on the Oregon coast. See Brown et al. (2007) for further details. PREDATION ESTIMATES Salmonid, lamprey, and sturgeon predation estimates for the season were made by taking the daily observed adult salmonid (Chinook salmon, steelhead, and unidentified salmonids combined), lamprey, and sturgeon predation at each of the tailrace sites and expanding for the hours not observed based on seasonal hourly salmonid, lamprey, and sturgeon catch rates. All three tailrace estimates were combined to calculate total daily estimated catch. For days on which no observations were made, we averaged expanded estimates for the day before and the day after the missed observation day. All daily estimated catch totals for the project were added to get the total estimated catch for the year. The estimated impact on salmonids passing during the observation period (expressed as percent of run) was calculated by dividing total estimated salmonid catch by the sum of the estimated salmonid catch for the year plus the total salmonid passage count from Bonneville Dam for the 1 January through 31 May time period. 9
18 RESULTS PREDATION ACTIVITY From 2005 to 2007 (1 January through 31 May), observers completed 9,192 hours of observations at the three Bonneville Dam tailrace areas (Table 1). Observers spent an additional 248 hours recording activity downstream of our study area. During this period, observers saw pinnipeds catch and consume 11,835 fish (Appendix K). Adult salmonids (Oncorhynchus spp.) were the primary prey item, comprising at least 75.6% (n=8,946) of observed catches. Pacific lamprey and white sturgeon were the second and third most commonly identified prey species, comprising 9.4% and 5.3% of total observed catch, respectively. Observers were unable to identify 8.7% (n=1,025) of the fish caught and consumed by pinnipeds during this period, but based on other observation data, most unknown catches by California sea lions were likely salmonids. Predation on Adult Salmonids Annual expanded estimates of pinniped predation on adult salmonids in the Bonneville Dam tailrace increased each year, from 2,920 fish in 2005 to 3,859 fish in 2007 (Table 1, Figure 2). An additional 96 salmonids were observed caught at observation areas downstream of the primary study area. The relative impact, expressed as the estimated percentage of the salmonid run taken by pinnipeds, varied with run size and the expanded estimate of salmonid catch. Total adult salmonid passage at the dam during the 1 January through 31 May study period ranged from 82,006 in 2005 to 105,063 in 2006, continuing a general downward trend in fish passage (from a 6-year high of 284,733 in 2002, the first year of our study). The estimated percentage of the salmonid run taken by pinnipeds in the Bonneville Dam tailrace between 2005 and 2007 averaged 3.5% (standard deviation (s) = 0.7%), with a high of 4.2% in Table 1. Hours observed, salmonids caught, expanded estimate of salmonids caught, estimated catch rate, total salmonids passing Bonneville Dam, and percentage of salmonids taken by pinnipeds from 1 January to 31 May ( ). Expanded Estimated Total Percent of Total Total Estimate of Salmonids Salmonids Salmonid Run Study Hours Salmonids Salmonids Caught per Passing Taken by Year Observed Caught Caught Hour Observed Bonneville Pinnipeds , , % ,356 1,538 2, , % ,324 3, , % ,108 2,659 2, , % ,647 2,718 3, , % ,433 3,569 3, , % 10
19 Chinook salmon were the most commonly identified prey species, comprising about 42% of expanded estimated total catch from 2005 to Steelhead were the second most commonly identified salmonid prey species, comprising about 5% of expanded total catch during the same period. Steelhead, which are present in the Bonneville Dam tailrace throughout the winter and spring months, comprised the majority of salmonid catches prior to the onset of the spring Chinook salmon run. Total observed steelhead catch has increased each year since 2002, from 6 catches during the first year of observations to 311 in This corresponds to an expanding observation season at Bonneville Dam, as California and Steller sea lions arrive earlier each year. Unidentified salmonids comprised about 28% of expanded total catch from 2005 to Most unidentified salmonids caught during the spring Chinook run (mid-march to 31 May) were probably Chinook salmon, and salmonids caught before the spring Chinook run were probably steelhead. 160 ESTIMATED NUMBER OF SALMONIDS CAUGHT Jan 8-Jan 15-Jan 22-Jan 29-Jan 5-Feb 12-Feb 19-Feb 26-Feb 4-Mar 11-Mar 18-Mar DATE 25-Mar 1-Apr 8-Apr 15-Apr 22-Apr 29-Apr 6-May 13-May 20-May 27-May Figure 2. Expanded estimated number of adult salmonids (Oncorhynchus spp.) caught by pinnipeds in the Bonneville Dam tailrace ( ). Expanded estimates are derived from observations made during daylight hours between January 1 and May 31. Observers recorded only 13 smolt (juvenile Oncorhynchus spp.) catches by pinnipeds from 2005 to 2007, but because smolts typically measure less than 200 mm in total length (TL), they can be consumed by pinnipeds below the surface. It can be assumed that predation on smolts was higher than our observations indicate, although preliminary results from 2006 and 2007 analyses of Bonneville Dam sea lion scat suggested that smolt were a minor part of the diet of the sea lions (Wright et al. 2007, Brown et al. 2007). 11
20 California sea lions were the primary predator of adult salmonids in the Bonneville Dam tailrace, accounting for 99.0% of the 8,946 observed adult salmonid catches, and 99.8% of the 4,957 observed Chinook salmon catches from 2005 to About 91.4% of observed steelhead catches were attributed to California sea lions during this period, with Steller sea lions reportedly catching 8.5% of the total. Harbor seal predation activity in the tailrace of Bonneville Dam was relatively minor. An observer saw a harbor seal catch one steelhead in 2006, and no salmonid catches were observed in 2005 or To assess relative predation at each of the three Bonneville Dam tailrace areas, we used expanded estimates of salmonid predation for each area. These expansions accounted for any bias due to differences in the number of hours of observation for each area. Prior to 2005, PH2 consistently showed the highest level of predation, accounting for 56.8% (s = 1.3%) of expanded salmonid total catch. Since 2005, predation has become more diffuse, with substantial increases in estimated salmonid catch at PH1 and the spillway (Table 2). From 2005 to 2007, PH1 accounted for 43.3% (s = 11.5%) of estimated salmonid catch, and PH2 accounted for 35.7% (s = 8.9%). Estimated salmonid take at the spillway jumped from the average of 6.8% (s = 3.8%) to an annual average of 21.0% (s = 11.3%) since Table 2. Percent of salmonids caught at each tailrace area, based on expanded estimates at each site ( ). Regular observations were not made at the spillway in Study Year PH1 PH2 Spillway % 56.0% 11.1% % 56.0% 4.4% % 44.9% 21.9% % 34.9% 9.3% % 27.2% 31.8% Sea lions foraged throughout the daylight hours, with peaks in salmonid catch in the early morning and the late afternoon in 2006 and 2007 (Figure 3; Appendix L). Salmonid catch during the mid-day and afternoon hours had generally increased each year since 2002, but in 2006 and 2007, catch during this period declined, possibly in response to hazing efforts (see Pinniped Activity and Deterrent results sections). The peak predation hour shifted from h in 2005 to h in 2006 and
21 SALMONIDS CAUGHT PER HOUR OF OBSERVATION HOUR (PST) Figure 3. Diurnal salmonid catch by pinnipeds, per observation hour, in Bonneville Dam tailrace ( ). Observations for the and were made in 2002 only. Some adult salmonids, including both steelhead and Chinook salmon, were caught by sea lions and brought to the surface, but escaped and swam away before being eaten. This action was difficult to document, as the fish was often only visible for a few seconds. The unexpanded numbers of adult salmonids caught and subsequently lost by sea lions was 13 in 2005, 83 in 2006, and 47 in This resulted in an observed loss rate of 0.5% of total salmonid catch in 2005, 3.1% in 2006, and 1.3% in 2007, or a 3-year average of 1.6% (s = 1.3%). This suggests a decline in observed catches lost by sea lions, as the average was 8.4% (s = 6.4%). This decline may partially be attributed to observer error, as some observers detected these lost catches more often than others, and our observation crew changed in composition each year. Observers were unable to estimate the degree of injury to lost adult salmonids, since these fish were typically only visible at the surface of the water for a few seconds (Harmon et al. 1993). We defined the peak predation season as the period during which 80% of all predation on adult salmonids occurred, which typically lasted from mid-march to mid-may. Each year, sea lion presence and predation activity increased rapidly during this period as the spring Chinook run began. Because observations in 2005 did not begin until 24 March, well after the beginning of predation activity, the peak predation season was artificially contracted relative to other years. While the average number of calendar days (includes days without observation) included in this period has remained relatively stable (48.2 days, s = 5.0, 2005 data excluded), the average daily number of adult salmonids caught increased from 19.6 (s = 13.4) in 2002 to 64.8 (s = 42.1) in 2007 (Figures 4, 5). The high degree of variance in mean daily salmonid catch reflects the rapid rise in fish catch during the spring Chinook run. 13
22 120 MEAN DAILY EXPANDED SALMONID CATCH YEAR Figure 4. Mean (with standard deviation) daily number of adult salmonids caught during peak predation season ( ), during which 80% of total expanded salmonid catch occurred. Start and end dates for the peak predation season varied with predation levels from year to year. Regular observations did not start until 24 March in 2005, although sea lion predation activity at the dam was seen earlier in the year. NUMBER OF DAYS % of Total Salmonid Catch 90% of Total Salmonid Catch YEAR Figure 5. Number of days included in the peak predation season, during which 80% of total expanded salmonid catch occurred. The 90% of estimated catch period is included for comparison. Observations did not start until mid-march in 2005, despite sea lion predation activity at the dam earlier in the year. 14
23 Predation on Pacific Lamprey Pacific lamprey was the second most commonly observed prey item for California sea lions, after adult salmonids. Most predation on lamprey occurred in May, concurrent with increases in lamprey passage at Bonneville Dam (Figure 6). Total observed lamprey catch peaked in 2005, with 613 observed catches (Table 3). Observed lamprey catch declined to 374 in 2006 and 119 in Predation on lamprey was strongest in the early morning hours ( h), and typically declined throughout the day (Figure 7). An exception to this pattern was seen in 2006, when lamprey catch increased in the afternoon. We used expanded estimates of lamprey predation to assess relative predation at each of the three Bonneville Dam tailrace areas. These expansions accounted for any bias due to differences in the number of hours of observation for each area. From 2002 to 2005, PH2 consistently showed the highest level of predation, accounting for 68.1% (s = 10.4%) of expanded lamprey total catch. In 2006 and 2007, PH1 replaced PH2 as the tailrace with the most catches, accounting for 60.4% and 58.0% of estimated lamprey catches, respectively (Table 4). Estimated lamprey catch at the spillway jumped from the average of 4.7% (s = 1.4%) to 19.6% in 2007, coinciding with an overall increase in sea lion activity in that tailrace. Table 3. Hours observed, total observed number of Pacific lamprey caught, and expanded estimates of Pacific lamprey catch at Bonneville Dam ( ). Expanded Estimated Total Total Estimate of Lamprey Study Hours Lamprey Lamprey Caught per Year Observed Caught Caught Hour Observed , , , , Table 4. Frequency of lamprey catches at Bonneville Dam tailrace areas, based on expanded estimates at each site ( ). Regular observations were not made at the spillway in Study Year PH1 PH2 Spillway % 83.0% 4.3% % 61.5% 4.7% % 67.7% 6.9% % 36.6% 3.1% % 22.4% 19.6% 15
24 NUMBER OF LAMPREY CAUGHT Jan 8-Jan 15-Jan 22-Jan 29-Jan 5-Feb 12-Feb 19-Feb 26-Feb 4-Mar Figure 6. Total daily observed Pacific lamprey catch by pinnipeds at Bonneville Dam ( ) Mar 18-Mar DATE 25-Mar 1-Apr 8-Apr 15-Apr 22-Apr 29-Apr 6-May 13-May 20-May 27-May LAMPREY CAUGHT PER HOUR OF OBSERVATION HOUR (PST) Figure 7. Diel distribution of Pacific lamprey catch by pinnipeds, per hour of observation ( ). 16
25 Predation on White Sturgeon White sturgeon was the most commonly observed prey item for Steller sea lions, which made 97.8% of the 626 observed sturgeon catches since 2002 (Table 5). Observers did not see any predation on sturgeon until 2005, when a single catch was recorded. Since then, Steller sea lion predation on sturgeon has increased, with at least 265 observed catches in 2006 and 360 in Most observed predation on sturgeon occurred from January through March, prior to the onset of the spring Chinook salmon run and heavy sea lion harassment activity (Figure 8). Steller sea lions were known to be catching sturgeon in the vicinity of Bonneville Dam as early as December in both 2006 and 2007, so observed and expanded catches represent minimum catch. A total of 8 additional sturgeon catches were observed at areas downstream of our study area during the observation seasons of 2006 and We used expanded estimates of sturgeon predation to assess relative predation at each of the three Bonneville Dam tailrace areas. These expansions accounted for any bias due to differences in the number of hours of observation for each area. Most predation on sturgeon occurred at the spillway, which accounted for 79.3% of total expanded sturgeon catch in 2006 and 64.6% in Predation on sturgeon increased at PH2, which accounted for 13.4% of total expanded sturgeon catch in 2006 and 29.5% in When possible, observers estimated the total length of all but 87 sturgeons caught. The estimated total lengths of sturgeon caught in 2006 and 2007 ranged from less than 2 ft (0.6 m) to 9 ft (2.7 m), with 69% of sturgeon (n=537) falling between 2 and 5 feet in length (Figure 9). Table 5. Hours observed, total observed number of white sturgeon caught, and expanded estimates of white sturgeon catch at Bonneville Dam ( ). Expanded Estimated Total Total Estimate of Sturgeon Study Hours Sturgeon Sturgeon Caught per Year Observed Caught Caught Hour Observed N/A ,356 0 N/A N/A ,108 1 N/A , ,
26 ESTIMATED NUMBER OF STURGEON CAUGHT Feb 2007: Start of boatbased hazing in BRZ 2-Apr 2006: Start of boatbased hazing in BRZ Jan 8-Jan 15-Jan 22-Jan 29-Jan 5-Feb 12-Feb 19-Feb 26-Feb 5-Mar 12-Mar 19-Mar 26-Mar 2-Apr 9-Apr 16-Apr 23-Apr 30-Apr DATE Figure 8. Total daily observed white sturgeon catch by pinnipeds at Bonneville Dam in 2006 and Hazing in the Bonneville Dam boat restricted zone (BRZ) started on 2 April 2006 and 28 February NUMBER OF STURGEON CAUGHT <2 2-<3 3-<4 4-<5 5-<6 6-<7 >7 ESTIMATED TOTAL LENGTH (FT) Figure 9. Size distribution of white sturgeon caught by sea lions at Bonneville Dam in 2006 and 2007, from estimated total lengths (ft) recorded by observers (n=537). Observers were unable to estimate the sizes of an additional 87 sturgeon. 18
27 PINNIPED ACTIVITY The estimated number of individual pinnipeds observed at Bonneville Dam for any one year from 2005 to 2007 has remained relatively constant, ranging from 80 to 85 (Table 6). There was a slight decrease in the number of individually identified California sea lions each year, but the number of Steller sea lions rose in 2006 and 2007 compared to previous years. Hazing activities in 2006 and 2007 made individual California sea lion identification (and therefore, abundance estimation) more challenging when compared to previous years, so estimated totals should be considered minimum estimates. Table 6. Estimated total number of pinnipeds present at Bonneville Dam ( ) * California Sea Lions Steller Sea Lions Harbor Seals TOTAL * Regular observations did not begin until 24 March in 2005 The highest number of pinnipeds identified on any one day was 54 in 2007, followed by 46 in 2006 and 43 in 2005 (Figure 10). This continues the trend of the peak number of pinnipeds seen on any one day increasing each year. However, the mean number of pinnipeds seen per day during the study period decreased in 2007 (15.7, s = 13.0) from a high of 20.3 (s = 13.3) in 2006 and 18.9 (s = 10.1) in The mean number of pinnipeds seen per day during the peak predation season (defined as the period during which 80% of salmonid catch occurred) also declined slightly from 2006 (32.1, s = 6.7) to 2007 (27.1, s = 12.0). Each year, the number of sea lions present increased from mid-march to mid-may, resulting in a high degree of variation in mean daily number of pinnipeds present during both the peak predation season and the 1 January through 31 May study period (Figure 11). 19
28 Jan 8-Jan 15-Jan 22-Jan 29-Jan 5-Feb 12-Feb 19-Feb 26-Feb 4-Mar 11-Mar 18-Mar 25-Mar 1-Apr 8-Apr 15-Apr 22-Apr 29-Apr 6-May 13-May 20-May 27-May ESTIMATED NUMBER OF PINNIPEDS PRESENT DATE Figure 10. Daily minimum estimated number of pinnipeds (California sea lions, Steller sea lions, and harbor seals) present at Bonneville Dam ( ). 20
29 60 Mean DAILY NUMBER OF PINNIPEDS PRESENT Maximum YEAR Figure 11. Mean (with standard deviation) and maximum daily estimated number of pinnipeds (California sea lions, Steller sea lions, and harbor seals) present during the peak predation season (80% of total salmonid catch) at Bonneville Dam ( ). Peak predation dates varied with predation levels from year to year. California Sea Lions In all years between 2005 and 2007, fewer California sea lions were identified than in 2003 and In 2005, California sea lions were observed consistently from 20 February (there was a single sighting on 21 January) through 3 June (with a single sighting on 10 June). In 2006, the first California sea lion was observed on 9 February and the last on 2 June (with a single sighting on 5 June), while in 2007, 8 January was the first day a California sea lion was seen and they were last seen on 26 May (with a single sighting on 7 November). This continues the trend of some California sea lions arriving earlier every year. Each year, we determined how many identifiable individuals returned from previous years. In 2006 and 2007, 50% of the identified California sea lions were seen at Bonneville Dam the previous year, while 60% of the sea lions seen in 2005 had been seen in 2004 (Appendix B). Of the 16 individuals identified in 2002, at least four (25%) were seen in all five subsequent study years. We were able to track some individual California sea lions within each season. The most number of days any individual spent at Bonneville Dam increased from 2005 (39 days) to 2007 (70 days) (Appendix M). The mean number of days identified individuals were observed at 21
30 Bonneville Dam also increased each year, jumping from 7.5 (s = 7.5) in 2005 to19.9 (s = 21.0) and 20.3 (s = 17.7) in 2006 and 2007, respectively. The high degree of variation for daily presence of known individuals can likely be attributed to the difficulty of sighting and identifying each animal on a daily basis, although some animals arrived at the dam much earlier in the season than others. Individual predation behaviors, movement patterns, and haul-out patterns make some animals more likely to be identified than others. California sea lions were identified to the individual level, when possible. Identified animals fell into three general categories, as described in Table 7. The majority of animals fell into the highly identifiable category every year, and fewer than 10 animals were placed in the not likely identifiable category each year. Our ability to identify new individuals has probably increased since 2002, as the estimated number of individuals that were not likely identifiable has decreased each year since 2004, and the number of likely identifiable individuals has dropped from a high of 32 in 2003 to 6 in A fourth category included those animals we never got a good look at or those that were simply bereft of marks, making them impossible to distinguish from other similarly unidentifiable animals. These indistinguishable individuals were noted in daily observations, and numbered about four (median) per day since 2002, although some days and years were higher and these estimates are highly subjective. The highest number for this category was in 2005, when we contracted personnel from other agencies late in the season and did not have time to adequately train or supervise observers to the level of identifying individuals by their unique markings. In total, it is possible that an additional 15 to 35 California sea lions visited the study area each year but escaped our efforts to uniquely identify them. Table 7. Number of highly identifiable, likely identifiable, and not likely identifiable California sea lions observed at Bonneville Dam ( ). Identification Number of California Sea Lions Category Highly Identifiable Likely Identifiable Not Likely Identifiable Steller Sea Lions The number of Steller sea lions observed at Bonneville Dam increased from 4 in 2005 to 10 in 2006 and 9 in 2007 (Figure 12). This coincides with the substantial increase in sturgeon predation seen in those years. As we do not identify individual Steller sea lions, these figures also represent the highest numbers seen on any one day for each year. The increasing presence of Steller sea lions and their predation on sturgeon may cause us to focus more attention on them in the future. Steller sea lions were occasionally seen at Bonneville Dam in November and December. As we are not regularly observing, we only have anecdotal information on sightings and fish catch 22
31 during these months. In 2006 and 2007 they were seen regularly in the tailrace area from January to early March, when hazing activities began. After hazing began, fewer Steller sea lions were observed through May Feb 2007: Start of boat-based hazing in BRZ 3-Apr 2006: Start of boat-based hazing in BRZ ESTIMATED NUMBER OF STELLER SEA LIONS PRESENT Dec 8-Dec 15-Dec 22-Dec 29-Dec 5-Jan 12-Jan 19-Jan 26-Jan 2-Feb 9-Feb 16-Feb 23-Feb 1-Mar 8-Mar 15-Mar 22-Mar 29-Mar 5-Apr 12-Apr 19-Apr 26-Apr 3-May 10-May 17-May 24-May 31-May DATE Figure 12. Daily estimated number of Steller sea lions present at Bonneville Dam ( ). No Steller sea lions were seen at the dam in Harbor Seals Harbor seals continued to have a minor presence from 2005 to In 2005, observers recorded at least one individual harbor seal during the 1 January through 31 May study period, and at least 3 were seen in 2006, and 2 in 2007 (Table 5). Haul-Out Sites We have observed pinnipeds hauling-out at specific locations at Bonneville Dam in increasing numbers over the years. In 2002, although we never saw any pinnipeds hauled-out at the dam or at any locations up to 5 mi (8 km) downstream from the dam, sea lions were occasionally seen resting in the calm water areas of the PH1 tailrace. In 2003, a few California sea lions began hauling-out on the southernmost spill bay ogees. In 2004, this haul-out activity began to include several spill bays across the entire spillway dam. By 2005, one California sea lion was seen to haul-out on the downstream navigation lock boat dock several times, and a few California sea lions were seen hauled-out along the PH2 side of the corner collector, where there is a concrete apron. By 2006 and 2007, the concrete apron along the corner collector became the preferred 23
32 haul-out site, on both sides (PH2 and spillway) depending on tailwater elevation. Some sea lions hauled-out inside the downstream (outfall) end of the corner collector when it was not in operation. Sea lions continued to use the spill bay ogees at the southern end of the spillway as haul-outs, prior to the beginning of the spill season in April, and were occasionally seen hauledout on Bradford Island, near the WG65 entrance to PH1. No harbor seals have been seen hauledout at or near the dam, but Steller sea lions can be seen hauled-out at the corner collector from December through May of each year now, with California sea lions typically seen hauled-out from February to the end of May. Navigation Lock Passage and Forebay Sightings California sea lions were occasionally observed upstream of Bonneville Dam, passing by means of the navigation lock, even prior to our study. Since 2002, we have documented one or more sea lions upstream of Bonneville Dam every year except 2007 (Appendix N). On 10 March 2006, California sea lion C309 rode a barge downstream through the navigation lock; he promptly jumped into the water as soon as the barge exited the lock. Our study area was the Bonneville Dam tailrace, and we did not have personnel to spare to observe predation upstream, but we did receive periodic reports (many unconfirmed) of predation in the Bonneville Dam forebay, near The Dalles Dam, and at points in between. Fishway Incursions We first documented a California sea lion entering a fishway at Bonneville Dam on 18 March Most fishway incursions can be attributed to just one animal, C404, who was seen in the ladders on at least seven separate days in 2004, 20 days in 2005, 33 days in 2006, and 10 days in On 14 April 2004, an observer noted that C404 caught a fish in the PH2 tailrace and dragged it into the fishway to eat it. Since 2004, C404 has caught at least 14 adult salmonids in Bonneville Dam fishways, but this is likely an underestimate. SLEDs have not prevented C404 from entering fishways. Early in the season, he was to be able to squeeze through the SLED bars, and he was observed multiple times jumping over the FOGs. At least nine other California sea lions entered the lower portion of the Washington shore (PH2) or Cascades Island fishways prior to the installation of the SLEDs on 30 May C147, C258, C259, and C265 were documented in a fishway at least once prior to this date, but since the SLEDs were installed, only C404 has been seen in the fishways DETERRENT RESULTS Norberg et al. (2005) described results of 2005 hazing efforts at Bonneville Dam. Pinnipeds could readily be chased downstream with the use of seal bombs, and many were seen moving quickly downstream immediately after their use. On 5 May, after the initial hazing from the PH2 24
33 deck at 1200 h, the hazers kept the pinnipeds out of the tailrace for four hours. After boat-based crews quit hazing at 1600 h, first three, then five California sea lions returned and ate four salmon between 1600 and 1700 h at PH2. On 6 May, after the initial hazing, it was 1 hour and 48 minutes before an animal returned at PH2 and 42 minutes at PH1. Although the boat-based and dam-based hazers chased these animals downstream, other sea lions continued to return in larger numbers and had to be chased downstream throughout the day. After repeated hazing, some individuals did not leave the tailrace. This possible habituation in response to hazing was also seen on 17 and 18 May. On these dates, hazing was initially effective, but later the California sea lions returned within minutes and were not always successfully chased out of the tailrace. In general, the number of sea lions was reduced at PH1 and PH2 tailraces, but the numbers seen in the spillway tailrace increased as did predation at this location. The average hourly number of sea lions present and the total number of salmonids caught between 0600 and 1700 h on the day before, during, and after a hazing day are shown in Appendix O. On days that hazing occurred, the hourly average number of sea lions present was less (10.9) than on the hours before and after hazing (18.3 and 14.5 respectively), with after hazing still showing less than before hazing began. Observed salmonid predation was also lower during hazing hours. Although predation was not eliminated entirely and animals returned after hazing, this indicated to us that active, large scale hazing from land and boats might be an effective means to displace most sea lions present, and reduce predation in that area California sea lion C404 was first seen in a fishway on February 26, having passed through the bars of the SLEDs. He was only seen in the Washington shore ladder of PH2 after March 3 where he was likely entering through the floating orifice gates (FOGs). Temporary bars were installed on all the FOGs, and C404 was at the project but not seen in any fishways between 12 April and 8 May, when he left the project. No other sea lions were seen in the fishways. C404 was observed to swim into and through a junction pool that was equipped with an ADD, and did not show any signs of being deterred or hindered by the presence of the device. Results of the hazing and acoustic deterrent evaluation can be seen in Table 8. Hazing and acoustic deterrent efforts failed to reduce the number of salmon taken or the total number of pinnipeds present at the project. Total observed salmonid catch was actually significantly higher on days with hazing and acoustics (p-value = 0.02), but fewer pinnipeds were present within 100 ft of fishway entrances on those days (p-value = 0.002). There were no significant differences in salmonid catch or pinniped presence between days with or without boat-based hazing. Slightly fewer salmon were taken on days when boat hazing occurred, but more pinnipeds were present near the entrances. This may be because the boats had limited access and could not get too close to the dam, having the occasional effect of chasing some pinnipeds closer to the dam. Steller sea lions were responsive to hazing activities, and sturgeon predation in the study area was effectively halted when boat-based hazing began (Predation Results, Figure 8). See Wright et al. (2007) for a detailed summary of boat-based hazing efforts and summary of sea lion scat analysis. 25
34 Table 8. Results of the 2006 sea lion hazing and acoustic deterrent evaluation (April 2 to May 27). A paired-treatment, randomized 4-day block design (2 days on or off) was used to test the efficacy of a dam-based hazing/acoustic deterrent combination for reducing salmonid catch and pinniped presence. Boat-based hazers operated on a 4-days on, 4-days off schedule that overlapped with the dam-based deterrent evaluation. Dam-Based Hazing and Acoustic Deterrents Active (On) Inactive (Off) p-value (α = 0.05) Total project salmonid catch 1,488 1, Average daily project pinniped presence Salmonid catch within 100 ft of fishway entrances Total pinniped activity within 100 ft of fishway entrances 1 9,098 12, Boat-Based Hazing Active (On) Inactive (Off) p-value (α = 0.05) Total project salmonid catch 1,147 1, Average daily project pinniped presence Salmonid catch within 100 ft of entrances Total pinniped activity within 100 ft of fishway entrances 1 8,870 7, Pinniped activity was defined as the number of times pinnipeds surfaced within 100 ft of a fishway entrance With the exception of one California sea lion, SLEDs and FOG barriers successfully prevented pinnipeds from entering the Bonneville Dam fishways in California sea lion C404 was first seen in the Washington shore fishway on March 28, and was subsequently seen in the fishway on 10 of the next 18 days (to April 16). He was also seen in the Cascades Island fishway on April 3. On multiple occasions, observers reported witnessing C404 attempting to jump over the floating orifices and into the collection channel at the north end of PH2. On April 2, C404 jumped over the a floating orifice after at least 6 failed attempts, and on April 16, he exited the PH2 collection channel by jumping over a floating orifice after being hazed in the Washington shore fishway. Acoustic deterrent devices continued to have no visible effect on the behavior of sea lions near fishway entrances, and no experimental evaluations were conducted in In 2007, a combined total of about 35,000 deterrent devices (cracker shells, rubber bullets, seal bombs, etc.) were used by dam-based and boat-based hazers, essentially doubling hazing effort (Brown et al. 2007, Wright et al. 2007, USDA Wildlife Services unpublished data). The increased hazing effort of 2007 did appear to alter the behavior of both California and Steller sea lions. Observers reported that California sea lions became more secretive in response to hazing, spending more time below the surface than usual; making individual identification more difficult. This may be reflected in the lower number of individuals counted in 2007 when 26
35 compared to 2005 and 2006 (Table 6), but the continuing decrease in likely and not likely identifiable California sea lions may suggest otherwise (Table 7). Sea lion presence, adult salmonid catch, and the percentage of lamprey catch increased at the spillway in These increases can probably be attributed to increased hazing efforts at the PH1 and PH2 tailraces. As in previous years, the Corps began releasing water at kcfs through the Bonneville Dam spillway gates in early April (10 April in 2007) to aid downstream passage of juvenile salmonids. This spill created an extremely turbulent environment in the spillway tailrace. Boats were not allowed in the spillway tailrace, and USDA agents reported that dam-based hazing effectiveness was greatly reduced at the spillway as a result of the turbulence and distances involved (John Vickrey, USDA, personal comm.). This effectively created a refuge for sea lions, resulting in a relative increase in predation activity in the spillway tailrace (Predation Results, Tables 2, 4). Steller sea lions were more responsive than California sea lions to hazing efforts. From 1 February to 26 February, ODFW, WDFW, and CRITFC personnel hazed from boats below the BRZ to Navigation Marker 85, with little impact on Steller sea lion predation within our study area (inside the BRZ). From 28 February to 24 May, hazing was conducted daily by boats and USDA agents within the BRZ of the Bonneville Dam tailrace. Steller sea lion presence and sturgeon catch declined almost immediately in response to the intensive hazing efforts (Predation Results, Figure 8). See Brown et al. (2007) for a detailed summary of boat-based hazing efforts and sea lion scat analysis. ODFW, WDFW, and NOAA captured a total of 11 California sea lions and 3 Steller sea lions between 4 April and 17 May (Brown et al. 2007). The 7 California sea lions that had not been previously captured and branded were tagged and branded before being released on the Oregon coast. Of the California sea lions captured and relocated, 10 were seen again at Bonneville Dam before the end of the observation season (about 31 May). The individual that did not return, C699, was captured and released on 17 May, when sea lion activity at Bonneville Dam was declining for the season. Trapped animals that returned took an average of 9.8 days (range = 6 to 16) to return to Bonneville Dam from the Oregon coast. The individual released south of Seaside, at Del Ray Beach, returned in 9 days; the rest were released at Astoria. In previous years, we have seen returns from Astoria in as little as 2 days. Steller sea lions were not individually marked, so it is unknown whether any returned to Bonneville Dam following relocation. 27
36 DISCUSSION PREDATION AND PINNIPEDS The estimated number of adult salmonids caught by pinnipeds in the Bonneville Dam tailrace has increased from 1,010 (0.4% of 1 January to 31 May run) in 2002 to 3,859 (4.2% of run) in The total number of fish passing the dam during the this period has declined steadily since 2002, raising concerns about the impact of sea lion predation in years with smaller spring Chinook salmon runs. Of particular concern is the impact of predation on particular ESA-listed stocks that comprise the spring Chinook run. Keefer et al. (2007) determined that sea lion predation at Bonneville Dam is almost certainly having differential impacts on the various spring Chinook salmon stocks, and that the largest relative predation risks were for early migrant stocks. These included fish from the Salmon (Little Salmon), Clearwater (South Fork, Lolo Creek, Lochsa), and Icicle River watersheds. The 382% increase in total estimated salmonid catch from 2002 to 2007 is alarming, but sea lion predation levels at Bonneville Dam may be stabilizing. Since 2004, total estimated adult salmonid catch has consistently ranged between about 3,000 and 4,000 fish, regardless of the number of fish passing during the study period. The sea lion season at Bonneville Dam has grown more protracted in recent years, as a few California sea lions and most Steller sea lions have arrived earlier each year. This increased predation activity prior to the mid-march through mid-june spring Chinook salmon run has resulted in increased impacts on steelhead and white sturgeon. Increases in the mean daily number of pinnipeds observed slowed, and actually decreased in 2007, probably because of the presence of a few sea lions early in the season. This slight decline is evident even if we look only at the peak predation season (defined as the period during which 80% of salmonid predation occurs), which has expanded by only 8 days since Despite consistently earlier sightings, overall increases in the number of days California sea lions have spent in the Bonneville Dam tailrace, and the increase in Steller sea lion activity in 2006 and 2007, the total estimated number of individual pinnipeds at the dam has remained relatively constant since 2005, ranging somewhere between 80 and 85 animals. This may explain the relative consistency of total salmonid catch, as sea lions have finite nutritional requirements. The estimated number of pinnipeds observed represents a minimum estimate, as it does not include all California sea lions that are unidentifiable. It is possible that an additional 15 to 35 California sea lions visited the study area each year but escaped inclusion in our estimates. DETERRENTS Non-lethal deterrents have been used with mixed success at Bonneville Dam. Physical barriers, including the SLEDs and FOG barriers, have successfully prevented all but one sea lion from entering the fishways, but preventing predation in the tailrace areas and near fishway entrances has proved difficult. Acoustic deterrent devices appear to be ineffective in deterring sea lion predation activity near fishway entrances at Bonneville Dam, based on the 2006 deterrent evaluation and surface observations of sea lions in close proximity to the ADDs. These devices are known to work less effectively in turbulent waters, where entrained air disrupts the sound waves produced by emitters. Observers are limited in their ability to assess the effects of ADDs, 28
37 SLEDs, or other deterrents on sea lions or prey fish, as we are limited to monitoring surface activity. A DIDSON* (Dual frequency Identification Sonar) or similar high-definition acoustic imaging device could provide valuable insight on the behavior of sea lions and salmonids, sturgeon, and even lamprey in close proximity to fishway entrances and ADDs. Although hazing activity has noticeably altered the behavior of both California and Steller sea lions, total salmonid catch has not declined in response to hazing efforts. California sea lions often dove underwater during hazing events, but some were effectively chased out of tailrace areas by boats or dam-based hazers. However, hazing did not appear to have a lasting effect on many individual sea lions, and some individual sea lions seem completely unresponsive to hazing efforts. For example, California sea lion C309 was hazed at least 21 times in 2006, yet he was present at the dam throughout the season and was also seen (and hazed) in Observers consistently reported the resumption of predation activity within minutes of the departure of boat-based or dam-based hazers. The transitory efficacy of hazing efforts suggests that more sustained and intensive hazing might actually reduce predation activity, but due to the size of the Bonneville Lock and Dam project, it is unreasonable to expect that boat-based and dam-based hazers could execute intensive hazing at each of the three tailrace areas simultaneously, during all daylight hours, seven days per week. In 2006, dam-based and boat-based hazers logged hundreds of hours and used a combined estimated total of about 17,000 deterrent devices (cracker shells, screamer shells, rubber bullets and buckshot, seal bombs, etc.), and 35,000 were used in While these efforts effectively halted Steller sea lion predation on sturgeon in the Bonneville Dam tailrace in both 2006 and 2007, no other tangible results were realized. More intensive hazing would be even more costly, and it would carry unknown risks to fish residing in or passing through the Bonneville Dam tailrace. In addition, the apparent shift in predation on salmonids toward early morning and evening hours in 2006 and 2007 (Figure 3, Appendix L) suggests that intensive hazing may encourage crepuscular and even nocturnal predation. Hazing at night is not possible for many reasons, including safety concerns. Relocation of trapped sea lions proved ineffective in 2007, as 10 of 11 California sea lions trapped at Bonneville Dam and released on the Oregon coast returned to the dam before the end of the observation season. LETHAL REMOVAL Since non-lethal deterrents have not been shown to reduce the numbers of Pinnipeds present at Bonneville Dam or reduce predation on salmonids, the states of Oregon, Washington, and Idaho applied for a permit from NOAA to lethally remove California sea lions at the dam under Section 120 of the MMPA on 5 December NOAA determined that the states application provided enough supporting evidence to justify the establishment of a pinniped-fishery task force. This task force met three times in October of 2007 to review the application and public comments and to evaluate additional information regarding sea lion predation on Chinook salmon and steelhead at Bonneville Dam. A final report, which included recommendations to NOAA, was completed on 5 November NOAA then reviewed this report, included input from the Marine Mammal Commission (MMC), and developed an Environmental Assessment (EA), as required by NEPA, for four alternative actions (NOAA Draft Environmental Assessment of the Take of * Use of product name does not imply endorsement by the U.S. Army Corps of Engineers 29
38 California Sea Lions at Bonneville Dam Pursuant to Section 120 of the Marine Mammal Protection Act). In March 2008, following a period of public and internal review, NOAA granted permission to remove up to 85 California sea lions as outlined in the recommended alternative. NOAA estimated that 30 could be taken the first year. These animals would be removed by lethal injection and/or shooting, or they would be transferred to facilities expressing a desire to keep them. The decision by NOAA is currently under litigation, but the states are making preparations, should the decision be upheld in federal courts. The states are working with the Corps, enforcement agencies, an animal care and use committee, and various other groups to create a plan to address safety issues and removal coordination. Three additional traps will be built, with a tagging barge to follow by early May Logistics for a holding facility and potential sites that want some of these animals (zoos and aquariums have expressed interest in taking numerous animals) are also being explored. NOAA also recommended that agencies monitor impacts elsewhere in the lower Columbia River to assess the level of impact from predation relative to observed levels at Bonneville Dam and to other sources of mortality that are being managed under the various salmon recovery plans. Monitoring would assist NOAA and the task force in evaluating the effectiveness of lethal removal, as required by the MMPA. It should be noted that this would be a multi-year removal program, with required annual review of results by the pinniped-fisheries task force for at least the next 3 to 4 years to evaluate the effectiveness of the program. PREDATION IN THE LOWER COLUMBIA RIVER Predation estimates detailed in this report can only be used to describe pinniped predation activity in the Bonneville Dam tailrace areas, from approximately January through May. The majority of California sea lions that are seen regularly in Astoria do not come to Bonneville Dam in the spring. Based on branded individual re-sights, California sea lions observed at Bonneville Dam probably represent only about 10% of the California sea lions that regularly haul out in Astoria (Matthew Tennis, Pacific States Marine Fisheries Commission, personal comm.). Little information is available on pinniped predation activities in the lower Columbia and tributaries between Bonneville Dam and Astoria, and there is increasing interest in the total impact of California sea lions and other pinnipeds on adult salmon in the lower Columbia River basin. ODFW monitored California sea lion predation at the Willamette Falls Locks from 1996 to 2002 and noted at least five sea lions at the locks and estimated them to have taken up to 300 salmonids (NMFS and ODFW 1997). Between 0.3% to 2.7% of the winter steelhead population, 0.3% to 1.3% of the summer steelhead population, and 0.5% to 0.7% of the spring Chinook population passing the project was taken by California sea lions during this study (Bryan Wright, ODFW, personal comm.). 30
39 RECOMMENDATIONS 1. In light of overall increases in estimated adult salmonid and white sturgeon catch, the earlier and more protracted presence (if not total seasonal abundance) of California and Steller sea lions from January through May in the Bonneville Dam tailrace, and potential management actions by wildlife management agencies, we strongly suggest a continuation of this important monitoring program. 2. The Corps should coordinate with partnering agencies performing observations in the area immediately downstream of our study area. In 2008, students from Portland State University will be monitoring sea lion predation activity from Hamilton Island, covering the area from Tanner Creek to just downstream of Moffett Creek. Personnel from ODFW and WDFW will make limited observations in other areas. 3. SLEDs and FOG barriers should continue to be used to prevent sea lions from entering the fishways of Bonneville Dam. 4. The Corps could use DIDSON or similar technology to assess the reaction of sea lions and fish to acoustic deterrents, and to assess general sea lion and fish interactions near fishway entrances. 5. The Corps should continue to assist in the pursuit and evaluation of potential non-lethal deterrent technologies as part of a long-term strategy to reduce pinniped predation on adult salmonids, sturgeon, and lamprey in the Bonneville Dam tailrace. 31
40 ACKNOWLEDGMENTS We would like to stress that this work has been a collaborative effort of many different agencies and individuals who have all come together to collect the best information possible concerning pinniped predation on salmonids and other fish at Bonneville Dam. The Oregon Department of Fish and Wildlife, Washington Department of Fish and Wildlife, NOAA Fisheries, Pacific States Marine Fisheries Commission, and the Columbia River Inter-Tribal Fish Commission all contributed personnel and equipment to conduct the boat-based hazing program, while the USDA Wildlife Services conducted the dam-based hazing program each year. Robin Brown (ODFW), Steve Jeffries (WDFW), and Brent Norberg (NOAA) were key advisors on non-lethal harassment techniques and the proper application of guidelines provided by the Marine Mammal Protection Act of Matt Tennis (PSMFC) provided us with invaluable data on branded California sea lion sightings, and Bryan Wright (ODFW) assisted us with study design, data analysis, and satellite tag data on Bonneville Dam sea lions. David Clugston and Robert Rose (COE) helped with study objectives, funding, and program support. Ken Tolotti of the University of Idaho Cooperative Fish and Wildlife Research Unit (UICFWU) installed and maintained the acoustic deterrent array system for us. Matthew Keefer, Christopher Peery, and Michael Jepson (UICFWU) continue to provide valuable information on the potential impacts of sea lions, SLEDs, ADDs, and hazing activities on fish passage at Bonneville Dam. The Bonneville Lock and Dam rigging crew should be commended for successfully deploying and removing SLEDs each year, and for assisting with sea lion trapping efforts in A very big thank you goes to all the observers that have collected valuable data for us over the past three years, often under extremely adverse weather conditions. Observers from our own staff at the Fisheries Field Unit (John Dalen, Mike Jonas, Sallie Jones, Patricia Madson, Bill Nagy, and the authors) form the core of our observation team and this program would not be possible without them. In 2005, UICFWU and USGS personnel were contracted to assist with observations as FFU personnel worked on another important study. In 2006 and 2007 we employed interns through the Student Conservation Association (SCA) to assist with observations. David Bakken, Chris Berg, Jake Biron, Marlo Grabner, Julie Kelso, Kathryn Leifeste, Kristy Muskopf, Ayla Peachy, Chelsea Potts (who also provided one of the cover photos), Elizabeth Rauer, and Benjamin Stone accepted bad weather and small paychecks in exchange for valuable field experience. And finally, we have been very appreciative of the collaboration with Dr. Debbie Duffield, Sharon Stuart Glaeser, and volunteer student observers from Portland State University, who continue to make important observations just downstream of our observation site. 32
41 REFERENCES Brown, R., S. Jeffries, B. Wright, M. Tennis, P. Gearin, S. Riemer, and D. Hatch Field report 2007 pinniped research and management activities at Bonneville Dam. Harmon, J., B. Sandford, K. Thomas, N. Paasch, K. McIntyre, and G. Matthews Research related to transportation of juvenile salmonids on the Columbia and Snake Rivers, Annual Report of Research to USACE contract #DACW68-84-H pp. Keefer, M., C. Peery, M. Jepson, and R. Stansell Stock-specific pinniped predation estimates for spring Chinook salmon at Bonneville Dam and effects of deterrents. Abstract for Anadromous Fish Evaluations Program Annual Review. Walla Walla, WA. NMFS and ODFW Environmental assessment on preventing California sea lion foraging and predation on salmonids at Willamette Falls, Oregon. Seattle, Washington: National Marine Fisheries Service and Oregon Department of Fish and Wildlife. NOAA [National Oceanic and Atmospheric Administration] Federal Columbia River Power System Biological Opinion (section , action Item 106). Seattle, WA. NOAA Draft environmental assessment of the take of California sea lions at Bonneville Dam pursuant to Section 120 of the Marine Mammal Protection Act. Seattle, WA. NOAA Final environmental assessment of the take of California sea lions at Bonneville Dam pursuant to Section 120 of the Marine Mammal Protection Act. Seattle, WA. NOAA. Fact sheet - Seal and sea lion facts of the Columbia River and adjacent nearshore marine areas. Pinniped-FS.pdf (accessed January 25, 2008). Norberg, B., R. Stansell, G. Griffin, R. Brown, S. Jeffries, and P. Gearin Field report Preliminary observations of non-lethal deterrence measures fort California sea lion predation at Bonneville Dam. Roffe, T. and B. Mate Abundance and feeding habits of pinnipeds in the Rogue River, OR. J. Wildl. Management 48(4): Stansell, R Evaluation of pinniped predation on adult salmonids and other fish in the Bonneville Dam tailrace, U.S. Army Corps of Engineers, CENWP-OP-SRF, Bonneville Lock and Dam, Cascade Locks, OR. State [Oregon] Board of Fish Commissioners First and second annual reports of the State Board of Fish Commissioners to the Governor, Thwaites, R Original Journals of the Lewis and Clark Expedition, Arno Press. 33
42 Wright, B., S. Jeffries, R. Brown, R. Stansell, D. Hatch, and B. Norberg Field report Non-lethal pinniped deterrent activities at Bonneville Dam, Spring
43 APPENDICES 35
44 Appendix A. Summary of historical documentation of pinniped presence in the Columbia River. Historically, harbor seals were present in the Columbia River as far east as Celilo Falls. Lewis and Clark reported in their journals (Thwaites, 1969) seeing Great numbers of sea otters in the river below the falls (Celilo Falls). Additional reports of sea otters, later correctly identified as harbor seals, were observed around the Cascade Rapids, Beacon Rock, and off the mouth of the Washougal River in the fall of In fact, the Washougal River was once called Seal River (Thwaites, 1969), which implies the presence of seals in the area. Also, Phoca Rock, named for harbor seals, is situated between Multnomah Falls and Rooster Rock. According to the 1888 Report to the Oregon State Board of Commissioners (1889) Hundreds of seals can be seen in the month of July at The Dalles, 200 miles distant from the mouth of the river Once Bonneville Dam was built, pinnipeds were blocked from swimming up to Celilo Falls to feed on the salmon concentrated there. The 1959 Corps of Engineers (COE) Annual Fish Passage Report (AFPR) stated that seals and sea lions were observed more frequently in previous years, some being caught in the McCord and Corbett Point fishwheels and mentions a large bull sea lion about five miles below Bonneville Dam seen in Doug Arndt, Corps of Engineers Fish Biologist (retired), reported seeing California sea lions hauled out at Bonneville Dam s Bradford Island (lower end of Bonneville Dam tailrace) in the early 1970 s (pers. comm.). Lyman et al. (2002) conducted a thorough review of reports documenting archeological phocid remains at several sites in the Lower Columbia River up to Celilo Falls, but not above it. Steller sea lions (Eumetopias jubatus) were taken by hunters 70 km upstream of the mouth in the early 1800 s. However, California sea lions specifically were not documented. California sea lions typically breed in southern California in June to August. Some of the male California sea lions then migrate up the coast and begin arriving around Astoria in late August and September. These animals do not appear to migrate very far up the Columbia River during the fall Chinook run, as there are no recent sightings of pinnipeds at Bonneville during this time. Much of their winter food is smelt (pers. comm., Matthew Tennis), but the sea lion diet is diverse during this season. In January through March, some of the sea lions (possibly 10% of the Astoria California sea lion population) begin migrating up the Columbia River; this is when some California sea lions appear at Bonneville Dam. By late May to June the males begin their migration to the southern California rookeries. Virtually all males participate in the annual migration, although only the large breeding age males will claim a territory for mating. 36
45 Appendix B. Number of highly-identifiable California sea lions (HIA) that were identified and returned to Bonneville Dam in subsequent years ( ). Appendix Table B1. Number of highly-identifiable California sea lions (HIA) that were observed at Bonneville Dam in subsequent years ( ). Year Total HIA* New HIA* Number of Individuals Observed in Subsequent Years and (Percent [%] of Total HIA for Each Year) Observed 1 Year Present Present Present Present Present Only 2 Years 3 Years 4 Years 5 Years 6 Years (13%) (13%) (6%) (31%) (13%) (25%) (37%) (11%) (19%) (7%) (8%) (26%) (11%) (6%) (7%) (9%) (4%) (10%) (25%) (15%) Appendix Table B2. Total number of highly-identifiable California sea lions (HIA) that returned to Bonneville Dam, as it relates to each annual total HIA. For example, 30 (or 37%) of the 85 highly-identifiable animals seen in 2004 were also seen in Year Total HIA* New HIA Total Number of Individuals that Returned from Previous Years and From Year (Percent [%] of Previous Years Total HIA) (88%) (75%) (56%) (38%) (38%) (58%) (43%) (26%) (20%) (62%) (37%) (27%) (57%) (43%) (57%) * Highly-identifiable animals (HIA) were California sea lions that were branded and those with marks or features that made them unique and likely to be identified in subsequent years. Highly-identifiable animals that were not seen in subsequent years may have actually been present, but escaped identification in subsequent years do to changes in coat color, scars, or other markings. 37
46 Appendix C. Assumptions made to determine the number of individual sea lions present and to determine estimates of salmonids and other fish caught by pinnipeds. Catch rates and the hourly distribution of catches for hours and days not observed were assumed to be similar to the mean temporal catch distribution for each particular season. Expansion estimates for very early (0400 h to 0500 h) hours or other hours with no observations were based on observations made in previous years. All adult salmonids caught by pinnipeds were assumed brought to the surface to be torn up and consumed. Some pinnipeds were observed apparently eating large chunks underwater and others dragged fish downstream, both at the surface and underwater great distances before beginning to eat the fish. This behavior may have contributed to an underestimate of the number of salmonids caught, but we feel this occurred less than 1% of the time. Overestimates may have occurred when several pinnipeds were present. A pinniped would catch a fish and take a long time before eating it. Near the end of the season, this behavior could sometimes make it appear as if another pinniped had caught a fish, particularly if the individual that caught the fish was not identified. Pinnipeds stealing a fish from one another were usually identifiable. However, stealing behavior may have been counted as a new fish being taken if the amount of fish originally consumed was not carefully monitored. Overall, these conditions were rare and likely did not significantly affect the expanded estimates. Lamprey were eaten quickly and sea lions would not always shake or throw lamprey but rather swallow them whole, head first, after a few quick bites to kill them. We likely underestimated the number of lamprey caught as the action was quick and distances involved made seeing a lamprey being eaten difficult. All smaller prey (e.g. lamprey, shad, or smolts) could have been consumed underwater and therefore not recorded by our observers. The figures presented for smaller prey are likely underestimates. Harbor seals were present on a few occasions, and they rarely were seen catching salmon. Seals may have targeted lamprey, which could have been consumed underwater. Roffe and Mate (1984) found that lamprey were the primary prey consumed by harbor seals on the Rogue River after analyzing stomach contents. Observations were assumed equally successful at all locations, each observer had equal ability to detect the presence of pinnipeds and when fish were caught, and weather and lighting did not significantly affect these observations. However, when spill occurred (early April through May), it was often difficult to see pinnipeds in the spillway, even when they caught a fish, so our detection and catch rate there may be underestimated. Heavy rain or snow reduced visibility at all tailrace areas at times and distant events may have gone unnoticed. The chance of underestimating the numbers of pinniped present was assumed equal to the chance of overestimating the numbers when large groups were present. The behavior of hunting California sea lions was to stay submerged for several minutes and only briefly 38
47 surface to breathe. This made it difficult to know if a head or nose seen five minutes apart was from the same individual or a different individual. Some individuals hunted in predictable patterns while others would appear to randomly forage and surface. When more than five or six pinnipeds were in a tailrace, it became increasingly challenging to keep track of the number present, identify individuals, record all fish caught, and detect new arrivals and departures. We prioritized our effort as follows: 1) Ensure all fish caught are seen and recorded; 2) Record and document individuals; 3) Determine the number of pinnipeds present. The presence of observers on the tailrace deck was assumed to not affect the presence of pinnipeds in the area or their ability to catch prey. 39
48 Appendix D. Hourly pinniped observation form from 2007 season. 40

 shows the posterior dorsal region of C265, including his brand, a")

49 Appendix E. Photographs of typical scars and brands used to identify individual California sea lions. Photograph (A) shows the posterior dorsal region of C265, including his brand, a temporary satellite transmitter tag (2007 only), and two visible circular scars just above his tail. Photograph (B) shows the posterior dorsal region of C404, with brand clearly visible. Photograph (C) shows BZC130 (highly-identifiable, non-branded) with prominent circular scar on right shoulder area. (A) (B) (C) 41
50 Appendix F. Sea lion haul-out locations at Bonneville Dam. Darker shades of orange indicate more frequent haul-out activity. Sea lions were most frequently seen hauling-out at the downstream end of the north shoreline of Cascades Island and on the concrete apron of the PH2 Corner Collector outfall. N WASHINGTON Columbia River Bradford Island Cascades Island Spillway PH2 Robins Island PH1 Primary Haul-Out Area Secondary Haul-Out Area Additional Haul-Out Sightings OREGON 42
 installed at")

51 Appendix G. Photographs of sea lion exclusion devices (SLEDs) installed at 12 main fishway entrances at Bonneville Dam. SLEDs feature bar spacing of 15 3/8 (39.05 cm) to prevent sea lion entry and allow fish passage by Transco Industries, Inc. 43
 with stab plate barriers, designed to")
52 Appendix H. Photograph of floating orifice gate (FOG) with stab plate barriers, designed to prevent pinnipeds from entering the fishway collection channel at PH2. 44


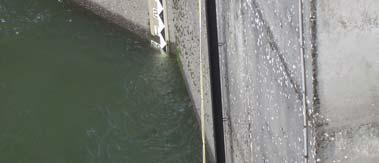
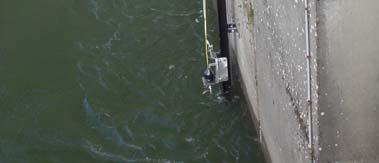
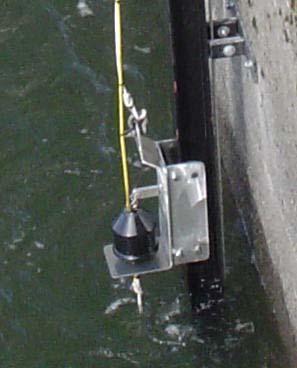
53 Appendix I. Photographs of Airmar db Plus II acoustic deterrent device (ADD) deployed at all main fishway entrances. ADDs were only operated below the water surface. 45


54 Appendix J. Photographs of floating platform sea lion trap operations (2007). California and Steller sea lions were allowed to haul-out on the trap. After the door to the trap was closed, captured sea lions were crated, lifted by crane, and transported to Astoria, Oregon for processing and release. US Army Corps of Engineers Portland District 46
STATUS REPORT PINNIPED PREDATION AND HAZING AT BONNEVILLE DAM IN Robert Stansell, Sean Tackley, and Karrie Gibbons 3/9/07
 STATUS REPORT PINNIPED PREDATION AND HAZING AT BONNEVILLE DAM IN 27 Robert Stansell, Sean Tackley, and Karrie Gibbons 3/9/7 This report is the first of regular status reports on the pinniped predation
STATUS REPORT PINNIPED PREDATION AND HAZING AT BONNEVILLE DAM IN Robert Stansell, Sean Tackley, and Karrie Gibbons 3/23/07
 STATUS REPORT PINNIPED PREDATION AND HAZING AT BONNEVILLE DAM IN 7 Robert Stansell, Sean Tackley, and Karrie Gibbons 3/23/7 This report is the third of regular status reports on the pinniped predation
EVALUATION OF PINNIPED PREDATION ON ADULT SALMONIDS AND OTHER FISH IN THE BONNEVILLE DAM TAILRACE,
 EVALUATION OF PINNIPED PREDATION ON ADULT SALMONIDS AND OTHER FISH IN THE BONNEVILLE DAM TAILRACE, 2008-2010 Robert J. Stansell, Karrie M. Gibbons, and William T. Nagy U.S. Army Corps of Engineers Portland
STATUS REPORT PINNIPED PREDATION AND HAZING AT BONNEVILLE DAM IN Robert Stansell, Sean Tackley, and Karrie Gibbons 4/27/07
 STATUS REPORT PINNIPED PREDATION AND HAZING AT BONNEVILLE DAM IN 27 Robert Stansell, Sean Tackley, and Karrie Gibbons 4/27/7 This report is the eighth of regular status reports on the pinniped predation
STATUS REPORT - PINNIPED PREDATION AND DETERRENT ACTIVITIES AT BONNEVILLE DAM, 2009
 STATUS REPORT - PINNIPED PREDATION AND DETERRENT ACTIVITIES AT BONNEVILLE DAM, 29 Robert Stansell, Sean Tackley, and Karrie Gibbons - (541) 374-881 Fisheries Field Unit U.S. Army Corps of Engineers Bonneville
STATUS REPORT PINNIPED PREDATION AND HAZING AT BONNEVILLE DAM IN Robert Stansell, Sean Tackley, and Karrie Gibbons 4/6/07
 STATUS REPORT PINNIPED PREDATION AND HAZING AT BONNEVILLE DAM IN 27 Robert Stansell, Sean Tackley, and Karrie Gibbons 4/6/7 This report is the fifth of regular status reports on the pinniped predation
STATUS REPORT - PINNIPED PREDATION AND DETERRENT ACTIVITIES AT BONNEVILLE DAM, 2009
 STATUS REPORT - PINNIPED PREDATION AND DETERRENT ACTIVITIES AT BONNEVILLE DAM, 29 Robert Stansell, Sean Tackley, and Karrie Gibbons - (541) 374-881 Fisheries Field Unit U.S. Army Corps of Engineers Bonneville
STATUS REPORT PINNIPED PREDATION AND DETERRENT ACTIVITIES AT BONNEVILLE LOCK AND DAM. May 3, 2017
 STATUS REPORT PINNIPED PREDATION AND DETERRENT ACTIVITIES AT BONNEVILLE LOCK AND DAM May 3, 217 Prepared by: Kyle Tidwell, Bjorn van der Leeuw, Thomas Van Hevelingen Fisheries Field Unit U.S. Army Corps
STATUS REPORT - PINNIPED PREDATION AND DETERRENT ACTIVITIES AT BONNEVILLE DAM, 2011
 STATUS REPORT - PINNIPED PREDATION AND DETERRENT ACTIVITIES AT BONNEVILLE DAM, 211 Robert Stansell, Bjorn van der Leeuw, and Karrie Gibbons - (541) 374-881 Fisheries Field Unit U.S. Army Corps of Engineers
2008 FIELD REPORT: EVALUATION OF PINNIPED PREDATION ON ADULT SALMONIDS AND OTHER FISHES IN THE BONNEVILLE DAM TAILRACE
 2008 FIELD REPORT: EVALUATION OF PINNIPED PREDATION ON ADULT SALMONIDS AND OTHER FISHES IN THE BONNEVILLE DAM TAILRACE Sean Tackley, Robert Stansell, and Karrie Gibbons U.S. Army Corps of Engineers Fisheries
STATUS REPORT - PINNIPED PREDATION AND DETERRENT ACTIVITIES AT BONNEVILLE DAM, 2011
 STATUS REPORT - PINNIPED PREDATION AND DETERRENT ACTIVITIES AT BONNEVILLE DAM, 211 Robert Stansell, Bjorn van der Leeuw, and Karrie Gibbons - (541) 374-881 Fisheries Field Unit U.S. Army Corps of Engineers
STATUS REPORT - PINNIPED PREDATION AND DETERRENT ACTIVITIES AT BONNEVILLE DAM, 2011
 STATUS REPORT - PINNIPED PREDATION AND DETERRENT ACTIVITIES AT BONNEVILLE DAM, 211 Robert Stansell, Bjorn van der Leeuw, and Karrie Gibbons - (541) 374-881 Fisheries Field Unit U.S. Army Corps of Engineers
STATUS REPORT - PINNIPED PREDATION AND DETERRENT ACTIVITIES AT BONNEVILLE DAM, 2009
 STATUS REPORT - PINNIPED PREDATION AND DETERRENT ACTIVITIES AT BONNEVILLE DAM, 29 Robert Stansell, Sean Tackley, and Karrie Gibbons - (541) 374-881 Fisheries Field Unit U.S. Army Corps of Engineers Bonneville
2011 FIELD REPORT: EVALUATION OF PINNIPED PREDATION ON ADULT SALMONIDS AND OTHER FISH IN THE BONNEVILLE DAM TAILRACE, 2011
 2011 FIELD REPORT: EVALUATION OF PINNIPED PREDATION ON ADULT SALMONIDS AND OTHER FISH IN THE BONNEVILLE DAM TAILRACE, 2011 Robert J. Stansell, Karrie M. Gibbons, William T. Nagy, and Bjorn K. van der Leeuw
Mike Jepson, Ken Tolotti, Chris Peery, and Brian Burke University of Idaho and NOAA Fisheries
 To: From: David Clugston, USACE Portland District Mike Jepson, Ken Tolotti, Chris Peery, and Brian Burke University of Idaho and NOAA Fisheries RE: Radio-telemetry data for Chinook salmon at Bonneville
Michael Jepson, Ken Tolotti, Christopher Peery, and Brian Burke University of Idaho and NOAA Fisheries
 To: From: David Clugston, USACE Portland District Michael Jepson, Ken Tolotti, Christopher Peery, and Brian Burke University of Idaho and NOAA Fisheries RE: Radio-telemetry data for Chinook salmon at Bonneville
Oregon Pinnipeds: Status, Trends, & Management. Robin Brown Oregon Department of Fish and Wildlife Marine Mammal Program
 Oregon Pinnipeds: Status, Trends, & Management Robin Brown Oregon Department of Fish and Wildlife Marine Mammal Program Acknowledgments NOAA Fisheries National Marine Mammal Laboratory Washington Department
EVALUATION OF PINNIPED PREDATION ON ADULT SALMONIDS AND OTHER FISH IN THE BONNEVILLE DAM TAILRACE, 2017
 EVALUATION OF PINNIPED PREDATION ON ADULT SALMONIDS AND OTHER FISH IN THE BONNEVILLE DAM TAILRACE, 2017 Kyle S. Tidwell, Bjorn K. van der Leeuw, Lindsay N. Magill, Brett A. Carrothers, and Robert H. Wertheimer
Sea Lion Predation Rate Estimation and Non-lethal Hazing
 Table 1. Project metadata. Project umber 2008-004-00 Proposer Short Description Province(s) Subbasin(s) Contact ame Contact email Columbia River Inter-Tribal Fish Commission Sea lion hazing, abundance
FINAL REPORT AND RECOMMENDATIONS OF THE MARINE MAMMAL PROTECTION ACT, SECTION 120 PINNIPED-FISHERY INTERACTION TASK FORCE: COLUMBIA RIVER
 FINAL REPORT AND RECOMMENDATIONS OF THE MARINE MAMMAL PROTECTION ACT, SECTION 120 PINNIPED-FISHERY INTERACTION TASK FORCE: COLUMBIA RIVER November 5, 2007 Marine Mammal Protection Act, Section 120 Pinniped-Fishery
FIELD REPORT: 2009 PINNIPED MANAGEMENT ACTIVITIES AT AND BELOW BONNEVILLE DAM. October 28, 2009 INTRODUCTION
 FIELD REPORT: 2009 PINNIPED MANAGEMENT ACTIVITIES AT AND BELOW BONNEVILLE DAM October 28, 2009 Robin Brown 1, Steve Jeffries 2, Doug Hatch 3, Bryan Wright 1, Sandra Jonker 2 and John Whiteaker 3 INTRODUCTION
FIELD REPORT: 2010 PINNIPED MANAGEMENT ACTIVITIES AT AND BELOW BONNEVILLE DAM. October 18, 2010 INTRODUCTION
 FIELD REPORT: 2010 PINNIPED MANAGEMENT ACTIVITIES AT AND BELOW BONNEVILLE DAM October 18, 2010 Robin Brown 1, Steven Jeffries 2, Doug Hatch 3, Bryan Wright 1, and Sandra Jonker 2 INTRODUCTION This year
RECOMMENDATIONS FOR WEST COAST PINNIPED REMOVAL NATIONAL MARINE FISHERIES SERVICE (NMFS) REPORT TO CONGRESS
 REPORT TO CONGRESS") RECOMMENDATIONS FOR WEST COAST PINNIPED REMOVAL NATIONAL MARINE FISHERIES SERVICE (NMFS) REPORT TO CONGRESS In those cases where enough is known about pinniped affects on other resources to raise valid
RECOMMENDATIONS FOR WEST COAST PINNIPED REMOVAL NATIONAL MARINE FISHERIES SERVICE (NMFS) REPORT TO CONGRESS In those cases where enough is known about pinniped affects on other resources to raise valid
Russian River Estuary Management Project
 Russian River Estuary Management Project Marine Mammal Protection Act Incidental Harassment Authorization Report of Activities and Monitoring Results January 1 to December 31, 2013 Prepared for Office
APPENDIX C. TASK FORCE MEETING AGENDAS and NOTES. Proposed Agenda Day 1 September 4 9:30 am 5:00 pm
 Proposed Agenda Day 1 September 4 9:30 am 5:00 pm 9:30 Getting Started Donna Silverberg, Facilitator, DS Consulting 9:40 Welcome and Introductions Bob Lohn, Regional Administrator, NOAA Fisheries 10:00
Final Report: Aerial Surveys of Pinniped Haulout Sites in Pacific Northwest Inland Waters
 Final Report: Aerial Surveys of Pinniped Haulout Sites in Pacific Northwest Inland Waters Report for Contract No. N62470-10-D-3011 - CTO JP02 June 2013 Prepared by: Prepared for: Steven Jeffries Washington
An Assessment of Pinniped Predation Upon. Fall-run Chinook Salmon. in the Lower Klamath River, CA, 1997
 An Assessment of Pinniped Predation Upon Fall-run Chinook Salmon in the Lower Klamath River, CA, 1997 Prepared By: Dave Hillemeier June 1999 YUROK TRIBAL FISHERIES PROGRAM 15900 Highway 101 N., Klamath,
Rationale for Five Agency Proposed Alternative BDCP Initial Project Operations Criteria May 18, 2011 Working Draft
 Rationale for Five Agency Proposed Alternative BDCP Initial Project Operations Criteria May 18, 2011 Working Draft The following is a summary Rationale for Five Agency Alternative BDCP Initial Project
West Coast Pinniped Program Investigations on California Sea Lion and Pacific Harbor Seal Impacts on Salmonids and Other Fishery Resources
 West Coast Pinniped Program Investigations on California Sea Lion and Pacific Harbor Seal Impacts on Salmonids and Other Fishery Resources Joe Scordino (Retired - NOAA/National Marine Fisheries Service
An Assessment of Pinniped Predation Upon. Fall-run Chinook Salmon. in the Klamath River Estuary, CA, 1999
 An Assessment of Pinniped Predation Upon Fall-run Chinook Salmon in the Klamath River Estuary, CA, 1999 October, 2001 Prepared By: Kathleen Williamson Dave Hillemeier Yurok Tribal Fisheries Program 15900
Taking of Marine Mammals Incidental to Specified Activities; Construction at Orcas
 This document is scheduled to be published in the Federal Register on 04/23/2013 and available online at http://federalregister.gov/a/2013-09492, and on FDsys.gov BILLING CODE 3510-22-P DEPARTMENT OF COMMERCE
APPENDIX E MARINE MAMMAL PROTECTION ACT COMPLIANCE
 E.1 INTRODUCTION APPENDIX E MARINE MAMMAL PROTECTION ACT COMPLIANCE The Navy, pursuant to 50 Code of Federal Regulations (C.F.R.) 216, Subpart I (61 Federal Register 15884 et. seq.), 101 (a) (5) (D) of
Russian River Estuary Management Project
 Russian River Estuary Management Project Marine Mammal Protection Act Incidental Harassment Authorization Report of Activities and Monitoring Results January 1 to December 31, 2016 Prepared for Office
Salinas Valley Water Project Annual Flow Monitoring Report
 Salinas Valley Water Project Annual Flow Monitoring Report Operational Season 2013 Monterey County Water Resources Agency 893 Blanco Circle Salinas, CA 93901 April 2014 Revised July 2014 TABLE OF CONTENTS
Takes of Marine Mammals Incidental to Specified Activities; Seabird and Pinniped Research
 This document is scheduled to be published in the Federal Register on 12/12/2012 and available online at http://federalregister.gov/a/2012-29952, and on FDsys.gov BILLING CODE 3510-22-P DEPARTMENT OF COMMERCE
Steller sea lion decline perspectives
 Steller sea lion decline perspectives Andrew W Trites North Pacific Universities Marine Mammal Research Consortium Alaska Aleutian Islands Fishing Predation 4, Abund dance 3, 2, 1, 196 198 2 Competitive
CONSERVANCY. P.O. Box 2016 La Jolla, CA
 SEAL CONSERVANCY P.O. Box 2016 La Jolla, CA 92038 www.sealconservancy.org Harbor Seal Facts Harbor seals are pinnipeds. They are true seals; that is, they do not have visible ear flaps. They inhabit the
Takes of Marine Mammals Incidental to Specified Activities; Seabird Research Activities
 This document is scheduled to be published in the Federal Register on 02/25/2015 and available online at http://federalregister.gov/a/2015-03849, and on FDsys.gov BILLING CODE 3510-22-P DEPARTMENT OF COMMERCE
E-SEAL NEWS. Seals on the move. It s spring! Watch for weaners! For up-to-date information visit our website!
 E-SEAL NEWS Newsletter Spring 2001 For up-to-date information visit our website! www.elephantseal.org It s spring! Watch for weaners! It s often remarked that elephant seals lying on the beach resemble
Takes of Marine Mammals Incidental to Specified Activities; Taking Marine Mammals
 This document is scheduled to be published in the Federal Register on 07/05/2018 and available online at https://federalregister.gov/d/2018-14440, and on FDsys.gov BILLING CODE 3510-22-P DEPARTMENT OF
Pinnipeds. Andrew W Trites Marine Mammal Research Unit Fisheries Centre, UBC
 Pinnipeds Andrew W Trites Marine Mammal Research Unit Fisheries Centre, UBC Pinniped Outline 1. Species in Canada & Pinniped Families 2. Life Cycles Arrival on land or ice Delivery, lactation, attendance,
Takes of Marine Mammals Incidental to Specified Activities; Taking Marine Mammals
 This document is scheduled to be published in the Federal Register on 01/23/2015 and available online at http://federalregister.gov/a/2015-01154, and on FDsys.gov DEPARTMENT OF COMMERCE National Oceanic
Alaska Sea Lions and Seals
 Alaska Sea Lions and Seals Blaire, Kate, Donovan, & Alex Biodiversity of Alaska 18 June 2017 https://www.stlzoo.org/files/3913/6260/5731/sea-lion_rogerbrandt.jpg Similarities & Differences of Sea Lions
Clarification of December 9, 2011 memo regarding Little Goose spill operations and adult Chinook conversion rates and travel times
 FISH PASSAGE CENTER 1827 NE 44 th Ave., Suite 240, Portland, OR 97213 Phone: (503) 230-4099 Fax: (503) 230-7559 http://www.fpc.org/ e-mail us at fpcstaff@fpc.org MEMORANDUM TO: Fish Passage Advisory Committee
Takes of Marine Mammals Incidental to Specified Activities; Taking Marine Mammals
 This document is scheduled to be published in the Federal Register on 05/02/2018 and available online at https://federalregister.gov/d/2018-09240, and on FDsys.gov BILLING CODE 3510-22-P DEPARTMENT OF
Takes of Marine Mammals Incidental to Specified Activities; Taking Marine Mammals
 This document is scheduled to be published in the Federal Register on 05/02/2018 and available online at https://federalregister.gov/d/2018-09238, and on FDsys.gov BILLING CODE 3510-22-P DEPARTMENT OF
Takes of Marine Mammals Incidental to Specified Activities; Land Survey Activities. within the Eastern Aleutian Islands Archipelago, Alaska, 2015
 This document is scheduled to be published in the Federal Register on 06/16/2015 and available online at http://federalregister.gov/a/2015-14700, and on FDsys.gov BILLING CODE 3510-22-P DEPARTMENT OF COMMERCE
Provide a Vessel to Conduct Observations and Deploy Sound Source for a Behavioral Response Study of Cetaceans off Southern California in 2011
 DISTRIBUTION STATEMENT A. Approved for public release; distribution is unlimited. Provide a Vessel to Conduct Observations and Deploy Sound Source for a Behavioral Response Study of Cetaceans off Southern
Relationship between Project Operations and Spring Chinook Adult Passage at Little Goose Dam
 FISH PASSAGE CENTER 847 N.E. 19 th Avenue, #250, Portland, Oregon 97232 Phone: (503) 833-3900 Fax: (503) 232-1259 www.fpc.org e-mail us at fpcstaff@fpc.org MEMORANDUM TO: Michele DeHart FROM: Bobby Hsu,
analyzed based on NOAA7s criteria and CEQ7s context and intensity criteria. These include :
 Finding of No Significant Impact (FONSI) for the Environmental Assessment on the Issuance of Regulations to Take Marine Mammals by Harassment Incidental to U. S. Navy Missile Launch Activities at San Nicolas
Decoupling freshwater and marine effects on the early marine survival of steelhead smolts through Puget Sound
 Decoupling freshwater and marine effects on the early marine survival of steelhead smolts through Puget Sound NWFSC Megan Moore Barry Berejikian Manchester Laboratory, NOAA Fisheries Previous Puget Sound
The Role of Marine Mammals in Marine Ecosystems -- part II. Lisa T. Ballance SIO 133 Marine Mammal Biology Spring 2015
 The Role of Marine Mammals in Marine Ecosystems -- part II Lisa T. Ballance SIO 133 Marine Mammal Biology Spring 2015 Marine Mammals as Prey The ecological role of large whales as prey is the most controversial
GRAY WHALE. Text source: The Marine Mammal Center
 GRAY WHALE Gray whales are found only in the Pacific Ocean, and they have one of the longest migrations of any mammal. During the summer, they live in the Arctic. In the fall, they travel to Baja California,
The Role of Marine Mammals in Marine Ecosystems -- part II. Lisa T. Ballance SIO 133 Marine Mammal Biology Spring 2018
 The Role of Marine Mammals in Marine Ecosystems -- part II Lisa T. Ballance SIO 133 Marine Mammal Biology Spring 2018 Marine Mammals as Prey The ecological role of large whales as prey is the most controversial
Takes of Marine Mammals Incidental to Specified Activities; Seabird Monitoring and
 This document is scheduled to be published in the Federal Register on 09/18/2014 and available online at http://federalregister.gov/a/2014-22269, and on FDsys.gov BILLING CODE 3510-22-P DEPARTMENT OF COMMERCE
SAVED! Hawaii's False Killer Whales
 SAVED! Hawaii's False Killer Whales On behalf of the Pacific Whale Foundation s over 300,000 supporters, I would like to fully endorse the proposed listing of Hawaiian insular false killer whales as Endangered
Northern fur seal Conservation Plan: Status and Update
 Northern fur seal Conservation Plan: Status and Update Alaska Region Michael Williams Protected Resources 6/5/2018 Outline Current Conservation Plan: background & authority Current Plan Content and Implementation:
Distribution Ecology attempts to explain the restricted and generally patchy distribution of species
 Marine Mammal Ecology Ecology : An attempt to describe and explain the patterns of distribution and abundance of organisms. These patterns reflect the history of complex interactions with other organisms
BIODIVERSITY ANNUAL REPORT 2016 STATUS OF DOLPHINS IN ABU DHABI
 BIODIVERSITY ANNUAL REPORT 2016 STATUS OF DOLPHINS IN ABU DHABI EXECUTIVE SUMMARY Dolphins are apex predators that bio-accumulate marine toxins, consequently, they are good indicators of marine environmental
WHAT S HAPPENING SEPTEMBER - NOVEMBER:
 WHAT S HAPPENING SEPTEMBER - NOVEMBER: In the fall you will see elephant seals that are too young to take part in the winter breeding season hauling out to rest. They gather together in large groups lying
Answer to DG Environment request on scientific information concerning impact of sonar activities on cetacean populations
 International Council for the Exploration of the Sea Conseil International pour l Exploration de la Mer JUNE 2001 FEBRUARY 2005 Answer to DG Environment request on scientific information concerning impact
Sperm Whale. The Kid s Times: Volume II, Issue 8. NOAA s National Marine Fisheries Service, Office of Protected Resources
 NOAA s National Marine Fisheries Service, Office of Protected Resources The Kid s Times: Volume II, Issue 8 Sperm Whale Females, young of both sexes, and calves live in groups. Older males are solitary.
Fine-scale Focal Dtag Behavioral Study of Diel Trends in Activity Budgets and Sound Production of Endangered Baleen Whales in the Gulf of Maine
 DISTRIBUTION STATEMENT A: Approved for public release; distribution is unlimited. Fine-scale Focal Dtag Behavioral Study of Diel Trends in Activity Budgets and Sound Production of Endangered Baleen Whales
Acoustic and Visual Survey of Cetaceans at Palmyra Atoll
 Acoustic and Visual Survey of Cetaceans at Atoll Trip report 09/2007, Simone Baumann Yeo Kian Peen Contact: sbaumann@ucsd.edu, jhildebrand@ucsd.edu John Hildebrand Lab Contents: Summary Tables Sightings
Logistics (cont.) While in the park
 While in the park") Logistics Logistics Schedule Reminder email, however, mark docent days on your calendars Doodle poll will be locked on Dec 20th Fridays docents with several years experience If you can t make your shift,
Logistics Logistics Schedule Reminder email, however, mark docent days on your calendars Doodle poll will be locked on Dec 20th Fridays docents with several years experience If you can t make your shift,
An Assessment of Pinniped Predation Upon. Fall-run Chinook Salmon. in the Klamath River Estuary, CA, 1998
 An Assessment of Pinniped Predation Upon Fall-run Chinook Salmon in the Klamath River Estuary, CA, 1998 October, 2001 Prepared By: Kathleen Williamson Dave Hillemeier Yurok Tribal Fisheries Program 15900
ENVIRONMENTAL ASSESSMENT OF THE EFFECTS OF PERMIT ISSUANCE FOR RESEARCH AND RECOVERY ACTIVITIES ON STELLER SEA LIONS
 ENVIRONMENTAL ASSESSMENT OF THE EFFECTS OF PERMIT ISSUANCE FOR RESEARCH AND RECOVERY ACTIVITIES ON STELLER SEA LIONS 2005 Lead Agency: Responsible Official USDC National Oceanic and Atmospheric Administration
Alaska SeaLife Center. vital rate telemetry: survival/mortality, reproduction
 consummate and consumed predators sea lions, sharks, killer whales. who eats whom? 1 & Jo-Ann Mellish 2,3 vital rate telemetry: survival/mortality, reproduction 1 Oregon State University 2, Seward, AK
NORTH FORK FEATHER RIVER, CA
 Hydropower Project License Summary NORTH FORK FEATHER RIVER, CA ROCK CREEK CRESTA HYDROELECTRIC PROJECT (P-1962) Kayakers below the Cresta Dam Photo: Hydropower Reform Coalition This summary was produced
Takes of Marine Mammals Incidental to Specified Activities; Taking Marine Mammals
 This document is scheduled to be published in the Federal Register on 02/25/2016 and available online at http://federalregister.gov/a/2016-03998, and on FDsys.gov BILLING CODE 3510-22-P DEPARTMENT OF COMMERCE
BREATHE like a Pinniped?
 BREATHE like a Pinniped? Activity at a Glance Grade: 5-9 Subject: Science Category: Life Science Topic: Living Things, Animals, Human Body Systems Time Required One 45-minute period Level of Complexity
PINNIPED RESPONSES DURING NAVY MISSILE LAUNCHES AT SAN NICOLAS ISLAND, CALIFORNIA
 PINNIPED RESPONSES DURING NAVY MISSILE LAUNCHES AT SAN NICOLAS ISLAND, CALIFORNIA MEIKE HOLST, 1 JACK W. LAWSON 1,3, W. JOHN RICHARDSON 1, STEVEN J. SCHWARTZ 2 AND GRACE SMITH 2 1 LGL Ltd., environmental
Patchiness of the Plankton
 Patchiness of the Plankton Within the geographical boundaries inhabited by any species, the individuals of that species are not distributed uniformly or randomly, but are usually aggregated into discrete
Managing Precocious Maturation in Chinook Salmon Captive Broodstock
 Managing Precocious Maturation in Chinook Salmon Captive Broodstock Paul Adelizi, Jamie McGrath-Castro and Brian Erlandsen California Department of Fish and Wildlife 2017 Northwest Fish Culture Concepts
CALIFORNIA COOPERATIVE OCEANIC FISHERIES INVESTIGATION (CALCOFI) CRUISES:
 CRUISES:") CALIFORNIA COOPERATIVE OCEANIC FISHERIES INVESTIGATION (CALCOFI) CRUISES: 2009-2010 Greg Campbell, Karlina Merkens and John Hildebrand Marine Physical Laboratory, Scripps Institution of Oceanography University
CALIFORNIA COOPERATIVE OCEANIC FISHERIES INVESTIGATION (CALCOFI) CRUISES: 2009-2010 Greg Campbell, Karlina Merkens and John Hildebrand Marine Physical Laboratory, Scripps Institution of Oceanography University
Marine Mammals and Sound
 Marine Mammals and Sound Acoustics Why sound? Light attenuates rapidly Sound travels farther & faster (higher density of fluid) Over large spatial scales in water, visual communication is not practical
POINTLESS PERIL. [Deadlines and Death Counts]
![POINTLESS PERIL. [Deadlines and Death Counts]](/thumbs/81/84504231.jpg "POINTLESS PERIL. [Deadlines and Death Counts]") POINTLESS PERIL [Deadlines and Death Counts] Marine mammals, such as whales and dolphins, are some of the most beloved creatures in the ocean. Each year thousands of marine mammals are unnecessarily killed
POINTLESS PERIL [Deadlines and Death Counts] Marine mammals, such as whales and dolphins, are some of the most beloved creatures in the ocean. Each year thousands of marine mammals are unnecessarily killed
10 New Insights about male NES based on results of 3- year survey during molting/breeding seasons
 10 New Insights about male NES based on results of 3- year survey during molting/breeding seasons Brittany Marnin BS, Gianna Milano BS and William J. Goodger DVM, PhD This summary of the 3 year male survey
Competing tradeoffs between increasing marine mammal predation and fisheries harvest of Chinook salmon
 www.nature.com/scientificreports Received: 26 July 2017 Accepted: 16 October 2017 Published: xx xx xxxx OPEN Competing tradeoffs between increasing marine mammal predation and fisheries harvest of Chinook
STELLER SEA LION (Eumetopias jubatus)
") STELLER SEA LION (Eumetopias jubatus) Status ESA Endangered - Western Distinct Population Segment ESA Threatened - Eastern Distinct Population Segment MMPA Depleted - throughout its range Fast Fun Facts
STELLER SEA LION (Eumetopias jubatus) Status ESA Endangered - Western Distinct Population Segment ESA Threatened - Eastern Distinct Population Segment MMPA Depleted - throughout its range Fast Fun Facts
Going with the Flow Update. An update and comparative analysis of five years of Water Sentinels flow data collection of the Upper Verde River
 Going with the Flow Update An update and comparative analysis of five years of Water Sentinels flow data collection of the Upper Verde River Rachel Shultis Intern for Science-Practice Integration Grand
Jim Woodruff Dam Section 7 Consultation. Hydrological Modeling Technical Workshop II 12 July 2006
 Jim Woodruff Dam Section 7 Consultation Hydrological Modeling Technical Workshop II 12 July 2006 Endangered Species Act of 1973 Section 7 Consultation All Federal agencies shall, in consultation with and
RECOVERY POTENTIAL ASSESSMENT FOR NORTHERN FUR SEALS (Callorhinus ursinus)
") Canadian Science Advisory Secretariat Science Advisory Report 2007/052 RECOVERY POTENTIAL ASSESSMENT FOR NORTHERN FUR SEALS (Callorhinus ursinus) Northern fur seals (Callorhinus ursinus) Photo by: A. W.
Canadian Science Advisory Secretariat Science Advisory Report 2007/052 RECOVERY POTENTIAL ASSESSMENT FOR NORTHERN FUR SEALS (Callorhinus ursinus) Northern fur seals (Callorhinus ursinus) Photo by: A. W.
DELTA CONDITIONS REPORT, NOVEMBER 19, 2015 EXECUTIVE SUMMARY
 Holly Long, SLDMWA DELTA CONDITIONS REPORT, NOVEMBER 19, 2015 EXECUTIVE SUMMARY Operational constraint: Salinity management. o X2 today is >81 km. o Scheduled combined exports today are 2,500 cfs. o Outflow
Training California sea lions to record whale behavior using a rehabilitating California gray whale calf
 Aquatic Mammals 2001, 27.3, 289 293 Training California sea lions to record whale behavior using a rehabilitating California gray whale calf J. Harvey, J. Hurley and S. Skrovan Moss Landing Marine Laboratories,
A Report to the Sacramento Water Forum 2831 G Street, Suite 100, Sacramento, CA
 Estimates of Chinook salmon embryo production within the Lower American River, California, 2013-14 spawning year and ramifications for flow management decisions Executive Summary A Report to the Sacramento
Takes of Marine Mammals Incidental to Specified Activities; Gull Monitoring and
 This document is scheduled to be published in the Federal Register on 05/30/2017 and available online at https://federalregister.gov/d/2017-11036, and on FDsys.gov BILLING CODE 3510-22-P DEPARTMENT OF
Takes of Marine Mammals Incidental to Specified Activities; Seabird and Pinniped
 This document is scheduled to be published in the Federal Register on 12/23/2014 and available online at http://federalregister.gov/a/2014-29991, and on FDsys.gov BILLING CODE 3510-22-P DEPARTMENT OF COMMERCE
RA INTERIM FLOW PROGRAM RECOMMENDATIONS: Updated April 12, 2013
 RA INTERIM FLOW PROGRAM RECOMMENDATIONS: Updated April 12, 2013 Background On April 10 I received a new Allocation and Default Flow Schedule (Allocation) from Reclamation that was based on the April 1
Movements of Male California Sea Lions Captured in the Columbia River
 Bryan E. Wright 1, Oregon Department of Fish and Wildlife, 7118 NE Vandenberg Avenue, Corvallis, Oregon 97330 Mathew J. Tennis, Pacific States Marine Fisheries Commission, 2001 Marine Drive, Room 120,
OBSERVATION OF TOOTH SCARS ON THE HEAD OF MALE SPERM WHALE, AS AN INDICATION OF INTRA-SEXUAL FIGHTINGS
 OBSERVATION OF TOOTH SCARS ON THE HEAD OF MALE SPERM WHALE, AS AN INDICATION OF INTRA-SEXUAL FIGHTINGS HIDEHIRO KATO Whales Research Institute, Tokyo ABSTRACT In order to examine the relation between intra-sexual
Interim Extension of the Marine Mammal Sanctuary and Seismic Survey Regulations to Manage the Risk of Maui s Dolphin Mortality
 Interim Extension of the Marine Mammal Sanctuary and Seismic Survey Regulations to Manage the Risk of Maui s Dolphin Mortality Purpose 1 The Department of Conservation (DOC) is seeking submissions on a
Land-Water Interface and Service Pier Extension
 Land-Water Interface and Service Pier Extension Final EIS 3.4. MARINE MAMMALS Marine mammals discussed in this section include species likely to be found in Puget Sound. Cetaceans (including whales, dolphins,
NAVAL POSTGRADUATE SCHOOL
 NPS-OC-09-00 NAVAL POSTGRADUATE SCHOOL MONTEREY, CALIFORNIA Acoustic and visual monitoring for cetaceans along the outer Washington coast by Erin M. Oleson, John Calambokidis, Erin Falcone, Greg Schorr,
Takes of Marine Mammals Incidental to Specified Activities; Taking Marine Mammals
 This document is scheduled to be published in the Federal Register on 07/10/2014 and available online at http://federalregister.gov/a/2014-16148, and on FDsys.gov BILLING CODE 3510-22-P DEPARTMENT OF COMMERCE
Underwater hearing in California sea lions (Zalophus californianus): Expansion and interpretation of existing data
: Expansion and interpretation of existing data") MARINE MAMMAL SCIENCE, **(*): *** *** (*** 2011) C 2011 by the Society for Marine Mammalogy DOI: 10.1111/j.1748-7692.2011.00473.x Underwater hearing in California sea lions (Zalophus californianus): Expansion
MARINE MAMMAL SCIENCE, **(*): *** *** (*** 2011) C 2011 by the Society for Marine Mammalogy DOI: 10.1111/j.1748-7692.2011.00473.x Underwater hearing in California sea lions (Zalophus californianus): Expansion
DCP Bimini Study Summary Report
 1 A Study of Group Dynamics and Individual Identifications for a group of Atlantic spotted dolphins (Stenella frontalis) observed around North Bimini Island, Bahamas Xenia Brobeil and Kathleen M. Dudzinski
DolphinWatch: Dolphins in the Chesapeake Bay. Amber Fandel Faculty Research Assistant
 DolphinWatch: Dolphins in the Chesapeake Bay Amber Fandel Faculty Research Assistant 1 Lots of dolphins! Philip Yunger Kevin McDonald Carolyn Wilson Chris Moe Chris Bache Dennis DePriest Tania Richardson
SELECTED OBSERVATIONS OF CORALS AND SPONGES
 APPENDIX D SELECTED OBSERVATIONS OF CORALS AND SPONGES Appendix D maps depict the spatial distribution of selected observations of corals and sponges from visual surveys conducted by a number of agencies
TOP:029.1 U.S. Fish and Wildlife Service TECHNICAL OPERATING PROCEDURE
 TOP:029.1 February 26, 2016 U.S. Fish and Wildlife Service Marquette Biological Station 3090 Wright Street Marquette, Michigan 49855 U.S.A. and U.S. Fish and Wildlife Service Ludington Biological Station