Going with the Flow Update. An update and comparative analysis of five years of Water Sentinels flow data collection of the Upper Verde River
|
|
|
- Ethan Butler
- 5 years ago
- Views:
Transcription


1 Going with the Flow Update An update and comparative analysis of five years of Water Sentinels flow data collection of the Upper Verde River Rachel Shultis Intern for Science-Practice Integration Grand Canyon Chapter of the Sierra Club April

2 Water Sentinels Above Verde Springs Discharge Measurement Site Figure 1. Above Verde Springs. Photo Credit: Rachel Shultis As determined in the 2013 Going with the Flow Report, the Above Verde Springs measurement site at mile 2.1 that begins just downstream of Stillman Lake and at the mouth of the Granite Creek River remains essentially dry. Although there are times when some water flow can be gaged, it often involves digging a channel or measuring just one small area of movement. Measurements from 2012 to 2017 continue the pattern where flow measurements were less than 1.0 cubic feet per second (cfs); however, there was one measurement in January 2017 of 1.9 cfs. In 2013, most measurements were less than 0.2 cfs. Data from 2012 to 2017 demonstrate flow measurements of 0.17 cfs on average with most measurements falling below 0.1 or at Flow (cfs) Dec-11 Apr-13 Aug-14 Jan-16 May-17 Date of Measurement Chart 1. Flow Rate Data: Above Verde Springs Site 2

3 Base Flow at the SRP Campbell Ranch Low-Flow Gage The Salt River Project (SRP) installed a low-flow gage at river mile 3.2 that logs and records river flow in cfs every 15 minutes. These data are important because of the gage s close proximity to Verde Springs, which is the primary source of baseflow for the river. Figure 2. Campbell Ranch Low Flow Gage. Photo Credit: Gary Beverly Water Sentinels obtained daily mean flow data from the SRP archives for years These data were then calculated into monthly average cfs where sufficient data were available [See Appendix A]. The majority of the monthly mean flow of the Upper Verde River from January 2012 to December 2017 ranged between 14 and 16 cfs, a decrease in both the size of the range and the measurements themselves from the flow data range of 17 to 20 cfs.error! Bookmark not defined. In these sets of data specifically, it appears as measurements decrease, they also move closer together. Although this pattern of clustering as measurements decrease is not accurate in considering the long-term record from mid-1963 to 2018, it is an interesting observation in these most recent data sets Mean Monthly Flow (cfs) Dec-11 Apr-13 Aug-14 Jan-16 May-17 Date of Measurement Chart 2. Monthly Mean Flow SRP Campbell Ranch Gage 3
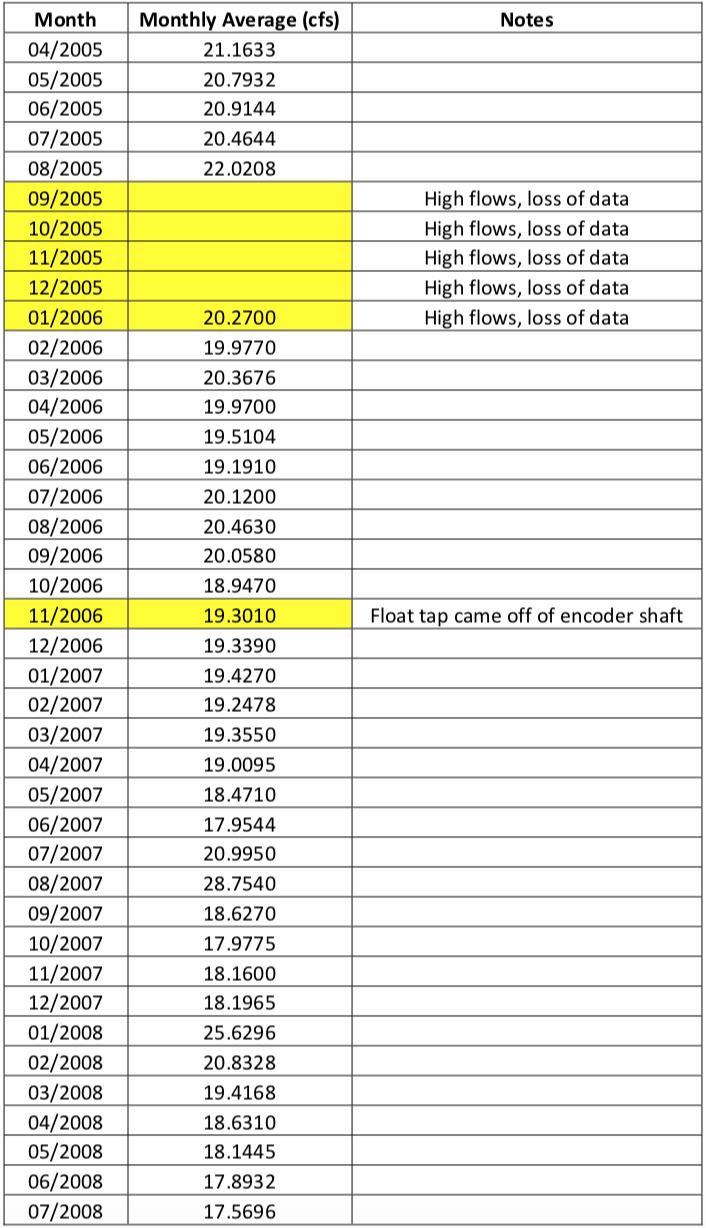
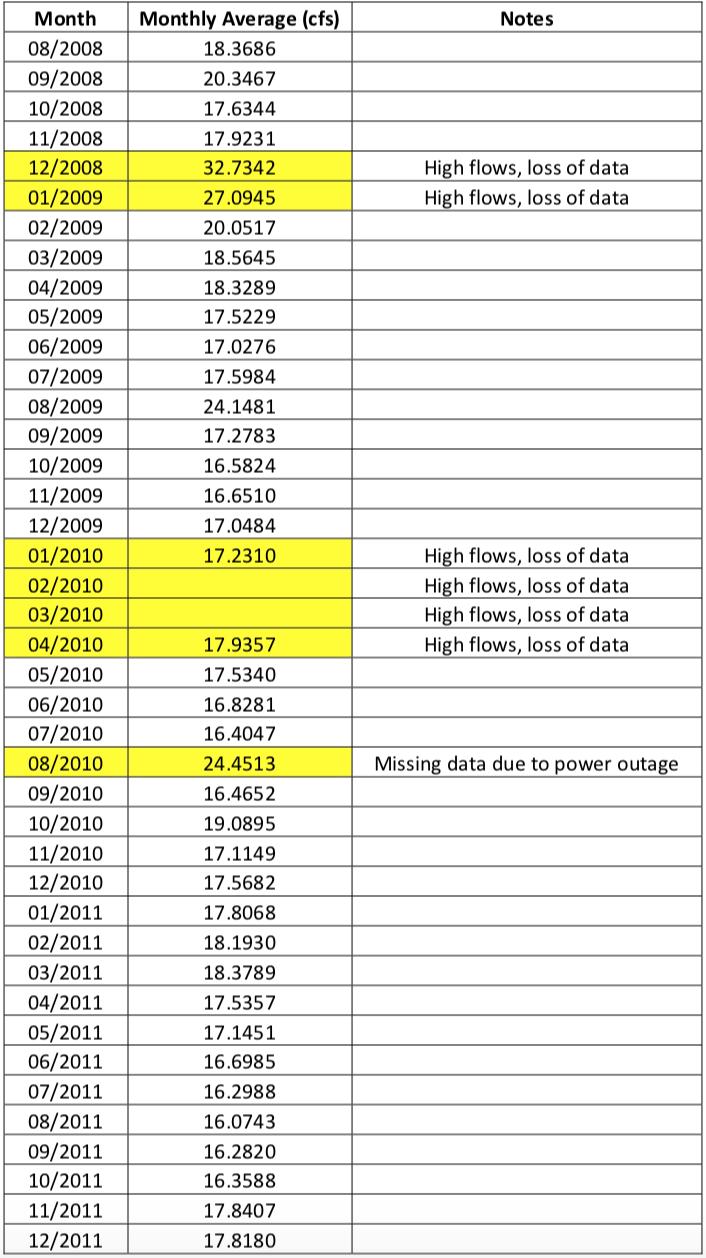
4 The main body of data from the time of the gage s installation in 2005 through 2017 demonstrates a well-defined decline in mean monthly flow through time, from approximately 21 cfs to 14 cfs. Data points that lie above the main trend represent runoff from both winter and summer storms Flow (cfs) Dec-04 Apr-06 Aug-07 Jan-09 May-10 Oct-11 Feb-13 Jul-14 Nov-15 Mar-17 Aug-18 Date of Measurement Chart 3. Monthly Mean Flow SRP Campbell Ranch Gage Although scattered outliers exist, they become scarcer in the data over time and represent seasonal changes in the river flow due to monsoon season, snowmelt runoff, and winter storms. A clear decline in flow over a 12-year period indicates that the groundwater discharges at Verde Springs are gradually decreasing. Comparison of the data from the SRP Campbell Ranch streamgage with the daily data for the same time period from the U.S. Geological Survey (USGS) Paulden streamgage demonstrates that the Verde River, from its headwaters through at least the first eight river miles to the Paulden gage, is a gaining reach. 4
5 USGS Stream Gage near Paulden Approximately six river miles below the Campbell Ranch gage and 10 miles below the Sullivan Dam lies the USGS Paulden gage ( ), which collects streamflow measurements every 15 minutes. The Water Sentinels obtained monthly mean flows from the USGS National Water Information System Web Interface to determine monthly average flows at the USGS Paulden gage between 2012 and Table 1. Monthly Means at Paulden Gage, cfs Jan Feb Mar Apr May Jun Jul Aug Sep Oct Nov Dec Green and yellow highlighted values together demonstrate cfs below 22. Yellow demonstrate cfs below 20. The Sierra Club (2013) report stated that between 1964 and 2003, monthly mean flows under 22 cfs occurred less than ten percent of the time. 2 From 2007 to 2012, monthly mean flows were less than 22 cfs thirty-seven percent of the time. 2 Just five years later, data indicate that seventy-eight percent of the time the river is flowing below 22 cfs. This five-year span demonstrates a more than 100 percent reduction of streamflows to less than 22 cfs and a shift in the majority from cfs in to cfs in Should this pattern continue, all monthly mean river flow would be reduced to below 22 cfs by However, this reduction may be slowed by winter precipitation, snowmelt, and monsoon activity. 1 Retrieved from National Water Information System web interface at: 0_5684=19813,00060,5684,1963,2018&start_dt=1990&end_dt=2017&year_type=W&format= html_table&date_format=yyyy-mm- DD&rdb_compression=file&submitted_form=parameter_selection_list 2 The Sierra Club. (2013). Going with the flow. Grand Canyon Chapter. Pawlowski, S. 5
6 Flow (Cfs) Chart 4. USGS Paulden Gage Annual Mean Flow Monthly mean discharge values of historic lows below 20 cfs were recorded a total of 10 times from the record. 3 Over the period, monthly mean flows drop to values less than 20 cfs 27 times for a combined total of 35 percent of all measurements at or below 20 cfs [See footnote for a list of dates]. 4 From , just 0.08 percent of all measurements made up this same percentage. 3 Averages remain higher in February and March as expected due to winter precipitation and snowmelt, though there are many instances where averages fall below the historic average flow of 25 cfs in these months. Nine out of twelve months experienced historic lows in 2015, indicating this may have been a particularly dry year. The pervasive nature of these lows may mark a shift from 20 cfs as a historic low to representative of a new normal. Year Baseflow (cfs) Dec-11 Apr-13 Aug-14 Jan-16 May-17 Date of Measurement Chart 5. Monthly Mean Flow USGS Paulden Gage The graphed values below represent the average of seven days or more of continuous lowest streamflow at the Paulden gage in each calendar year [See Appendix C]. This is used to estimate the rate of groundwater contribution to the stream in the summer months. Baseflow measurements in the winter are a bit higher, about a couple of cfs, because evapotranspiration is at a minimum in the winter. 3 The Sierra Club. (2013). Going with the flow. Grand Canyon Chapter. Pawlowski, S. 4 July 2012, April 2013-June 2013, May 2014, June 2014, October 2014, April 2015-December 2015, May 2016-July 2016, September 2016, June 2017-December
7 Baseflow (cfs) Year of Measurement Chart 6. USGS Paulden Gage Annual 7-Day or More Mean Low-flow Fifty-four full years, , of record at the Paulden streamgage show a substantial decline in monthly mean flows and annual discharge beginning in The average summer baseflow for the entire data set is 21 cfs. The average for is 19 cfs. From 2010 through 2017 the average is 18 cfs. These changes likely represent some combination of the effect of regional climate change and longterm groundwater pumping in the Big Chino and Williamson Valleys and in the Prescott Active Management Area (AMA). Baseflow (Cfs) Year 2014 Chart 7. USGS Paulden Gage Annual 7-Day or More Mean Low-flow These graphs exemplify an evident decline in baseflow. Most, if not all, monthly mean flows greater than 60 cfs represent Pacific Ocean storms that skew the average annual discharge. Discounting average annual discharge for all years that have one or more months greater than 60 cfs results in average annual discharge ranges from 25 to 30 cfs from 1964 through 1999 and from 20 to 24 cfs from 2000 through That is a significant change, and it correlates well with the current drought. This may or may not be a manifestation of long-term climate change, but it clearly represents a prolonged essentially two-decade drought that is ongoing. It may reflect as well, a gradual decrease owing to the long-term effect of groundwater pumping in both the Big Chino Valley and the Prescott Active Management Area. It appears that the Upper Verde near Paulden is indeed, going with the flow. 7

8 Water Sentinels Bear Siding Discharge Measurement Site Free-flowing and wild with little evidence of human impact is Bear Siding, located at river mile 19.4, approximately 9.4 miles downstream of the USGS Paulden gage. The Water Sentinels monitored flow here from February 2007 through October 2009, beginning again in February 2013 to collect more data on the losing reach of river between the USGS Paulden gage and Perkinsville. Figure 4. Verde River at Bear Siding in Winter. Photo Credit: Tom Slaback Monthly Measurements from remain relatively consistent with data. Monthly streamflow measurements appear relatively constant, with the majority of measurements ranging from cfs. This is a decrease in range from data where the majority of measurements were between 10 and 20 cfs. 5 Discharge ranged from a minimum of 11.5 cfs to a maximum of 70.2 in February The Sierra Club. (2013). Going with the flow. Grand Canyon Chapter. Pawlowski, S. 8
9 Table 2. Monthly Measurements at Bear Siding, cfs Jan Feb Mar Apr May Jun Jul Aug Sep Oct Nov Dec N/A Green highlighted values demonstrate cfs Yellow demonstrate cfs between Chart 8. Flow Rate Data Bear Siding Site It is interesting to note that the lower end of the majority has increased from 10 to 13 cfs while the upper range has decreased, demonstrating a shift toward a smaller range over time. Streamflow measurements at Bear Siding are much lower than those at the Paulden gage, indicating this site is on a losing stretch of river. This decrease in flow supports the idea that this losing reach of the Upper Verde between Paulden and Perkinsville is in danger of becoming intermittent. Evapotranspiration contributes to a small part of the downstream loss, but infiltration of streamflow to the groundwater is likely much more significant. Combined effects of climate change and continuing and increasing pumping of groundwater in the Prescott AMA and Big Chino Valley likely threaten the river from the headwater springs through Perkinsville. 9

10 Monthly Water Sentinels Perkinsville Discharge Measurement Site This flow measurement site is the most downstream measured by the Water Sentinels at river mile 24. Figure 5. Perkinsville Measurement Site. Photo Credit: Rachel Shultis Perkinsville monthly measurements demonstrate a trend of decreasing flow. More than 50 percent of all flow measurements fall between the range of 8-13 cfs, making this the majority for data. This is a decrease from the range of 9-15 cfs. 6 Table 3. Monthly Means at Perkinsville. Jan Feb Mar Apr May Jun Jul Aug Sep Oct Nov Dec Yellow highlighted values demonstrate cfs at or below 13. Green and yellow demonstrate cfs at or below 14. In 2007, the majority of monthly measurements ranged from Ten years later, data indicate a drastic reduction in the range, now between 8-14 cfs. However, although the range demonstrates a dramatic shift from , the majority of 8-13 cfs is not a substantial shift from the majority flow determined to be between 9-15 cfs. 6 This indicates a relative slowing of loss of flow as measurements move closer together, clustering at 10 cfs. Flow measurements for the months of 6 The Sierra Club. (2013). Going with the flow. Grand Canyon Chapter. Pawlowski, S. 10
11 May and June from range only from cfs, again supporting a continual shift toward smaller ranges as measurements near 0 cfs. Flow (cfs) Dec-11 Apr-13 Aug-14 Jan-16 May-17 Date of Measurement Chart 9. Flow Rate Data Perkinsville Site. The graph above indicates the range in flow measurements is slowly decreasing, moving closer to 10 as an average where measurements have less flexibility as the size of the range itself is decreasing. Drastic highs and lows are more sparing in the data; this trend of reduction in range of flow measurements or cfs clustering is also apparent in measurements taken at Campbell Ranch and Bear Siding. This identical trend in several sets of data demonstrates a streamflow that is steadily decreasing with smaller decreases over time as the majority of measurements move closer to 0. The 2013 report estimated that the river was losing about 1 cfs per year. 7 Measurements from demonstrate a slower rate of change; however, it is apparent that streamflow is decreasing at the Perkinsville gage. Where many monthly measurements were once in and around 20 cfs, data reflect a mild rate of change where measurements are becoming closer together and have reached 20 only once in September, which is historically a month of increased river flow due to monsoon activity. However, 2017 measurements feature a much greater range of data where streamflow reaches highs of approximately 60 cfs and drops to a new low of 7 cfs in September. This extreme variation may be due to increased precipitation in Flow (cfs) Dec-06 Apr-08 Aug-09 Jan-11 May-12 Oct-13 Feb-15 Jul-16 Nov-17 Date of Measurement Chart 10. Flow Rate Data Perkinsville Site. 7 The Sierra Club. (2013). Going with the flow. Grand Canyon Chapter. Pawlowski, S. 11
12 The 10-year graph above including mean streamflow from maintains a downward slope where flow continues to reach new historic lows. Where lows were once historic at 9 cfs, measurements of 8 and 9 have become increasingly commonplace and concern arises with a new low of 7 cfs. All of the lowest measurements were taken in the summer months. This is relevant because this is generally the time baseflow conditions arise, as streamflow is least influenced by precipitation. These low values provide critical information about the combined impact of drought and groundwater pumping on the river. Furthermore, these values indicate a rate of change of 2 cfs over five years, reinforcing the idea that the river is steadily decreasing, although the rate of decrease is becoming less severe as flow measurements move closer to 0. There is a losing reach of river between Perkinsville and the Paulden gage, located approximately 14 miles upstream. Loss is demonstrated by the difference in the majority of the flow measurements, as well as by the progressive decrease in minimum values from Paulden to Bear Siding to Perkinsville. Perkinsville flow measurements fall between 8 and 13 cfs, while in Paulden, the majority of flows range from 17 to 22 cfs, describing a loss of 9-15 cfs between locations as pictured below. Paulden lows reach 17 cfs and decline through the losing reach to 7 cfs in Perkinsville. As flow decreases at the Paulden Gage, repercussions in the form of decreased flow at Perkinsville are apparent. Flow (cfs) Paulden Gage Perkinsville Jan-12 May-12 Sep-12 Jan-13 May-13 Sep-13 Jan-14 May-14 Sep-14 Jan-15 May-15 Sep-15 Jan-16 May-16 Sep-16 Jan-17 May-17 Sep-17 Date of Measurement Chart 11. Paulden Average Monthly Flow and Perkinsville Monthly Flow. Another potential source of streamflow loss for the Upper Verde River comes from an irrigation ditch located an estimated one-third of a mile upstream from the Perkinsville measurement site. Water is diverted from the river into the irrigation ditch, which eventually joins with the Verde again below the Perkinsville measurement site. Flow measurements taken in the ditch give information about the streamflow that is added back to the river below the upper 26 miles of interest [See Appendix B]. However, it is not clear how much streamflow is diverted upstream. Measurements from the point of diversion into the ditch could be used to determine if this irrigation ditch is a significant factor in diminishing streamflow. With new historic lows being reached in Perkinsville, trends of clustered flow measurements and cfs ranges greatly decreased as they move closer to 0, and once historic lows becoming the new norm in Paulden, it is evident the Upper Verde is indeed going with the flow. The 2013 report predicted the Upper Verde had approximately 10 cfs in baseflow to lose before intermittency began in the summer. 12
13 Five years later, baseflow has decreased and the Upper Verde now has approximately 8 cfs of baseflow to lose before becoming intermittent in dry summer months. 13
14 Appendix A. SRP Campbell Ranch Lowflow Gage Data 14
15 15
16 16
17 Month Monthly Average Notes 1/ / / / / / / / / / / / / / / / / / / High flows, loss of data 8/ High flows, loss of data 9/ High flows, loss of data 10/ / / / / / / / / /
18 Month Monthly Average Notes 8/ High flows, loss of data 9/ / / / / / / High flows, loss of data 4/ / / / / / / / / / / / / / / / / / / / / / High flows, loss of data 2/ High flows, loss of data 3/ High flows, loss of data 18
19 Month Monthly Average Notes 4/ / / / / / / / / Notes on Appendix A: Monthly averages were not always possible to calculate due to flows exceeding 100 cfs or the streamgage being out of service. Yellow highlighted values signify averages calculated from an incomplete dataset, followed by an explanation of why data was missing in the adjacent column. Blank fields are included for information purposes and represent months without data. The reader is cautioned that the Water Sentinels calculations of monthly average values without data reflecting higher flows greater than 100 cfs in a month are biased. Data highlighted in yellow are qualified because the monthly average value is less than it otherwise would be if accurate higher flow data were included in the calculation of the monthly average. 19
20 Appendix B. Water Sentinels Discharge Measurements for All Sites 20
21 Date Flow (cfs) Above Verde Springs Bear Siding Perkinsville 1/22/ N/A /18/ N/A /28/ N/A /28/ N/A /26/ N/A 8.1 6/30/ N/A 8.1 7/28/ N/A /23/ N/A /15/ N/A /24/ N/A /18/ N/A /14/ N/A /20/ N/A /16/ /23/ /13/ /18/ /30/ /23/ /23/ /29/ /25/ /24/ /28/ /27/ /26/ /29/ /25/ /20/ /20/ /23/
22 Date Flow (cfs) Above Verde Springs Bear Siding Perkinsville 8/26/ /21/ /28/ /21/ /19/ /26/ /26/ /25/ /30/ /22/ /30/ /27/ /27/ /30/ /28/ /23/ /30/ /27/ /22/ /30/ /27/ /24/ /29/ /27/ /31/ /29/ /26/ /30/ /28/ /27/ /22/
23 Date Flow Above Verde Springs Bear Siding Perkinsville 3/29/ /26/ /24/ /28/ /26/ /30/ /27/ /26/ /29/ /27/ Date Perkinsville Ditch Flow (cfs) Measurements 1/22/12 <0.1 2/18/12 <0.1 3/28/ /28/ /26/ /30/ /28/ /23/ /15/ /18/ /30/ /23/ /23/ /29/ /25/ /30/ /22/ /30/ /27/ /27/ /30/ /28/ /30/ /27/
24 5/24/ /29/ /27/ /31/ /29/ /26/ /30/ /28/ /24/ /28/ /26/ /30/ /27/ /29/ /27/ Notes on Appendix B: Blank fields are included for information purposes and represent months without data due to either too high or too low flows to measure. Perkinsville ditch flow measurements demonstrate an approximation of how much water is being added to the Verde downstream where the ditch and river join together. 24
25 Appendix C. Annual Baseflow Values Calculated from 7 or More Low-flow Measurements 25
26 Year 7-Day or More Average Low-flow (cfs) Month(s) Recorded Jul, Aug; record begins July 17, in March, 15 in May, 19 in June, 22 in July, 20 in Nov in Oct, 20 in Sept and Oct Aug Jun and Oct Jul Jun, Jul, Sept, Oct Jan, Jul, Oct Jun, Jul, Sept in March, 20 in Jul Sep Feb, May, Jun, Jul, Oct Oct Jan-Feb, Jun, Jul, Sep Jul Sep-Oct Sep-Oct Sep-Oct Aug Sep Jan, Jun, Jul, Aug, Sep Sep Jun, Jul, Aug. Sep, Oct May, Jun, Jul Aug Jul Jul Jun Jul Jan,Nov May 26
27 Jun,Jul,Sep,Oct Jul, Aug,Sep Aug,Sep Jun,Jul Jun-Jul Jun-Jul Jun,Jul,Aug,Sep Jun-Jul Jun,Jul,Aug,Sep Jul,Aug Jul Oct Jun Jul Jun Jul,Aug Jul Aug,Sep Jun-Jul May, Jun Jun,Jul Average of all years Average of Average of
Don Pedro Project Project Operations/Water Balance Model Attachment B Model Description and User s Guide, Addendum 1 Base Case Description
 Don Pedro Project Project Operations/Water Balance Model Attachment B Model Description and User s Guide, Addendum 1 Base Case Description 5-2-213 1. INTRODUCTION The Turlock Irrigation District ( TID
Salinas Valley Water Project Annual Flow Monitoring Report
 Salinas Valley Water Project Annual Flow Monitoring Report Operational Season 2013 Monterey County Water Resources Agency 893 Blanco Circle Salinas, CA 93901 April 2014 Revised July 2014 TABLE OF CONTENTS
FIDS Symposium The River Bender
 FIDS Symposium 2014 The River Bender TransAlta Bow River Simulation Model Location 3 Cumulative Annual Volume - Bow River at Calgary Dry year = 1.5 M ac-ft Average = 2.34 M ac-ft 1941 2001 Horseshoe /
Missouri River Stage Trends Technical Report
 Missouri River Stage Trends Technical Report Fort Peck Garrison Oahe Big Bend Fort Randall Gavins Point Missouri River Basin Water Management Division Omaha, Nebraska September 2017 Paragraph MISSOURI
RA INTERIM FLOW PROGRAM RECOMMENDATIONS: Updated April 12, 2013
 RA INTERIM FLOW PROGRAM RECOMMENDATIONS: Updated April 12, 2013 Background On April 10 I received a new Allocation and Default Flow Schedule (Allocation) from Reclamation that was based on the April 1
NORTH FORK FEATHER RIVER, CA
 Hydropower Project License Summary NORTH FORK FEATHER RIVER, CA ROCK CREEK CRESTA HYDROELECTRIC PROJECT (P-1962) Kayakers below the Cresta Dam Photo: Hydropower Reform Coalition This summary was produced
FAQs about Provider Profiles on Breast Cancer Screenings (Mammography) Q: Who receives a profile on breast cancer screenings (mammograms)?
 Q: Who receives a profile on breast cancer screenings (mammograms)?") FAQs about Provider Profiles on Breast Cancer Screenings (Mammography) Q: Who receives a profile on breast cancer screenings (mammograms)? A: We send letters and/or profiles to PCPs with female members
FAQs about Provider Profiles on Breast Cancer Screenings (Mammography) Q: Who receives a profile on breast cancer screenings (mammograms)? A: We send letters and/or profiles to PCPs with female members
Crisis Connections Crisis Line Phone Worker Training (Online/Onsite) Winter 2019
 Winter 2019") Crisis Connections Crisis Line Phone Worker Training (Online/Onsite) Winter 2019 20-Jan 21-Jan 22-Jan 23-Jan 24-Jan 25-Jan 26-Jan between January 14th - January 21st Please Note: The application deadline
Crisis Connections Crisis Line Phone Worker Training (Online/Onsite) Winter 2019 20-Jan 21-Jan 22-Jan 23-Jan 24-Jan 25-Jan 26-Jan between January 14th - January 21st Please Note: The application deadline
If you have questions or need additional information, please contact us. Attachment: Prior Lake Outlet Annual Operations Report, Year 2008
 January 16, 2009 Ms. Janell Miersch, Area Hydrologist Metro Region of Waters Department of Natural Resources 1200 Warner Road St. Paul, Minnesota 55106 Prior Lake Outlet Annual Operations Report, Year
Real World Variables University Wind Studies Part 1. Randy Montgomery
 Real World Variables University Wind Studies Part 1 Randy Montgomery Research Purpose Current and proposed legislation is looking at all kinds of irrigation efficiency numbers EPA WaterSense Single Family
Extreme Climate Events and the Recurrent Sudden Dieback and Recovery of Salt Marshes in the Rapidly Subsiding Mississippi River Delta, Louisiana
 Extreme Climate Events and the Recurrent Sudden Dieback and Recovery of Salt Marshes in the Rapidly Subsiding Mississippi River Delta, Louisiana CHRISTOPHER M. SWARZENSKI UNITED STATES GEOLOGICAL SURVEY
18 Week 92% Open Pathway Recovery Plan and Backlog Clearance
 18 Week 92% Open Pathway Recovery Plan and Backlog Clearance Page 1 of 6 17.05.2012 1.0 Background 18-Week 92% Open Pathway RECOVERY PLAN The Trust has achieved compliance against the admitted and non-admitted
NILE RIVER WATER RESOURCES ANALYSIS
 Tenth International Water Technology Conference, IWTC1 26, Alexandria, Egypt 39 NILE RIVER WATER RESOURCES ANALYSIS Medhat Aziz 1 and Sherine Ismail 2 1 Deputy Director, Nile Research Institute (NRI),
Spatiotemporal Regime of Climate & Streamflow in the US Great Lakes Basin
 Spatiotemporal Regime of Climate & Streamflow in the US Great Lakes Basin Boris Shmagin & Carol Johnston, South Dakota State University, Nir Y. Krakauer, City College of New York Introduction http://precedings.nature.com/documents/7/version/
CONTROL CHART METHODOLOGY
 Center for Performance Sciences, 2001 CONTROL CHART METHODOLOGY Statistical Process Control (SPC) Analysis Statistical process control is a tool (e.g., control chart) used to help understand any process
Marijuana Possession Arrests Continue Under Mayor de Blasio
 Marijuana Arrest Research Project For Immediate Release Contact: Loren Siegel (917) 584 0869 May 9, 2014 Marijuana Possession Arrests Continue Under Mayor de Blasio and NYPD Police Commissioner Bratton
I. Project Title: Stationary PIT detection system in the Green River Canal, Green River, UT
 COLORADO RIVER RECOVERY PROGRAM FY 2016 ANNUAL PROJECT REPORT RECOVERY PROGRAM PROJECT NUMBER: C-28a I. Project Title: Stationary PIT detection system in the Green River Canal, Green River, UT II. III.
Welcome. Recreational Enhancements on the Lehigh River Public Information Workshop 31 January 2008
 Welcome Recreational Enhancements on the Lehigh River Public Information Workshop 31 January 2008 Cooperating Agencies US Army Corps of Engineers Philadelphia District Delaware River Basin Commission Pennsylvania
Cincinnati Children s Hospital Medical Center PHO/OVPCA Constipation Initiative Monthly Report February 2018
 Cincinnati Children s Hospital Medical Center PHO/OVPCA Constipation Initiative Monthly Report February 2018 Aim: Project focus to embed evidence based protocol for the treatment of Constipation in the
FGSZ Zrt. from 28 February 2019 till 29 February 2020 AUCTION CALENDAR: YEARLY YEARLY BUNDLED AT CROSS BORDER POINTS
 AUCTION CALENDAR: YEARLY YEARLY BUNDLED AT CROSS BORDER POINTS FIRM CAPACITY - First Monday of July 01.06.2019* 01.07.2019 07:00 01.10.2019 04:00 01.10.2020 04:00 2019/2020 01.10.2020 04:00 01.10.2021
Dissolved Oxygen Study Report
 Dissolved Oxygen Study Report Richland Creek McCabe Park Nashville, Tennessee WATER QUALITY MONITORING PROGRAM 2011 Prepared August 2012 by Monette Rebecca, Executive Director World Wildlife Fund and Tennessee
Flu Watch. MMWR Week 3: January 14 to January 20, and Deaths. Virologic Surveillance. Influenza-Like Illness Surveillance
 Flu Watch MMWR Week 3: January 14 to January 2, 218 All data are provisional and subject to change as more reports are received. Geographic Spread South Carolina reported widespread activity this week.
Flu Watch. MMWR Week 4: January 21 to January 27, and Deaths. Virologic Surveillance. Influenza-Like Illness Surveillance
 Flu Watch MMWR Week 4: January 21 to January 27, 218 All data are provisional and subject to change as more reports are received. Geographic Spread South Carolina reported widespread activity this week.
Annual Electric Balancing Authority Area and Planning Area Report
 Part I - Schedule 1. Identification and Certification Form Approved OMB Numbers: 1902-0140 (Expires 05/31/2016) 1. Respondent Identification: Code: Name: 3. Respondent Mailing Address: Chris Robinson P.O.
Wallowa Falls Habitat Modeling Results
 Wallowa Falls Habitat Modeling Results Preliminary Results for IFIM Stakeholder Meeting La Grande, OR April 25, 2013 1.0 INTRODUCTION This document provides the results of the instream flow incremental
Winter Holiday Suicide Myth Continues to be Reinforced in Press Annenberg Public Policy Center Study Finds
 FOR IMMEDIATE RELEASE DATE: 8 December 2010 CONTACT: Dan Romer, 215-898-6776 (office); 610-202-7315 (cell) Winter Holiday Suicide Myth Continues to be Reinforced in Press Annenberg Public Policy Center
Clarification of December 9, 2011 memo regarding Little Goose spill operations and adult Chinook conversion rates and travel times
 FISH PASSAGE CENTER 1827 NE 44 th Ave., Suite 240, Portland, OR 97213 Phone: (503) 230-4099 Fax: (503) 230-7559 http://www.fpc.org/ e-mail us at fpcstaff@fpc.org MEMORANDUM TO: Fish Passage Advisory Committee
Has the UK had a double epidemic?
 Has the UK had a double epidemic? Dr Rodney P Jones Healthcare Analysis & Forecasting www.hcaf.biz hcaf_rod@yahoo.co.uk Introduction Outbreaks of a new type of epidemic, possibly due to immune manipulation,
2006 RALSTON AFTERBAY WATER TEMPERATURE INVESTIGATION STUDY REPORT
 Placer County Water Agency Middle Fork American River Project (FERC Project No. 2079) 2006 RALSTON AFTERBAY WATER TEMPERATURE INVESTIGATION STUDY REPORT Placer County Water Agency 144 Ferguson Road Auburn,
GREENWOOD PUBLIC SCHOOL DISTRICT PHYSICAL EDUCATION
 Week 1 2 3 Days Comp/Obj. Aug. 07 11 Introduction Aug. 14 18 Aug. 21 2 C4a. 4 Aug. 29-Sept.1 Sept. -8 (Labor Day Sept.4) 4 6 Sept. 11-1 7 Sept. 18 22 8 Sept. 2 29 9 Oct. 2-6 with Hands FIRST NINE WEEKS
Seasonality of influenza activity in Hong Kong and its association with meteorological variations
 Seasonality of influenza activity in Hong Kong and its association with meteorological variations Prof. Paul Chan Department of Microbiology The Chinese University of Hong Kong Mr. HY Mok Senior Scientific
Complete Central Registry Treatment Information Requires Ongoing Reporting and Consolidation Well Beyond 6-Month Reporting
 Complete Central Registry Treatment Information Requires Ongoing Reporting and Consolidation Well Beyond 6-Month Reporting Eric B. Durbin, DrPH, MS, Director of Cancer Informatics Frances E. Ross, CTR,
CURRICULUM PACING CHART ACES Subject: Science-Second Grade
 SCIENCE EXPERIMENTS DONE DURING EACH UNIT COVER THE FOLLOWING SOL DURING EACH NINE WEEKS: SOL # Unit Bloom s Objective 2.1 Scientific Investigation, Reasoning, and Logic Synthesis The student will demonstrate
Trends and Variations in General Medical Services Indicators for Coronary Heart Disease: Analysis of QRESEARCH Data
 Trends and Variations in General Medical Services Indicators for Coronary Heart Disease: Analysis of QRESEARCH Data Authors: Professor Julia Hippisley-Cox Professor Mike Pringle Professor of Clinical Epidemiology
F-VC Stream Reach Summary
 F-VC Stream Reach Summary Study Reach: F-VC, Vasquez Creek - Denver Water Diversion downstream to confluence of Fraser River. Reach Description: Approximate channel length: 5 ½ miles with an average channel
Hydrologic Modeling Workshop. HEC-5 Modeling of ACF Interim Operation by Mobile District
 Hydrologic Modeling Workshop HEC-5 Modeling of ACF Interim Operation by Mobile District May 24, 2006 Model Settings Demands Hydropower Water Supply 2001 actual Required Flow Atlanta Columbus Jim Woodruff
HIV POSITIVE YOUTH: LINKAGE & RETENTION IN CARE
 HIV POSITIVE YOUTH: LINKAGE & RETENTION IN CARE Site C Youth clinic HIV care pathway DAY 1 Test HIV + PIMA point of care CD4 count in in 3-5 days initiation + in session 3 session 4 1 month Youth Club
Hand, Foot, and Mouth Disease Situation Update. Hand, Foot, and Mouth Disease surveillance summary
 Hand, Foot, and Mouth Disease Situation Update 24 February 215 Hand, Foot, and Mouth Disease surveillance summary This surveillance summary includes information from countries where transmission of Hand,
McLean ebasis plus TM
 McLean ebasis plus TM Sample Hospital (0000) Report For Qtr HBIPS Core Measures McLean Hospital 115 Mill Street Belmont, MA 02478 1 2012 Department of Mental Health Services Evaluation Tel: 617-855-3797
Rationale for Five Agency Proposed Alternative BDCP Initial Project Operations Criteria May 18, 2011 Working Draft
 Rationale for Five Agency Proposed Alternative BDCP Initial Project Operations Criteria May 18, 2011 Working Draft The following is a summary Rationale for Five Agency Alternative BDCP Initial Project
ADVANCES 2015 EDITORIAL INFORMATION EDITORIAL IN MIND-BODY MEDICINE
 MEDIA KIT 2015 EDITORIAL 2015 EDITORIAL INFORMATION With its focus on original research, ATHM offers a comprehensive evaluation of the efficacy of natural therapies and remedies for many common disorders
Road Salt Report 2010 Prepared by Rick Wenta and Kirsti Sorsa, Public Health Madison Dane County 31 January 2011
 Road Salt Report 2010 Prepared by Rick Wenta and Kirsti Sorsa, Public Health Madison Dane County 31 January 2011 Overview The City of Madison added road salt as sodium chloride to its winter road maintenance
PERTUSSIS REPORT. November 2013
 PERTUSSIS REPORT Data contained within this monthly report is based on information recorded on EpiSurv by public health service staff as at 12 December 213. Changes made to EpiSurv data after this date
Tri-County Opioid Safety Coalition Data Brief December 2017 Clackamas, Multnomah, and Washington Counties
 Medicaid-Funded Alternative Treatment for Back Pain in the Tri-County Region Key Findings The percentage of members with a back pain diagnosis who received an alternative treatment increased from 29% in
THE CITY OF BRYANT, ARKANSAS SAMPLING AND TESTING PLAN FOR SITE SPECIFIC TESTING FOR COPPER AND ZINC BRYANT WASTEWATER TREATMENT FACILITY
 THE CITY OF BRYANT, ARKANSAS SAMPLING AND TESTING PLAN FOR SITE SPECIFIC TESTING FOR COPPER AND ZINC BRYANT WASTEWATER TREATMENT FACILITY NPDES PERMIT NO. AR342 ORIGINAL SUBMISSION DATE: NOVEMBER 16, 215
EFFECTS OF LOW FLOW ON FOUNTAIN DARTER REPRODUCTIVE EFFORT
 EFFECTS OF LOW FLOW ON FOUNTAIN DARTER REPRODUCTIVE EFFORT EDWARDS AQUIFER HABITAT CONSERVATION PLAN (HCP) 014 APPLIED RESEARCH Harlan T. Nichols Masters Candidate Aquatic Resources Texas State University
The Infection Control Doctor and Clostridium difficile infection. Dr David R Jenkins University Hospitals of Leicester NHS Trust, England
 The Infection Control Doctor and Clostridium difficile infection Dr David R Jenkins University Hospitals of Leicester NHS Trust, England 250 200 150 100 50 0 Monthly cases of Clostridium difficile (UHL
CR5 Stream Reach Summary
 CR5 Stream Reach Summary Study Reach: CR5, Colorado River - Williams Fork confluence downstream to the KB Ditch. Reach Description: Approximate channel length: 6.75 miles, approximate channel slope 0.3%.
Lauren DiBiase, MS, CIC Associate Director Public Health Epidemiologist Hospital Epidemiology UNC Hospitals
 Lauren DiBiase, MS, CIC Associate Director Public Health Epidemiologist Hospital Epidemiology UNC Hospitals Statistics Numbers that describe the health of the population The science used to interpret these
Kansas EMS Naloxone (Narcan) Administration
 Administration") Kansas EMS Naloxone (Narcan) Administration Executive Summary Kansas Board of Emergency Medical Services August 217 The following pages denote an ongoing trending of naloxone administration by Kansas Emergency
Kansas EMS Naloxone (Narcan) Administration Executive Summary Kansas Board of Emergency Medical Services August 217 The following pages denote an ongoing trending of naloxone administration by Kansas Emergency
TALLAPOOSA RIVER FLOW ANALYSIS R L HARRIS DAM Downstream to WADLEY GAUGE GEO-TUBES EVALUATION
 TALLAPOOSA RIVER FLOW ANALYSIS R L HARRIS DAM Downstream to WADLEY GAUGE GEO-TUBES EVALUATION November 3, 003 Page of INTRODUCTION This report addresses hydraulic analysis of a fourteen mile section of
Telehealth Data for Syndromic Surveillance
 Telehealth Data for Syndromic Surveillance Karen Hay March 30, 2009 Ontario Ministry of Health and Long-Term Care Public Health Division, Infectious Diseases Branch Syndromic Surveillance Ontario (SSO)
Curators of the University of Missouri - Combined January 01, 2013 through December 31, 2013 Cost Management Report
 Cost Management Report Program Design Specifics Standard Claims Management SAVINGS CATEGORIES SAVINGS RESULTS % OF NET SUBMITTED DOLLARS % OF PAID DOLLARS Deductible Applied $1,296,627 5.68% 9.78% Patient
PERFORMANCE OF THOMAS FIERING MODEL FOR GENERATING SYNTHETIC STREAMFLOW OF JAKHAM RIVER
 Plant Archives Vol. 18 No. 1, 2018 pp. 325-330 ISSN 0972-5210 PERFORMANCE OF THOMAS FIERING MODEL FOR GENERATING SYNTHETIC STREAMFLOW OF JAKHAM RIVER Priyanka Sharma 1, S. R. Bhakar 2 and P. K. Singh 2
An Updated Approach to Colon Cancer Screening and Prevention
 An Updated Approach to Colon Cancer Screening and Prevention Kevin Liebovich, MD Director for Quality for Gastrointestinal diseases Advocate Condell Medical Center Colon Cancer Screening and Prevention
Sleep Market Panel. Results for June 2015
 Sleep Market Panel Results for June 2015 Notes: o This is a monthly trending report of panel member data along with additional analysis by: Sleep labs affiliated with Hospitals vs. Independent Labs o Hospital
FORECASTING THE DEMAND OF INFLUENZA VACCINES AND SOLVING TRANSPORTATION PROBLEM USING LINEAR PROGRAMMING
 National Cheng Kung University Institute of International Management Business Decision Methods FORECASTING THE DEMAND OF INFLUENZA VACCINES AND SOLVING TRANSPORTATION PROBLEM USING LINEAR PROGRAMMING HOLLY
WALLENPAUPACK. Lake Wallenpaupack Operations during the April 2005 Flood
 LAKE WALLENPAUPACK Lake Wallepaupack Operatios durig the April 2005 Flood Lake Performace Summary March-April Storm Evet LAKE WALLENPAUPACK Over 14 BG of water stored betwee March 28 ad April 3 icludig
Overview of the Radiation Exposure Doses of the Workers at Fukushima Daiichi Nuclear Power Station
 Click here for the corrections made < Reference > December 3, 212 Tokyo Electric Power Company Overview of the Radiation Exposure Doses of the Workers at Fukushima Daiichi Nuclear Power Station * As of
Status of the Major Oyster Diseases in Virginia 2002
 Status of the Major Oyster Diseases in Virginia 22 A Summary of the Annual Monitoring Program Lisa M. Ragone Calvo and Eugene M. Burreson Virginia Institute of Marine Science The College of William and
Understanding Phosphorus Dynamics and Controls to Better Manage the Turbid Minnesota River System
 Understanding Phosphorus Dynamics and Controls to Better Manage the Turbid Minnesota River System William F. James US Army Corps of Engineers Engineer Research and Development Center Eau Galle Aquatic
Magellan s Transport Route Lead Monitoring Program
 Magellan s Transport Route Lead Monitoring Program Magellan s lead monitoring requirements Magellan s approval to export sealed shipments of lead carbonate through Fremantle is subject to the Interim Implementation
RTKC- East Abutment Extension Individual Permit Application November 15, Figure 1. East Abutment Extension General Vicinity Map
 RTKC- East Abutment Extension November 15, 2016 2.1. Figure 1. East Abutment Extension General Vicinity Map WP NATURAL RESOURCE CONSULTING, INC. 4 RTKC- East Abutment Extension November 15, 2016 2.2. Figure
APPENDIX ONE. 1 st Appointment (Non-admitted) recovery trajectories
 recovery trajectories") APPENDIX ONE 1 st Appointment (Non-admitted) recovery trajectories The following trajectories show reductions in total waiting list sizes for first appointments. It is difficult for any organisation to
APPENDIX ONE 1 st Appointment (Non-admitted) recovery trajectories The following trajectories show reductions in total waiting list sizes for first appointments. It is difficult for any organisation to
Coccidioidomycosis, aka Valley Fever
 Coccidioidomycosis, aka Valley Fever Presented to the California Partnership for the San Joaquin Valley June 15, 2018 Karen Haught, MD, MPH Public Health Officer Tulare County Public Health Coccidioidomycosis
CryoSat-2 SARin mode over great rivers
 CryoSat-2 SARin mode over great rivers CryoSat Third Users Workshop, 12-14 March 2013, Dresden, Germany S. Calmant (1), N. Bercher (1), S. Fleury (1), S. Dinardo (2), B. Lucas (2), P. Femenias (2), F.
Dementia Content Report January Produced By The NHS Choices Reporting Team
 Dementia Content Report January 2014 Produced By The NHS Choices Reporting Team CH.NHSChoices-Reporting@nhs.net Dementia Dashboard Page 1 Overall Choices Site Visits Tag cloud showing top dental related
Durham Region Influenza Bulletin: 2017/18 Influenza Season
 Durham Region Influenza Bulletin: 2017/18 Influenza Season Surveillance Week 21 (May 20, 2018 to May 26, 2018) Table 1: Assessment of influenza activity in Durham Region Measure Laboratory confirmed cases
Jim Woodruff Dam Section 7 Consultation. Hydrological Modeling Technical Workshop II 12 July 2006
 Jim Woodruff Dam Section 7 Consultation Hydrological Modeling Technical Workshop II 12 July 2006 Endangered Species Act of 1973 Section 7 Consultation All Federal agencies shall, in consultation with and
Nutrient Management in Subtropical Tree Crops. The avocado model
 Nutrient Management in Subtropical Tree Crops The avocado model Avocado Fertilization Tissue %Dry Wt New shoots 36 Leaves 40 Fruit 33 Small branches 38 < 1 in Small branches 55 1-2 in Scion trunk 48 Rootstock
Avian influenza in poultry, wild and captive birds (AI)
") Avian influenza in poultry, wild and captive birds (AI) Analysis of ADNS data since 01/2018 Reporting period: 2018-01-01 2018-10-28 Data query: 2018-10-30 AGES DSR Austrian Agency for Health and Food Safety
Avian influenza in poultry, wild and captive birds (AI) Analysis of ADNS data since 01/2018 Reporting period: 2018-01-01 2018-10-28 Data query: 2018-10-30 AGES DSR Austrian Agency for Health and Food Safety
FORECASTING DEMAND OF INFLUENZA VACCINES AND TRANSPORTATION ANALYSIS.
 FORECASTING DEMAND OF INFLUENZA VACCINES AND TRANSPORTATION ANALYSIS. GROUP MEMBER 1. HOLLY / NGHIEM NGUYET HUU RA6057117 2. YOSUA TJOKRO HINDRO / RA6057060 3. ADAM HUNG 洪一智 4. STAN LU 陸潤龍 RA7041193 CONTENTS
Travel Time Reliability Summary
 7 Travel Time Reliability Summary RETHINKING I-94 APPENDIX T7 TRAVEL TIME RELIABILITY SUMMARY Background Since 2016, MnDOT has been working with neighborhoods, community groups, district councils, local
Charitable Gambling Impact Study
 Charitable Gambling Impact Study A brief review of the fiscal impact of a statewide smoking ban on lawful gambling Presented by the Gambling Control Board (in cooperation with the Commissioner of Revenue)
Update on Pandemic H1N1 2009: Oman
 Update on Pandemic H1N1 29: Oman Dr Idris Al-Abaidani, MoH Websites: who.int, ecdc.europa.eu, cdc.gov, moh.gov.om 212 countries reported cases and 15921 deaths Seasonal Flu & H1N1 29 Flu *The reported
Dementia Content Report May Produced By The NHS Choices Reporting Team
 Dementia Content Report May 2013 Produced By The NHS Choices Reporting Team CH.NHSChoices-Reporting@nhs.net 35.0M 30.0M 25.0M 20.0M 15.0M 10.0M 5.0M 0.0 15.9M Overall Choices Site Visits NHS Choices Policy
Empowering Weight Loss Charts & Logs Healthy Weight Chart Cholesterol Chart Blood Pressure Chart Exercise Calorie Burning Chart
 Empowering Weight Loss Charts & Logs Healthy Weight Chart Cholesterol Chart Blood Pressure Chart Exercise Calorie Burning Chart Weight and Health Assessment Log Weight and Fat % Log Calorie Log Exercise
Trends and Variations in General Medical Services Indicators For Hypertension: Analysis of QRESEARCH Data
 Trends and Variations in General Medical Services Indicators For Hypertension: Analysis of QRESEARCH Data Authors: Professor Julia Hippisley-Cox Professor Mike Pringle Gavin Langford Professor of Clinical
8.0 Take Home Naloxone
 8.0 Take Home Naloxone 8.1 Population characteristics For the financial year (FY) 2016/17, 721 take home naloxone (THN) kits were issued in the City of Edinburgh. Of the 323 individuals who received naloxone
Supplementary Online Content
 Supplementary Online Content Kiaii M, Djurdjev O, Farah M, Levin A, Jung B, MacRae J. Use of electron-beam sterilized hemodialysis membranes and risk of thrombocytopenia. JAMA. 211;36(15):1679-1687. etable
INFLUENZA Surveillance Report Influenza Season
 Health and Wellness INFLUENZA Surveillance Report 2011 2012 Influenza Season Population Health Assessment and Surveillance Table of Contents Introduction... 3 Methods... 3 Influenza Cases and Outbreaks...
South Wales Street Based Lifestyle Monitor
 South Wales Street Based Lifestyle Monitor 16-17 An analysis of people living street based lifestyles in Cardiff, Newport, Swansea and Bridgend between November 16 and October 17 % Registered Charity No:
5. BIOCHEMICAL COMPOSITION AND FOOD VALUE OF RIBBON FISH L. SAVALA
 5. BIOCHEMICAL COMPOSITION AND FOOD VALUE OF RIBBON FISH L. SAVALA During present study, sixty specimens of fresh L. savala ranging from 200 to 600 mm of total length were collected from Baithkol, Majali
Drought Irrigation Strategies For Pistachio. David A. Goldhamer Robert H. Beede
 Drought Irrigation Strategies For Pistachio David A. Goldhamer Robert H. Beede Tree Response To Water Stress Sustained Deficit Irrigation; Mid 1980s Regulated Deficit Irrigation; 1990s-Current Optimal
June 28, 2008 General Assembly, Fort Lauderdale Presented by Linda Laskowski Unitarian Universalist Church of Berkeley
 Congregations Count! June 28, 2008 General Assembly, Fort Lauderdale Presented by Linda Laskowski Unitarian Universalist Church of Berkeley or How a UU Membership Chair Stopped Trying to Doing Everything
IMPLEMENTING RECOVERY ORIENTED CLINICAL SERVICES IN OPIOID TREATMENT PROGRAMS PILOT UPDATE. A Clinical Quality Improvement Program
 IMPLEMENTING RECOVERY ORIENTED CLINICAL SERVICES IN OPIOID TREATMENT PROGRAMS PILOT UPDATE A Clinical Quality Improvement Program Today: National completion rates for OTP s hover between 11 14% Retention
TB Outbreak in a Homeless Shelter
 TB Outbreak in a Homeless Shelter Objectives Epidemiology of Outbreak Population Health Interventions Population Health Goals 2007 One active case identified Less than compliant Prolonged recovery Contact
Towards impact based monitoring of Estrogenic Endocrine Disrupting Chemicals (eedc).
.") Towards impact based monitoring of Estrogenic Endocrine Disrupting Chemicals (eedc). eedc sources and behaviour in the Zenne river, Brussels Supervisors: Prof M. Elskens Prof S.J. Eisenreich Dr. N. Brion
Towards impact based monitoring of Estrogenic Endocrine Disrupting Chemicals (eedc). eedc sources and behaviour in the Zenne river, Brussels Supervisors: Prof M. Elskens Prof S.J. Eisenreich Dr. N. Brion
CAPL 2 Questionnaire
 CAPL 2 Questionnaire What Do You Think About Physical Activity? When we ask you about physical activity, we mean when you are moving around, playing, or exercising. Physical activity is any activity that
Swine Flu Pandemic Weekly Report Thursday 20 August 2009
 Key points Swine Flu Pandemic Weekly Report Thursday 20 August 2009 Levels of flu in Wales have decreased in the week ending 16 August. Current levels of flu in Wales are still higher than usual for this
March 2012: Next Review September 2012
 9.13 Falls Falls, falls related injuries and fear of falling are crucial public health issues for older people. Falls are the most common cause of accidental injury in older people and the most common
Status of the Major Oyster Diseases in Virginia
 Status of the Major Oyster Diseases in Virginia 2006-2008 A Summary of the Annual Oyster Disease Monitoring Program Ryan B. Carnegie and Eugene M. Burreson Virginia Institute of Marine Science The College
Cognitive Risk in High School. Football: A Pilot Study. By: Bernadette Darcy
 Cognitive Risk in High School Football: A Pilot Study By: Bernadette Darcy 2 Abstract: To assess the cognitive risk football poses for high school players, a study was conducted which tested change in
Symptom Control During Chemotherapy (SCDC) MN Community Measurement
 MN Community Measurement") Symptom Control During Chemotherapy (SCDC) MN Community Measurement MN Community Measurement Nonprofit health care quality improvement and reporting organization Specialize in developing, collecting, analyzing
Symptom Control During Chemotherapy (SCDC) MN Community Measurement MN Community Measurement Nonprofit health care quality improvement and reporting organization Specialize in developing, collecting, analyzing
SUICIDE IN SAN DIEGO COUNTY:
 SUICIDE IN SAN DIEGO COUNTY: 1998-2007 www.sdchip.org Contents www.sdchip.org SUICIDE IN SAN DIEGO COUNTY: 1998-2007 CHIP's Message Dear Reader, Community Health Improvement Partners (CHIP) is pleased
Management of Mining- Impacted Groundwater, Bingham Canyon Mine, Utah, USA
 Management of Mining- Impacted Groundwater, Bingham Canyon Mine, Utah, USA Kelly Payne Principal Advisor, Closure & Remediation Kennecott Utah Copper LLC This Morning s Discussion Nature of Problem Regulatory
Alberta Health. Seasonal Influenza in Alberta Season. Analytics and Performance Reporting Branch
 Alberta Health Seasonal Influenza in Alberta 2015-2016 Season Analytics and Performance Reporting Branch August 2016 For more information contact: Analytics and Performance Reporting Branch Health Standards,
SHORT TERM HEALTH IMPACTS OF HIGH PM EPISODES ON THE BISHOP PAIUTE RESERVATION
 BISHOP PAIUTE TRIBE ENVIRONMENTAL MANAGEMENT OFFICE AIR PROGRAM SHORT TERM HEALTH IMPACTS OF HIGH PM EPISODES ON THE BISHOP PAIUTE RESERVATION Prepared for The Bishop Tribal Council 50 Tu Su Lane Bishop,
Curators of the University of Missouri - Combined January 1, 2016 through December 31, 2016
 Cost Management Report Delta Dental Network Coverage Network Utilization Discount Delta Dental PPO Network 28.3% 29.4% Delta Dental Premier Network 67.0% 12.0% Total 95.3% Savings Categories $ % of Net