Health Care in Appalachia. Foundations of Modern Health Care, Lecture 12 Anya K. Cope, DO
|
|
|
- Douglas Pitts
- 5 years ago
- Views:
Transcription

1 Health Care in Appalachia Foundations of Modern Health Care, Lecture 12 Anya K. Cope, DO
2 Learning Objectives: At the completion of this exercise, learners should be able to: Discuss the mortality rates of heart disease, cancer, and chronic obstructive pulmonary disease (COPD) in the Appalachian Region vs. the United States. Discuss how Appalachian mental health status compares to the United States. Discuss how poverty levels and the economy in Appalachia can impact access to health care services.
3

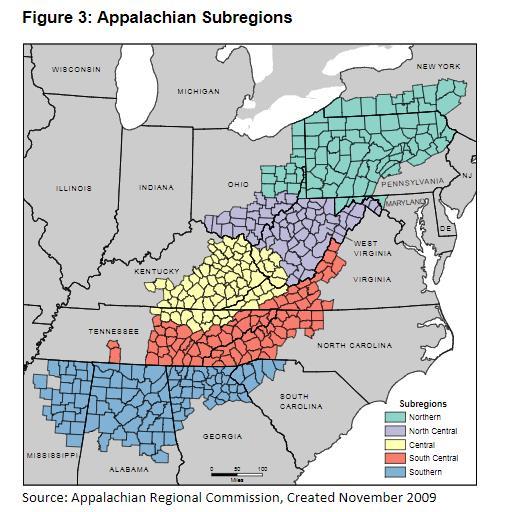
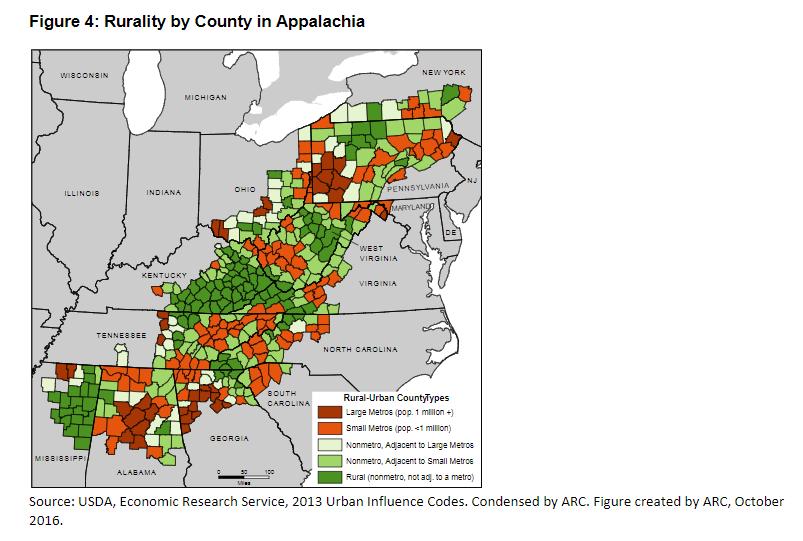
4 Where is the Appalachian Region?
5
6

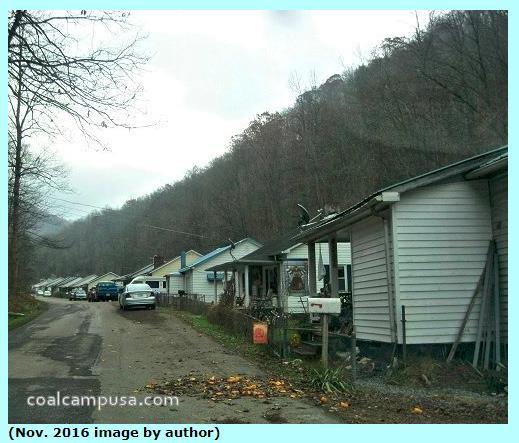
7 Economy Distressed: the most economically depressed counties. Rank in the worst 10% of the nations counties. At-Risk: those at risk of becoming economically distressed. Rank in the worst 10-25%. Transitional: transitioning between strong and weak economies. Competitive: those that are able to compete in the national economy but are not in the highest 10% of the nation s counties. Attainment: Economically strongest counties. Counties ranking in the best 10% of the nation s counties.
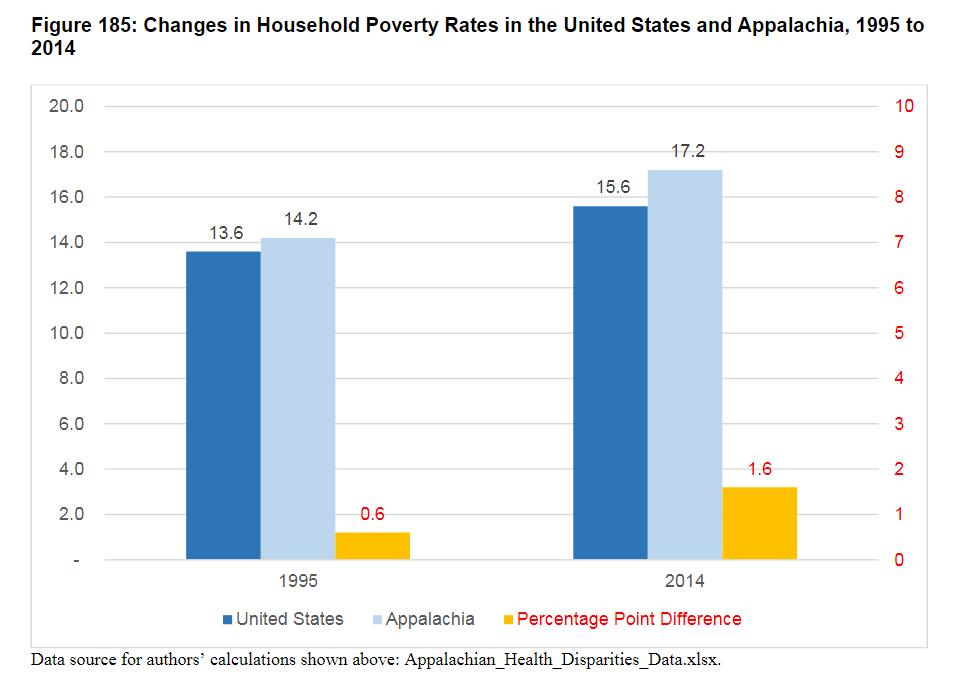
8 Poverty in the Region: Poverty rate 1960: 31% : 17.2% High-poverty counties poverty rate is 1.5 times the US average: 1960: : 91
9
10
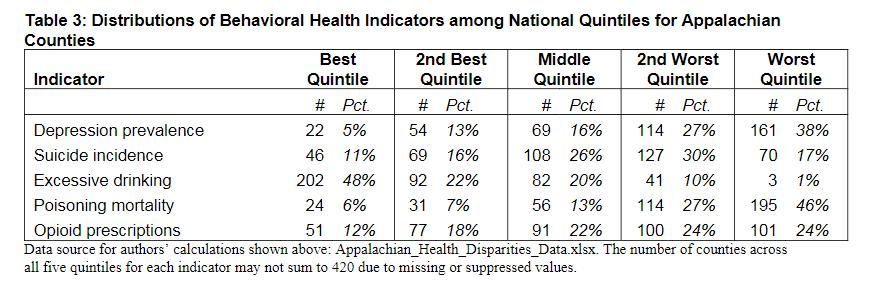
11 Measurable Outcomes: Current Health Status Determined By: Mortality Morbidity Behavioral Health Generational Health and Health Care Determined By: Child Health Health Care Systems Quality of Care
12 Risk Factors and Health Determinants: Lifestyle Community Characteristics Social Determinants
13 Appalachian Region Performs Better: HIV Prevalence Travel Time to Work Excessive Drinking Student-Teacher Ratio Chlamydia Prevalence Percentage of the Population Under age 65 Uninsured Diabetes Monitoring Among Medicare Patients
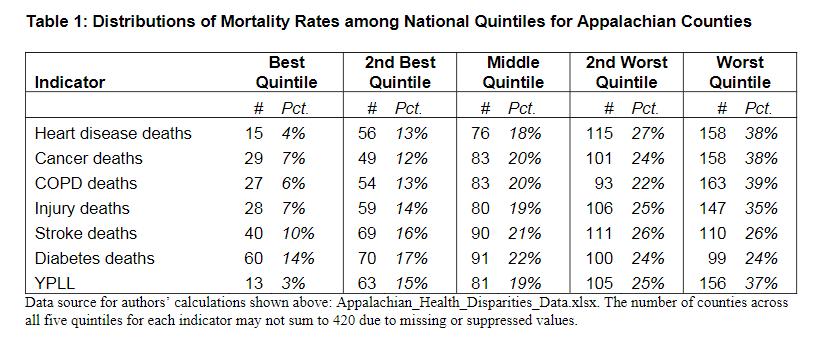
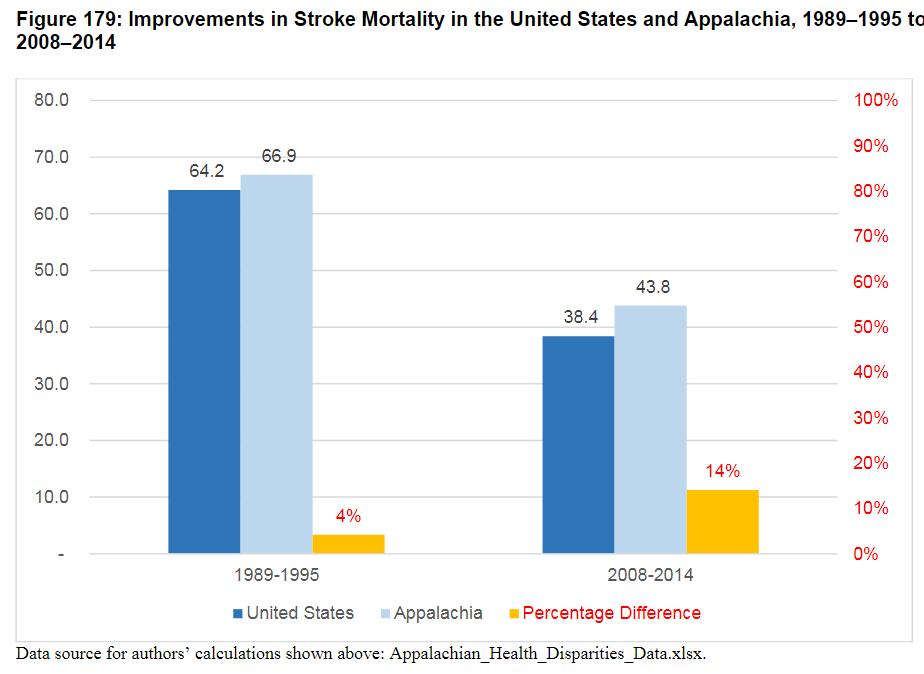
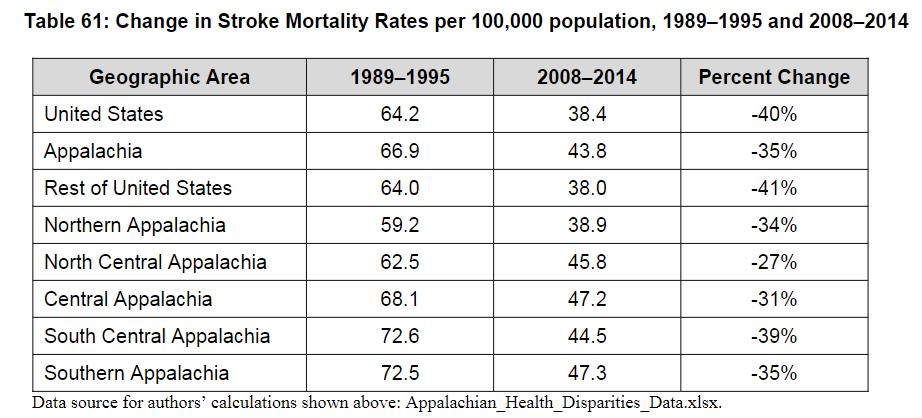
14 Appalachia s Poor Mortality Performance: Causes of Mortality Heart Disease (17% higher than national average in Region, 27% higher in rural) Cancer (10% higher in Region, 15% higher in rural) Chronic Obstructive Pulmonary Disease (27% higher in Region, 55% higher in rural) Injury (33% higher in Region, 47% higher in rural) Stroke (14% higher in Region, 8% higher in rural) Diabetes (11% higher in Region, 36% higher in rural) Suicide (17% higher in Region, 21% higher in rural) Poisoning (drug overdoses included) (37% higher in Region, 40% higher in rural) Years of Potential Life Lost (25% higher in Region, 40% higher in rural)
15
16 Heart Disease Mortality Rates ( ) Defined as: number of deaths from all forms of heart disease per 100,000 population, per year. Leading cause of death of adults in US Risk Factors for Heart Disease: Physical Inactivity Smoking Diabetes Obesity Incidence is 17% higher than national average in Region, 27% higher in rural.
17
18
19 Cancer Mortality Rates: Defined as: number of deaths with malignant neoplasm (cancer) as the underlying cause per 100,000 population, per year. Risk of Cancer Can be Decreased By: Avoiding smoke exposure Protecting skin Limiting Alcohol use Healthy body weight Cancer mortality rate is 10% higher in Region, 15% higher in rural.
20
21
22 Chronic Obstructive Pulmonary Disease (COPD) Mortality Rates Defined as: number of deaths with COPD as the primary cause, per 100,000 population, per year. Data includes chronic bronchitis and emphysema. 3 rd leading cause of death in the US. Risk Factors: Smoking Air Quality Genetic Factors Respiratory Infections Cumulative Lifetime Exposure to Coal Mine Dust COPD incidence is 27% higher in Region, 55% higher in rural 86% higher in Central Appalachia compared to US.

23
24
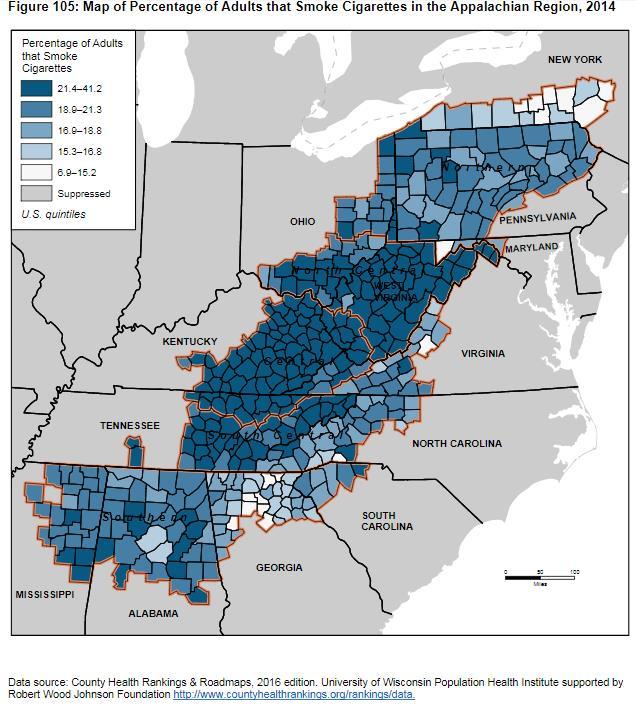
25 Adult Smoking Prevalence Defined as: percentage of adults age 18 and over that report that they currently smoke cigarettes. Smokers: 16.3% in US total 20% in Appalachian Region 25.2% in Central Appalachia Smoking is a Risk Factor For: COPD Heart Disease Cancer Stroke Smoking Also Impacts: Pregnancy and Infant Health Bone Health Oral Health
26
27
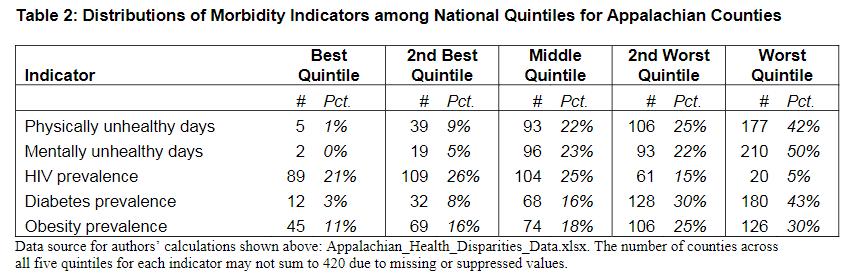
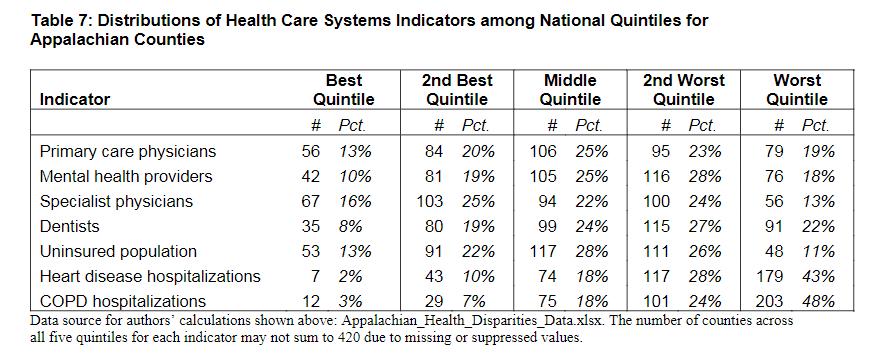
28 Other Poor Performers of the Region: Number of Physically Unhealthy Days (14% higher in Region, 24% in rural) Mentally Unhealthy Days (14% higher in Region) Prevalence of Depression Adult Obesity (3.6 % higher in Region) Physical Inactivity (28.4% in Region vs. 23.1% in US) Lower Supplies of Healthcare Providers in Region vs. US: Primary Care Physicians Mental Health Providers Specialty Physicians Dentists
29
30
31 Mentally Unhealthy Days Defined as: number of days per month the average adult aged 18 and older reports feeling mentally unhealthy or of poor mental health. Examples of Conditions: Grief Temporary anxiety Temporary stress Depression Appalachian residents report 0.5 more mentally unhealthy days per month Areas with Increased Mentally Unhealthy Days Also Have: Higher Unemployment Higher Poverty Higher Disability Higher Mortality Rates Lower High School Completion Rates
32
33
34 Depression Prevalence: National Institute of Mental Health: Depression is a common but serious mood disorder that causes severe symptoms that affect how one feels, thinks, and handles daily activities, such as eating, working or sleeping (NIMH, 2016). Symptoms must be present x 2 weeks. Many adults do not seek help for depression and the subsequent symptoms. Depression is Associated With: Significant Health Care Needs Loss of Work Premature Mortality Rates in the Appalachian Region are 16.7% vs 15.4% in US Rural occurrence: 16.9% Metro occurrence: 15.6%
35 Depression Continued: Risk Factors Include: Personal History Family History Trauma Stress Major Life Changes
36
37
38 Suicide Rates Defined as: the number of suicides per 100,000 population, per year. Rate in Region is 17% higher than US (14.5 vs. 12.4) 21% higher in rural compared to metro areas in the Region (15.9 vs. 13.1) What Factors Help Those with Suicidal Thought? Appropriate care for mental health in the area Access to interventions Family and community support Skills in problem solving and conflict resolution
39
40

41
42 Opioid Prescription Claims Defined as: percentage of all prescriptions filled by fee-for-service Medicare beneficiaries (12 percent of the total population in the nation) in 2013 that were for an opioid. 6% of all Medicare prescription claims in Appalachian Region are for opioids vs. 5.3% of entire US. More than 2 million people have opioid abuse disorders Higher Risk for Abuse: Mental illness History of alcohol or other substance abuse Residing in rural areas Low income Overlapping Rx from multiple providers High daily dosages of prescription 52 people die every day from opioids
43
44
45 Poisoning Deaths Defined as: number of deaths with poisoning as the primary cause per 100,000 population, per year. Includes deaths from medications (prescribed and illicit) More likely to occur in: Male Non-Hispanic white Ages Poisoning in Appalachian Region: 37% higher rates than US total Central Appalachia has 146% higher rate than US as a whole. Distressed counties have 63% higher rate than non-distressed counties.
46
47
48 Child Health in Appalachia Infant Mortality (16% higher in Region) Low Birth Weight (8.7% in Region vs. 8.1% in US) Teen Births 10% higher in Region, 72% higher in rural areas Children of Teenage Mothers More Likely To: Have lower school achievement Drop out of high school Have more health problems Be incarcerated during adolescence Give birth as a teenager Face unemployment
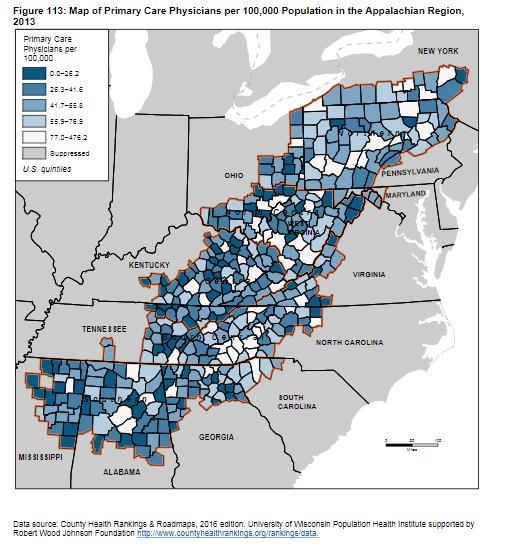
49 Health Care Systems Supply of Primary Care Physicians 12% lower in the Appalachian Region 33% lower in Central Appalachia, 21% lower in Southern Appalachia Mental Health Providers 35% lower in Appalachian Region 50% lower in North Central Appalachia and Southern Appalachia Specialty Physicians 28% lower in Appalachian Region 57% lower in rural areas Dentists 26% lower in Appalachian Region 36% lower in rural areas (46% in Central Appalachia)
50
51
52 Hospitalizations Admission for COPD 23% higher in Appalachian Region 39% higher in rural areas vs metro Admission for Heart Disease 17% higher in Appalachian Region 13% higher in rural areas vs metro Rates of Uninsured: 14.7% in metro areas 18.2 % in rural areas
53
54
 who recently received mammogram Diabetes monitoring (Medicare")
55 Quality of Care Similar in Appalachian Region compared to US Percentage of medical doctors using electronic prescribing Percentage of Medicare beneficiaries (67-69 years old) who recently received mammogram Diabetes monitoring (Medicare beneficiaries)
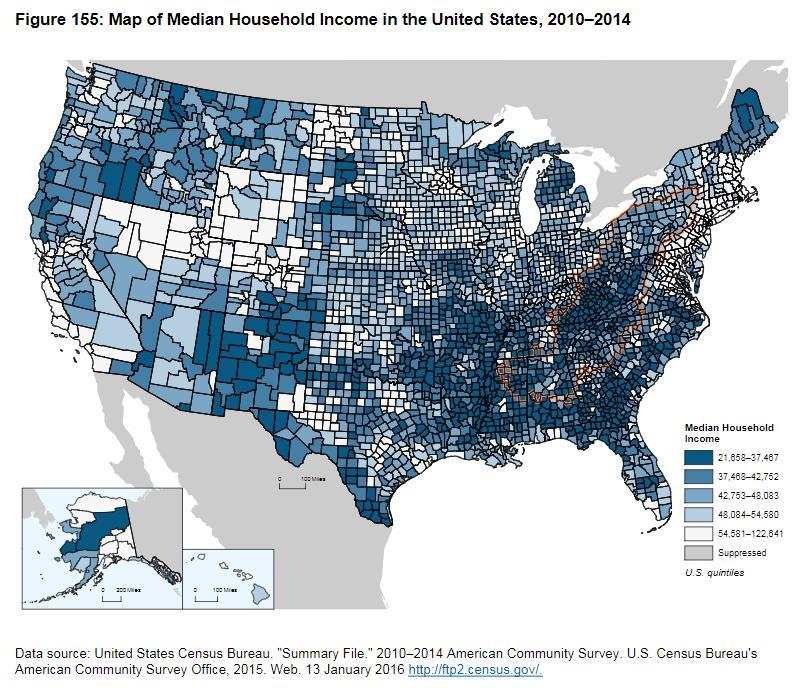
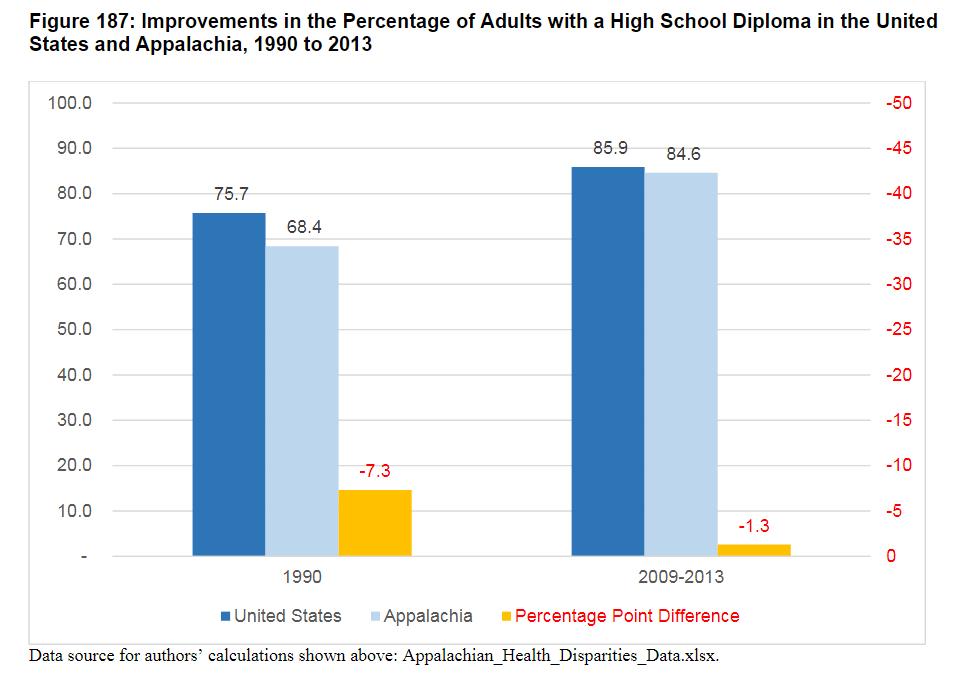
56 Social Determinants Median Household Income Defined as: value at which half of the households in an area earn more and half earn less. 19% lower in Region (Central Appalachia 38% less than national) $45,585 vs. $56,135 34% lower in rural compared to metro areas $34,628 vs. $54,743 Household Poverty Rate 23% in rural Appalachia 13.6% in metro Appalachia 15.6% in the US Percentage of the Population Receiving Disability Benefits 11.2% in rural Appalachia 5.5% in metro Appalachia 5.1% in US Percentage of the Population with Some Level of College Education 49% in rural Appalachia 65.1 % in metro Appalachia 63.3% in the US
57
58
59 Has This Changed With Time?
60
61
62
63

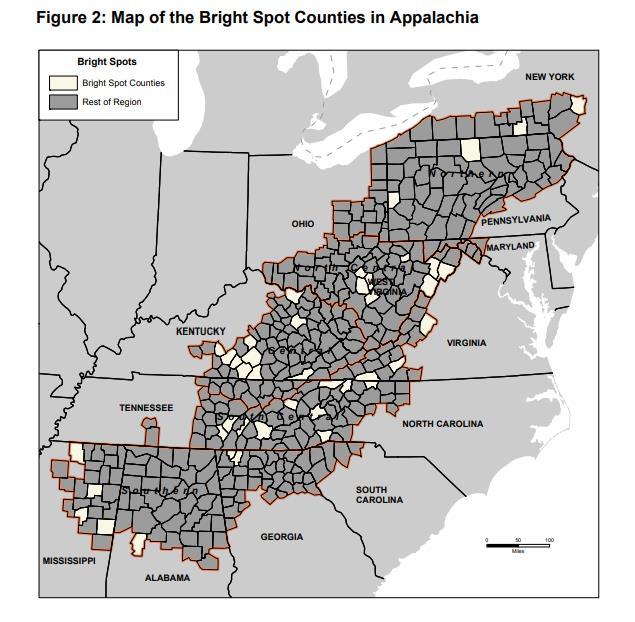
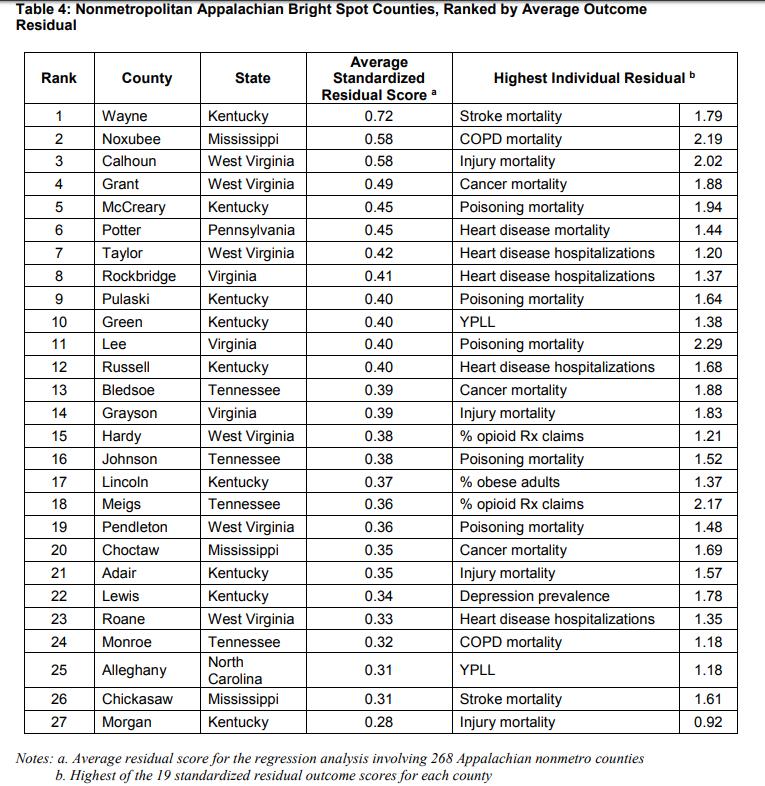
64 There are Bright Spots Bright Spot county defined: A county whose average of all 19 standardized outcome residuals scored in the top decile.
65
66
67 Where Should We Focus Efforts For Improvements? Median income ARC Economic Index value Poverty rate Percentage of adults that smoke Percentage of adults that are physically inactive Percentage of the population receiving disability payments Teen birth rates
68 Resources: Health Disparities in Appalachia. PDA, Inc. (2017, August). Retrieved September, 7, from Identifying Bright Spots in Appalachian Health: Statistical Analysis Executive Summary. PDA, Inc. (2018, July). Retrieved September 10, from Centers for Disease Control and Prevention Fast Facts Topics: Heart Disease COPD Cancer Depression Teen Pregnancy Suicide in Rural America Child Health Opioid Overdose Opioid Prescription Guidelines:
Health Disparities in WV and the WVU Health Disparities Program. Stephenie K. Kennedy, EdD 12/1/2016
 Health Disparities in WV and the WVU Health Disparities Program Stephenie K. Kennedy, EdD 12/1/2016 Health Disparities Inequalities in the prevalence, morbidity, mortality, or survival rates in a given
HealtheCNY Indicator List by Data Source
 American Community Survey 23 Adults with Health Insurance Children Living Below Poverty Level Children with Health Insurance Families Living Below Poverty Level Homeowner Vacancy Rate Homeownership Households
Health of the City & Community Health Improvement Planning. Raynard Washington, PhD, MPH Chief Epidemiologist
 Health of the City & Community Health Improvement Planning Raynard Washington, PhD, MPH Chief Epidemiologist What is the Community Health Assessment (CHA)? An annual assessment of population health in
County Health Rankings Baldwin County 2016 Graphics of County Health Rankings Include All Counties In the North Central Health District
 Health Rankings Baldwin 2016 Graphics of Health Rankings Include All Counties In the North Central Health District Public Health for Middle Georgia Serving Baldwin, Bibb, Crawford, Hancock, Houston, Jasper,
County Health Rankings Monroe County 2016
 Health Rankings Monroe 2016 Graphics of Health Rankings Include All Counties In the North Central Health District Public Health for Middle Georgia Serving Baldwin, Bibb, Crawford, Hancock, Houston, Jasper,
Community Health Needs Assessment
 Community Health Needs Assessment Scott County, Missouri This assessment will identify the health needs of the residents of Scott County, Missouri, and those needs will be prioritized and recommendations
2014 Butte County BUTTE COUNTY COMMUNITY HEALTH ASSESSMENT
 2014 Butte County BUTTE COUNTY COMMUNITY HEALTH ASSESSMENT EXECUTIVE SUMMARY 2015 2017 EXECUTIVE SUMMARY TOGETHER WE CAN! HEALTHY LIVING IN BUTTE COUNTY Hundreds of local agencies and community members
2016 Collier County Florida Health Assessment Executive Summary
 2016 Florida Health Assessment Executive Summary Prepared by: The Health Planning Council of Southwest Florida, Inc. www.hpcswf.com Executive Summary To access the report in its entirety, visit http://www.hpcswf.com/health-planning/health-planningprojects/.
Progress Tracker. Photo - https://www.healthypeople.gov/
 Progress Tracker Healthy People provides a framework for prevention for communities in the U.S. Healthy People 2020 is a comprehensive set of key disease prevention and health promotion objectives. The
Redington-Fairview General Hospital Community Health Needs Assessment Annual Report
 Redington-Fairview General Hospital 2017 Community Health Needs Assessment Annual Report Original Community Needs Assessment: November 2007 Updated: January 2010; April 2012, September ; August 2015; July
An APA Report: Executive Summary of The Behavioral Health Care Needs of Rural Women
 1 Executive Summary Of The Behavioral Health Care Needs of Rural Women The Report Of The Rural Women s Work Group and the Committee on Rural Health Of the American Psychological Association Full Report
Community Health Needs Assessment Centra Southside Medical Center
 Community Health Needs Assessment Centra Southside Medical Center 2017-2019 Healthy People 2020 Healthy People provides a framework for prevention for communities in the U.S. Healthy People 2020 is a comprehensive
Community Health Needs Assessment PREPARED BY
 Community Health Needs Assessment PREPARED BY DEAR COMMUNITY PARTNERS We all know that good health is essential for a productive and thriving community. Furthermore, we understand that conditions in the
Jackson County Community Health Assessment
 2016 Jackson County Community Health Assessment With Collaboration from Black River Memorial Hospital and Jackson County Public Health Wisconsin Population Health Institute Table of Contents Structure
FORM 9 NEED FOR ASSISTANCE (NFA) WORKSHEET (REQUIRED)
 WORKSHEET (REQUIRED)") FORM 9 NEED FOR ASSISTANCE (NFA) WORKSHEET (REQUIRED) The worksheet is presented in three sections: Core Barriers, Core Health Indicators, and Other Health and Access Indicators. Refer to the Data Resource
FORM 9 NEED FOR ASSISTANCE (NFA) WORKSHEET (REQUIRED) The worksheet is presented in three sections: Core Barriers, Core Health Indicators, and Other Health and Access Indicators. Refer to the Data Resource
The Health of the Santa Barbara County Community
 The Health of the Santa Barbara County Community WHAT IS OUR COMMUNITY S CURRENT HEALTH? WHAT ARE PRIORITY AREAS TO FOCUS FOR IMPROVEMENT? HOW CAN WE IMPROVE HEALTH IN OUR COMMUNITY? What is Health? Health
Pre-Conception & Pregnancy in Ohio
 Pre-Conception & Pregnancy in Ohio Elizabeth Conrey, PhD 1 January 217 1 State Maternal and Child Health Epidemiologist, Ohio Department of Health EXECUTIVE SUMMARY The primary objective of the analyses
PHACS County Profile Report for Searcy County. Presented by: Arkansas Center for Health Disparities and Arkansas Prevention Research Center
 PHACS County Profile Report for Searcy County Presented by: Arkansas Center for Health Disparities and Arkansas Prevention Research Center Contents Introduction... Page 2 Demographics...Page 3 Social Environment
Community Health Status Assessment
 Community Health Status Assessment EXECUTIVE SUMMARY The Community Health Status Assessment (CHSA) is one of four assessments completed as part of the 2015-2016 Lane County Community Health Needs Assessment
HOSPITAL AUTHORITY OF VALDOSTA & LOWNDES COUNTY, GEORGIA COMMUNITY HEALTH NEEDS ASSESSMENT SGMC LANIER CAMPUS
 HOSPITAL AUTHORITY OF VALDOSTA & LOWNDES COUNTY, GEORGIA COMMUNITY HEALTH NEEDS ASSESSMENT SGMC LANIER CAMPUS July 16, 2015 DRAFT Allison McCarthy Principal 70 Old Field Road, Plymouth, MA 02360 Tel/Fax:
Health Profile Chartbook 2016 Kalkaska County
 Health Profile Chartbook 2016 Kalkaska County 2016 Chartbooks The 2016 Chartbooks provide a snapshot of the health status of the District Health Department #10 jurisdiction. Information is presented by
Health Profile Chartbook 2016 Mecosta County
 Health Profile Chartbook 2016 Mecosta County 2016 Chartbooks The 2016 Chartbooks provide a snapshot of the health status of the District Health Department #10 jurisdiction. Information is presented by
2016 PRC Community Health Needs Assessment
 2016 PRC Community Health Needs Assessment Staunton City, Waynesboro City, and Augusta County, Virginia Prepared for: Augusta Health By Professional Research Consultants, Inc. The PRC Community Health
2014 Edition RHODE ISLAND
 214 RHODE ISLAND America's Health Rankings is the longest running comparative health index of states. It uses measures of behavior, community and environment, policy, clinical care, and health outcomes
ISSUE BRIEF: ACCESS TO HEALTH CARE Crawford County
 ISSUE BRIEF: ACCESS TO HEALTH CARE Access to primary care providers and medical insurance Improve opportunity for screenings and preventive services Prevent health problems Find problems in early stages
Baseline Health Data Report: Cambria and Somerset Counties, Pennsylvania
 Baseline Health Data Report: Cambria and Somerset Counties, Pennsylvania 2017 2018 Page 1 Table of Contents Executive Summary.4 Demographic and Economic Characteristics 6 Race and Ethnicity (US Census,
Northwest Metro Healthy Student Partnership Accountable Communities for Health Grant. February 12, 2015
 Northwest Metro Healthy Student Partnership Accountable Communities for Health Grant February 12, 2015 Factors Influencing Health and Education! Healthy communities and a healthy environment are critical
Brant County Community Health Status Report: 2001 OVERVIEW
 Brant County Community Health Status Report: 2001 OVERVIEW Brantford County of Brant Brant County Health Unit and Grand River District Health Council April 2001 Brant County Community Health Status Report:
Community Health Priority: Alcohol & Other Drug Misuse and Abuse
 Alcohol & Other Drug Misuse and Abuse Melissa Dotter, MS Drug Free Communities Coordinator 715.261.1962 melissa.dotter@co.marathon.wi.us Creating a culture in communities where alcohol is used responsibly
Lincoln County. Community Health Assessment
 Community Health Assessment Contents Acknowledgements 1 Introduction 2 Key Informant Health Survey 3 Community Health Data 7 Demographics 8 Substance Abuse 10 Mental Health and Trauma 11 Chronic Disease
RURAL HEALTH CARE. Lanis L. Hicks Professor Department of Health Management and Informatics. October 9, 2002
 RURAL HEALTH CARE Lanis L. Hicks Professor Department of Health Management and Informatics October 9, 2002 URBANIZATION LEVELS DEFINED LARGE CENTRAL METRO Counties in large metropolitan areas (1 million
Looking Toward State Health Assessment.
 CONNECTICUT DEPARTMENT OF PUBLIC HEALTH Policy, Planning and Analysis. Looking Toward 2000 - State Health Assessment. Table of Contents Glossary Maps Appendices Publications Public Health Code PP&A Main
OLDER ADULTS. Persons 65 or older
 Persons 65 or older Gender 19.7 million women 13.5 million men 146 women per 100 men By 2030 the number of older Americans will have more that doubled to 70 million or one in every five Americans Marital
DEPRESSION: THE INVISIBLE CULPRIT
 DEPRESSION: THE INVISIBLE CULPRIT A depressive disorder 1 is an illness that involves the body, mood, and thoughts. It differs quantitatively and qualitatively from normal sadness or grief. Clinically,
BACKGROUND WILSON COUNTY SOTCH REPORT DEMOGRAPHICS (Source: Commerce Economic Development)
") WILSON COUNTY SOTCH REPORT 2012 BACKGROUND The 2012 State of The County Health Report is a review of community health priorities that were established during the last Community Health Assessment (CHA)
WILSON COUNTY SOTCH REPORT 2012 BACKGROUND The 2012 State of The County Health Report is a review of community health priorities that were established during the last Community Health Assessment (CHA)
2014 Edition TENNESSEE
 214 TENNESSEE America's Health Rankings is the longest running comparative health index of states. It uses measures of behavior, community and environment, policy, clinical care, and health outcomes to
Improve Health Status and Reduce Health Disparities
 Improve Health Status and Reduce Health Disparities Indicator Prevention Agenda 2017 Objective NYS NYS excl. NYC (Upstate) Capital Region (6 ) Summary Albany Schenectady Rensselaer YEAR Rate Rate & # Rate
Consolidated Project Information Project 4.a.ii Substance Abuse Prevention and Identification Initiative
 Consolidated Project Information Project 4.a.ii Substance Abuse Prevention and Identification Initiative Contents 4.a.ii Prevent Substance Abuse and Other Mental Emotional Disorders (Focus Area 2)... 3
Consolidated Project Information Project 4.b.ii Access to Chronic Disease Preventive Care Initiative
 Consolidated Project Information Project 4.b.ii Access to Chronic Disease Preventive Care Initiative Contents 4.b.ii Increase Access to High Quality Chronic Disease Preventative Care and Management in
Graves County. Community Health Assessment Three Perspectives on Community Health
 Graves County Community Health Assessment Three Perspectives on Community Health Data Perspective Objective Statistics from National, State and Local Sources Organizational Perspective Community Health
2016 Value High percentage of hospital readmissions. High prevalence of falls $
 Metric Overall Rank.9 26 No 1 State Rank 14 14 Rank.627.1 17.174 Strengths percentage of dental visits Challenges prevalence of obesity Ready availability of homedelivered meals percentage of hospital
Walworth County Health Data Report. A summary of secondary data sources
 Walworth County Health Data Report A summary of secondary data sources 2016 This report was prepared by the Design, Analysis, and Evaluation team at the Center for Urban Population Health. Carrie Stehman,
The Relationship of Adverse Childhood Experiences to Adult Health Status
 The Relationship of Adverse Childhood Experiences to Adult Health Status Presentation to MCAH Committee December2, 21 Edwin Ferran Director of Learning and Innovation Community Action Partnership of Sonoma
HSC Statistical Brief No. 30 Adverse Childhood Experiences
 HSC Statistical Brief No. 30 Adverse Childhood Experiences Adverse Childhood Experiences, or ACE, have been extensively researched and found to be associated with poor health and well-being during adulthood.
Public Health. In 2006, 23% of births were to mothers between the ages of 15 and 19. This is a decline from 25% in 2001.
 Public Health In 2006, 23% of births were to mothers between the ages of 15 and 19. This is a decline from 25% in 2001. Eleven percent of children born in 2006 had a low birth weight (< 2,500 grams or
In Health Matters, Place Matters - The Health Opportunity Index (HOI) Virginia Department of Health Office of Health Equity
 Virginia Department of Health Office of Health Equity") In Health Matters, Place Matters - The Health Opportunity Index (HOI) Virginia Department of Health Office of Health Equity 1 Identifying the Problem America s Health Rankings United Health Foundation
In Health Matters, Place Matters - The Health Opportunity Index (HOI) Virginia Department of Health Office of Health Equity 1 Identifying the Problem America s Health Rankings United Health Foundation
Tuscarawas County Health Department
 Tuscarawas County Health Department Community Health Needs Assessment 214 TUSCARAWAS COUNTY HEALTH DEPARTMENT Community Health Needs Assessment 214 Assessment Commissioned by: Dr. James Hubert D.O Health
Racial disparities in health outcomes and factors that affect health: Findings from the 2011 County Health Rankings
 Racial disparities in health outcomes and factors that affect health: Findings from the 2011 County Health Rankings Author: Nathan R. Jones, PhD University of Wisconsin Carbone Cancer Center Introduction
Community Health Needs Assessment
 Community Health Needs Assessment Gratiot County Community Health Assessment Community Health Assessment Data Sources Primary Data (new data collected first-hand) Community Opinion Survey Provider Opinion
Baptist Health Jacksonville Community Health Needs Assessment Implementation Plans. Health Disparities. Preventive Health Care.
 Baptist Health Jacksonville Community Health Needs Assessment Implementation Plans Health Disparities Infant Mortality Prostate Cancer Heart Disease and Stroke Hypertension Diabetes Behavioral Health Preventive
Worcester County Report Card 2012
 Worcester County Report Card 2012 W H Deborah Goeller, R.N., M.S. Health Officer Introduction This community health 2012 Report Card is the fourth published by the Worcester County Health Department. There
2017 State Of The County Health Report Jones County, NC
 217 State Of The County Health Report Jones County, NC Promoting sound health policies, preventing and controlling the spread of disease, and safeguarding the integrity of the environment for all citizens
2017 PRC Community Health Needs Assessment
 2017 PRC Community Needs Assessment Obici care Foundation Service Area Western Tidewater, Virginia Prepared for: OBICI HEALTHCARE FOUNDATION By Professional Research Consultants, Inc. The PRC Community
COMMUNITY HEALTH NEEDS ASSESSMENT AND IMPLEMENATION PLAN JUNE 2016
 COMMUNITY HEALTH NEEDS ASSESSMENT AND IMPLEMENATION PLAN JUNE 2016 is, and has been an active member of the Healthy Blair County Coalition. Representatives of have been members of the Steering Committee,
Wellness County Profile ROGERS
 Wellness County Profile 2018 ROGERS OKLAHOMA MAPS This image cannot currently be displayed. ROGERS Insurance Coverage Population 91,766 Unemployment Rate (2013-2015) High School Dropouts: Class
Wellness County Profile STEPHENS
 Wellness County Profile 2018 STEPHENS OKLAHOMA MAPS STEPHENS Insurance Coverage Population 44,090 Unemployment Rate (2013-2015) High School Dropouts: Class of 16 Uninsured Insured 15.9% Stephens
Substance Abuse. Among current drinkers, men in nonmetro areas consume 5 or more drinks in one day than those in metro areas (56% vs.
 Framing the Issue Substance Abuse Among current drinkers, men in nonmetro areas consume 5 or more drinks in one day than those in metro areas (56% vs. 48-52%) Periodic heavy drinking more common among
Wellness County Profile JOHNSTON
 Wellness County Profile 2018 JOHNSTON OKLAHOMA MAPS JOHNSTON Insurance Coverage Population 11,087 Unemployment Rate (2013-2015) High School Dropouts: Class of 16 Uninsured Insured 19.1% Johnston
Wellness County Profile CRAIG
 Wellness County Profile 2018 CRAIG OKLAHOMA MAPS CRAIG Insurance Coverage Population 14,625 Unemployment Rate (2013-2015) High School Dropouts: Class of 16 Uninsured Insured 18.1% Craig 5.6
Ranked in the top 10% in: -Low percent of adults reporting fair or poor health
 Marin County ranked in the top 5% in: - Premature death rate - Adults self reported health -Mentally unhealthy days - Adult obesity - Teen birth rate - Uninsured adults - Primary care physicians per capita
Wellness County Profile GARFIELD
 Wellness County Profile 2018 GARFIELD OKLAHOMA MAPS GARFIELD Insurance Coverage Population 62,603 Unemployment Rate (2013-2015) High School Dropouts: Class of 16 Uninsured Insured 16.5% Garfield
Wellness County Profile GARVIN
 Wellness County Profile 2018 GARVIN OKLAHOMA MAPS GARVIN Insurance Coverage Population 27,838 Unemployment Rate (2013-2015) High School Dropouts: Class of 16 Uninsured Insured 16.7% Garvin
Wellness County Profile BECKHAM
 Wellness County Profile 2018 BECKHAM OKLAHOMA MAPS BECKHAM Insurance Coverage Population 22,519 Unemployment Rate (2013-2015) High School Dropouts: Class of 16 Uninsured Insured 15.2% Beckham
Wellness County Profile SEMINOLE
 Wellness County Profile 2018 SEMINOLE OKLAHOMA MAPS SEMINOLE Insurance Coverage Population 25,207 Unemployment Rate (2013-2015) High School Dropouts: Class of 16 Uninsured Insured 18.9% Seminole
Nutrition and Physical Activity
 Nutrition and Physical Activity Lifestyle choices made early in life have a significant impact on the patterns of chronic disease developed in adulthood. In the U.S., poor diet and physical inactivity
San Diego County Health Briefs North Coastal Region
 Non-Communicable Disease This brief contains 2009 chronic disease health data for the of San Diego County. Data are provided from the Community Health Statistics Unit and the 2009 California Health Interview
Community Health Status Assessment: High Level Summary
 Community Health Status Assessment: High Level Summary This summary provides a general overview of Community Health Status Assessment (CHSA) results as part of the Health Improvement Partnership (HIP-C)
Wellness County Profile SEQUOYAH
 Wellness County Profile 2018 SEQUOYAH OKLAHOMA MAPS SEQUOYAH Insurance Coverage Population 41,294 Unemployment Rate (2013-2015) High School Dropouts: Class of 16 Uninsured Insured 18.1% Sequoyah
Wellness County Profile PAYNE
 Wellness County Profile 2018 PAYNE OKLAHOMA MAPS PAYNE Insurance Coverage Population 81,131 Unemployment Rate (2013-2015) High School Dropouts: Class of 16 Uninsured Insured 15.6% Payne 3.9
ALACHUA COUNTY COMMUNITY HEALTH ASSESSMENT
 ALACHUA COUNTY COMMUNITY HEALTH ASSESSMENT JUNE 2016 This page intentionally left blank. ALACHUA COUNTY COMMUNITY HEALTH ASSESSMENT (CHA) Contents Executive Summary 4 The Alachua Community Health Assessment
Mission: To protect and improve the health and well-being of all Arkansans IMPACT OF POTENTIAL CUTS TO FEDERAL FUNDING
 nathaniel.smith@arkansas.gov (501) 1-00 ABOUT STATE PUBLIC HEALTH State health agencies are working across the country to actively protect the public s health, prevent avoidable diseases and conditions,
LINCOLN COUNTY HEALTH PROFILE Maine Shared Community Health Needs Assessment
 LINCOLN COUNTY HEALTH PROFILE 2018 Maine Shared Community Health Needs Assessment TABLE OF CONTENTS Introduction... 1 How to Read this Document... 3 Demographics... 5 Past Maine Statewide Priorities...
Wellness County Profile MCCLAIN
 Wellness County Profile 2018 MCCLAIN OKLAHOMA MAPS McCLAIN Insurance Coverage Population 38,682 Unemployment Rate (2013-2015) High School Dropouts: Class of 16 Uninsured Insured 15.3% McClain
What nurses need to know about Trauma-Informed Care
 What nurses need to know about Trauma-Informed Care Define trauma-informed care Identify how to assess for trauma Tap in to resources for these patients and their families Kaiser Permanente,1995-1997
Storytelling the Opioid Epidemic: Using Media for Impact
 Storytelling the Opioid Epidemic: Using Media for Impact 2018 NPN Conference Boston, MA Maureen Mo De Nieva-Marsh, BA RxSafe Marin, Senior Program Coordinator County Health Rankings Comparison to
Prepared by Southern Illinois University School of Medicine s Center for Clinical Research And Office of Community Health and Service
 Hospital Sisters Health System Community Health Needs Assessment (FY2015-FY2018) Quantitative and Secondary Data Analysis Report For St. Anthony s Hospital Effingham, Prepared by Southern University School
CHRONIC DISEASE PREVALENCE AMONG ADULTS IN OHIO
 OHIO MEDICAID ASSESSMENT SURVEY 2012 Taking the pulse of health in Ohio CHRONIC DISEASE PREVALENCE AMONG ADULTS IN OHIO Amy Ferketich, PhD Ling Wang, MPH The Ohio State University College of Public Health
Community Needs Analysis Report
 Grampians Medicare Local Community Needs Analysis Report Summary October 2013 2 Contents Introduction 3 Snapshot of results 4 Stakeholder feedback 5 Health status of residents 6 Health behaviour of residents
Factual Information Contained in this Report: PURPOSE. Health Perceptions. Health Insurance Coverage. Health Care Access. Preventive Health Care
 Factual Information Contained in this Report: Health Perceptions Health Insurance Coverage Health Care Access Preventive Health Care Maternal and Child Health Alcohol, Tobacco, and Other Drug Use PURPOSE
COMMUNITY PARTNERS MEETING
 PUBLIC HEALTH & SYSTEMS IN ACTION COMMUNITY PARTNERS MEETING Presenter: Amy Fagan, Assistant Director of Health Date: February 23, 2017 HEALTH DISTRICT VISION HEALTHY PEOPLE, HEALTHY COMMUNITY HEALTH COALITION
HEALTH DISPARITIES AMONG ADULTS IN OHIO
 OHIO MEDICAID ASSESSMENT SURVEY 2012 Taking the pulse of health in Ohio HEALTH DISPARITIES AMONG ADULTS IN OHIO Amy K. Ferketich, PhD 1 Ling Wang, MPH 1 Timothy R. Sahr, MPH, MA 2 1The Ohio State University
HEALTH OUTCOMES Morbidity
 HEALTH OUTCOMES Morbidity Mental Health Multiple Chronic Conditions Senior Tsunami Diabetes Hypertension Chronic Obstructive Pulmonary Disease Asthma Overweight/Obesity Preterm Births 33 SENIOR TSUNAMI
2016 Community Health Needs Assessment and Wellness Plan
 2016 Community Health Needs Assessment and Wellness Plan Washington County Hospital and Medical Group In collaboration with Washington County Health Department and the Community IPLAN Team A Collaborative
Dental Care Remains the No. 1 Unmet Health Care Need for Children and Low-Income Adults
 Oral Health and Access to Dental Care for Ohioans, 2007 Dental Care Remains the No. 1 Unmet Health Care Need for Children and Low-Income Adults Oral Health and Access to Dental Care for Ohioans, 2007
Family Health Centers of Southwest Florida Community Health Assessment Appendix B: Charlotte County Data
 2014 Community Health Assessment Appendix B: Charlotte County Data Prepared by: The Health Planning Council of Southwest Florida, Inc. www.hpcswf.com Table of Contents Charlotte County Demographic and
Vanderbilt Institute for Medicine and Public Health Women s Health Research Tennessee Women s Health Report Card TENNESSEE DEPARTMENT OF HEALTH
 Vanderbilt Institute for Medicine and Public Health Women s Health Research 2009 Tennessee Women s Health Report Card TENNESSEE DEPARTMENT OF HEALTH 2009 Tennessee Women s Health Report Card Rationale
COMMUNITY HEALTH NEEDS ASSESSMENT SOUTH GEORGIA MEDICAL CENTER BERRIEN CAMPUS
 COMMUNITY HEALTH NEEDS ASSESSMENT SOUTH GEORGIA MEDICAL CENTER BERRIEN CAMPUS July 14, 2014 DRAFT Allison McCarthy MBA Principal 70 Old Field Road Plymouth, MA 02360 Telephone/Fax: (508) 394-8098 amccarthy@barlowmccarthy.com
Tri-County Health Assessment Collaborative 2013 Community Health Needs Assessment Research Review
 Tri- Health Assessment Collaborative 2013 Community Health Needs Assessment Research Review The Tri- Collaborative Three counties Five health systems; 12 hospitals Three health departments Countless community
Baptist Health Nassau Community Health Needs Assessment Priorities Implementation Plans
 Baptist Health Nassau Community Health Needs Assessment Priorities Implementation Plans Health Disparities Heart Disease Stroke Hypertension Diabetes Adult Type II Preventive Health Care Smoking and Smokeless
STATE OF THE COUNTY HEALTH REPORT
 STATE OF THE COUNTY HEALTH REPORT 2015 Teresa C. Ellen, RN., MPH Health Director Matthew A. Hojatzadeh, MPH Public Health Educator II Wilson County Health Department 1801 Glendale Dr. SW Wilson, NC 27893
Slide 1. Slide 2. Slide 3. Ongoing Disparities in Rural Health. All-Cause Mortality: US vs. Appalachia
 Slide 1 Ongoing Disparities in Rural Health 1 Slide 2 Source: Singh and Siahpush, Widening Rural-Urban Disparities in Life Expectancy, U.S., 1969-2009. American Journal of Preventive Medicine, 2014; 46(2):e19-e29.
Report - Ward: Blythe; Solihull (Ward (2013)) Presentation map
) Presentation map") Presentation map PHE - Crown copyright and database rights 214, Ordnance Survey 16969 ONS Crown Copyright 214 1/17 Population Population by age group, 212 Population by age group, 212 aged under 16 (19.1
Presentation map PHE - Crown copyright and database rights 214, Ordnance Survey 16969 ONS Crown Copyright 214 1/17 Population Population by age group, 212 Population by age group, 212 aged under 16 (19.1
Special SEOW Report: Behavioral Health Among Women in Maine
 Special SEOW Report: Behavioral Health Among Women in Maine By Tim Diomede, MPPM 9.30.2015 State Epidemiological Outcomes Workgroup 1 Maine Data 2 Past month substance use among Maine high school students,
Clark County Community Health Status Assessment
 2012 Clark County Community Health Status Assessment Southern Nevada Health District Office of Epidemiology 5/29/2012 Authors Nancy Williams, MD, MPH Patricia Rowley, BS Contributors Brian Labus, MPH Zuwen
Oakwood Healthcare Community Health Needs Assessment Indicators
 POPULATION Sub-Category Education Socioeconomic Violence High School High School Dropouts Graduation Rate (Percent) Some College Births to Unmarried Women Children in Poverty Children in Singleparent Households
2018 Community Health Assessment
 2018 Community Health Assessment Community Health Status Assessment Linn County, IA Prepared by Amy Hockett, PhD, MPH, CHES Epidemiologist Linn County Public Health August 9, 2018 Community Health Status
Baptist Health Beaches Community Health Needs Assessment Priorities Implementation Plans
 Baptist Health Beaches Community Health Needs Assessment Priorities Implementation Plans Health Disparities Heart Disease Stroke Hypertension Diabetes Adult Type II Preventive Health Care Smoking and Smokeless
MARICOPA COUNTY COMMUNITY HEALTH ASSESSMENT. Maricopa County Board of Health July 23, 2012 Eileen Eisen-Cohen, PhD
 MARICOPA COUNTY COMMUNITY HEALTH ASSESSMENT Maricopa County Board of Health July 23, 2012 Eileen Eisen-Cohen, PhD 1 What? Why? We Are Here 2 Local Public Health System Faith Instit. Military Dentists Labs
Health System Members of the Milwaukee Health Care Partnership
 Health System Members of the Milwaukee Health Care Partnership Aurora Health Care Children s Hospital of Wisconsin Columbia St. Mary s Health System Froedtert Health Wheaton Franciscan Healthcare In Collaboration
Behavioral Health: Public Health Challenge Public Health Opportunity. Pamela S. Hyde, J.D. SAMHSA Administrator
 Behavioral Health: Public Health Challenge Public Health Opportunity Pamela S. Hyde, J.D. SAMHSA Administrator New Orleans, LA January 25, 2012 MAKING THE CASE 3 BEHAVIORAL HEALTH: AMERICA S #1 PUBLIC